
#12
12
30,188 views
235 Discussing
Hot
Latest

·
--
Bearish
#doge⚡ 📊📈
*DOGE Summary - Today Tuesday September 15, 2026*
_Last 6 hours_ 🐶
*Current Price*
- *$0.08244 USD* → in red
- *24h Change*: -1.64% to -2.00%
- *24h Range*: Max $0.08616 - $0.08603 | Min $0.08204 - $0.08228
- *Market Cap*: $12.99B - $14.45B. Rank #12
*Short Position*
Worse than BTC/ETH today. A memecoin with extra selling pressure due to ETF close and volume -29%.
*Strategy*: HOLD / Do not buy until confirmation. Avoid leverage. If it holds $0.082 with volume → possible bounce to $0.086. If it loses $0.0788 → look for $0.075 as an entry. Bad week for DOGE: -7% in 7 days.
{spot}(DOGEUSDT)
#doge⚡ 📊📈
*DOGE Summary - Today Tuesday September 15, 2026*
_Last 6 hours_ 🐶
*Current Price*
- *$0.08244 USD* → in red
- *24h Change*: -1.64% to -2.00%
- *24h Range*: Max $0.08616 - $0.08603 | Min $0.08204 - $0.08228
- *Market Cap*: $12.99B - $14.45B. Rank #12
*Short Position*
Worse than BTC/ETH today. A memecoin with extra selling pressure due to ETF close and volume -29%.
*Strategy*: HOLD / Do not buy until confirmation. Avoid leverage. If it holds $0.082 with volume → possible bounce to $0.086. If it loses $0.0788 → look for $0.075 as an entry. Bad week for DOGE: -7% in 7 days.
*DOGE Summary - Today Tuesday September 15, 2026*
_Last 6 hours_ 🐶
*Current Price*
- *$0.08244 USD* → in red
- *24h Change*: -1.64% to -2.00%
- *24h Range*: Max $0.08616 - $0.08603 | Min $0.08204 - $0.08228
- *Market Cap*: $12.99B - $14.45B. Rank #12
*Short Position*
Worse than BTC/ETH today. A memecoin with extra selling pressure due to ETF close and volume -29%.
*Strategy*: HOLD / Do not buy until confirmation. Avoid leverage. If it holds $0.082 with volume → possible bounce to $0.086. If it loses $0.0788 → look for $0.075 as an entry. Bad week for DOGE: -7% in 7 days.

1
72

·
--
$BR This wave is more like the bulls are withdrawing themselves, not the bears smashing hard.
On 15m: down 1.6%, volume is only 0.96x, and the volatility isn’t big. But on the OI side: 15m -1.58%, 1h -3.65%. Nominally, it shrank by nearly 1 million USDT. Price is down (+), while open interest is also down—typical of longs deleveraging, stopping out, or voluntarily shrinking positions. Active trades are down -9.8%, buy-sell ratio is 0.82. There is selling pressure, but it’s not the kind that’s out of control.
Over 24h: turnover is 552M, and the anomalous percentile in the pool is 78.4%. The nominal change across the whole pool is #12, indicating it’s not just a small move. Structurally, however, it looks more like positions are being cleared out rather than new shorts coming in to take over. In this kind of setup, chasing shorts can easily get hit by a rebound, and trying to bottom-fish also needs to wait for the OI to stabilize.
Let’s first see whether it can wash the leverage clean before anything else.
$BR This wave is more like the bulls are withdrawing themselves, not the bears smashing hard.
On 15m: down 1.6%, volume is only 0.96x, and the volatility isn’t big. But on the OI side: 15m -1.58%, 1h -3.65%. Nominally, it shrank by nearly 1 million USDT. Price is down (+), while open interest is also down—typical of longs deleveraging, stopping out, or voluntarily shrinking positions. Active trades are down -9.8%, buy-sell ratio is 0.82. There is selling pressure, but it’s not the kind that’s out of control.
Over 24h: turnover is 552M, and the anomalous percentile in the pool is 78.4%. The nominal change across the whole pool is #12, indicating it’s not just a small move. Structurally, however, it looks more like positions are being cleared out rather than new shorts coming in to take over. In this kind of setup, chasing shorts can easily get hit by a rebound, and trying to bottom-fish also needs to wait for the OI to stabilize.
Let’s first see whether it can wash the leverage clean before anything else.
On 15m: down 1.6%, volume is only 0.96x, and the volatility isn’t big. But on the OI side: 15m -1.58%, 1h -3.65%. Nominally, it shrank by nearly 1 million USDT. Price is down (+), while open interest is also down—typical of longs deleveraging, stopping out, or voluntarily shrinking positions. Active trades are down -9.8%, buy-sell ratio is 0.82. There is selling pressure, but it’s not the kind that’s out of control.
Over 24h: turnover is 552M, and the anomalous percentile in the pool is 78.4%. The nominal change across the whole pool is #12, indicating it’s not just a small move. Structurally, however, it looks more like positions are being cleared out rather than new shorts coming in to take over. In this kind of setup, chasing shorts can easily get hit by a rebound, and trying to bottom-fish also needs to wait for the OI to stabilize.
Let’s first see whether it can wash the leverage clean before anything else.
53

·
--
See translation
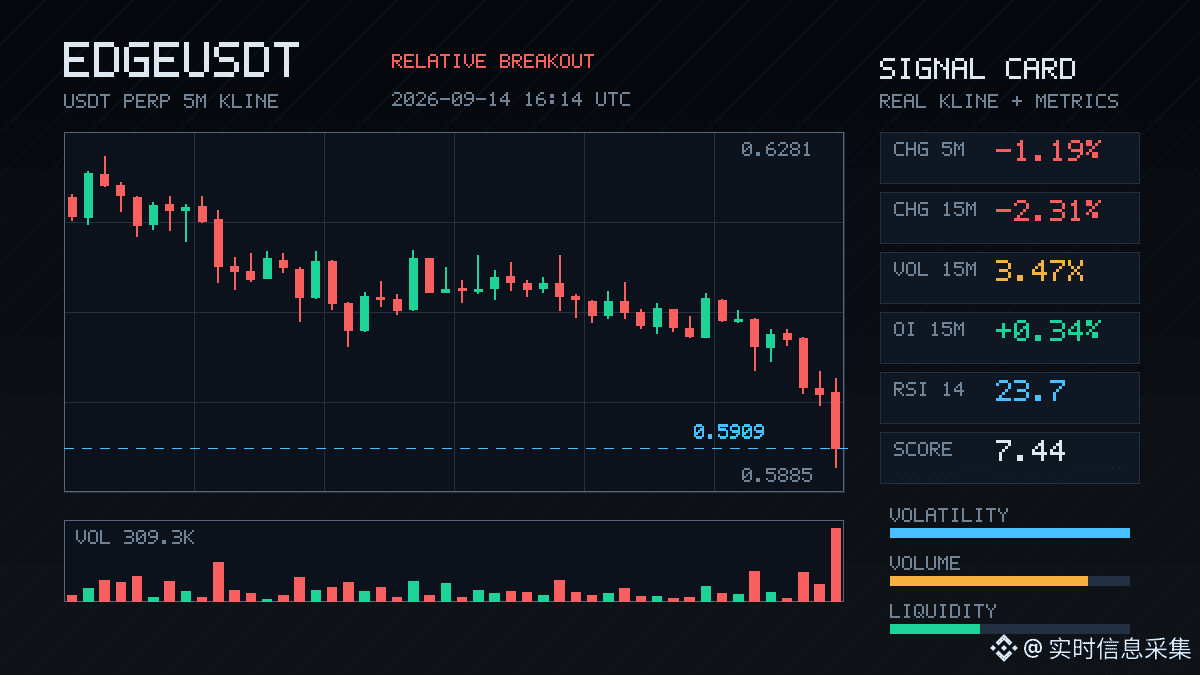
$EDGE 这根15m有点意思。
价格跌了2.31%,量直接打到3.47倍,波动Z 4.71,收盘跌破近20根5m的下沿。但OI没降——15m +0.34%,1h +0.21%,异常分位95.4%,全池排到#12。
不是说空头平仓那种跌,是新空在进场。
主动成交差-11.9%,买卖比0.79,卖压在走。名义变化是负的,-203K、-247K,说明整体池子在缩,但EDGE这边的OI还在往上顶,连续多个周期没断。
24h成交额才13.15M,深度一般,这种量比一出来价格容易被推着走。20根5m区间下沿刚破,如果继续延续,下面可能没什么承接。
盯着看是不是又一批杠杆空头在加。
$EDGE 这根15m有点意思。
价格跌了2.31%,量直接打到3.47倍,波动Z 4.71,收盘跌破近20根5m的下沿。但OI没降——15m +0.34%,1h +0.21%,异常分位95.4%,全池排到#12。
不是说空头平仓那种跌,是新空在进场。
主动成交差-11.9%,买卖比0.79,卖压在走。名义变化是负的,-203K、-247K,说明整体池子在缩,但EDGE这边的OI还在往上顶,连续多个周期没断。
24h成交额才13.15M,深度一般,这种量比一出来价格容易被推着走。20根5m区间下沿刚破,如果继续延续,下面可能没什么承接。
盯着看是不是又一批杠杆空头在加。
价格跌了2.31%,量直接打到3.47倍,波动Z 4.71,收盘跌破近20根5m的下沿。但OI没降——15m +0.34%,1h +0.21%,异常分位95.4%,全池排到#12。
不是说空头平仓那种跌,是新空在进场。
主动成交差-11.9%,买卖比0.79,卖压在走。名义变化是负的,-203K、-247K,说明整体池子在缩,但EDGE这边的OI还在往上顶,连续多个周期没断。
24h成交额才13.15M,深度一般,这种量比一出来价格容易被推着走。20根5m区间下沿刚破,如果继续延续,下面可能没什么承接。
盯着看是不是又一批杠杆空头在加。
2
·
--
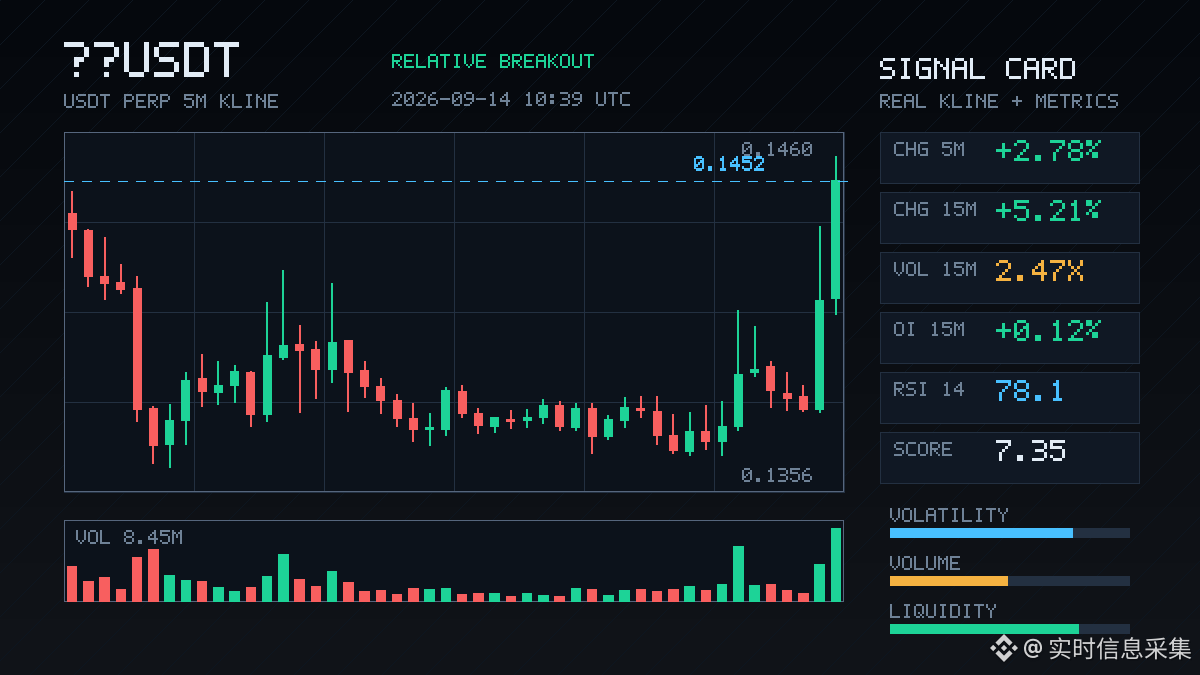
$Lobster, this last 15 minutes has something.
The price pushed up by more than 5 units, and the trading volume directly hit 2.47 times the normal level. Volatility (Z) reached 3.03—this isn’t just a normal wick; it’s a real breakout with clear volume. The closing price held above the upper edge of nearly 20 consecutive 5m K candles: active trade imbalance +15.3%, buy/sell ratio 1.36—buyers are pushing.
There’s something interesting on the OI side too: the 15m contract OI slightly increased by 0.12%, while nominal change was +3.01M; on the 1h dimension, OI is still negative at -0.49%. New leverage-long positions on the short cycle are coming in, but over a longer view it hasn’t reached the point of broad chasing longs. The OI abnormal percentile is 94.6%, with abnormal #12 in the whole pool and nominal change #5. This level itself indicates it’s already near an extreme zone.
In the last 24h, turnover is 224M, and the order book confirmation checks out. This structure looks more like fresh leverage driving it, not a one-off short-covering impulse. Next, we’ll see whether it can stabilize above the breakout level. If OI continues to rise in sync with price, this move might not be over yet. Conversely, if price chops sideways while OI starts to drop, be careful—short-term capital may be withdrawing.
Anyway, with an abnormal percentile of 94.6%, it’s already under the spotlight.
$Lobster, this last 15 minutes has something.
The price pushed up by more than 5 units, and the trading volume directly hit 2.47 times the normal level. Volatility (Z) reached 3.03—this isn’t just a normal wick; it’s a real breakout with clear volume. The closing price held above the upper edge of nearly 20 consecutive 5m K candles: active trade imbalance +15.3%, buy/sell ratio 1.36—buyers are pushing.
There’s something interesting on the OI side too: the 15m contract OI slightly increased by 0.12%, while nominal change was +3.01M; on the 1h dimension, OI is still negative at -0.49%. New leverage-long positions on the short cycle are coming in, but over a longer view it hasn’t reached the point of broad chasing longs. The OI abnormal percentile is 94.6%, with abnormal #12 in the whole pool and nominal change #5. This level itself indicates it’s already near an extreme zone.
In the last 24h, turnover is 224M, and the order book confirmation checks out. This structure looks more like fresh leverage driving it, not a one-off short-covering impulse. Next, we’ll see whether it can stabilize above the breakout level. If OI continues to rise in sync with price, this move might not be over yet. Conversely, if price chops sideways while OI starts to drop, be careful—short-term capital may be withdrawing.
Anyway, with an abnormal percentile of 94.6%, it’s already under the spotlight.
The price pushed up by more than 5 units, and the trading volume directly hit 2.47 times the normal level. Volatility (Z) reached 3.03—this isn’t just a normal wick; it’s a real breakout with clear volume. The closing price held above the upper edge of nearly 20 consecutive 5m K candles: active trade imbalance +15.3%, buy/sell ratio 1.36—buyers are pushing.
There’s something interesting on the OI side too: the 15m contract OI slightly increased by 0.12%, while nominal change was +3.01M; on the 1h dimension, OI is still negative at -0.49%. New leverage-long positions on the short cycle are coming in, but over a longer view it hasn’t reached the point of broad chasing longs. The OI abnormal percentile is 94.6%, with abnormal #12 in the whole pool and nominal change #5. This level itself indicates it’s already near an extreme zone.
In the last 24h, turnover is 224M, and the order book confirmation checks out. This structure looks more like fresh leverage driving it, not a one-off short-covering impulse. Next, we’ll see whether it can stabilize above the breakout level. If OI continues to rise in sync with price, this move might not be over yet. Conversely, if price chops sideways while OI starts to drop, be careful—short-term capital may be withdrawing.
Anyway, with an abnormal percentile of 94.6%, it’s already under the spotlight.
13

·
--
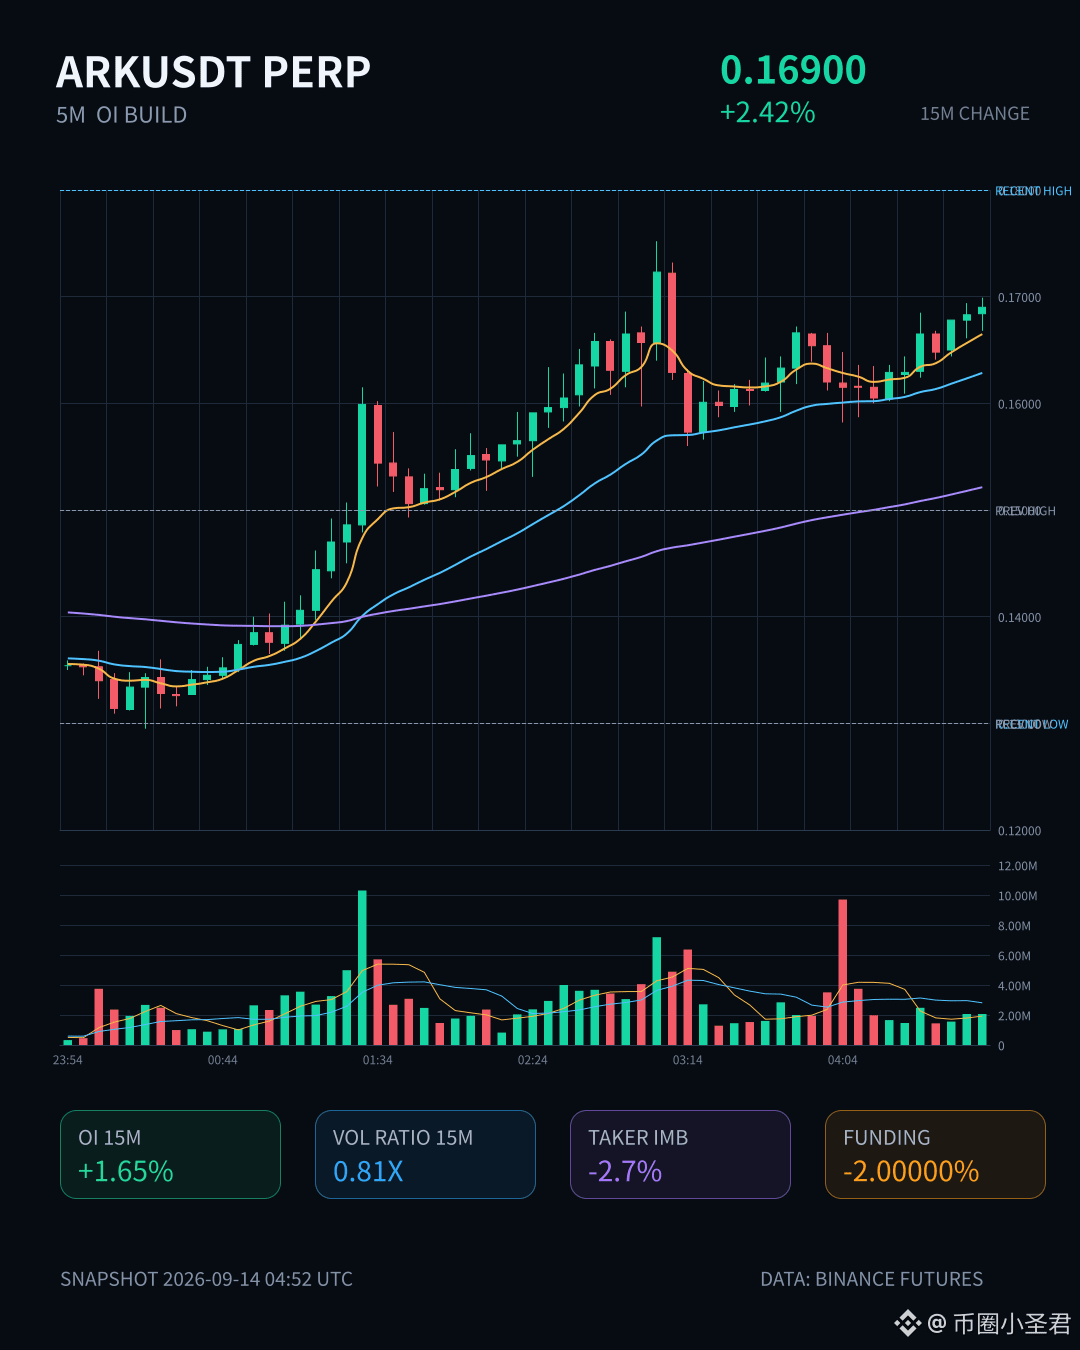
ARK This move is kind of interesting. The price rallied 2.42% over 15m; OI added 5.32% over the next hour. Notional 296K came in—clearly new leveraged longs pushing it, not that kind of “short covering” fake spike.
But the aggressive trade volume is down -2.7%, the buy/sell ratio is 0.95, and liquidity is only 0.81x. The price went up, yet the aggressive buy side didn’t really keep up, and the funding rate is still sitting in the high percentile recently. This structure is basically leveraged longs propping up a thin spot market. Once the funding rate starts to bite back, the pullback will happen fast.
With 88.1% of OI abnormal percentile positioned there, for the whole pool #12—not small noise. Either someone positioned ahead of time, or it’s a fragile structure built purely by stacking leverage. I won’t chase until I see spot volume pick up.
ARK This move is kind of interesting. The price rallied 2.42% over 15m; OI added 5.32% over the next hour. Notional 296K came in—clearly new leveraged longs pushing it, not that kind of “short covering” fake spike.
But the aggressive trade volume is down -2.7%, the buy/sell ratio is 0.95, and liquidity is only 0.81x. The price went up, yet the aggressive buy side didn’t really keep up, and the funding rate is still sitting in the high percentile recently. This structure is basically leveraged longs propping up a thin spot market. Once the funding rate starts to bite back, the pullback will happen fast.
With 88.1% of OI abnormal percentile positioned there, for the whole pool #12—not small noise. Either someone positioned ahead of time, or it’s a fragile structure built purely by stacking leverage. I won’t chase until I see spot volume pick up.
But the aggressive trade volume is down -2.7%, the buy/sell ratio is 0.95, and liquidity is only 0.81x. The price went up, yet the aggressive buy side didn’t really keep up, and the funding rate is still sitting in the high percentile recently. This structure is basically leveraged longs propping up a thin spot market. Once the funding rate starts to bite back, the pullback will happen fast.
With 88.1% of OI abnormal percentile positioned there, for the whole pool #12—not small noise. Either someone positioned ahead of time, or it’s a fragile structure built purely by stacking leverage. I won’t chase until I see spot volume pick up.
18
·
--
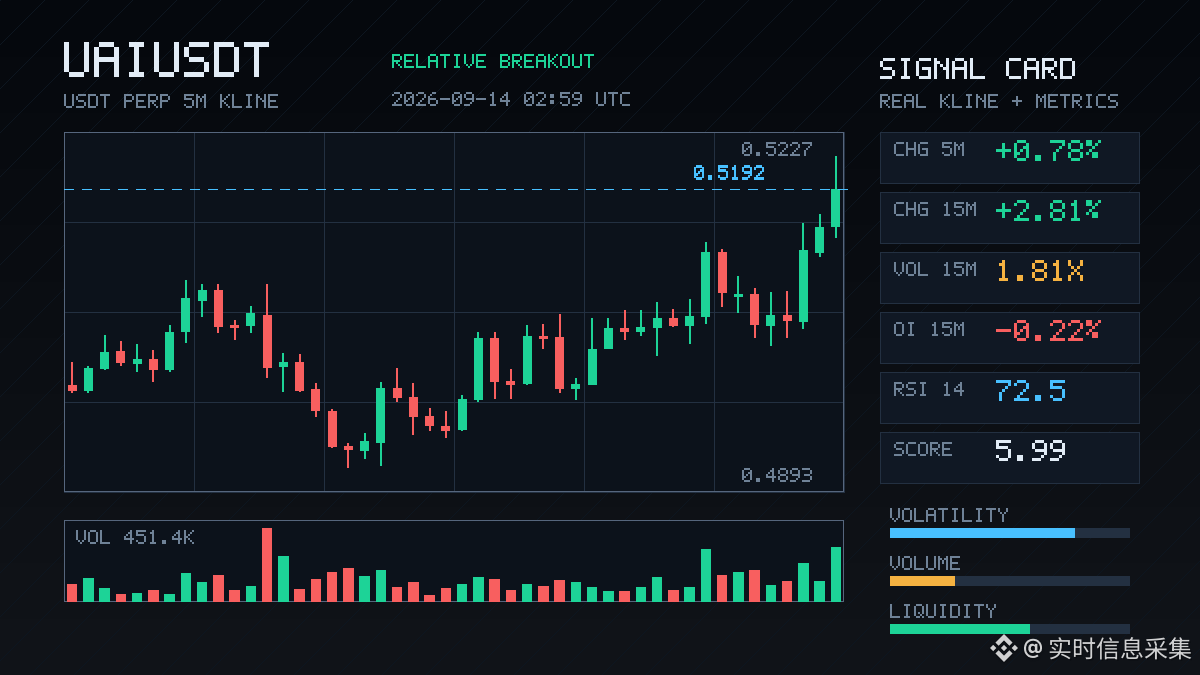
UAI, this move is kind of interesting.
In the 15m timeframe, it goes straight in and jumps 2.81%. Volume is up to 1.81x, with the aggressive buy-sell ratio at 1.65, and aggressive volume 24.6% lower. The price even breaks below the upper band of the last 20 5m candles. It looks pretty fierce, but take a glance at OI: the 15m contract is -0.22%, 1h is -0.31%. The price is up, yet open interest is actually dropping.
This kind of structure is either shorts being forced to cover, or someone is using the pump to reduce their position. The notional change is positive—506K. Within the whole pool, notional change ranks #12, with an extreme percentile of 85.1%, meaning it’s not that nobody’s trading; turnover is just accelerating.
Over 24h, traded value is 55.8M—not a huge pool. Depth confirmation also holds, and volume is higher than usual. The question is: after pulling this move, who will take the other side? Since OI doesn’t follow, I wouldn’t treat this breakout as a trend trigger. It looks more like a pulse of position covering.
First, see whether it can hold above the upper band. If it can’t, then it’s just a one-off wave.
UAI, this move is kind of interesting.
In the 15m timeframe, it goes straight in and jumps 2.81%. Volume is up to 1.81x, with the aggressive buy-sell ratio at 1.65, and aggressive volume 24.6% lower. The price even breaks below the upper band of the last 20 5m candles. It looks pretty fierce, but take a glance at OI: the 15m contract is -0.22%, 1h is -0.31%. The price is up, yet open interest is actually dropping.
This kind of structure is either shorts being forced to cover, or someone is using the pump to reduce their position. The notional change is positive—506K. Within the whole pool, notional change ranks #12, with an extreme percentile of 85.1%, meaning it’s not that nobody’s trading; turnover is just accelerating.
Over 24h, traded value is 55.8M—not a huge pool. Depth confirmation also holds, and volume is higher than usual. The question is: after pulling this move, who will take the other side? Since OI doesn’t follow, I wouldn’t treat this breakout as a trend trigger. It looks more like a pulse of position covering.
First, see whether it can hold above the upper band. If it can’t, then it’s just a one-off wave.
In the 15m timeframe, it goes straight in and jumps 2.81%. Volume is up to 1.81x, with the aggressive buy-sell ratio at 1.65, and aggressive volume 24.6% lower. The price even breaks below the upper band of the last 20 5m candles. It looks pretty fierce, but take a glance at OI: the 15m contract is -0.22%, 1h is -0.31%. The price is up, yet open interest is actually dropping.
This kind of structure is either shorts being forced to cover, or someone is using the pump to reduce their position. The notional change is positive—506K. Within the whole pool, notional change ranks #12, with an extreme percentile of 85.1%, meaning it’s not that nobody’s trading; turnover is just accelerating.
Over 24h, traded value is 55.8M—not a huge pool. Depth confirmation also holds, and volume is higher than usual. The question is: after pulling this move, who will take the other side? Since OI doesn’t follow, I wouldn’t treat this breakout as a trend trigger. It looks more like a pulse of position covering.
First, see whether it can hold above the upper band. If it can’t, then it’s just a one-off wave.
9
·
--
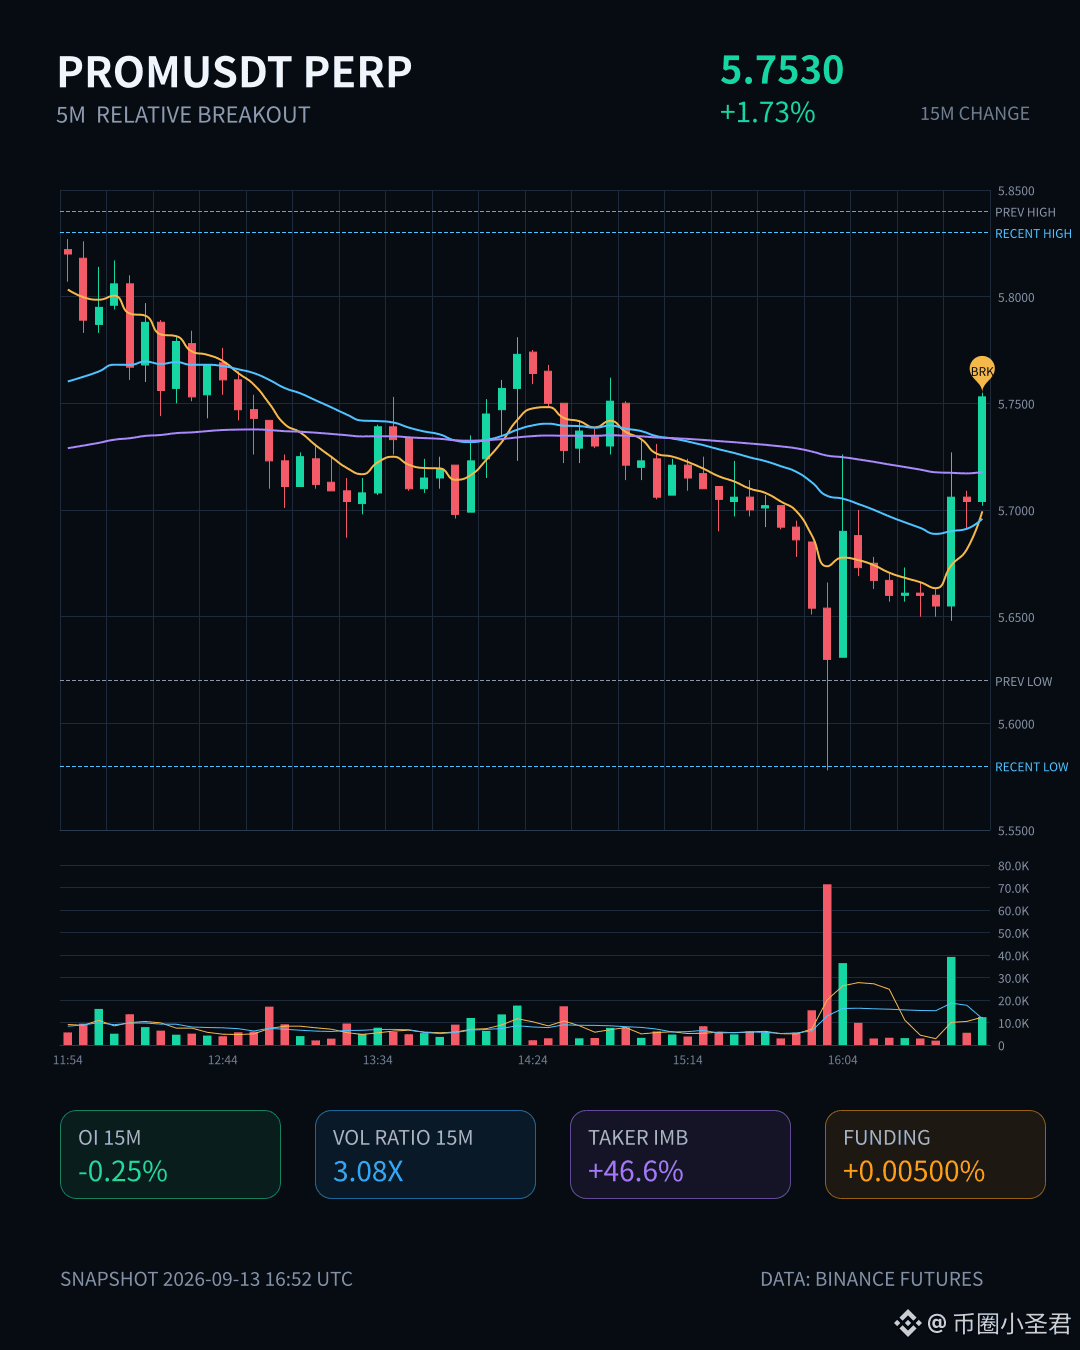
$PROM This 15m move came a bit suddenly—the volume directly hit 3 times the normal, with the buy-sell ratio at 2.74. The aggressive buy orders are clearly pushing.
What’s interesting, though, is that OI is dropping—15m -0.25%, 1h -0.34%. Price is rising while positions are decreasing; that’s a typical short-covering flow, not new longs entering. With this kind of structure, you have to see whether it can hold—otherwise, once the cover is done, there won’t be anyone to take over.
It broke through the top of the recent 5m range on the close for nearly 20 bars, and the funding rate is also in a high percentile lately. In the abnormal ranking for the whole pool, it’s #12; nominal change #18— not the most intense among that batch.
Over 24h, turnover is 25.79M; it’s not a huge volume, and if you push it up, it can just as quickly get dumped. Whether to chase it is up to you—I’ll observe first and see how strong the pullback is.
$PROM This 15m move came a bit suddenly—the volume directly hit 3 times the normal, with the buy-sell ratio at 2.74. The aggressive buy orders are clearly pushing.
What’s interesting, though, is that OI is dropping—15m -0.25%, 1h -0.34%. Price is rising while positions are decreasing; that’s a typical short-covering flow, not new longs entering. With this kind of structure, you have to see whether it can hold—otherwise, once the cover is done, there won’t be anyone to take over.
It broke through the top of the recent 5m range on the close for nearly 20 bars, and the funding rate is also in a high percentile lately. In the abnormal ranking for the whole pool, it’s #12; nominal change #18— not the most intense among that batch.
Over 24h, turnover is 25.79M; it’s not a huge volume, and if you push it up, it can just as quickly get dumped. Whether to chase it is up to you—I’ll observe first and see how strong the pullback is.
What’s interesting, though, is that OI is dropping—15m -0.25%, 1h -0.34%. Price is rising while positions are decreasing; that’s a typical short-covering flow, not new longs entering. With this kind of structure, you have to see whether it can hold—otherwise, once the cover is done, there won’t be anyone to take over.
It broke through the top of the recent 5m range on the close for nearly 20 bars, and the funding rate is also in a high percentile lately. In the abnormal ranking for the whole pool, it’s #12; nominal change #18— not the most intense among that batch.
Over 24h, turnover is 25.79M; it’s not a huge volume, and if you push it up, it can just as quickly get dumped. Whether to chase it is up to you—I’ll observe first and see how strong the pullback is.
39
·
--
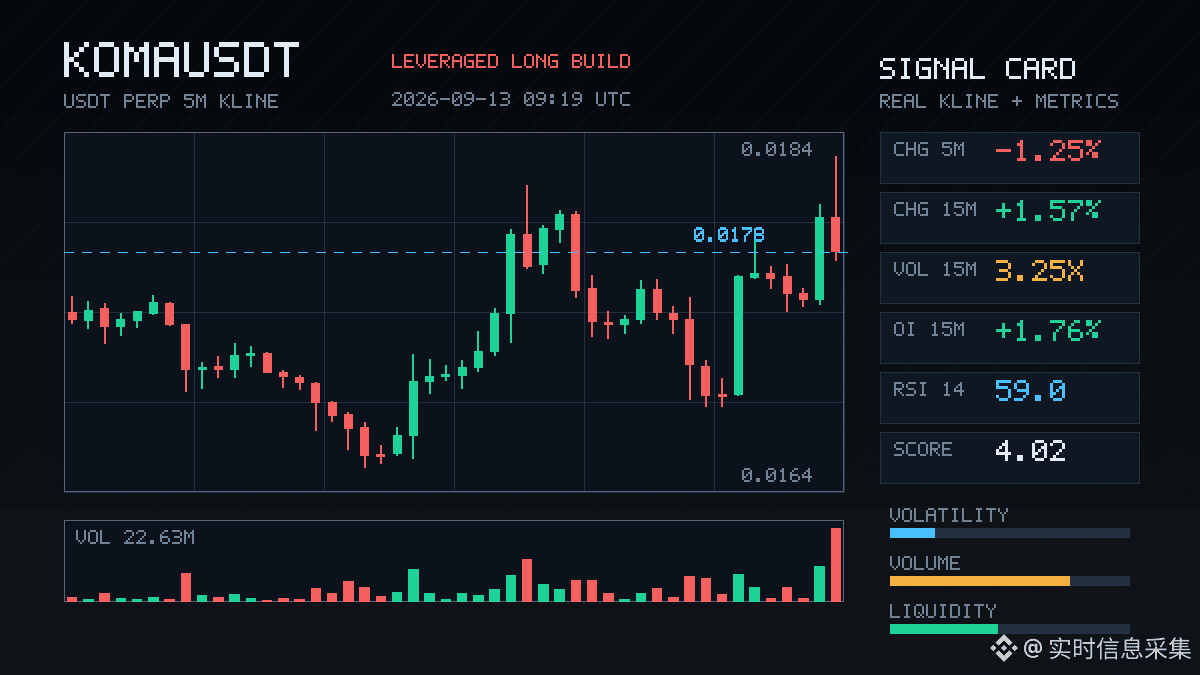
KOMA, this move is a bit interesting.
On the 15m timeframe it surged 1.57%, and volume directly jumped to 3.25x. OI: 15m +1.76%, 1h +0.81%. Notional change was 223K. Price is rising and positions are rising with it—this is the typical leveraged long getting in, not some kind of short covering fake pump.
The OI abnormal percentile is 92.3%—it ranks #12 across the whole pool. The notional change ranks #23, and it isn’t just a single spike; it’s been continuing across several consecutive periods. Trading volume is also higher than usual. The buy/sell ratio of active orders is 1.07, a 3.6% difference—buys are slightly dominant.
24h trading value is 21.77M. The market cap isn’t large, so even this incremental increase can pry open volatility. With OI crowding at the 92nd percentile, longs are piled in pretty heavily—what happens next is either they keep pushing, or this becomes fuel for a squeeze bubble-pop.
Keep an eye on it first—don’t rush to chase the breakout.
KOMA, this move is a bit interesting.
On the 15m timeframe it surged 1.57%, and volume directly jumped to 3.25x. OI: 15m +1.76%, 1h +0.81%. Notional change was 223K. Price is rising and positions are rising with it—this is the typical leveraged long getting in, not some kind of short covering fake pump.
The OI abnormal percentile is 92.3%—it ranks #12 across the whole pool. The notional change ranks #23, and it isn’t just a single spike; it’s been continuing across several consecutive periods. Trading volume is also higher than usual. The buy/sell ratio of active orders is 1.07, a 3.6% difference—buys are slightly dominant.
24h trading value is 21.77M. The market cap isn’t large, so even this incremental increase can pry open volatility. With OI crowding at the 92nd percentile, longs are piled in pretty heavily—what happens next is either they keep pushing, or this becomes fuel for a squeeze bubble-pop.
Keep an eye on it first—don’t rush to chase the breakout.
On the 15m timeframe it surged 1.57%, and volume directly jumped to 3.25x. OI: 15m +1.76%, 1h +0.81%. Notional change was 223K. Price is rising and positions are rising with it—this is the typical leveraged long getting in, not some kind of short covering fake pump.
The OI abnormal percentile is 92.3%—it ranks #12 across the whole pool. The notional change ranks #23, and it isn’t just a single spike; it’s been continuing across several consecutive periods. Trading volume is also higher than usual. The buy/sell ratio of active orders is 1.07, a 3.6% difference—buys are slightly dominant.
24h trading value is 21.77M. The market cap isn’t large, so even this incremental increase can pry open volatility. With OI crowding at the 92nd percentile, longs are piled in pretty heavily—what happens next is either they keep pushing, or this becomes fuel for a squeeze bubble-pop.
Keep an eye on it first—don’t rush to chase the breakout.
11

Article
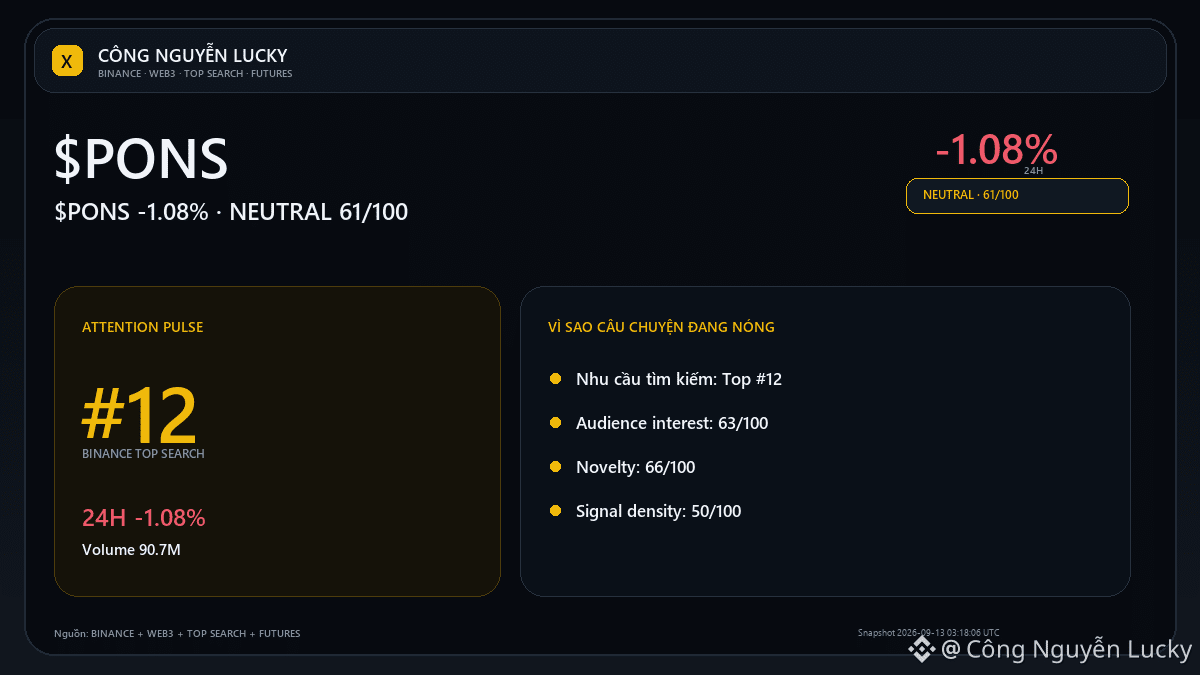
$PONS: Smart Money and the crowd are out of sync — which is more trustworthy?🔎 $PONS is appearing in the group that is trending the most on Binance (#12) — this is a signal of attention level, not a buy signal yet. Market: 0.595 · 24h -1.08% · volume ~90.7M USDT · 999,895 trades.
User interest point: 63/100. If interest turns into real trading: Breaking 0.5738 with expanded open volume will make the ongoing bearish scenario more credible.
If search volume increases but the market does not confirm: Failing to hold the lower zone and reclaiming the 0.618 midpoint will weaken the selling pressure. 🎯 Preferred trend: **NEUTRAL · UNCLEAR · 61/100**.
$PONS: Smart Money and the crowd are out of sync — which is more trustworthy?
🔎 $PONS is appearing in the group that is trending the most on Binance (#12) — this is a signal of attention level, not a buy signal yet. Market: 0.595 · 24h -1.08% · volume ~90.7M USDT · 999,895 trades.
User interest point: 63/100. If interest turns into real trading: Breaking 0.5738 with expanded open volume will make the ongoing bearish scenario more credible.
If search volume increases but the market does not confirm: Failing to hold the lower zone and reclaiming the 0.618 midpoint will weaken the selling pressure. 🎯 Preferred trend: **NEUTRAL · UNCLEAR · 61/100**.
User interest point: 63/100. If interest turns into real trading: Breaking 0.5738 with expanded open volume will make the ongoing bearish scenario more credible.
If search volume increases but the market does not confirm: Failing to hold the lower zone and reclaiming the 0.618 midpoint will weaken the selling pressure. 🎯 Preferred trend: **NEUTRAL · UNCLEAR · 61/100**.
1

·
--
$MET This 15m drop smashed nearly 5 percentage points. The trading volume shot straight up to 13.8x, Z-value at 4.09—clearly someone’s been carried out.
The OI side is even more interesting: the 15m contract is -3.26%, nominal -491K, but the 1h is actually +4.61%, nominal +441K. This is a classic short-term long positioning de-leveraging—stop-loss liquidation, but when you stretch the view to an hour, positions are still flowing in. The OI anomaly percentile is 96.8%, the whole pool #12, nominal change #8, and the depth data also confirms it: volume is higher than normal.
Aggressive trades differ by -0.5%, buy/sell ratio 0.99—basically neutral, with no one-sided panic sell-off. In other words, this looks more like a targeted purge than a full-scale breakdown.
A selloff near historical extreme ranges, paired with high volume + OI short decline while long rises—I’ll watch for a 15m stabilization signal. Don’t rush to catch it, and don’t chase a short. This kind of structure is prone to repeats.
$MET This 15m drop smashed nearly 5 percentage points. The trading volume shot straight up to 13.8x, Z-value at 4.09—clearly someone’s been carried out.
The OI side is even more interesting: the 15m contract is -3.26%, nominal -491K, but the 1h is actually +4.61%, nominal +441K. This is a classic short-term long positioning de-leveraging—stop-loss liquidation, but when you stretch the view to an hour, positions are still flowing in. The OI anomaly percentile is 96.8%, the whole pool #12, nominal change #8, and the depth data also confirms it: volume is higher than normal.
Aggressive trades differ by -0.5%, buy/sell ratio 0.99—basically neutral, with no one-sided panic sell-off. In other words, this looks more like a targeted purge than a full-scale breakdown.
A selloff near historical extreme ranges, paired with high volume + OI short decline while long rises—I’ll watch for a 15m stabilization signal. Don’t rush to catch it, and don’t chase a short. This kind of structure is prone to repeats.
The OI side is even more interesting: the 15m contract is -3.26%, nominal -491K, but the 1h is actually +4.61%, nominal +441K. This is a classic short-term long positioning de-leveraging—stop-loss liquidation, but when you stretch the view to an hour, positions are still flowing in. The OI anomaly percentile is 96.8%, the whole pool #12, nominal change #8, and the depth data also confirms it: volume is higher than normal.
Aggressive trades differ by -0.5%, buy/sell ratio 0.99—basically neutral, with no one-sided panic sell-off. In other words, this looks more like a targeted purge than a full-scale breakdown.
A selloff near historical extreme ranges, paired with high volume + OI short decline while long rises—I’ll watch for a 15m stabilization signal. Don’t rush to catch it, and don’t chase a short. This kind of structure is prone to repeats.
36
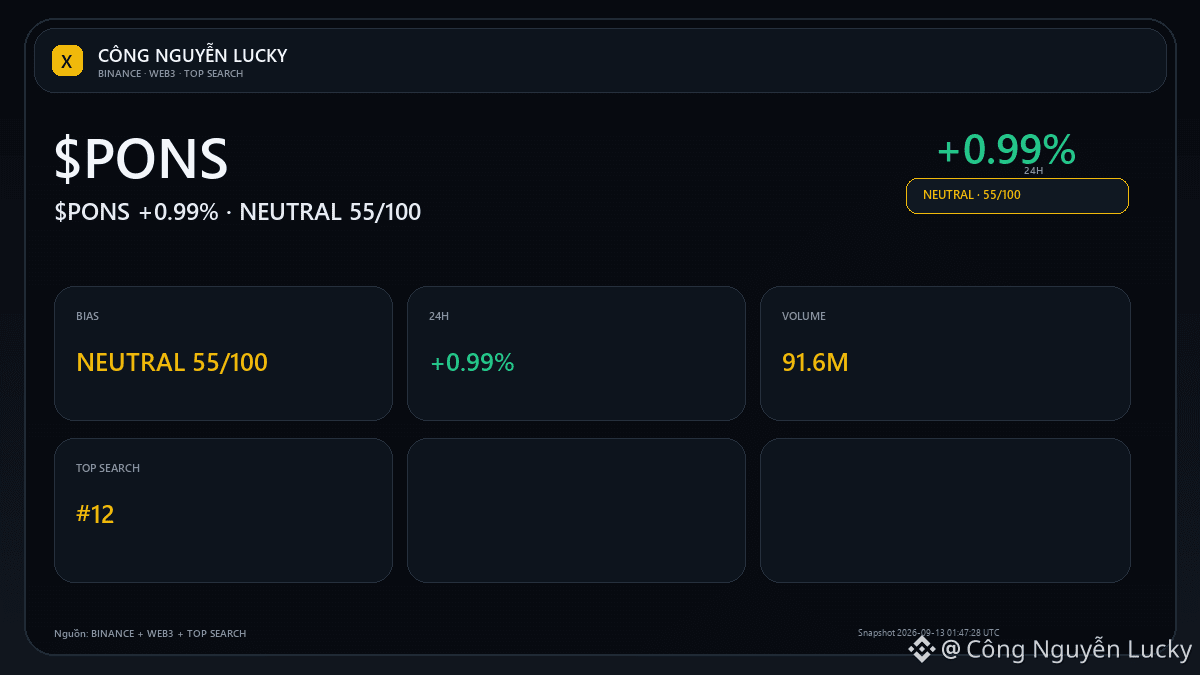
📝 Watchlist note — $PONS: not yet requiring a big conclusion, but there is enough data to track it closely. • 0.6039 · 24h +0.99% · volume ~91.6M USDT · 1,004,984 trades. Conditions to increase conviction: Break above 0.6622 with expanding volume would make the continuation scenario more convincing.
What makes me skip it: Failing to hold the upper zone and dropping back below the midpoint 0.618 would make the cooling scenario clearer. 🎯 Preferred trend: **NEUTRAL · UNCLEAR · 55/100**.
Key basis: Price is at 34/100 within the 24h range.
Additional confirmation when: wait for price, volume, and capital flows to all align on the same direction before raising confidence.
Invalidate/abandon the direction if: you don’t force LONG/SHORT while the data layers are still conflicting. 📌 If you’re watching $PONS, you can open the cashtag to check the current price, liquidity, and market context before making a decision. 🔎 **Evidence check — NEUTRAL 55/100**
• Price 0.6039; 24h +0.99%; volume 91.6M.
• Binance Top Search #12. 🧭 **Levels to watch:** confirmation: wait for price, volume, and capital flows to all choose the same direction before increasing confidence · invalidation: don’t force LONG/SHORT when the data layers are still conflicting Reference sources: Binance Futures Market + Binance Web3 Trending + Binance Top Search · snapshot 2026-09-13 01:47:28 UTC
💬 **Discussion angle:** What confirmation signals do you all need before considering this $PONS move as real rather than noise?
⚠️ Market analysis is for reference only, not a promise of profit. Everyone should do their own research (DYOR), manage risk independently, and take full responsibility for their trading decisions. $PONS
📝 Watchlist note — $PONS : not yet requiring a big conclusion, but there is enough data to track it closely. • 0.6039 · 24h +0.99% · volume ~91.6M USDT · 1,004,984 trades. Conditions to increase conviction: Break above 0.6622 with expanding volume would make the continuation scenario more convincing.
What makes me skip it: Failing to hold the upper zone and dropping back below the midpoint 0.618 would make the cooling scenario clearer. 🎯 Preferred trend: **NEUTRAL · UNCLEAR · 55/100**.
Key basis: Price is at 34/100 within the 24h range.
Additional confirmation when: wait for price, volume, and capital flows to all align on the same direction before raising confidence.
Invalidate/abandon the direction if: you don’t force LONG/SHORT while the data layers are still conflicting. 📌 If you’re watching $PONS , you can open the cashtag to check the current price, liquidity, and market context before making a decision. 🔎 **Evidence check — NEUTRAL 55/100**
• Price 0.6039; 24h +0.99%; volume 91.6M.
• Binance Top Search #12. 🧭 **Levels to watch:** confirmation: wait for price, volume, and capital flows to all choose the same direction before increasing confidence · invalidation: don’t force LONG/SHORT when the data layers are still conflicting Reference sources: Binance Futures Market + Binance Web3 Trending + Binance Top Search · snapshot 2026-09-13 01:47:28 UTC
💬 **Discussion angle:** What confirmation signals do you all need before considering this $PONS move as real rather than noise?
⚠️ Market analysis is for reference only, not a promise of profit. Everyone should do their own research (DYOR), manage risk independently, and take full responsibility for their trading decisions. $PONS
What makes me skip it: Failing to hold the upper zone and dropping back below the midpoint 0.618 would make the cooling scenario clearer. 🎯 Preferred trend: **NEUTRAL · UNCLEAR · 55/100**.
Key basis: Price is at 34/100 within the 24h range.
Additional confirmation when: wait for price, volume, and capital flows to all align on the same direction before raising confidence.
Invalidate/abandon the direction if: you don’t force LONG/SHORT while the data layers are still conflicting. 📌 If you’re watching $PONS , you can open the cashtag to check the current price, liquidity, and market context before making a decision. 🔎 **Evidence check — NEUTRAL 55/100**
• Price 0.6039; 24h +0.99%; volume 91.6M.
• Binance Top Search #12. 🧭 **Levels to watch:** confirmation: wait for price, volume, and capital flows to all choose the same direction before increasing confidence · invalidation: don’t force LONG/SHORT when the data layers are still conflicting Reference sources: Binance Futures Market + Binance Web3 Trending + Binance Top Search · snapshot 2026-09-13 01:47:28 UTC
💬 **Discussion angle:** What confirmation signals do you all need before considering this $PONS move as real rather than noise?
⚠️ Market analysis is for reference only, not a promise of profit. Everyone should do their own research (DYOR), manage risk independently, and take full responsibility for their trading decisions. $PONS
12

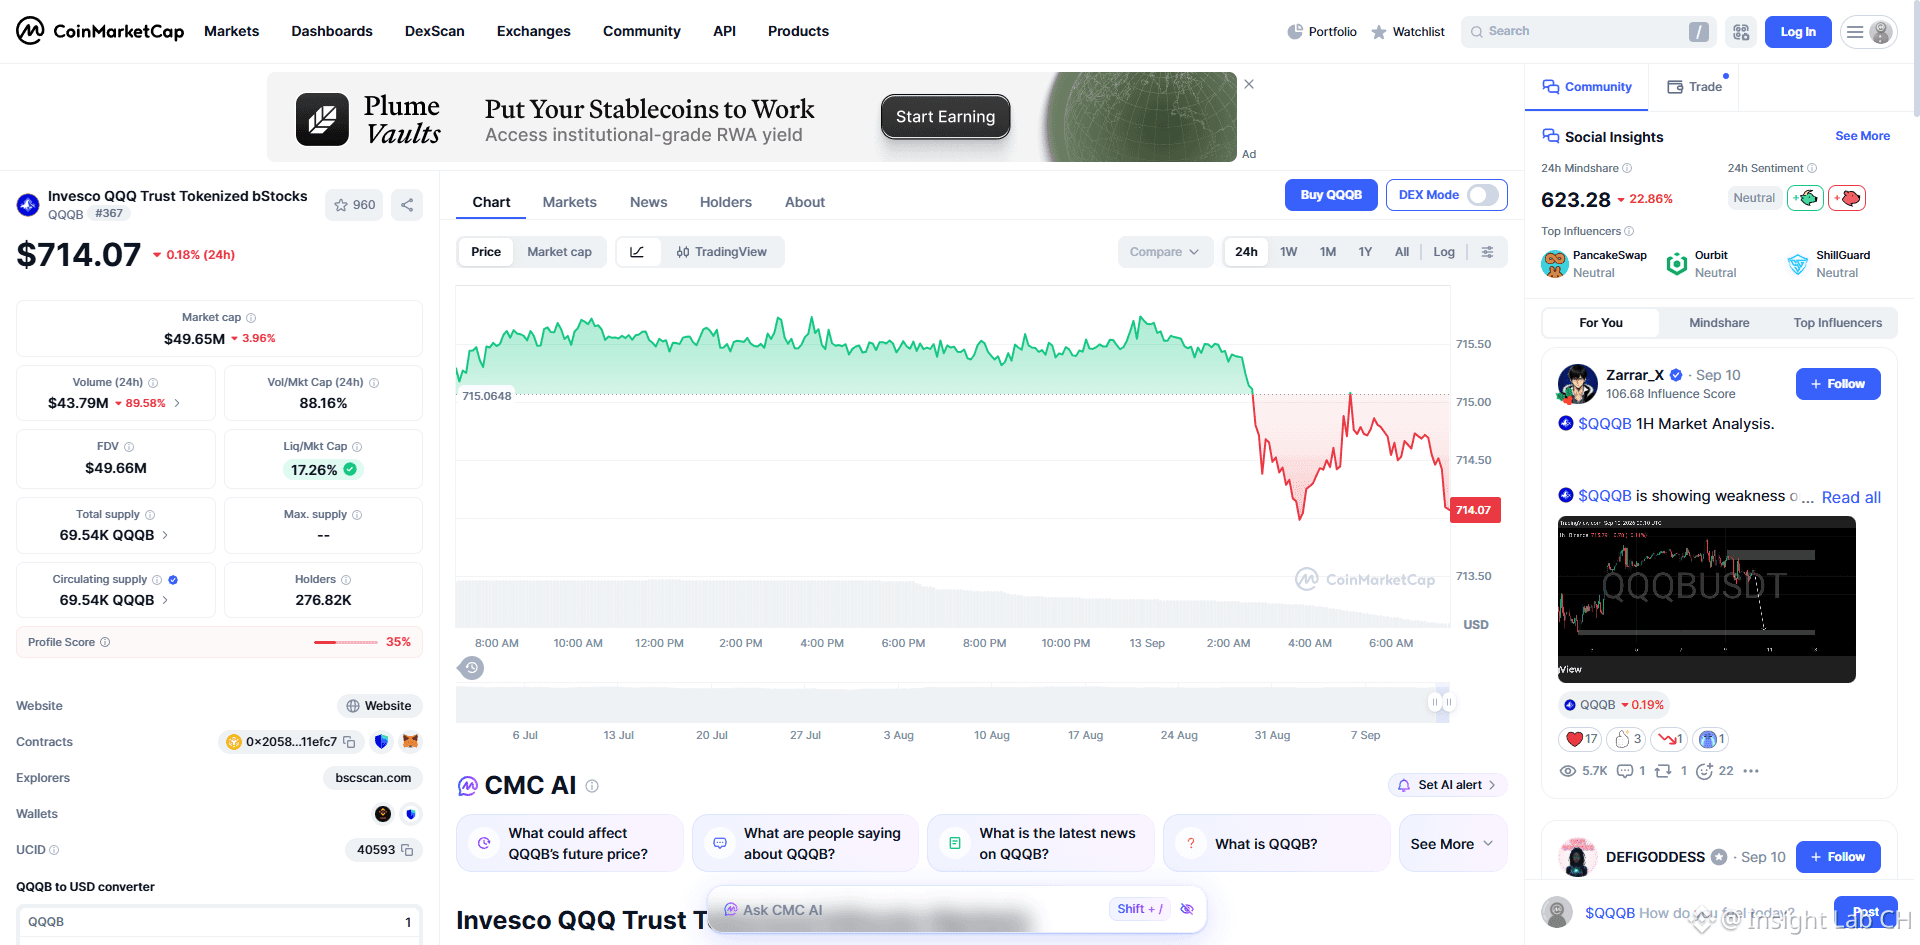
Tracking Invesco QQQ Trust tokenized stocks $QQQB are currently ranked #12 on the CoinMarketCap Trending list. In the context of unclear macro interest-rate prospects and pressure on tech stock valuations, the on-chain premium and liquidity risk of RWA assets still need to be assessed with caution.⚠️ #QQQB #RWA
Tracking Invesco QQQ Trust tokenized stocks $QQQB are currently ranked #12 on the CoinMarketCap Trending list. In the context of unclear macro interest-rate prospects and pressure on tech stock valuations, the on-chain premium and liquidity risk of RWA assets still need to be assessed with caution.⚠️ #QQQB #RWA
123
·
--
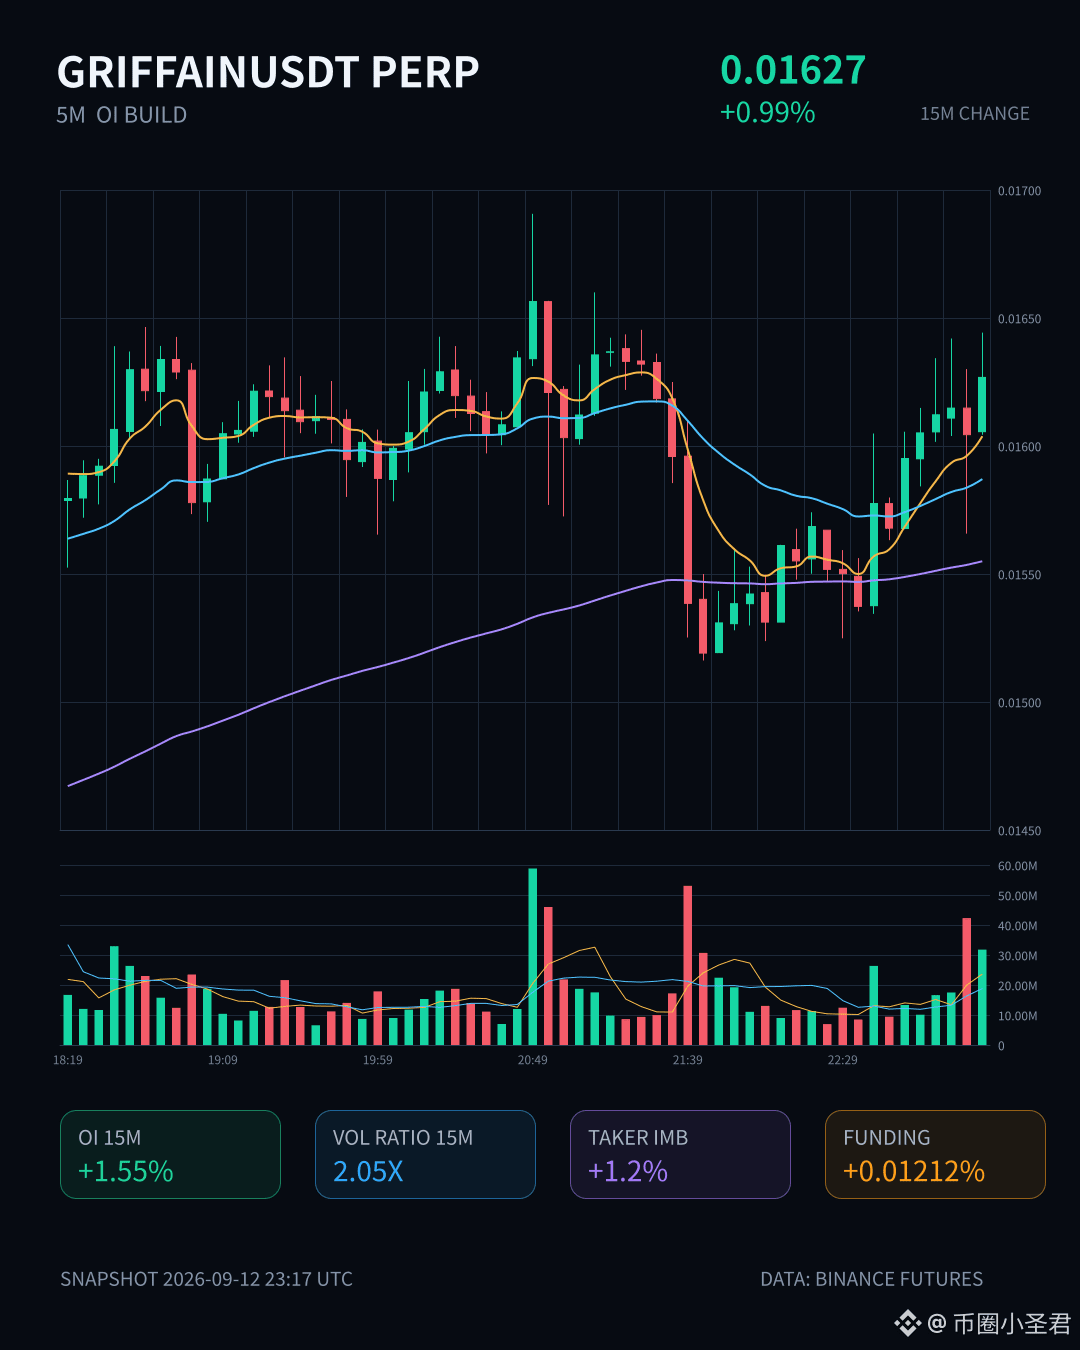
$GRIFFAIN 15 minutes, it moved nearly 1%, volume is 2.05x, OI is in sync +1.55%. This structure is the signal that new leveraged longs have entered.
The whole pool is at an abnormal percentile of 87.3%, ranking #12, and the nominal change is also near the top. Even though OI fell slightly by 0.36% over the past hour, the nominal figure is still positive at 242K, which means it’s not just closing positions—it looks like someone is adding and building long positions here.
The buy/sell ratio is 1.02, with an active execution gap of 1.2%. For now, there’s no obvious sell pressure. In the last 24 hours, trading volume is 56M, and the confirmed depth volume is higher than normal.
In this kind of market, there’s no need to rush—see whether the longs can keep pushing OI higher. If it’s just a short-term spike, OI will pull back within an hour; if it can hold, chances are there’s more to come.
$GRIFFAIN 15 minutes, it moved nearly 1%, volume is 2.05x, OI is in sync +1.55%. This structure is the signal that new leveraged longs have entered.
The whole pool is at an abnormal percentile of 87.3%, ranking #12, and the nominal change is also near the top. Even though OI fell slightly by 0.36% over the past hour, the nominal figure is still positive at 242K, which means it’s not just closing positions—it looks like someone is adding and building long positions here.
The buy/sell ratio is 1.02, with an active execution gap of 1.2%. For now, there’s no obvious sell pressure. In the last 24 hours, trading volume is 56M, and the confirmed depth volume is higher than normal.
In this kind of market, there’s no need to rush—see whether the longs can keep pushing OI higher. If it’s just a short-term spike, OI will pull back within an hour; if it can hold, chances are there’s more to come.
The whole pool is at an abnormal percentile of 87.3%, ranking #12, and the nominal change is also near the top. Even though OI fell slightly by 0.36% over the past hour, the nominal figure is still positive at 242K, which means it’s not just closing positions—it looks like someone is adding and building long positions here.
The buy/sell ratio is 1.02, with an active execution gap of 1.2%. For now, there’s no obvious sell pressure. In the last 24 hours, trading volume is 56M, and the confirmed depth volume is higher than normal.
In this kind of market, there’s no need to rush—see whether the longs can keep pushing OI higher. If it’s just a short-term spike, OI will pull back within an hour; if it can hold, chances are there’s more to come.
25

·
--
$ARB This 15m move is a bit interesting. The price is down 0.65%—not much—but the volume surged straight to 4.49x. Active trade value is down -11.3%, and the buy/sell ratio is 0.80—sell pressure is hitting, but it’s not that vicious.
The key is OI: 15m -0.30%, 1h -0.41%. Nominally it shed more than 400k U. With the price falling and OI also dropping, this doesn’t look like brand-new shorts opening; it looks more like longs deleveraging, with stop-losses being swept.
The unusual activity for the whole pool ranks #11, and the nominal change ranks #12—suggesting this really stands out in the monitored pool.
The closing price breaks below the lower edge of the recent 5m K-zone for about 20 bars—so it’s probing the boundary. But with such high volume and OI contracting at the same time, I lean toward this being a leverage-wash rather than a trend start. 24h traded value is 110M; the liquidity depth is sufficient, so slippage shouldn’t run out of control.
First, see whether it can reclaim that level. If it can’t, then we’ll talk.
$ARB This 15m move is a bit interesting. The price is down 0.65%—not much—but the volume surged straight to 4.49x. Active trade value is down -11.3%, and the buy/sell ratio is 0.80—sell pressure is hitting, but it’s not that vicious.
The key is OI: 15m -0.30%, 1h -0.41%. Nominally it shed more than 400k U. With the price falling and OI also dropping, this doesn’t look like brand-new shorts opening; it looks more like longs deleveraging, with stop-losses being swept.
The unusual activity for the whole pool ranks #11, and the nominal change ranks #12—suggesting this really stands out in the monitored pool.
The closing price breaks below the lower edge of the recent 5m K-zone for about 20 bars—so it’s probing the boundary. But with such high volume and OI contracting at the same time, I lean toward this being a leverage-wash rather than a trend start. 24h traded value is 110M; the liquidity depth is sufficient, so slippage shouldn’t run out of control.
First, see whether it can reclaim that level. If it can’t, then we’ll talk.
The key is OI: 15m -0.30%, 1h -0.41%. Nominally it shed more than 400k U. With the price falling and OI also dropping, this doesn’t look like brand-new shorts opening; it looks more like longs deleveraging, with stop-losses being swept.
The unusual activity for the whole pool ranks #11, and the nominal change ranks #12—suggesting this really stands out in the monitored pool.
The closing price breaks below the lower edge of the recent 5m K-zone for about 20 bars—so it’s probing the boundary. But with such high volume and OI contracting at the same time, I lean toward this being a leverage-wash rather than a trend start. 24h traded value is 110M; the liquidity depth is sufficient, so slippage shouldn’t run out of control.
First, see whether it can reclaim that level. If it can’t, then we’ll talk.
23
·
--
RAY, this move definitely has the taste of deleveraging for longs.
On the 15m timeframe, price directly dropped 2.31%. Volume hit 2.86 times the usual level. OI also fell by 1.83%, and notional shrank by more than 510k U. Price is down, and positions are shrinking afterward—not new shorts entering to press the move, but existing long positions being cleared.
Aggressive trade imbalance -27.4%, buy/sell ratio 0.57, with sell pressure in control. The whole pool’s anomaly is #5, notional change is #12. It’s been continuing across several consecutive cycles, and the OI anomaly percentile is 87.9%—this level is indeed worth keeping an eye on.
On the 1h timeframe, OI is still showing +0.11%, suggesting longer-term positioning hasn’t fully flipped to shorts. However, notional change is already -1.68%, structurally closer to position reduction rather than directional shorting.
On the 24h timeframe, trading value is still 277M U, so liquidity isn’t bad. But once this kind of deleveraging starts, don’t rush to catch the falling move.
$RAYSOL
RAY, this move definitely has the taste of deleveraging for longs.
On the 15m timeframe, price directly dropped 2.31%. Volume hit 2.86 times the usual level. OI also fell by 1.83%, and notional shrank by more than 510k U. Price is down, and positions are shrinking afterward—not new shorts entering to press the move, but existing long positions being cleared.
Aggressive trade imbalance -27.4%, buy/sell ratio 0.57, with sell pressure in control. The whole pool’s anomaly is #5, notional change is #12. It’s been continuing across several consecutive cycles, and the OI anomaly percentile is 87.9%—this level is indeed worth keeping an eye on.
On the 1h timeframe, OI is still showing +0.11%, suggesting longer-term positioning hasn’t fully flipped to shorts. However, notional change is already -1.68%, structurally closer to position reduction rather than directional shorting.
On the 24h timeframe, trading value is still 277M U, so liquidity isn’t bad. But once this kind of deleveraging starts, don’t rush to catch the falling move.
$RAYSOL
On the 15m timeframe, price directly dropped 2.31%. Volume hit 2.86 times the usual level. OI also fell by 1.83%, and notional shrank by more than 510k U. Price is down, and positions are shrinking afterward—not new shorts entering to press the move, but existing long positions being cleared.
Aggressive trade imbalance -27.4%, buy/sell ratio 0.57, with sell pressure in control. The whole pool’s anomaly is #5, notional change is #12. It’s been continuing across several consecutive cycles, and the OI anomaly percentile is 87.9%—this level is indeed worth keeping an eye on.
On the 1h timeframe, OI is still showing +0.11%, suggesting longer-term positioning hasn’t fully flipped to shorts. However, notional change is already -1.68%, structurally closer to position reduction rather than directional shorting.
On the 24h timeframe, trading value is still 277M U, so liquidity isn’t bad. But once this kind of deleveraging starts, don’t rush to catch the falling move.
$RAYSOL
12
·
--
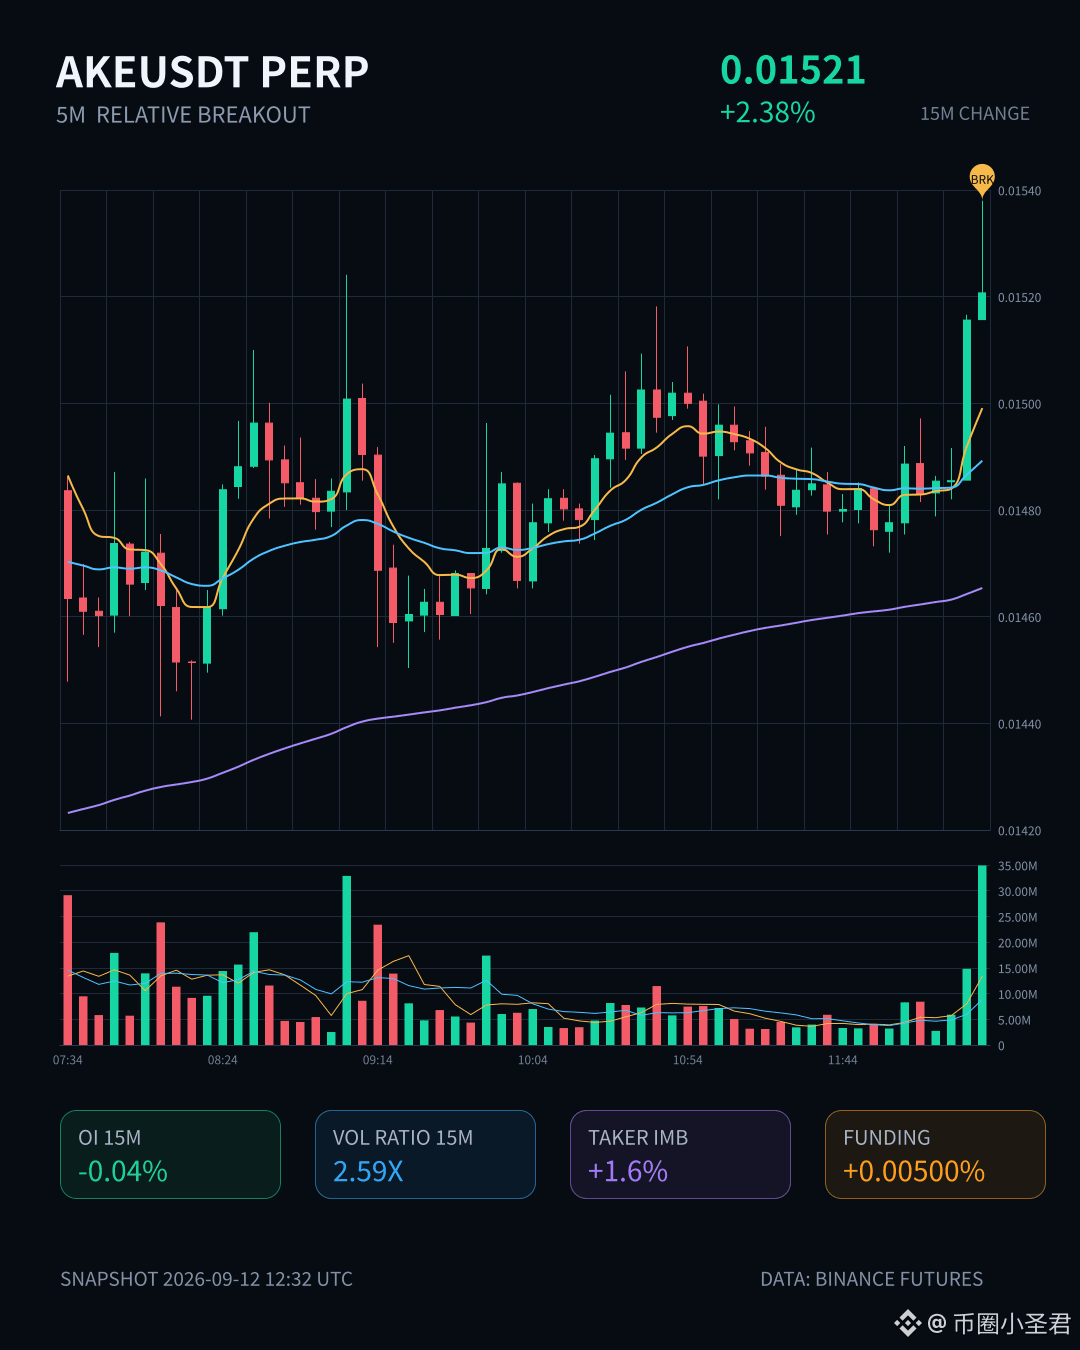
$AKE This move is kind of interesting.
On the 15m timeframe, it’s up 2.38%. The volume directly reached 2.59x, and the closing price pierced through the upper edges of nearly 20 consecutive 5m candles. But note: OI on 15m is -0.04%, and on 1h it’s -0.13%. Price is rising, while open interest isn’t following—this isn’t fresh long entry. It looks more like shorts are being forced to close.
In the whole-pool anomaly percentiles, it’s at 92.5%, ranked #5. Nominal change is #12. It’s been on the anomaly list for several consecutive periods, and the depth data confirms it too: volume is higher than usual and it’s touching the boundary of the recent range. In the past 24h, turnover is 47M. The float isn’t big, so with this kind of volume, it’s easy to whip up volatility.
Active volume spread is 1.6%, buy/sell ratio is 1.03. The bids are slightly stronger, but not extremely so.
My take: If it’s only short covering, once pushed up there’s no new capital to carry it forward, so it’s likely to pull back. But if the pullback can hold above the upper edge of the range, there’s a chance it could develop into a real breakout. At this level, chasing longs isn’t great on risk-reward—wait for the pullback to confirm to be safer.
Not a call. Watch it yourself on the screen.
$AKE This move is kind of interesting.
On the 15m timeframe, it’s up 2.38%. The volume directly reached 2.59x, and the closing price pierced through the upper edges of nearly 20 consecutive 5m candles. But note: OI on 15m is -0.04%, and on 1h it’s -0.13%. Price is rising, while open interest isn’t following—this isn’t fresh long entry. It looks more like shorts are being forced to close.
In the whole-pool anomaly percentiles, it’s at 92.5%, ranked #5. Nominal change is #12. It’s been on the anomaly list for several consecutive periods, and the depth data confirms it too: volume is higher than usual and it’s touching the boundary of the recent range. In the past 24h, turnover is 47M. The float isn’t big, so with this kind of volume, it’s easy to whip up volatility.
Active volume spread is 1.6%, buy/sell ratio is 1.03. The bids are slightly stronger, but not extremely so.
My take: If it’s only short covering, once pushed up there’s no new capital to carry it forward, so it’s likely to pull back. But if the pullback can hold above the upper edge of the range, there’s a chance it could develop into a real breakout. At this level, chasing longs isn’t great on risk-reward—wait for the pullback to confirm to be safer.
Not a call. Watch it yourself on the screen.
On the 15m timeframe, it’s up 2.38%. The volume directly reached 2.59x, and the closing price pierced through the upper edges of nearly 20 consecutive 5m candles. But note: OI on 15m is -0.04%, and on 1h it’s -0.13%. Price is rising, while open interest isn’t following—this isn’t fresh long entry. It looks more like shorts are being forced to close.
In the whole-pool anomaly percentiles, it’s at 92.5%, ranked #5. Nominal change is #12. It’s been on the anomaly list for several consecutive periods, and the depth data confirms it too: volume is higher than usual and it’s touching the boundary of the recent range. In the past 24h, turnover is 47M. The float isn’t big, so with this kind of volume, it’s easy to whip up volatility.
Active volume spread is 1.6%, buy/sell ratio is 1.03. The bids are slightly stronger, but not extremely so.
My take: If it’s only short covering, once pushed up there’s no new capital to carry it forward, so it’s likely to pull back. But if the pullback can hold above the upper edge of the range, there’s a chance it could develop into a real breakout. At this level, chasing longs isn’t great on risk-reward—wait for the pullback to confirm to be safer.
Not a call. Watch it yourself on the screen.
39
·
--
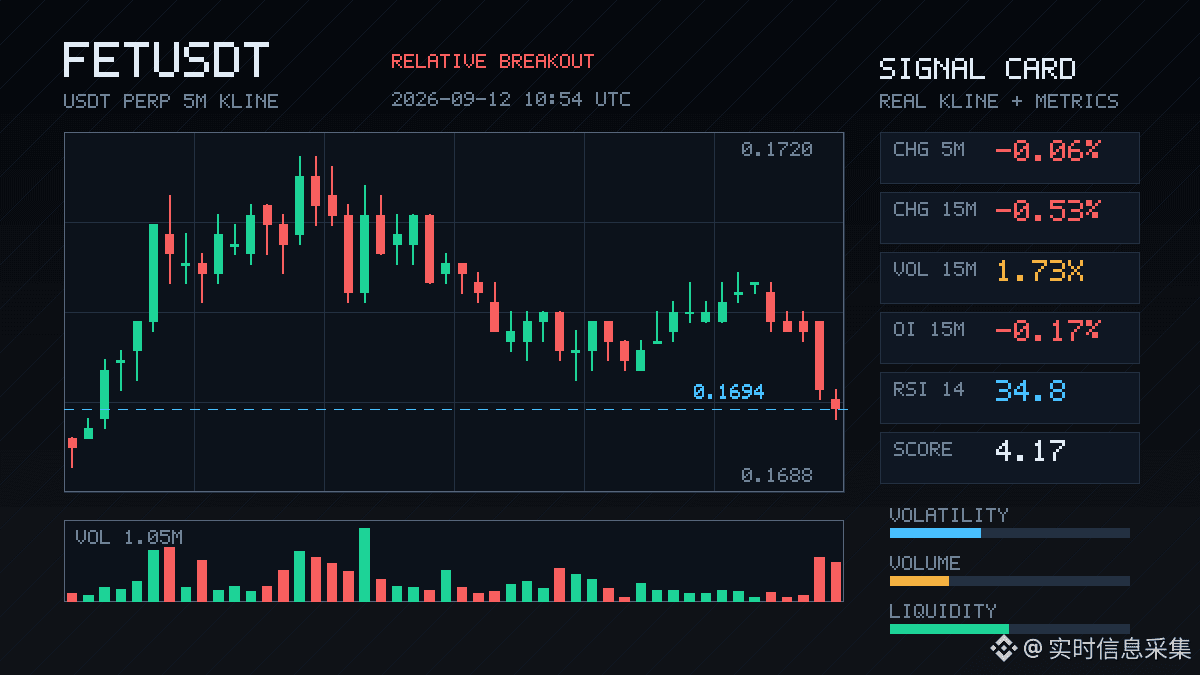
FET This move is a bit interesting. On the 15m chart, it dropped 0.53%, but the volume reached 1.73x, and Z is 1.51. The price has pierced through the lower edge of nearly 20 of the 5m bars, with aggressive trade flow down -58.7% and the buy/sell ratio at 0.26—selling pressure was genuinely hammered in.
But look at OI: on 15m it’s -0.17%, and on 1h it’s -0.13%. Nominally, only 158K and 118K worth of U were reduced. Price fell, and positions shrank—this isn’t a fresh short entry; it looks more like longs de-leveraging themselves, with stop-loss positions getting swept.
The anomaly percentile is 83.7%, ranking #12 in the whole pool. In the last 24h, trading volume is just over 30M. With the volume sitting there and the range boundaries already tested, the direction has also shifted—but what’s happening is that positioning is contracting. This structure is cleaner than a pure sell-off, but it still isn’t at a point where you can confidently step in to take it.
Just watch for now.
FET This move is a bit interesting. On the 15m chart, it dropped 0.53%, but the volume reached 1.73x, and Z is 1.51. The price has pierced through the lower edge of nearly 20 of the 5m bars, with aggressive trade flow down -58.7% and the buy/sell ratio at 0.26—selling pressure was genuinely hammered in.
But look at OI: on 15m it’s -0.17%, and on 1h it’s -0.13%. Nominally, only 158K and 118K worth of U were reduced. Price fell, and positions shrank—this isn’t a fresh short entry; it looks more like longs de-leveraging themselves, with stop-loss positions getting swept.
The anomaly percentile is 83.7%, ranking #12 in the whole pool. In the last 24h, trading volume is just over 30M. With the volume sitting there and the range boundaries already tested, the direction has also shifted—but what’s happening is that positioning is contracting. This structure is cleaner than a pure sell-off, but it still isn’t at a point where you can confidently step in to take it.
Just watch for now.
But look at OI: on 15m it’s -0.17%, and on 1h it’s -0.13%. Nominally, only 158K and 118K worth of U were reduced. Price fell, and positions shrank—this isn’t a fresh short entry; it looks more like longs de-leveraging themselves, with stop-loss positions getting swept.
The anomaly percentile is 83.7%, ranking #12 in the whole pool. In the last 24h, trading volume is just over 30M. With the volume sitting there and the range boundaries already tested, the direction has also shifted—but what’s happening is that positioning is contracting. This structure is cleaner than a pure sell-off, but it still isn’t at a point where you can confidently step in to take it.
Just watch for now.
12
·
--
$VVV This 15m chart is kind of interesting.
The price is down 1.25%—not much on the surface—but if you dig in: volume is up to 1.67x. Active trades are down -29.8%, the buy-sell ratio is 0.54, and the selling pressure is genuinely pushing out supply.
The key is OI. The 1h contract OI dropped 0.48%, notional -757K; the 15m OI is also shrinking slightly. Price is falling while OI is declining—basically it’s longs deleveraging and cutting losses to exit, not that kind of structure where new shorts step in to smash the market.
Now the closing price has already broken below the lower band of the last ~20 consecutive 5m K candles. Short-term support is broken. Abnormal ranking in the whole pool is #21, and notional change #12—this suggests it’s not just VVV moving alone. The whole pool shows a notable abnormal move.
24h trading volume is 115M. Liquidity is still there, not like an unmanaged “zombie coin.” But with active direction so heavily bearish, anyone looking to bottom-fish in the short term should wait and see whether OI can hold steady first.
$VVV This 15m chart is kind of interesting.
The price is down 1.25%—not much on the surface—but if you dig in: volume is up to 1.67x. Active trades are down -29.8%, the buy-sell ratio is 0.54, and the selling pressure is genuinely pushing out supply.
The key is OI. The 1h contract OI dropped 0.48%, notional -757K; the 15m OI is also shrinking slightly. Price is falling while OI is declining—basically it’s longs deleveraging and cutting losses to exit, not that kind of structure where new shorts step in to smash the market.
Now the closing price has already broken below the lower band of the last ~20 consecutive 5m K candles. Short-term support is broken. Abnormal ranking in the whole pool is #21, and notional change #12—this suggests it’s not just VVV moving alone. The whole pool shows a notable abnormal move.
24h trading volume is 115M. Liquidity is still there, not like an unmanaged “zombie coin.” But with active direction so heavily bearish, anyone looking to bottom-fish in the short term should wait and see whether OI can hold steady first.
The price is down 1.25%—not much on the surface—but if you dig in: volume is up to 1.67x. Active trades are down -29.8%, the buy-sell ratio is 0.54, and the selling pressure is genuinely pushing out supply.
The key is OI. The 1h contract OI dropped 0.48%, notional -757K; the 15m OI is also shrinking slightly. Price is falling while OI is declining—basically it’s longs deleveraging and cutting losses to exit, not that kind of structure where new shorts step in to smash the market.
Now the closing price has already broken below the lower band of the last ~20 consecutive 5m K candles. Short-term support is broken. Abnormal ranking in the whole pool is #21, and notional change #12—this suggests it’s not just VVV moving alone. The whole pool shows a notable abnormal move.
24h trading volume is 115M. Liquidity is still there, not like an unmanaged “zombie coin.” But with active direction so heavily bearish, anyone looking to bottom-fish in the short term should wait and see whether OI can hold steady first.

19
·
--
HEMI This move is a bit too rushed—within 15m it already pushed through 1.8 points. The volume is 1.6x, the Z value is 3.44, and the order book clearly shows money moving.
What’s interesting is that OI isn’t rising but falling instead: the 15m contract is -0.15%, 1h is -0.05%. As price moves up, the position size is actually decreasing. This kind of structure usually isn’t fresh long entries—it’s more like short positions getting forced to cover, or short-term positions being closed while pushing upward.
The closing price has already climbed above the upper edge of nearly 20 consecutive 5m ranges. Passive vs active turnover differs by 17.7%, the buy/sell ratio is 1.43, and the buy-side directionality is pretty clear. Over the last 24h, turnover is 16.95M—not a huge pool—but the pool’s abnormal percentile is 87.3%, ranked #12, and depth confirmation indicates liquidity support is there.
In terms of nominal OI change, it’s still positive overall: 109K / 144K USDT, +1.57% / +2.09%. This suggests it’s not simply de-leveraging—positions are rotating. The up-move driven by short covering tends to get low-energy after it plays out; we need to see whether new long buyers step in next. Otherwise it may just be a pulse.
First, watch whether the breakout candle on the 5m chart can hold its ground at the close.
HEMI This move is a bit too rushed—within 15m it already pushed through 1.8 points. The volume is 1.6x, the Z value is 3.44, and the order book clearly shows money moving.
What’s interesting is that OI isn’t rising but falling instead: the 15m contract is -0.15%, 1h is -0.05%. As price moves up, the position size is actually decreasing. This kind of structure usually isn’t fresh long entries—it’s more like short positions getting forced to cover, or short-term positions being closed while pushing upward.
The closing price has already climbed above the upper edge of nearly 20 consecutive 5m ranges. Passive vs active turnover differs by 17.7%, the buy/sell ratio is 1.43, and the buy-side directionality is pretty clear. Over the last 24h, turnover is 16.95M—not a huge pool—but the pool’s abnormal percentile is 87.3%, ranked #12, and depth confirmation indicates liquidity support is there.
In terms of nominal OI change, it’s still positive overall: 109K / 144K USDT, +1.57% / +2.09%. This suggests it’s not simply de-leveraging—positions are rotating. The up-move driven by short covering tends to get low-energy after it plays out; we need to see whether new long buyers step in next. Otherwise it may just be a pulse.
First, watch whether the breakout candle on the 5m chart can hold its ground at the close.
What’s interesting is that OI isn’t rising but falling instead: the 15m contract is -0.15%, 1h is -0.05%. As price moves up, the position size is actually decreasing. This kind of structure usually isn’t fresh long entries—it’s more like short positions getting forced to cover, or short-term positions being closed while pushing upward.
The closing price has already climbed above the upper edge of nearly 20 consecutive 5m ranges. Passive vs active turnover differs by 17.7%, the buy/sell ratio is 1.43, and the buy-side directionality is pretty clear. Over the last 24h, turnover is 16.95M—not a huge pool—but the pool’s abnormal percentile is 87.3%, ranked #12, and depth confirmation indicates liquidity support is there.
In terms of nominal OI change, it’s still positive overall: 109K / 144K USDT, +1.57% / +2.09%. This suggests it’s not simply de-leveraging—positions are rotating. The up-move driven by short covering tends to get low-energy after it plays out; we need to see whether new long buyers step in next. Otherwise it may just be a pulse.
First, watch whether the breakout candle on the 5m chart can hold its ground at the close.
50
·
--
GPS has something going on.
In 15m, it rallied 0.88%, volume reached 1.58x, the Z value is 2.39, and the close directly broke above the upper bound of the last 20 or so 5m candles. The buy/sell ratio is 1.73; active traded volume is down 26.7%. Clearly, there’s money pushing upward.
More importantly, OI is rising in sync: 15m +0.09%, 1h +0.22%, with notional increasing by 147K. Price is up while OI rises—this is a structure of new leveraged longs entering, not a fakeout from shorts covering. The extreme percentile is 84.3%, ranking #12 across the whole pool. The funding rate is also pushed up to a high percentile recently.
In the last 24h, the turnover is only 8.74M, and the pool isn’t that deep. With this level of activity, a notional change of 83K is enough to generate volatility. The range boundary was just broken, and the volume-price coordination is still fairly clean—though the funding rate isn’t low. If you chase, keep an eye on how crowded the longs are.
GPS has something going on.
In 15m, it rallied 0.88%, volume reached 1.58x, the Z value is 2.39, and the close directly broke above the upper bound of the last 20 or so 5m candles. The buy/sell ratio is 1.73; active traded volume is down 26.7%. Clearly, there’s money pushing upward.
More importantly, OI is rising in sync: 15m +0.09%, 1h +0.22%, with notional increasing by 147K. Price is up while OI rises—this is a structure of new leveraged longs entering, not a fakeout from shorts covering. The extreme percentile is 84.3%, ranking #12 across the whole pool. The funding rate is also pushed up to a high percentile recently.
In the last 24h, the turnover is only 8.74M, and the pool isn’t that deep. With this level of activity, a notional change of 83K is enough to generate volatility. The range boundary was just broken, and the volume-price coordination is still fairly clean—though the funding rate isn’t low. If you chase, keep an eye on how crowded the longs are.
In 15m, it rallied 0.88%, volume reached 1.58x, the Z value is 2.39, and the close directly broke above the upper bound of the last 20 or so 5m candles. The buy/sell ratio is 1.73; active traded volume is down 26.7%. Clearly, there’s money pushing upward.
More importantly, OI is rising in sync: 15m +0.09%, 1h +0.22%, with notional increasing by 147K. Price is up while OI rises—this is a structure of new leveraged longs entering, not a fakeout from shorts covering. The extreme percentile is 84.3%, ranking #12 across the whole pool. The funding rate is also pushed up to a high percentile recently.
In the last 24h, the turnover is only 8.74M, and the pool isn’t that deep. With this level of activity, a notional change of 83K is enough to generate volatility. The range boundary was just broken, and the volume-price coordination is still fairly clean—though the funding rate isn’t low. If you chase, keep an eye on how crowded the longs are.
74
Log in to explore more content
Join global crypto users on Binance Square
⚡️ Get latest and useful information about crypto.
💬 Trusted by the world’s largest crypto exchange.
👍 Discover real insights from verified creators.
Email / Phone number
Trending Topics
1
#FedRateWatch
261,422 views
1,666 Discussing
2
#BitcoinSlidesTo$76000
3,338 views
57 Discussing
3
#BitcoinReboundsTo$79K
49,550 views
360 Discussing
4
#StrategyMarketCapPassesFord
9,107 views
315 Discussing
5
#ClarityActOddsHalveOnPolymarket
6,639 views
247 Discussing
6
#US30YTreasuryYieldTops5.40%
9,600 views
210 Discussing
7
#BessentEndorsesFinalClarityActDraft
27,146 views
518 Discussing
8
#ZamaOpens16ConfidentialMorphoVaults
10,119 views
249 Discussing
9
#USDCOnChainVolumeTops$100Trillion
1,490 views
37 Discussing
10
#BitcoinSpotETFsNetInflow$160M
2,396 views
92 Discussing