

桀-1688
4.4k Posts

桀-1688
 Square Verified
Report
Block User
盯盘不追高,数据说人话。关注我,用数据拆行情,用白话讲市场。

BTC Holder
High-Frequency Trader
9.1 Years
106 Following
11.3K+ Followers
2.5K+ Liked
Posts
·
--
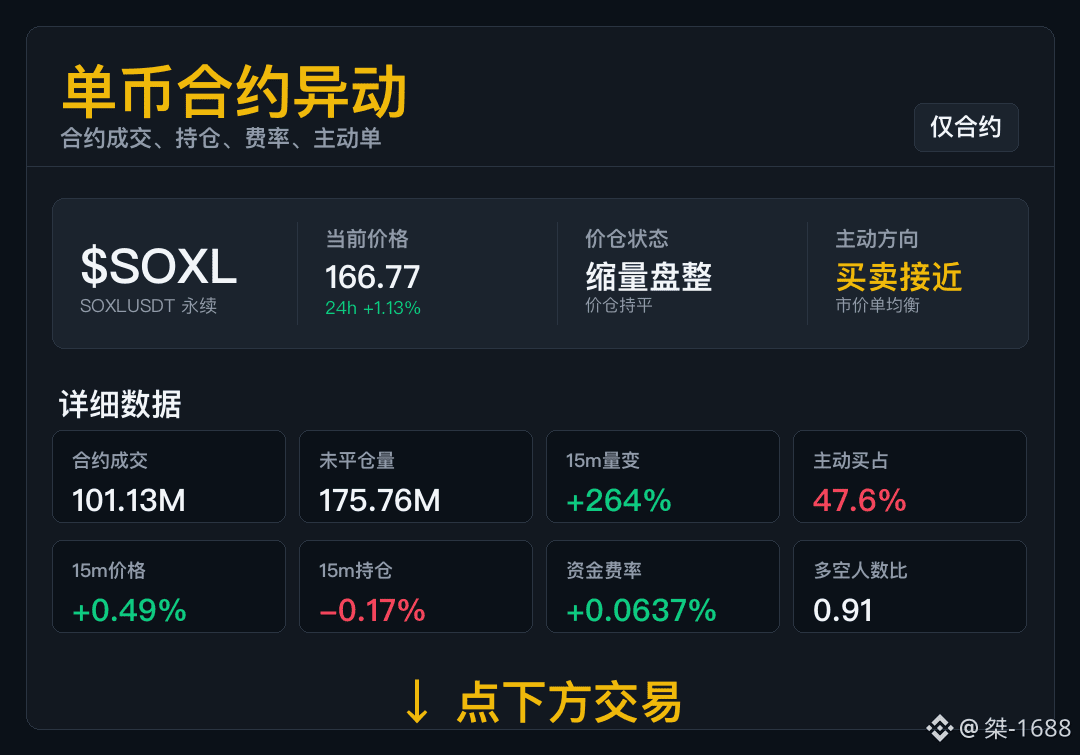
$SOXL Now don’t just look at the candlestick chart—your position and trading intent can explain more.
On the 15m timeframe, price is +0.49%, while positions are -0.17%. It currently looks more like “a contraction and consolidation”: neither price nor positions have made a clear statement, and the market is still grinding.
Active buys account for 47.6%. Neither side is overwhelmingly dominant; the fee rate has already heated up, so the long side isn’t cheap anymore.
While the market is still grinding, don’t focus so much on up or down—wait for one real breakout with increased volume.
$SOXL Now don’t just look at the candlestick chart—your position and trading intent can explain more.
On the 15m timeframe, price is +0.49%, while positions are -0.17%. It currently looks more like “a contraction and consolidation”: neither price nor positions have made a clear statement, and the market is still grinding.
Active buys account for 47.6%. Neither side is overwhelmingly dominant; the fee rate has already heated up, so the long side isn’t cheap anymore.
While the market is still grinding, don’t focus so much on up or down—wait for one real breakout with increased volume.
On the 15m timeframe, price is +0.49%, while positions are -0.17%. It currently looks more like “a contraction and consolidation”: neither price nor positions have made a clear statement, and the market is still grinding.
Active buys account for 47.6%. Neither side is overwhelmingly dominant; the fee rate has already heated up, so the long side isn’t cheap anymore.
While the market is still grinding, don’t focus so much on up or down—wait for one real breakout with increased volume.
43
·
--
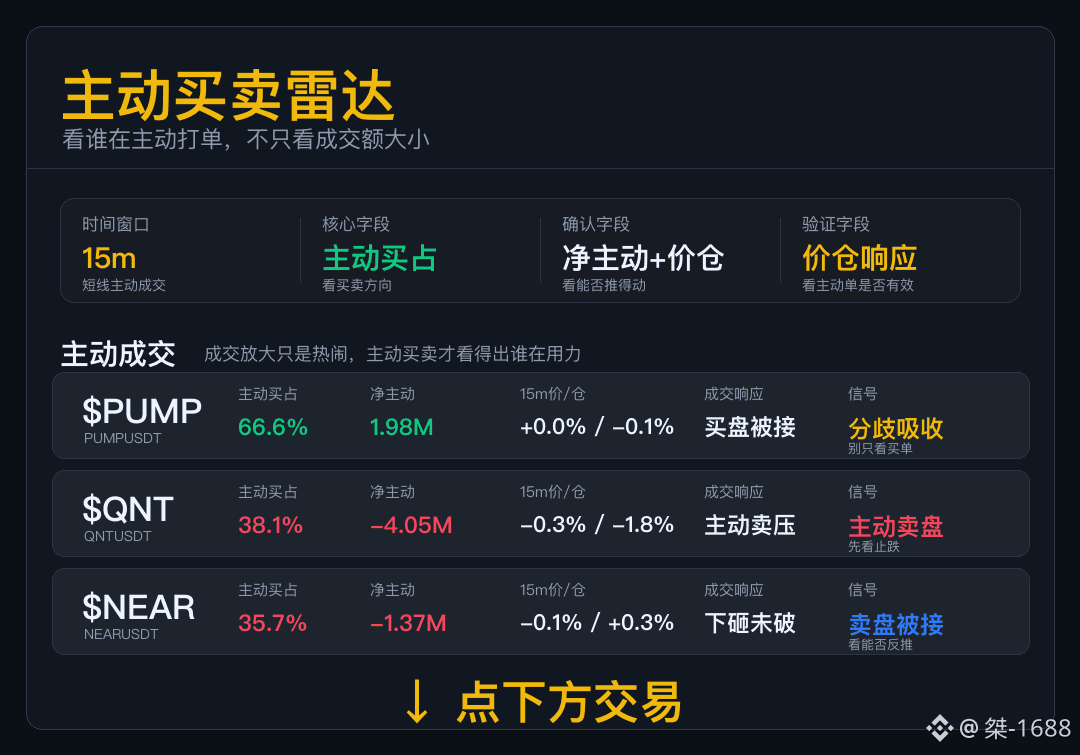
Active Buy/Sell Radar
Don’t just look at trading value. Today’s focus is whether aggressive orders can push the order book.
$PUMP —The buyer is actively pushing, but the price action hasn’t opened up. This suggests the sell side isn’t weak either. Next, watch who withdraws first.
$QNT —The seller first pushes the price down and opens it up. If open interest also increases at the same time, divergence inside the market is widening.
$NEAR —There is sell-side volume, but the price hasn’t broken support. Right now, it looks more like trades are being absorbed rather than a confirmed reversal. The direction hasn’t flipped yet.
Both sides are taking action. Don’t make a combined judgment—check one price level at a time to see whether it receives a response.
Active Buy/Sell Radar
Don’t just look at trading value. Today’s focus is whether aggressive orders can push the order book.
$PUMP —The buyer is actively pushing, but the price action hasn’t opened up. This suggests the sell side isn’t weak either. Next, watch who withdraws first.
$QNT —The seller first pushes the price down and opens it up. If open interest also increases at the same time, divergence inside the market is widening.
$NEAR —There is sell-side volume, but the price hasn’t broken support. Right now, it looks more like trades are being absorbed rather than a confirmed reversal. The direction hasn’t flipped yet.
Both sides are taking action. Don’t make a combined judgment—check one price level at a time to see whether it receives a response.
Don’t just look at trading value. Today’s focus is whether aggressive orders can push the order book.
$PUMP —The buyer is actively pushing, but the price action hasn’t opened up. This suggests the sell side isn’t weak either. Next, watch who withdraws first.
$QNT —The seller first pushes the price down and opens it up. If open interest also increases at the same time, divergence inside the market is widening.
$NEAR —There is sell-side volume, but the price hasn’t broken support. Right now, it looks more like trades are being absorbed rather than a confirmed reversal. The direction hasn’t flipped yet.
Both sides are taking action. Don’t make a combined judgment—check one price level at a time to see whether it receives a response.
74
·
--
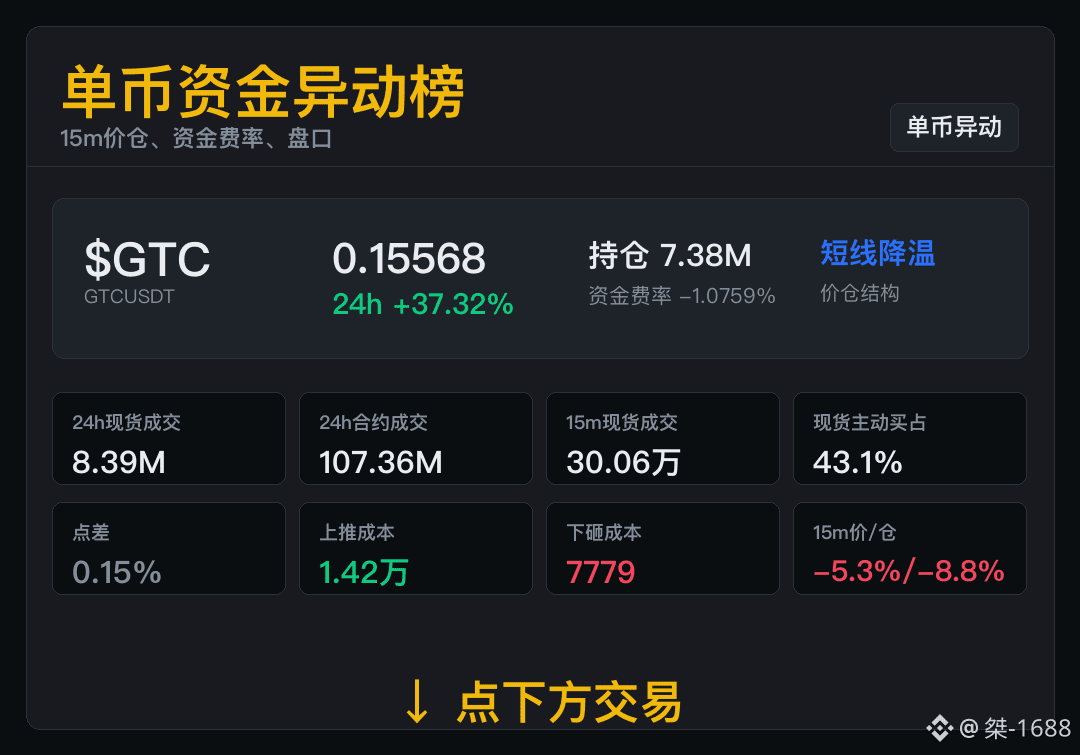
$GTC 15m price falls, positions shrink, and short-term momentum continues to cool down.
24h change +37.32%, 15m price/position -5.28% / -8.81%, funding rate -1.0759%.
As positions follow the price down, the current structure is entering a cooling phase.
When both price and positions continue to decline, maintain a low-visibility level.
$GTC 15m price falls, positions shrink, and short-term momentum continues to cool down.
24h change +37.32%, 15m price/position -5.28% / -8.81%, funding rate -1.0759%.
As positions follow the price down, the current structure is entering a cooling phase.
When both price and positions continue to decline, maintain a low-visibility level.
24h change +37.32%, 15m price/position -5.28% / -8.81%, funding rate -1.0759%.
As positions follow the price down, the current structure is entering a cooling phase.
When both price and positions continue to decline, maintain a low-visibility level.
93
·
--
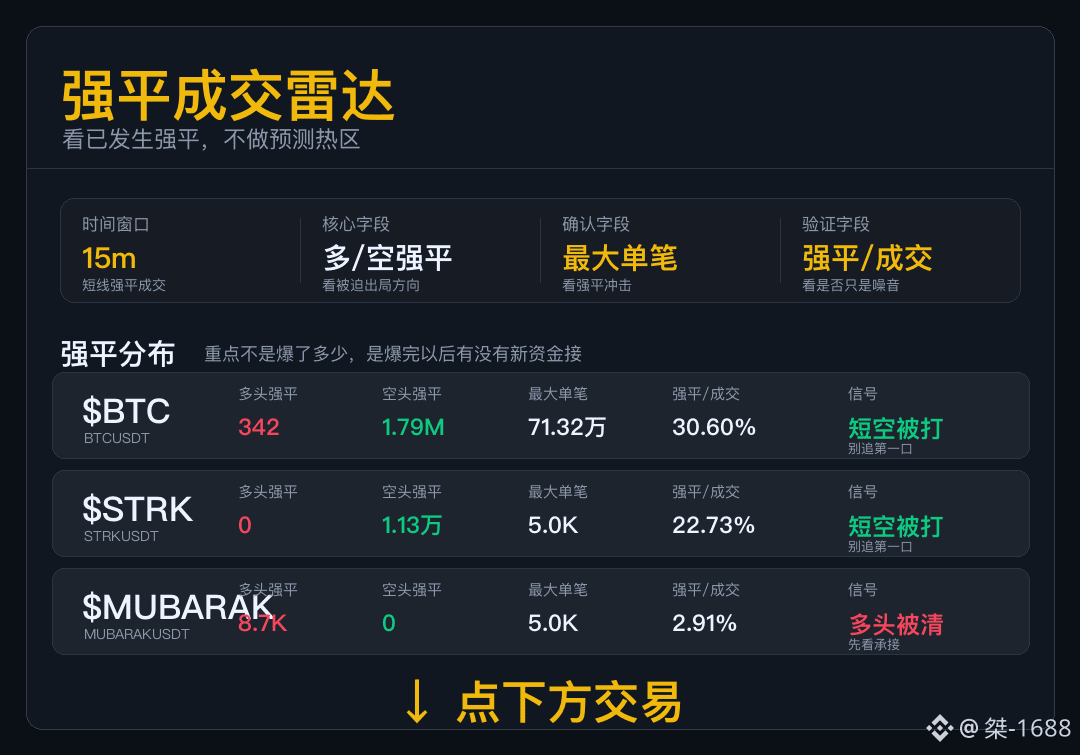
Strong-Moving Breakout Radar
With this kind of data, first look at who is forced out.
$BTC : the shorts being squeezed are more clearly evident, but the first candle after the squeeze not being equal to the trend—only if the pullback fails to break down is it more meaningful.
$STRK : after the shorts are pushed out, the first segment is usually fast; the second segment depends on whether the new buy orders are willing to follow.
$MUBARAK : longs exit in a concentrated way. The current data only indicates liquidation has occurred; it cannot be used to declare that the market has bottomed.
Some longs are liquidated, some shorts are squeezed out—don’t combine them into a single market direction.
Strong-Moving Breakout Radar
With this kind of data, first look at who is forced out.
$BTC : the shorts being squeezed are more clearly evident, but the first candle after the squeeze not being equal to the trend—only if the pullback fails to break down is it more meaningful.
$STRK : after the shorts are pushed out, the first segment is usually fast; the second segment depends on whether the new buy orders are willing to follow.
$MUBARAK : longs exit in a concentrated way. The current data only indicates liquidation has occurred; it cannot be used to declare that the market has bottomed.
Some longs are liquidated, some shorts are squeezed out—don’t combine them into a single market direction.
With this kind of data, first look at who is forced out.
$BTC : the shorts being squeezed are more clearly evident, but the first candle after the squeeze not being equal to the trend—only if the pullback fails to break down is it more meaningful.
$STRK : after the shorts are pushed out, the first segment is usually fast; the second segment depends on whether the new buy orders are willing to follow.
$MUBARAK : longs exit in a concentrated way. The current data only indicates liquidation has occurred; it cannot be used to declare that the market has bottomed.
Some longs are liquidated, some shorts are squeezed out—don’t combine them into a single market direction.
457
·
--
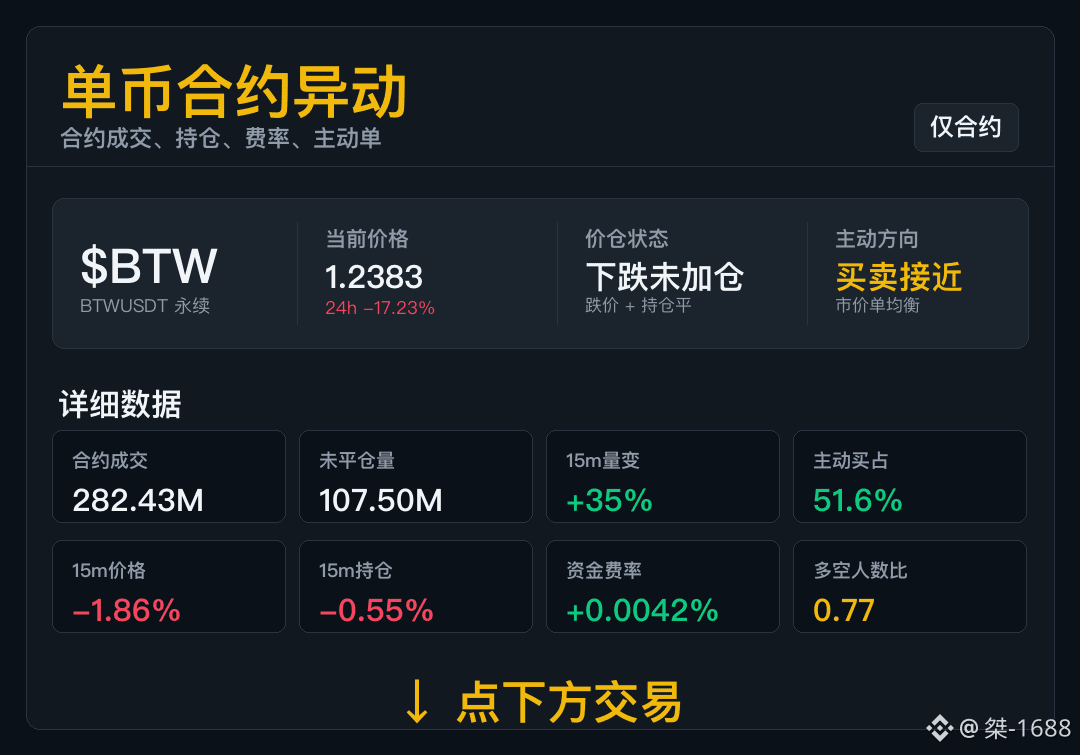
$BTW Sustainability fund has made a move this time. The change in positioning and the direction of market orders need to line up with the price.
On the 15m chart: price is -1.86%, open positions are -0.55%. This currently looks more like “a decline without adding shorts.” This isn’t the typical scenario of shorters piling in to suppress the market—first, we need to see whether the price can be held/recovered again.
Aggressive buys account for 51.6%, and buy/sell flow is close to balanced. The long-to-short ratio is 0.77—sentiment is slightly more bearish, but the fees/charging rates haven’t turned extremely harsh yet.
If positions can’t be topped up later, then this leg down may just be liquidity thinning that’s pulling the market lower.
$BTW Sustainability fund has made a move this time. The change in positioning and the direction of market orders need to line up with the price.
On the 15m chart: price is -1.86%, open positions are -0.55%. This currently looks more like “a decline without adding shorts.” This isn’t the typical scenario of shorters piling in to suppress the market—first, we need to see whether the price can be held/recovered again.
Aggressive buys account for 51.6%, and buy/sell flow is close to balanced. The long-to-short ratio is 0.77—sentiment is slightly more bearish, but the fees/charging rates haven’t turned extremely harsh yet.
If positions can’t be topped up later, then this leg down may just be liquidity thinning that’s pulling the market lower.
On the 15m chart: price is -1.86%, open positions are -0.55%. This currently looks more like “a decline without adding shorts.” This isn’t the typical scenario of shorters piling in to suppress the market—first, we need to see whether the price can be held/recovered again.
Aggressive buys account for 51.6%, and buy/sell flow is close to balanced. The long-to-short ratio is 0.77—sentiment is slightly more bearish, but the fees/charging rates haven’t turned extremely harsh yet.
If positions can’t be topped up later, then this leg down may just be liquidity thinning that’s pulling the market lower.
1
184
·
--
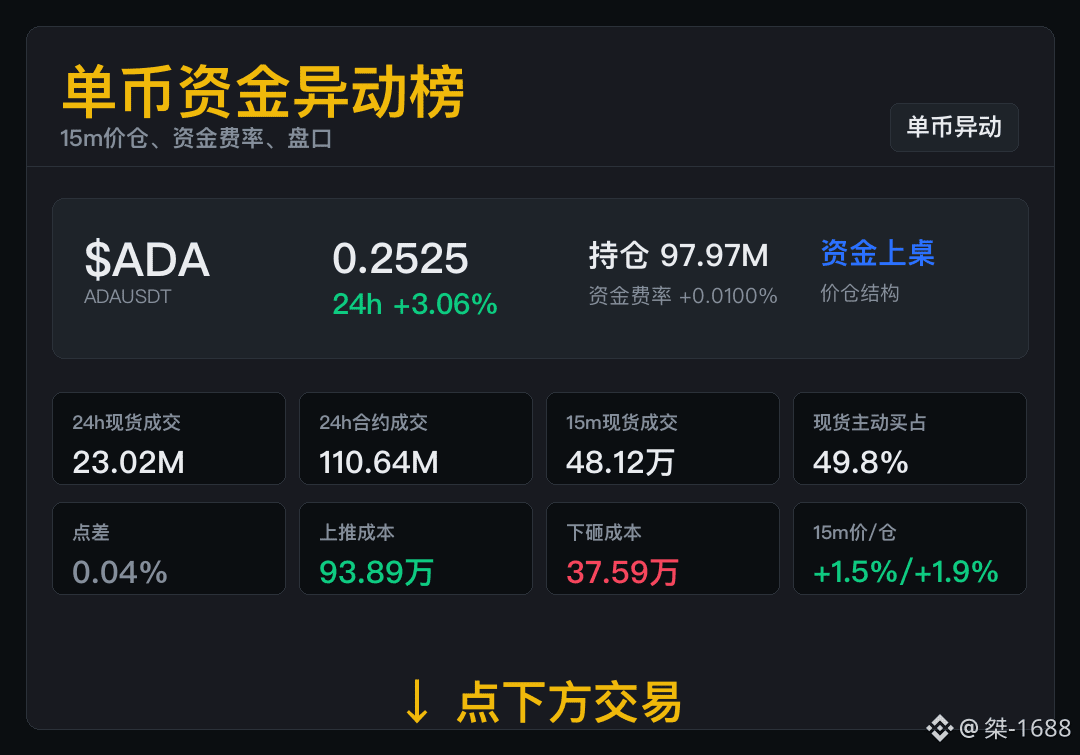
$ADA 15m The price and positions are both increasing, and the short-term structure is relatively strong.
Spot turnover 23.02M, futures turnover 110.64M; in the 15m timeframe, price-position +1.53% / +1.93%.
New positions are increasing in tandem with the price rise, and the short-term structure is still strengthening.
For the price to continue, positions and trading volume need to keep aligning.
$ADA 15m The price and positions are both increasing, and the short-term structure is relatively strong.
Spot turnover 23.02M, futures turnover 110.64M; in the 15m timeframe, price-position +1.53% / +1.93%.
New positions are increasing in tandem with the price rise, and the short-term structure is still strengthening.
For the price to continue, positions and trading volume need to keep aligning.
Spot turnover 23.02M, futures turnover 110.64M; in the 15m timeframe, price-position +1.53% / +1.93%.
New positions are increasing in tandem with the price rise, and the short-term structure is still strengthening.
For the price to continue, positions and trading volume need to keep aligning.
159
·
--
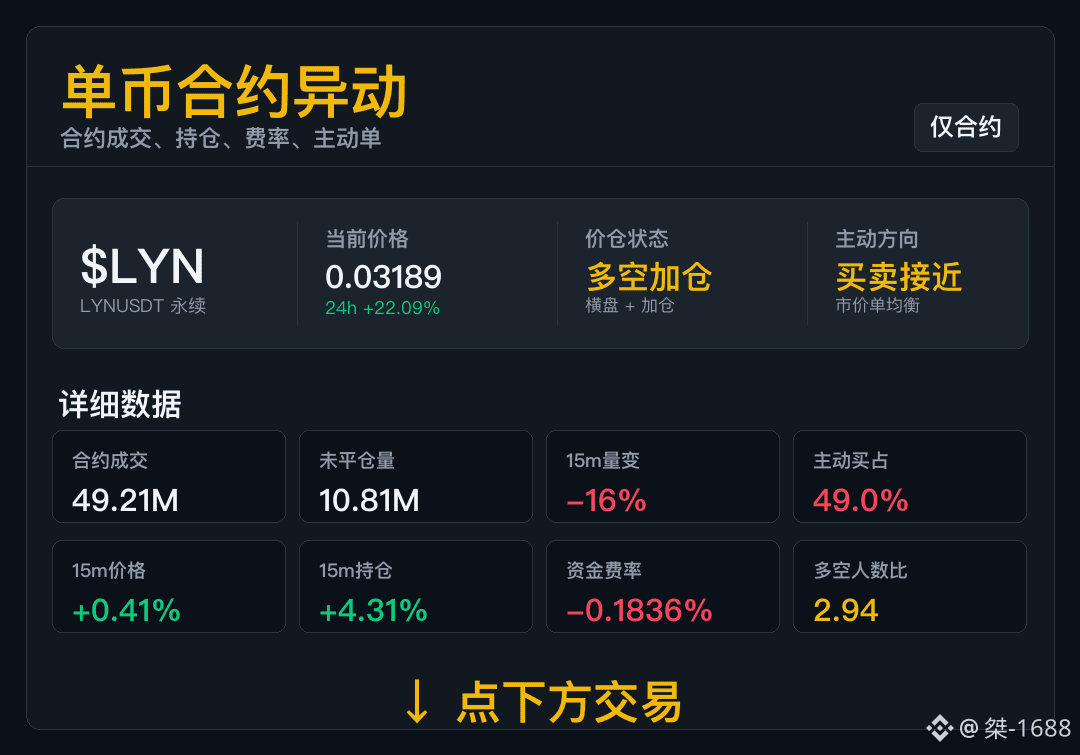
$LYN Now don’t just look at the candlestick chart; open positions and trading attitude explain more.
15m price +0.41%, open interest +4.31%. Right now it looks more like “both sides adding to positions”: both contract trades and open interest are amplifying together, the price is still under pressure, and whether the shorts are dominating depends on whether market sell orders can keep driving displacement.
Aggressive buys account for 49.0%; neither side is clearly overwhelming. If the funding rate drops into negative territory, be careful—later the shorts may side with a cover/close.
When the funding rate rises too quickly, the long side may not necessarily be wrong, but the position cost for longs is worsening.
$LYN Now don’t just look at the candlestick chart; open positions and trading attitude explain more.
15m price +0.41%, open interest +4.31%. Right now it looks more like “both sides adding to positions”: both contract trades and open interest are amplifying together, the price is still under pressure, and whether the shorts are dominating depends on whether market sell orders can keep driving displacement.
Aggressive buys account for 49.0%; neither side is clearly overwhelming. If the funding rate drops into negative territory, be careful—later the shorts may side with a cover/close.
When the funding rate rises too quickly, the long side may not necessarily be wrong, but the position cost for longs is worsening.
15m price +0.41%, open interest +4.31%. Right now it looks more like “both sides adding to positions”: both contract trades and open interest are amplifying together, the price is still under pressure, and whether the shorts are dominating depends on whether market sell orders can keep driving displacement.
Aggressive buys account for 49.0%; neither side is clearly overwhelming. If the funding rate drops into negative territory, be careful—later the shorts may side with a cover/close.
When the funding rate rises too quickly, the long side may not necessarily be wrong, but the position cost for longs is worsening.
203
·
--
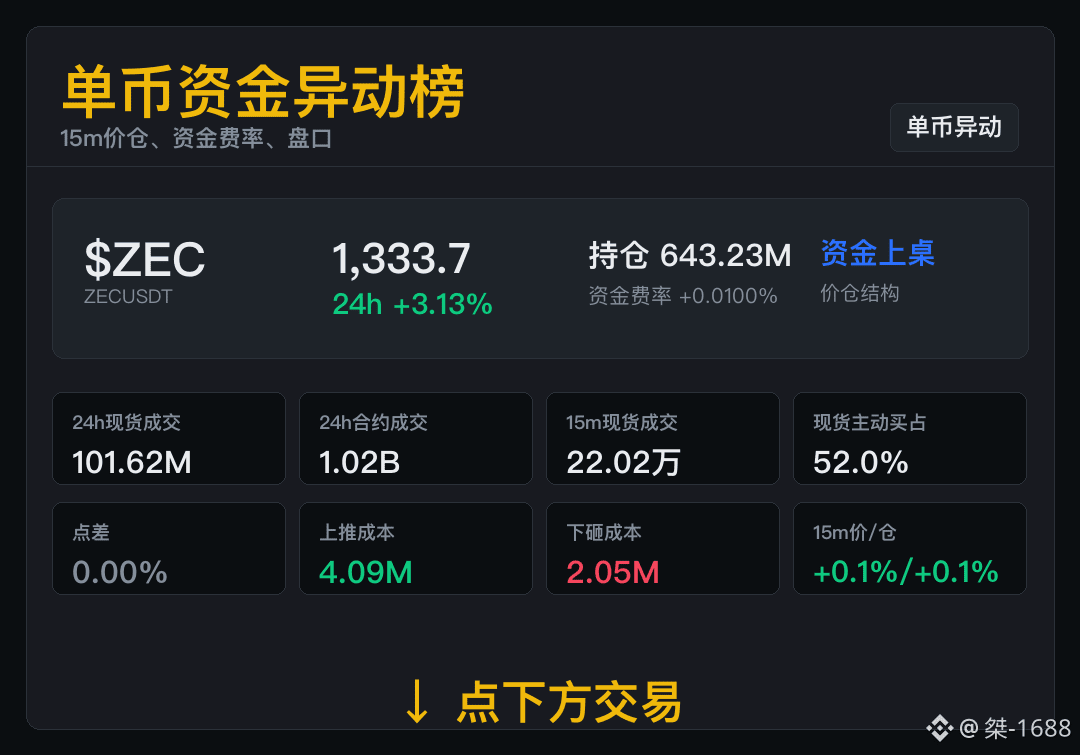
$ZEC price turnover strengthens while overall strength increases. Next, check whether trading volume can be maintained.
Spot trading in the last 24h: 101.62M; futures trading in the last 24h: 1.02B. Open interest in the last 15m: +0.07%.
New open interest is increasing in parallel with rising prices, and participation during the day continues to add.
As both trading volume and open interest keep increasing, the short-term structure has a foundation to continue.
$ZEC price turnover strengthens while overall strength increases. Next, check whether trading volume can be maintained.
Spot trading in the last 24h: 101.62M; futures trading in the last 24h: 1.02B. Open interest in the last 15m: +0.07%.
New open interest is increasing in parallel with rising prices, and participation during the day continues to add.
As both trading volume and open interest keep increasing, the short-term structure has a foundation to continue.
Spot trading in the last 24h: 101.62M; futures trading in the last 24h: 1.02B. Open interest in the last 15m: +0.07%.
New open interest is increasing in parallel with rising prices, and participation during the day continues to add.
As both trading volume and open interest keep increasing, the short-term structure has a foundation to continue.
166
·
--
First lay out the anomalies, and then see whether there’s any continuity later.
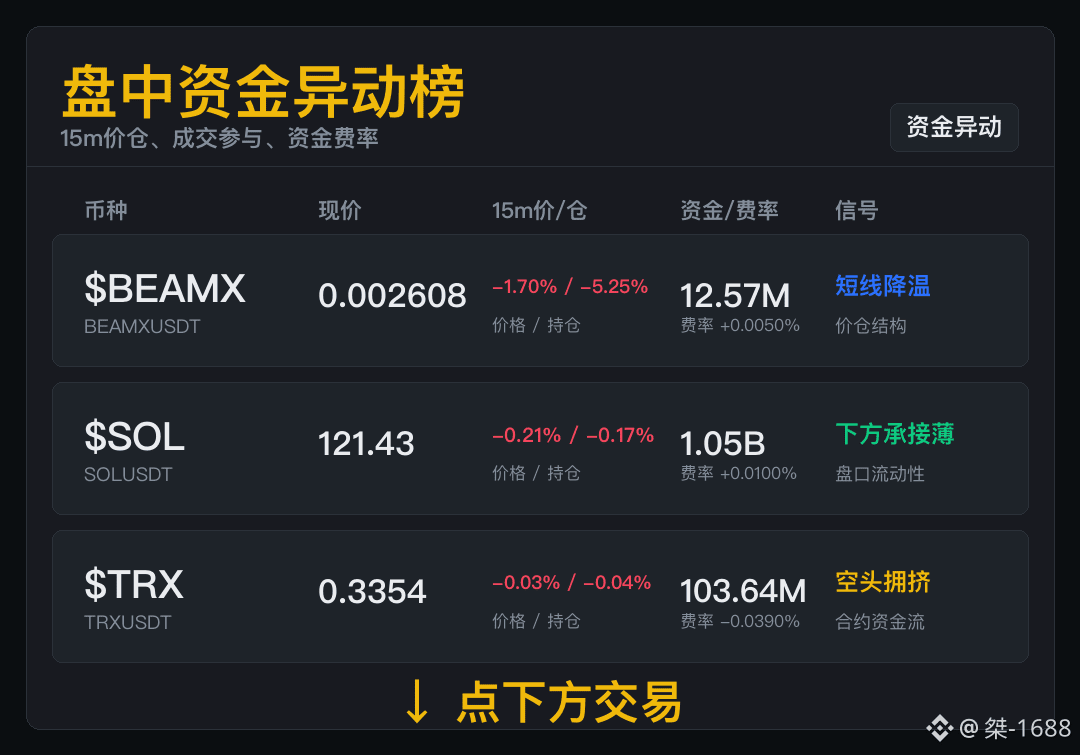
$BEAMX 15m spot成交 2.790 million, spread 0.08%. First, see whether spot can continue. People who just chased in—don’t rush to rescue; wait for the data to come back before acting. Don’t just look at it still being strong over 24h—some players have already started getting off in the short term.
$SOL 15m average entry price -0.21% / -0.17%, position 1.05B, funding rate +0.0100%. If you want to buy the dip, wait for the support to come back—don’t rush to grab the first bite. If the level below isn’t thick, think clearly about how you’ll get out if you’re wrong before chasing in.
$TRX During the session, first look at participation: 15m成交 0.3089 million, aggressive buys account for 33.0%, average entry price -0.03% / -0.04%. The more bearish people there are, the more you need to watch out for a sudden covering bid. It’s not that you can’t short—it's just that shorts aren’t as cheap anymore right now.
First lay out the anomalies, and then see whether there’s any continuity later.
$BEAMX 15m spot成交 2.790 million, spread 0.08%. First, see whether spot can continue. People who just chased in—don’t rush to rescue; wait for the data to come back before acting. Don’t just look at it still being strong over 24h—some players have already started getting off in the short term.
$SOL 15m average entry price -0.21% / -0.17%, position 1.05B, funding rate +0.0100%. If you want to buy the dip, wait for the support to come back—don’t rush to grab the first bite. If the level below isn’t thick, think clearly about how you’ll get out if you’re wrong before chasing in.
$TRX During the session, first look at participation: 15m成交 0.3089 million, aggressive buys account for 33.0%, average entry price -0.03% / -0.04%. The more bearish people there are, the more you need to watch out for a sudden covering bid. It’s not that you can’t short—it's just that shorts aren’t as cheap anymore right now.
$BEAMX 15m spot成交 2.790 million, spread 0.08%. First, see whether spot can continue. People who just chased in—don’t rush to rescue; wait for the data to come back before acting. Don’t just look at it still being strong over 24h—some players have already started getting off in the short term.
$SOL 15m average entry price -0.21% / -0.17%, position 1.05B, funding rate +0.0100%. If you want to buy the dip, wait for the support to come back—don’t rush to grab the first bite. If the level below isn’t thick, think clearly about how you’ll get out if you’re wrong before chasing in.
$TRX During the session, first look at participation: 15m成交 0.3089 million, aggressive buys account for 33.0%, average entry price -0.03% / -0.04%. The more bearish people there are, the more you need to watch out for a sudden covering bid. It’s not that you can’t short—it's just that shorts aren’t as cheap anymore right now.
134
·
--
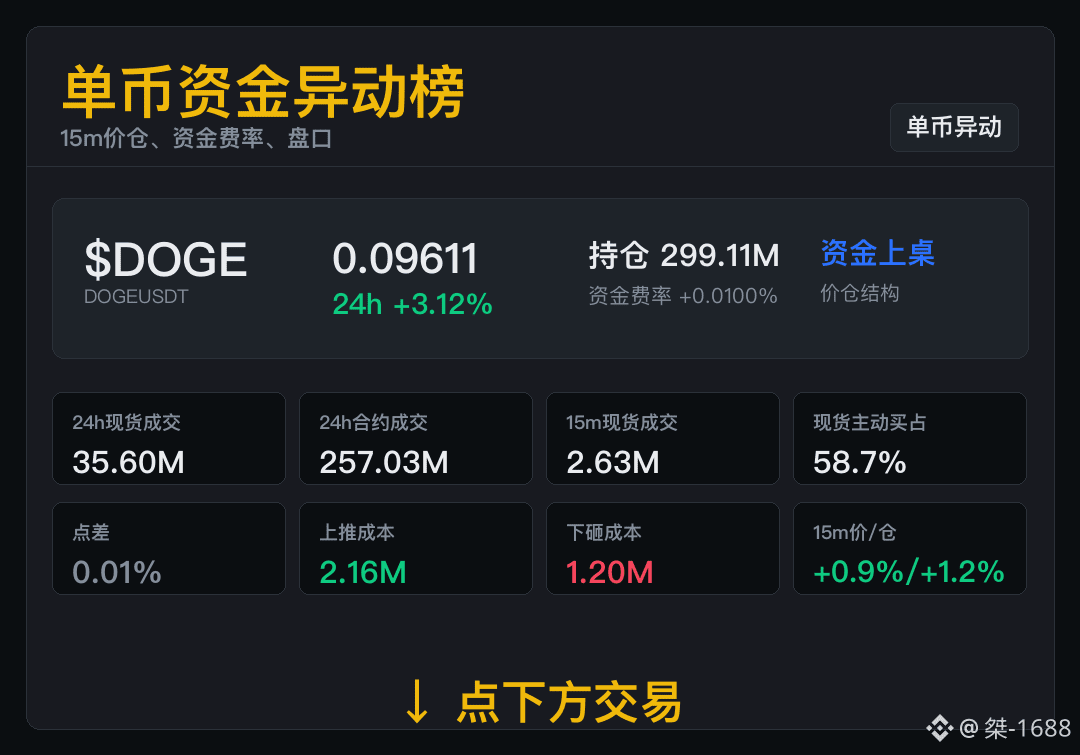
$DOGE This round of new participation is lifting the market; prices are rising in tandem.
Current price 0.09611, 15m price +0.88%, 15m open interest +1.22%.
Both price and open interest are increasing in the same direction, and short-term new participation is beginning to enter.
If the open-interest growth rate slows or trading weakens, the current signal should be downgraded.
$DOGE This round of new participation is lifting the market; prices are rising in tandem.
Current price 0.09611, 15m price +0.88%, 15m open interest +1.22%.
Both price and open interest are increasing in the same direction, and short-term new participation is beginning to enter.
If the open-interest growth rate slows or trading weakens, the current signal should be downgraded.
Current price 0.09611, 15m price +0.88%, 15m open interest +1.22%.
Both price and open interest are increasing in the same direction, and short-term new participation is beginning to enter.
If the open-interest growth rate slows or trading weakens, the current signal should be downgraded.
120
·
--
There are many signals with activity, but only those supported by data are worth putting up front.
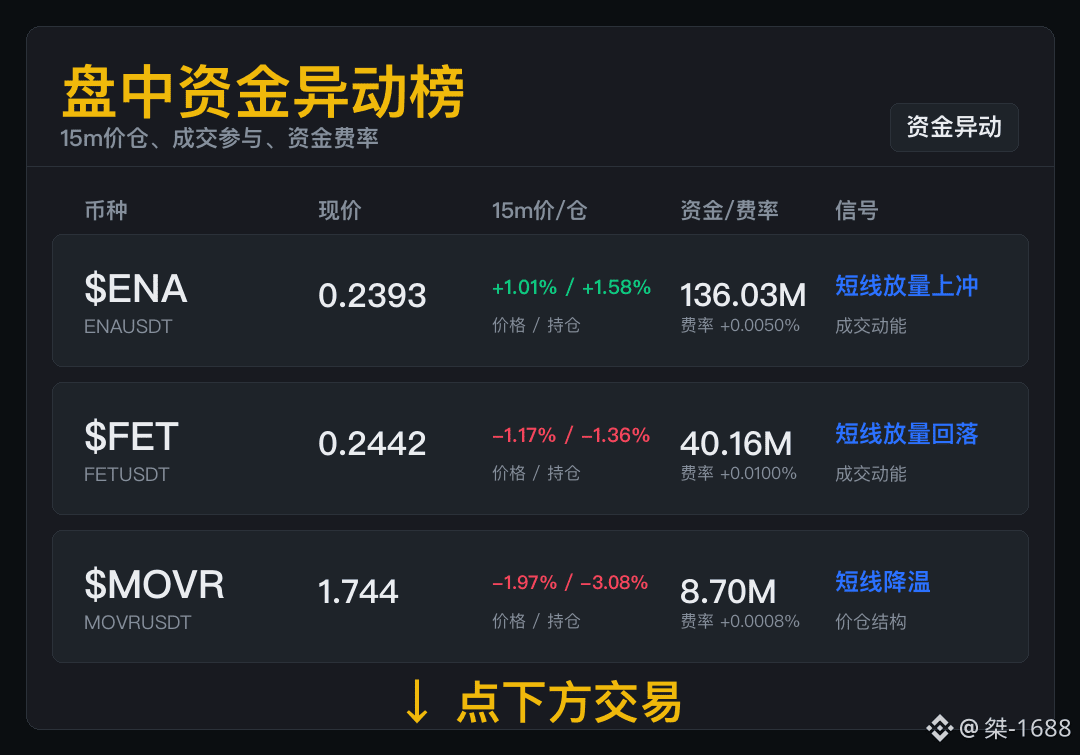
$ENA 15m price & buy/sell inventory +1.01% / +1.58%, volume 1.57M, with active buys accounting for 62.8%. If you’re looking for opportunities, you can watch it, but don’t treat “heat” as direction. Heat attracts people; volume keeps talented traders.
$FET During the session, first look at participation: 15m volume 900,800, with active buys at 45.6%, price & buy/sell inventory -1.17% / -1.36%. “Hot” is an entry point, not the answer. Don’t treat the noise as a trading system. There’s some momentum, but it doesn’t mean you should blindly rush in.
$MOVR For whether short-term funds are truly entering, first check the 15m price & buy/sell inventory -1.97% / -3.08% and volume 388,300. If you want to catch a pullback, you can watch it—but don’t get too carried away by the first rebound. Let both price and positioning drop first; then have the next segment’s volume speak.
There are many signals with activity, but only those supported by data are worth putting up front.
$ENA 15m price & buy/sell inventory +1.01% / +1.58%, volume 1.57M, with active buys accounting for 62.8%. If you’re looking for opportunities, you can watch it, but don’t treat “heat” as direction. Heat attracts people; volume keeps talented traders.
$FET During the session, first look at participation: 15m volume 900,800, with active buys at 45.6%, price & buy/sell inventory -1.17% / -1.36%. “Hot” is an entry point, not the answer. Don’t treat the noise as a trading system. There’s some momentum, but it doesn’t mean you should blindly rush in.
$MOVR For whether short-term funds are truly entering, first check the 15m price & buy/sell inventory -1.97% / -3.08% and volume 388,300. If you want to catch a pullback, you can watch it—but don’t get too carried away by the first rebound. Let both price and positioning drop first; then have the next segment’s volume speak.
$ENA 15m price & buy/sell inventory +1.01% / +1.58%, volume 1.57M, with active buys accounting for 62.8%. If you’re looking for opportunities, you can watch it, but don’t treat “heat” as direction. Heat attracts people; volume keeps talented traders.
$FET During the session, first look at participation: 15m volume 900,800, with active buys at 45.6%, price & buy/sell inventory -1.17% / -1.36%. “Hot” is an entry point, not the answer. Don’t treat the noise as a trading system. There’s some momentum, but it doesn’t mean you should blindly rush in.
$MOVR For whether short-term funds are truly entering, first check the 15m price & buy/sell inventory -1.97% / -3.08% and volume 388,300. If you want to catch a pullback, you can watch it—but don’t get too carried away by the first rebound. Let both price and positioning drop first; then have the next segment’s volume speak.
1
455
·
--
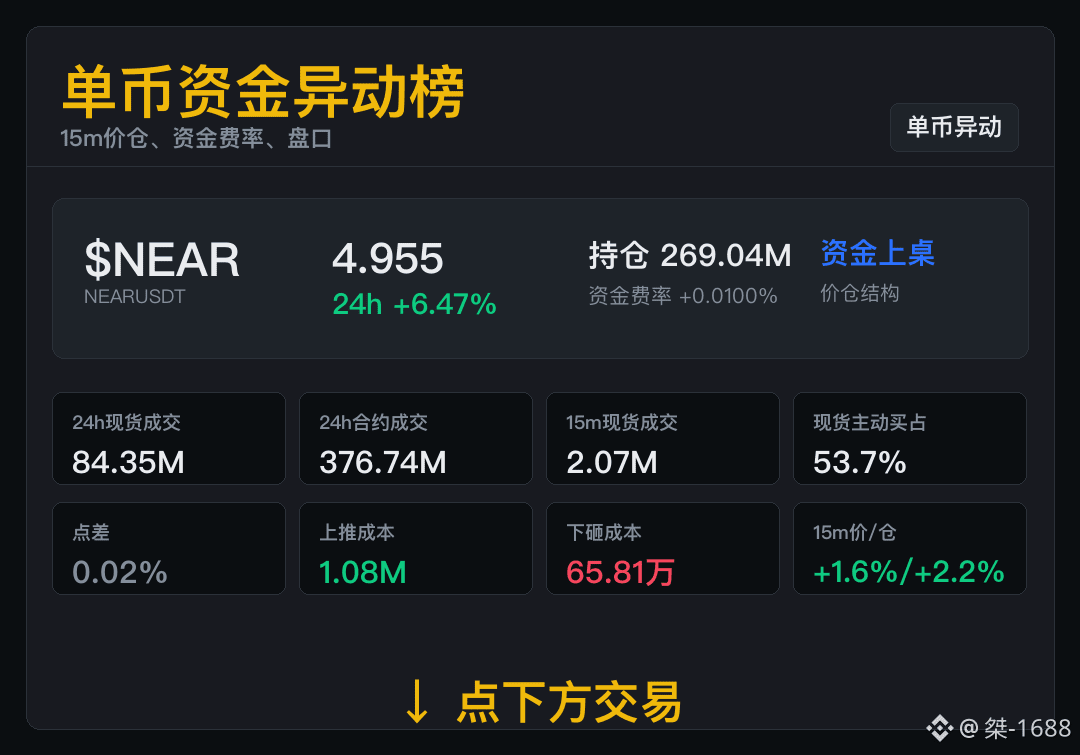
$NEAR Short-term prices are rising along with open positions, and capital participation is increasing.
In the 15m spot market: turnover is 2.07M, price +1.58%, and open positions +2.23%.
As price moves higher, open positions expand as well—short-term participation is strengthening.
Next, watch whether the price and positions can continue moving in the same direction. If trading volume weakens, lower your attention level first.
$NEAR Short-term prices are rising along with open positions, and capital participation is increasing.
In the 15m spot market: turnover is 2.07M, price +1.58%, and open positions +2.23%.
As price moves higher, open positions expand as well—short-term participation is strengthening.
Next, watch whether the price and positions can continue moving in the same direction. If trading volume weakens, lower your attention level first.
In the 15m spot market: turnover is 2.07M, price +1.58%, and open positions +2.23%.
As price moves higher, open positions expand as well—short-term participation is strengthening.
Next, watch whether the price and positions can continue moving in the same direction. If trading volume weakens, lower your attention level first.
168
·
--
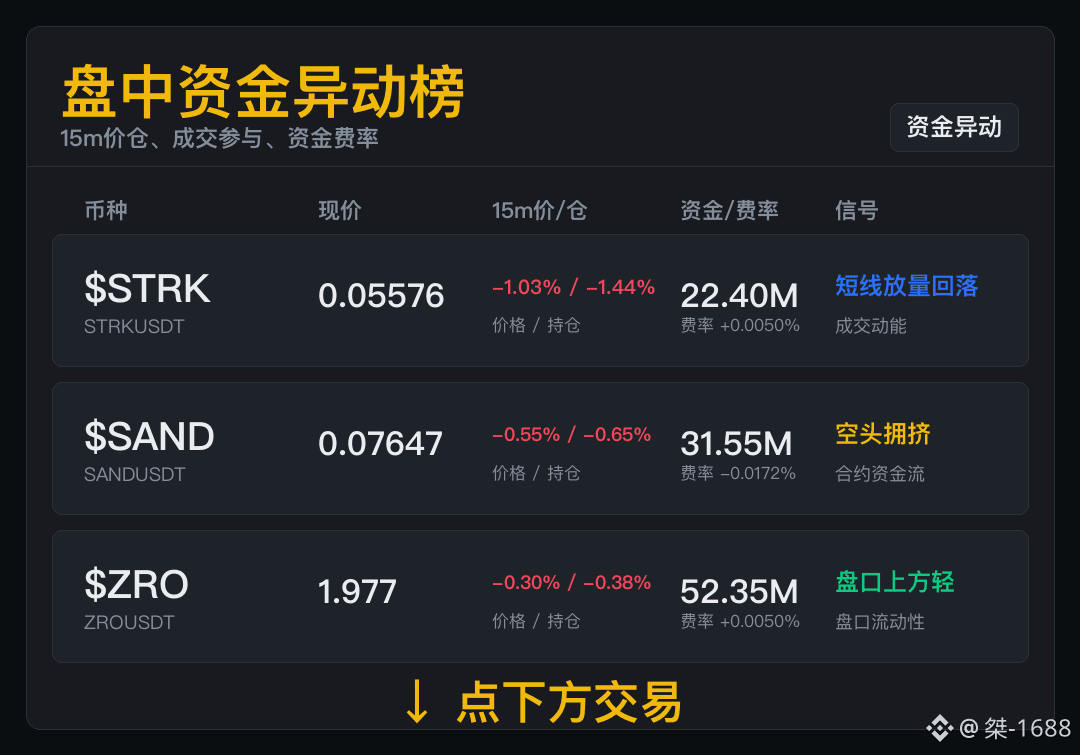
Don’t just look at the first glance for intraday anomalies—there needs to be at least one connection line between price, positioning, and the order book.
$STRK 15m price/position -1.03% / -1.44%, holding 22.40M, fee rate +0.0050%. Popularity in the venue is an advantage, but what you really need to watch is who picks up the next move. High volume in the trades means someone is pushing, but being popular isn’t necessarily the direction—what matters next is whether the capital stays.
$SAND For short-term capital, whether it truly entered the market depends first on the 15m price/position -0.55% / -0.65% and成交 volume of 2.44M. Those holding short positions should first see whether they can still keep it down; if they can’t, don’t stubbornly force it—don’t “carry it” through a rebound. Many people being bearish doesn’t mean it’s the bottom, and chasing shorts isn’t that cheap anymore.
$ZRO 15m spot traded volume 139,500, spread 0.05%. First, watch for spot to provide the follow-through. When the order book is light, the biggest fear is reacting too quickly—watch the volume before you click. Pushing up with low costs is just the road conditions; trade follow-through is the accelerator.
Don’t just look at the first glance for intraday anomalies—there needs to be at least one connection line between price, positioning, and the order book.
$STRK 15m price/position -1.03% / -1.44%, holding 22.40M, fee rate +0.0050%. Popularity in the venue is an advantage, but what you really need to watch is who picks up the next move. High volume in the trades means someone is pushing, but being popular isn’t necessarily the direction—what matters next is whether the capital stays.
$SAND For short-term capital, whether it truly entered the market depends first on the 15m price/position -0.55% / -0.65% and成交 volume of 2.44M. Those holding short positions should first see whether they can still keep it down; if they can’t, don’t stubbornly force it—don’t “carry it” through a rebound. Many people being bearish doesn’t mean it’s the bottom, and chasing shorts isn’t that cheap anymore.
$ZRO 15m spot traded volume 139,500, spread 0.05%. First, watch for spot to provide the follow-through. When the order book is light, the biggest fear is reacting too quickly—watch the volume before you click. Pushing up with low costs is just the road conditions; trade follow-through is the accelerator.
$STRK 15m price/position -1.03% / -1.44%, holding 22.40M, fee rate +0.0050%. Popularity in the venue is an advantage, but what you really need to watch is who picks up the next move. High volume in the trades means someone is pushing, but being popular isn’t necessarily the direction—what matters next is whether the capital stays.
$SAND For short-term capital, whether it truly entered the market depends first on the 15m price/position -0.55% / -0.65% and成交 volume of 2.44M. Those holding short positions should first see whether they can still keep it down; if they can’t, don’t stubbornly force it—don’t “carry it” through a rebound. Many people being bearish doesn’t mean it’s the bottom, and chasing shorts isn’t that cheap anymore.
$ZRO 15m spot traded volume 139,500, spread 0.05%. First, watch for spot to provide the follow-through. When the order book is light, the biggest fear is reacting too quickly—watch the volume before you click. Pushing up with low costs is just the road conditions; trade follow-through is the accelerator.
202
·
--
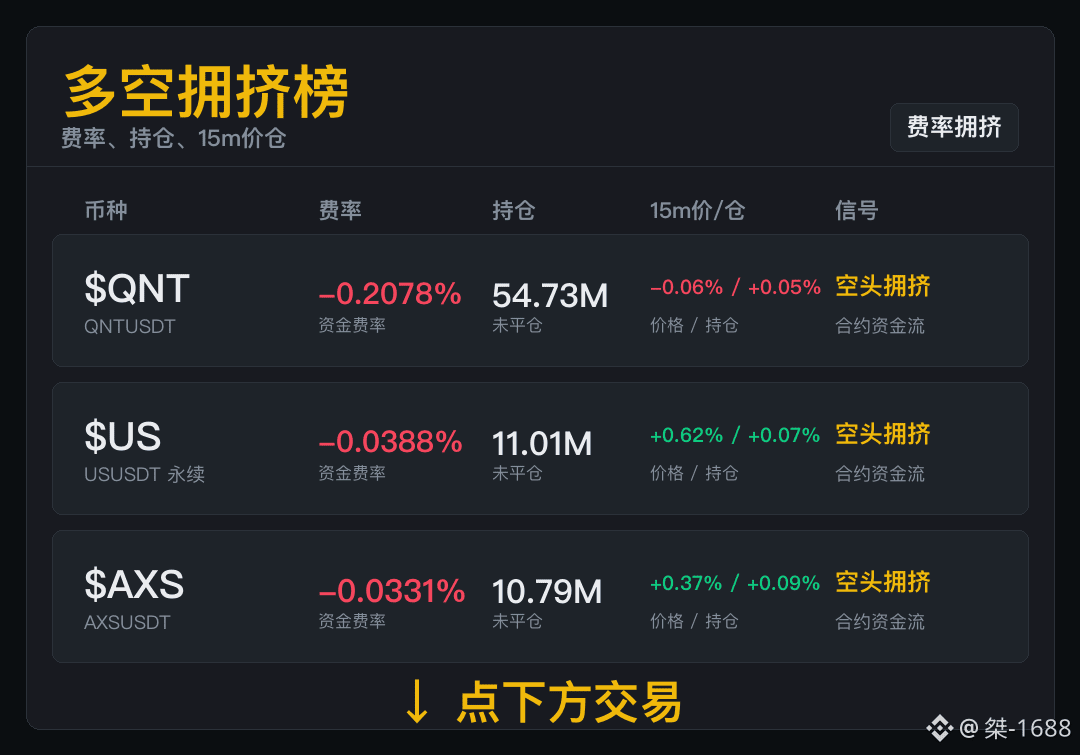
The more consistent the positions are, the more likely it is that when the market reverses, they will end up stepping on each other; first, identify the crowded area.
$QNT : Rate -0.2078%, with open interest/position of 54.73M. For this kind of setup, the key thing is to see whether positions continue to build up. Those looking to catch the rebound should move a bit slower—first see whether there’s willingness to step in and stand up in the market. It’s not necessarily going to go up; on the short side, things are already a bit crowded.
$US : When it’s crowded, first look at three things: Rate -0.0388%, positions 11.01M, and the 15m price/position change +0.62% / +0.07%. This kind of book is easiest to make shorts think it can still drop—then one sharp rebound (a single counter-pull) throws everything off. Shorts are paying to pressure the market; if they can’t hold it down, someone may run first.
$AXS : The contract “temperature” here is: Rate -0.0331%, positions 10.79M, short-term price/position +0.37% / +0.09%. With this kind of market, once the shorts loosen their grip, the price becomes more sensitive than you’d expect. Shorts aren’t without strength; it’s just that to keep pressing down now, they need a much larger sell order.
The more consistent the positions are, the more likely it is that when the market reverses, they will end up stepping on each other; first, identify the crowded area.
$QNT : Rate -0.2078%, with open interest/position of 54.73M. For this kind of setup, the key thing is to see whether positions continue to build up. Those looking to catch the rebound should move a bit slower—first see whether there’s willingness to step in and stand up in the market. It’s not necessarily going to go up; on the short side, things are already a bit crowded.
$US : When it’s crowded, first look at three things: Rate -0.0388%, positions 11.01M, and the 15m price/position change +0.62% / +0.07%. This kind of book is easiest to make shorts think it can still drop—then one sharp rebound (a single counter-pull) throws everything off. Shorts are paying to pressure the market; if they can’t hold it down, someone may run first.
$AXS : The contract “temperature” here is: Rate -0.0331%, positions 10.79M, short-term price/position +0.37% / +0.09%. With this kind of market, once the shorts loosen their grip, the price becomes more sensitive than you’d expect. Shorts aren’t without strength; it’s just that to keep pressing down now, they need a much larger sell order.
$QNT : Rate -0.2078%, with open interest/position of 54.73M. For this kind of setup, the key thing is to see whether positions continue to build up. Those looking to catch the rebound should move a bit slower—first see whether there’s willingness to step in and stand up in the market. It’s not necessarily going to go up; on the short side, things are already a bit crowded.
$US : When it’s crowded, first look at three things: Rate -0.0388%, positions 11.01M, and the 15m price/position change +0.62% / +0.07%. This kind of book is easiest to make shorts think it can still drop—then one sharp rebound (a single counter-pull) throws everything off. Shorts are paying to pressure the market; if they can’t hold it down, someone may run first.
$AXS : The contract “temperature” here is: Rate -0.0331%, positions 10.79M, short-term price/position +0.37% / +0.09%. With this kind of market, once the shorts loosen their grip, the price becomes more sensitive than you’d expect. Shorts aren’t without strength; it’s just that to keep pressing down now, they need a much larger sell order.
522
·
--
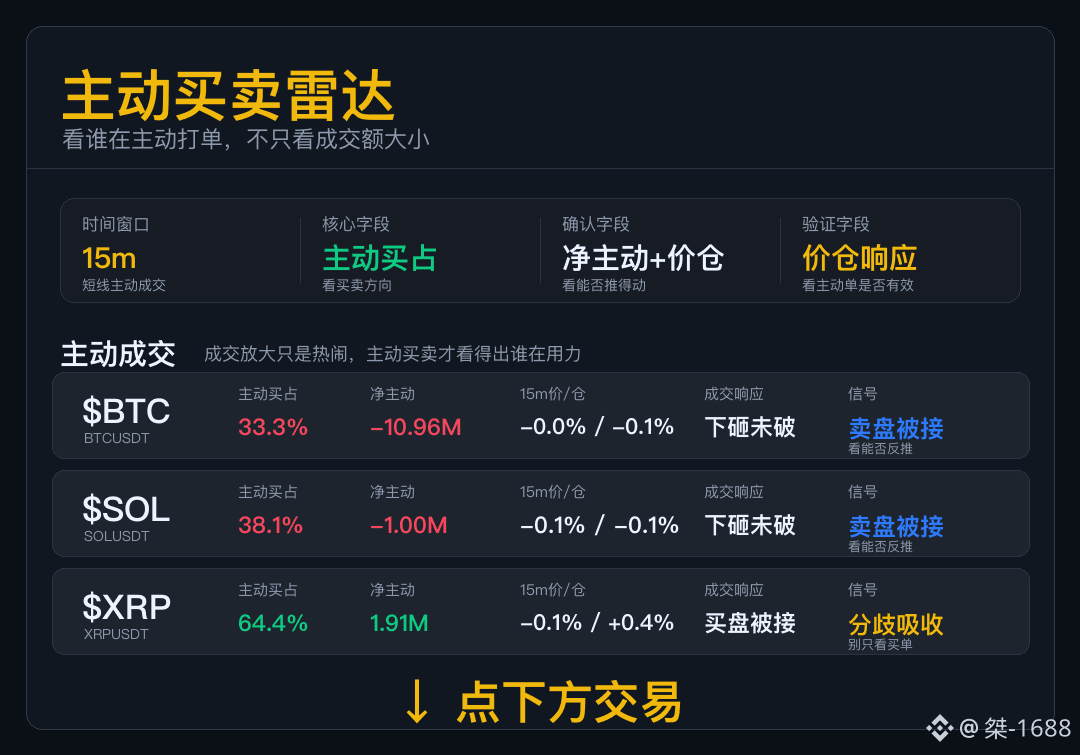
Active Buy/Sell Radar
Don’t just look at the trading volume. Today, focus mainly on whether the aggressive orders can push the price action.
$BTC had sell-side aggressive orders, but the price didn’t break through on the downside. This suggests the buy-side support underneath hasn’t dried up.
$SOL shows continuous market sell orders, yet the price is still being held sideways. This indicates buyers below are willing to take.
$XRP has aggressive on the buy side, but the efficiency of pushing the price is average. Later, wait until the price truly breaks upward before increasing the weight.
This is not the same playbook. Watch coin by coin to see who can push effectively and who gets absorbed.
Active Buy/Sell Radar
Don’t just look at the trading volume. Today, focus mainly on whether the aggressive orders can push the price action.
$BTC had sell-side aggressive orders, but the price didn’t break through on the downside. This suggests the buy-side support underneath hasn’t dried up.
$SOL shows continuous market sell orders, yet the price is still being held sideways. This indicates buyers below are willing to take.
$XRP has aggressive on the buy side, but the efficiency of pushing the price is average. Later, wait until the price truly breaks upward before increasing the weight.
This is not the same playbook. Watch coin by coin to see who can push effectively and who gets absorbed.
Don’t just look at the trading volume. Today, focus mainly on whether the aggressive orders can push the price action.
$BTC had sell-side aggressive orders, but the price didn’t break through on the downside. This suggests the buy-side support underneath hasn’t dried up.
$SOL shows continuous market sell orders, yet the price is still being held sideways. This indicates buyers below are willing to take.
$XRP has aggressive on the buy side, but the efficiency of pushing the price is average. Later, wait until the price truly breaks upward before increasing the weight.
This is not the same playbook. Watch coin by coin to see who can push effectively and who gets absorbed.
197
·
--
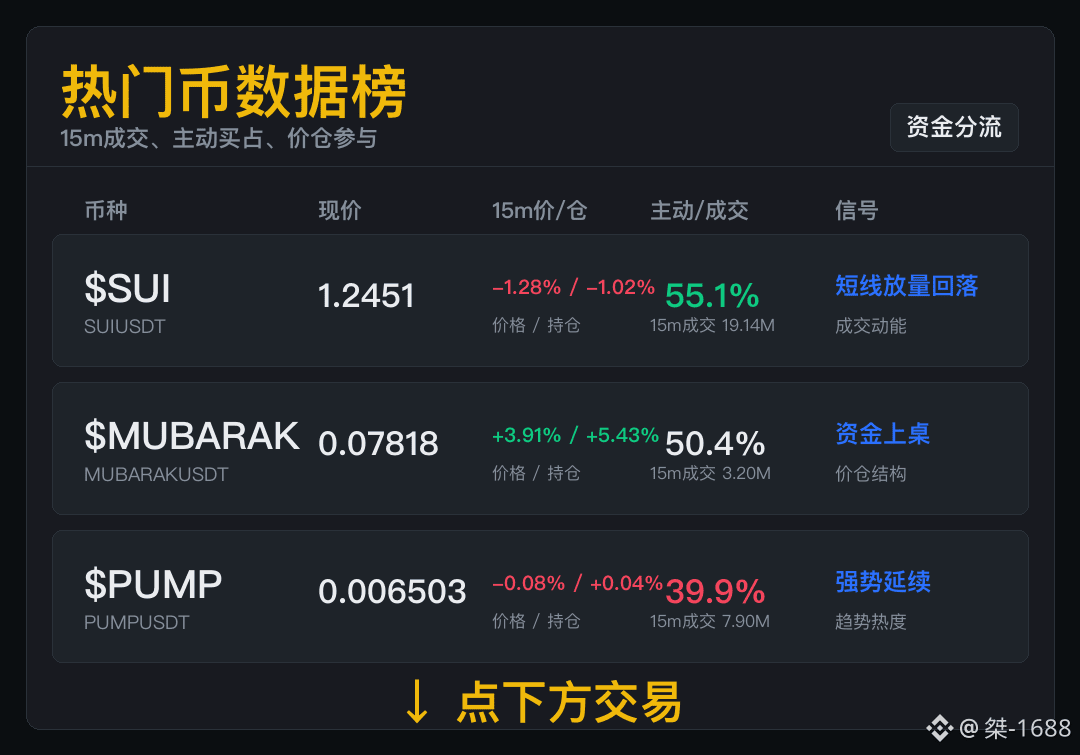
It’s easy to get confused by how stocks rise and fall on a single screen—first look at the participation of funds in the few “harder” signals.
$SUI 15m Trading volume 19.14M; active buy accounts for 55.1%, price position -1.28% / -1.02%. Popularity is the lamp, volume is the electricity—when the power is cut, the lamp goes out. Being “hot” is the entry; whether you can actually make a move depends on the next segment of trading.
$MUBARAK For short-term trades, first look at the trading volume: 3.20M; active buy accounts for 50.4%. Then look at the price position: +3.91% / +5.43%. This kind of market you can watch, but don’t treat the first wave as the last bus. See whether the money has entered first; then, when it pulls back, see whether the money is willing to stay.
$PUMP The focus of this round is 15m participation: trading volume 7.90M; active buy accounts for 39.9%; price position -0.08% / +0.04%. Anyone wanting to chase should slow down—strength doesn’t mind waiting; the danger is chasing after volume has already shrunk. Whether it can keep moving depends more on the quality of the pullback than on a single bullish candle.
It’s easy to get confused by how stocks rise and fall on a single screen—first look at the participation of funds in the few “harder” signals.
$SUI 15m Trading volume 19.14M; active buy accounts for 55.1%, price position -1.28% / -1.02%. Popularity is the lamp, volume is the electricity—when the power is cut, the lamp goes out. Being “hot” is the entry; whether you can actually make a move depends on the next segment of trading.
$MUBARAK For short-term trades, first look at the trading volume: 3.20M; active buy accounts for 50.4%. Then look at the price position: +3.91% / +5.43%. This kind of market you can watch, but don’t treat the first wave as the last bus. See whether the money has entered first; then, when it pulls back, see whether the money is willing to stay.
$PUMP The focus of this round is 15m participation: trading volume 7.90M; active buy accounts for 39.9%; price position -0.08% / +0.04%. Anyone wanting to chase should slow down—strength doesn’t mind waiting; the danger is chasing after volume has already shrunk. Whether it can keep moving depends more on the quality of the pullback than on a single bullish candle.
$SUI 15m Trading volume 19.14M; active buy accounts for 55.1%, price position -1.28% / -1.02%. Popularity is the lamp, volume is the electricity—when the power is cut, the lamp goes out. Being “hot” is the entry; whether you can actually make a move depends on the next segment of trading.
$MUBARAK For short-term trades, first look at the trading volume: 3.20M; active buy accounts for 50.4%. Then look at the price position: +3.91% / +5.43%. This kind of market you can watch, but don’t treat the first wave as the last bus. See whether the money has entered first; then, when it pulls back, see whether the money is willing to stay.
$PUMP The focus of this round is 15m participation: trading volume 7.90M; active buy accounts for 39.9%; price position -0.08% / +0.04%. Anyone wanting to chase should slow down—strength doesn’t mind waiting; the danger is chasing after volume has already shrunk. Whether it can keep moving depends more on the quality of the pullback than on a single bullish candle.
393
·
--
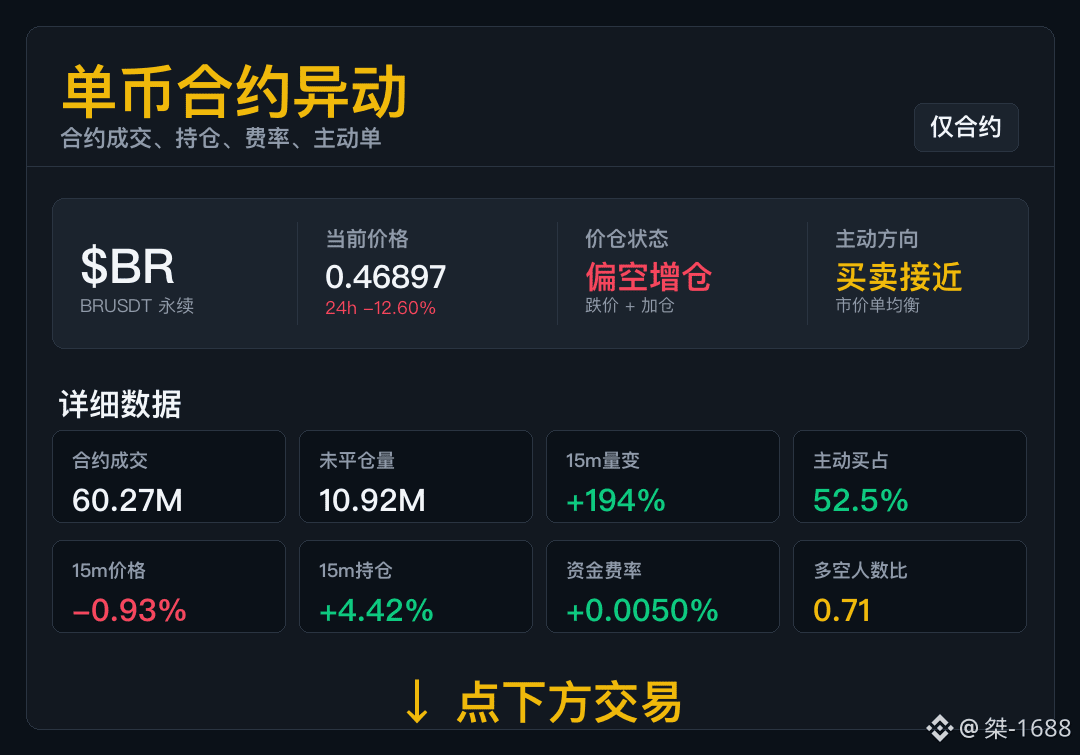
$BR This time, the perpetual positioning (永续盘) has taken action. The position changes and the direction of market orders need to line up with the price.
On the 15m chart: price -0.93%, holdings +4.42%. It now looks more like an “increase in short exposure”: the 15m price is falling while positions are adding—new positions are continuing to enter during the pullback. The evidence that active buying is dominant when buy-side occupancy is relatively low (and that sellers are pressing down) is stronger...
Active buy occupancy is 52.5%, and the market orders are fairly balanced. The long-vs-short participant ratio is 0.71; sentiment is more bearish, but the fee rate is not yet extreme.
Active sell occupancy has stayed relatively high. Only then does the logic for adding new shorts and pressing down hold water.
$BR This time, the perpetual positioning (永续盘) has taken action. The position changes and the direction of market orders need to line up with the price.
On the 15m chart: price -0.93%, holdings +4.42%. It now looks more like an “increase in short exposure”: the 15m price is falling while positions are adding—new positions are continuing to enter during the pullback. The evidence that active buying is dominant when buy-side occupancy is relatively low (and that sellers are pressing down) is stronger...
Active buy occupancy is 52.5%, and the market orders are fairly balanced. The long-vs-short participant ratio is 0.71; sentiment is more bearish, but the fee rate is not yet extreme.
Active sell occupancy has stayed relatively high. Only then does the logic for adding new shorts and pressing down hold water.
On the 15m chart: price -0.93%, holdings +4.42%. It now looks more like an “increase in short exposure”: the 15m price is falling while positions are adding—new positions are continuing to enter during the pullback. The evidence that active buying is dominant when buy-side occupancy is relatively low (and that sellers are pressing down) is stronger...
Active buy occupancy is 52.5%, and the market orders are fairly balanced. The long-vs-short participant ratio is 0.71; sentiment is more bearish, but the fee rate is not yet extreme.
Active sell occupancy has stayed relatively high. Only then does the logic for adding new shorts and pressing down hold water.
1
196
·
--
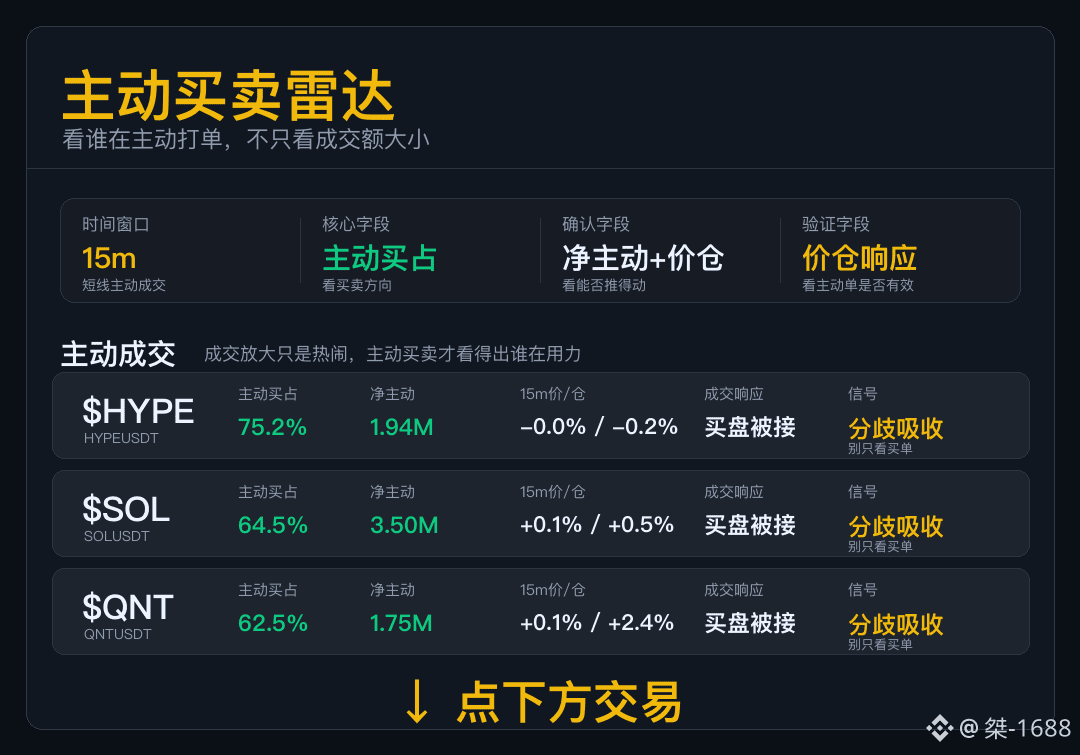
Active buy-sell radar
Don’t just look at the trading volume. Today’s key is whether the active orders can push the market.
Buyer $HYPE paid for trades, but it didn’t move the distance. The cost-effectiveness of continuing to chase higher prices is declining.
Buyer $SOL ’s active buy share isn’t bad, but the order book didn’t follow through. First, see whether the next segment can absorb the overhead pressure.
Buyer $QNT is actively buying, but the price-pushing efficiency is average. Later, wait for the price to truly break out before increasing the weight.
Only when the price is genuinely lifted out of the range can it show that the sell orders above are being digested.
Active buy-sell radar
Don’t just look at the trading volume. Today’s key is whether the active orders can push the market.
Buyer $HYPE paid for trades, but it didn’t move the distance. The cost-effectiveness of continuing to chase higher prices is declining.
Buyer $SOL ’s active buy share isn’t bad, but the order book didn’t follow through. First, see whether the next segment can absorb the overhead pressure.
Buyer $QNT is actively buying, but the price-pushing efficiency is average. Later, wait for the price to truly break out before increasing the weight.
Only when the price is genuinely lifted out of the range can it show that the sell orders above are being digested.
Don’t just look at the trading volume. Today’s key is whether the active orders can push the market.
Buyer $HYPE paid for trades, but it didn’t move the distance. The cost-effectiveness of continuing to chase higher prices is declining.
Buyer $SOL ’s active buy share isn’t bad, but the order book didn’t follow through. First, see whether the next segment can absorb the overhead pressure.
Buyer $QNT is actively buying, but the price-pushing efficiency is average. Later, wait for the price to truly break out before increasing the weight.
Only when the price is genuinely lifted out of the range can it show that the sell orders above are being digested.
453
·
--
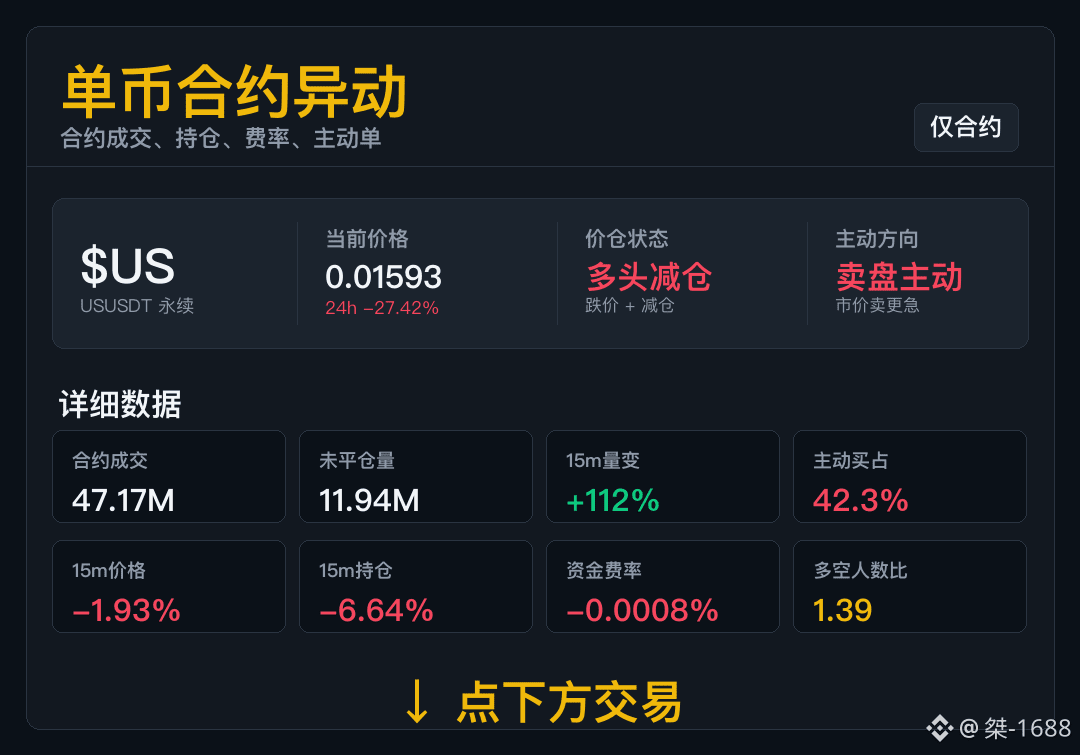
$US First, set the涨跌 (up/down) aside—see clearly who is adding to positions and who is withdrawing.
In the 15m timeframe, price -1.93%, holdings -6.64%. This currently looks more like “longs reducing positions”: the position size is being cut, and the price moves lower along with it—more like the longs themselves loosening their grip.
Aggressive buying accounts for 42.3%, and selling pressure is more willing to transact actively; the long-to-short count ratio is 1.39—there still isn’t a fee-rate squeeze of the order book.
Just because deleveraging is over doesn’t mean a reversal. Active buying and selling need to be given a new direction again.
$US First, set the涨跌 (up/down) aside—see clearly who is adding to positions and who is withdrawing.
In the 15m timeframe, price -1.93%, holdings -6.64%. This currently looks more like “longs reducing positions”: the position size is being cut, and the price moves lower along with it—more like the longs themselves loosening their grip.
Aggressive buying accounts for 42.3%, and selling pressure is more willing to transact actively; the long-to-short count ratio is 1.39—there still isn’t a fee-rate squeeze of the order book.
Just because deleveraging is over doesn’t mean a reversal. Active buying and selling need to be given a new direction again.
In the 15m timeframe, price -1.93%, holdings -6.64%. This currently looks more like “longs reducing positions”: the position size is being cut, and the price moves lower along with it—more like the longs themselves loosening their grip.
Aggressive buying accounts for 42.3%, and selling pressure is more willing to transact actively; the long-to-short count ratio is 1.39—there still isn’t a fee-rate squeeze of the order book.
Just because deleveraging is over doesn’t mean a reversal. Active buying and selling need to be given a new direction again.
290
·
--
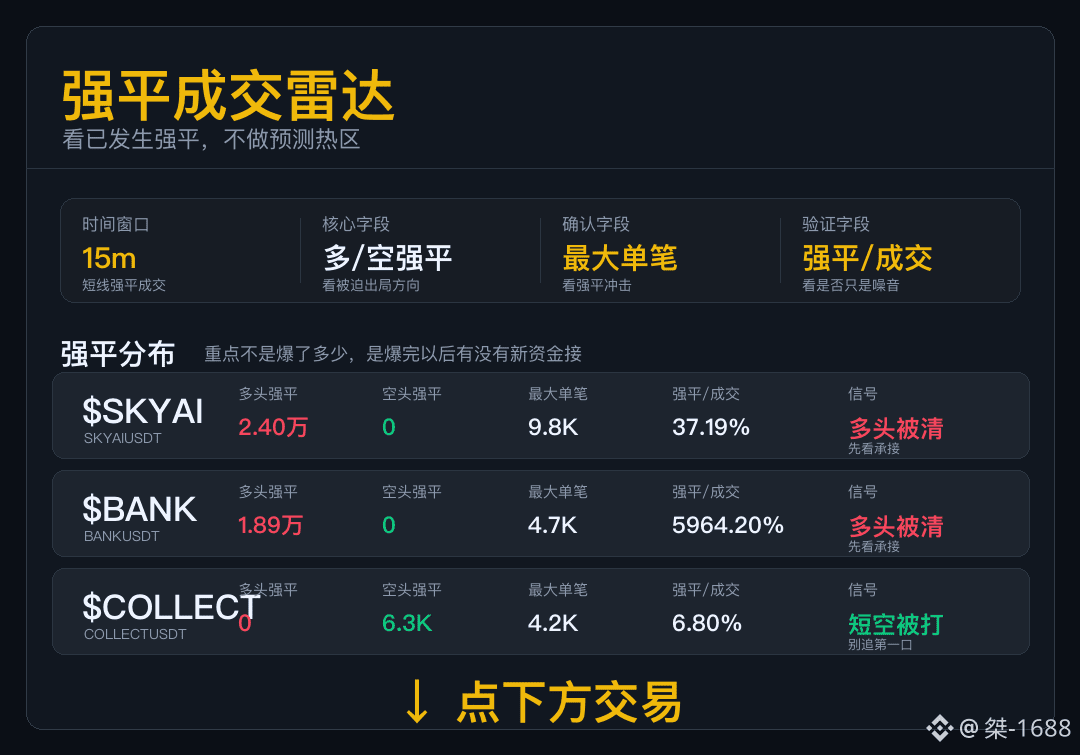
Strong flat-swap thunder radar
For data like this, first look at who is forced out.
$SKYAI long positions concentrated in liquidation; the current data can only indicate that liquidation has occurred, but it cannot announce a bottom for the market.
$BANK this segment shows longs being cleared first; if subsequent trades can’t keep flowing, then a rebound may easily turn into a weak “repair.”
$COLLECT this segment mainly reflects shorts passively covering; don’t treat the speed at which they get squeezed out as a trend directly.
Some longs get cleared and some shorts get squeezed out—don’t combine them into a single market direction.
Strong flat-swap thunder radar
For data like this, first look at who is forced out.
$SKYAI long positions concentrated in liquidation; the current data can only indicate that liquidation has occurred, but it cannot announce a bottom for the market.
$BANK this segment shows longs being cleared first; if subsequent trades can’t keep flowing, then a rebound may easily turn into a weak “repair.”
$COLLECT this segment mainly reflects shorts passively covering; don’t treat the speed at which they get squeezed out as a trend directly.
Some longs get cleared and some shorts get squeezed out—don’t combine them into a single market direction.
For data like this, first look at who is forced out.
$SKYAI long positions concentrated in liquidation; the current data can only indicate that liquidation has occurred, but it cannot announce a bottom for the market.
$BANK this segment shows longs being cleared first; if subsequent trades can’t keep flowing, then a rebound may easily turn into a weak “repair.”
$COLLECT this segment mainly reflects shorts passively covering; don’t treat the speed at which they get squeezed out as a trend directly.
Some longs get cleared and some shorts get squeezed out—don’t combine them into a single market direction.
275
Log in to explore more content
Join global crypto users on Binance Square
⚡️ Get latest and useful information about crypto.
💬 Trusted by the world’s largest crypto exchange.
👍 Discover real insights from verified creators.
Email / Phone number
Trending Topics
BNBSurpasses$790
16,689 views
140 Discussing
$BNB strategic long plan -> FOCUS NOW
BNB has created 2 strong lows after taking out internal liquidity
I'm expecting a move towards swing high $815-$830 and looking for a long on a retest of the green box
#BNBSurpasses$790 #bnb
Ghost Writer
·6 Likes
·8.2k views
ZamaRises15.99%ToIntradayHigh$0.09
14,263 views
104 Discussing
BitcoinSpotETFsDraw$6.34BInflowsInQ3
5,533 views
89 Discussing