
#14
14
13,690 views
147 Discussing
Hot
Latest

·
--
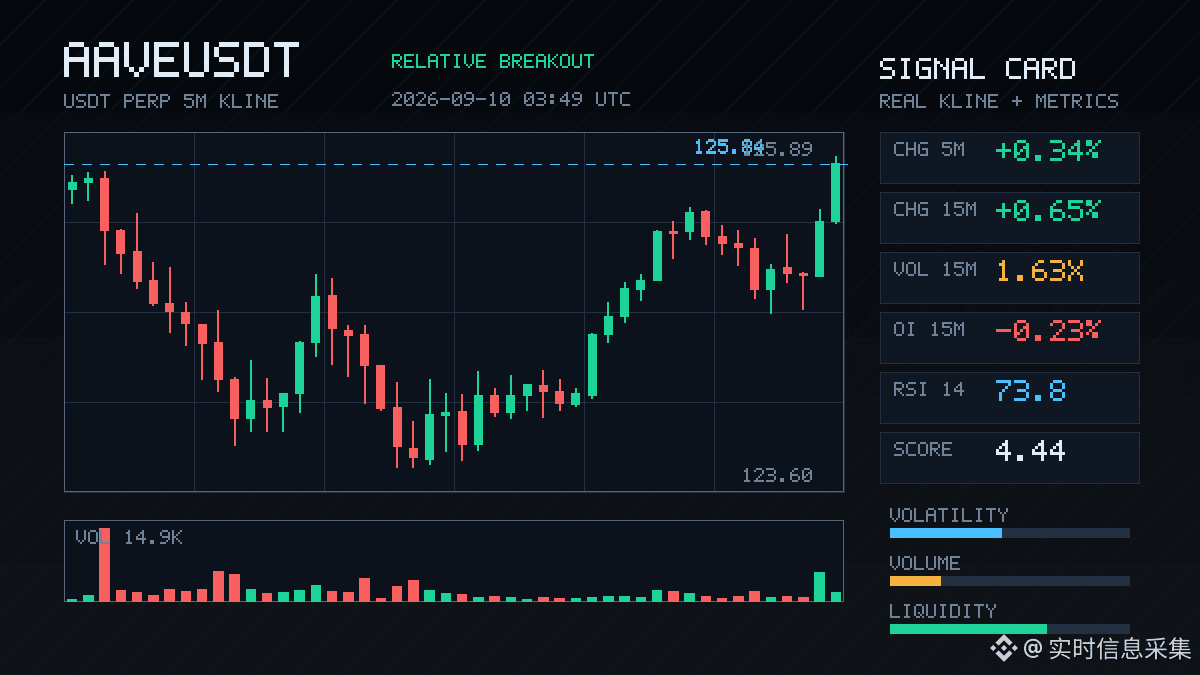
AAVE This move is a bit interesting.
In the 15m timeframe it’s up 0.65%, with volume at 1.63x. It doesn’t look very aggressive at first glance, but the details are in the back: OI is negative for both 15m and 1h. As the price rises, the position size is actually decreasing.
I usually don’t treat this kind of structure as a bullish breakout. It feels more like the short side is getting squeezed, or someone is taking the opportunity to close positions and leave—rather than new money actively driving it in.
That said, active trade volume is down 44.3% and the buy/sell ratio is 2.59. And at the close it just so happened to “bite through” the upper boundary of nearly 20 of the 5m candles. So on the short term, there really does seem to be funds pushing upward. The whole pool’s anomaly ranks #14, with a nominal change of #27—it's not huge, but it’s also not small.
My take: don’t rush to chase. As long as the volume-price divergence hasn’t finished playing out, this kind of breakout can easily turn into a fake move. Wait for a pullback to confirm, or wait until OI flips back to positive.
$AAVE
AAVE This move is a bit interesting.
In the 15m timeframe it’s up 0.65%, with volume at 1.63x. It doesn’t look very aggressive at first glance, but the details are in the back: OI is negative for both 15m and 1h. As the price rises, the position size is actually decreasing.
I usually don’t treat this kind of structure as a bullish breakout. It feels more like the short side is getting squeezed, or someone is taking the opportunity to close positions and leave—rather than new money actively driving it in.
That said, active trade volume is down 44.3% and the buy/sell ratio is 2.59. And at the close it just so happened to “bite through” the upper boundary of nearly 20 of the 5m candles. So on the short term, there really does seem to be funds pushing upward. The whole pool’s anomaly ranks #14, with a nominal change of #27—it's not huge, but it’s also not small.
My take: don’t rush to chase. As long as the volume-price divergence hasn’t finished playing out, this kind of breakout can easily turn into a fake move. Wait for a pullback to confirm, or wait until OI flips back to positive.
$AAVE
In the 15m timeframe it’s up 0.65%, with volume at 1.63x. It doesn’t look very aggressive at first glance, but the details are in the back: OI is negative for both 15m and 1h. As the price rises, the position size is actually decreasing.
I usually don’t treat this kind of structure as a bullish breakout. It feels more like the short side is getting squeezed, or someone is taking the opportunity to close positions and leave—rather than new money actively driving it in.
That said, active trade volume is down 44.3% and the buy/sell ratio is 2.59. And at the close it just so happened to “bite through” the upper boundary of nearly 20 of the 5m candles. So on the short term, there really does seem to be funds pushing upward. The whole pool’s anomaly ranks #14, with a nominal change of #27—it's not huge, but it’s also not small.
My take: don’t rush to chase. As long as the volume-price divergence hasn’t finished playing out, this kind of breakout can easily turn into a fake move. Wait for a pullback to confirm, or wait until OI flips back to positive.
$AAVE
47

·
--
$KAT This drop is a bit interesting: the price fell 1.44%, and the OI dropped as well. The 15m contract is -2.33%, and the 1h is even worse at -3.50%. The notional change is -220K. This doesn’t look like fresh shorts entering; it feels more like longs are being gradually squeezed out—stop-losses or主动减仓 (active de-risking) rather than a new wave of selling.
The aggressive trade difference is -17%, the buy/sell ratio is 0.71, and sell pressure is dominant. The funding rate is still in the higher range recently, which suggests the longs were indeed crowded before, and now we’re in a deleveraging phase. Trading volume is only 0.49x, volatility Z is 0.68—not panic liquidation, more like a dull blade cutting the position slowly.
The OI percentile is abnormally high at 82.5%; overall pool anomaly is #14, notional change #25. In terms of data it’s definitely among the top, but the order book hasn’t shown the kind of breakdown-style volume yet. Let’s see when this deleveraging wave finally stops—don’t rush to catch the falling knife.
$KAT This drop is a bit interesting: the price fell 1.44%, and the OI dropped as well. The 15m contract is -2.33%, and the 1h is even worse at -3.50%. The notional change is -220K. This doesn’t look like fresh shorts entering; it feels more like longs are being gradually squeezed out—stop-losses or主动减仓 (active de-risking) rather than a new wave of selling.
The aggressive trade difference is -17%, the buy/sell ratio is 0.71, and sell pressure is dominant. The funding rate is still in the higher range recently, which suggests the longs were indeed crowded before, and now we’re in a deleveraging phase. Trading volume is only 0.49x, volatility Z is 0.68—not panic liquidation, more like a dull blade cutting the position slowly.
The OI percentile is abnormally high at 82.5%; overall pool anomaly is #14, notional change #25. In terms of data it’s definitely among the top, but the order book hasn’t shown the kind of breakdown-style volume yet. Let’s see when this deleveraging wave finally stops—don’t rush to catch the falling knife.
The aggressive trade difference is -17%, the buy/sell ratio is 0.71, and sell pressure is dominant. The funding rate is still in the higher range recently, which suggests the longs were indeed crowded before, and now we’re in a deleveraging phase. Trading volume is only 0.49x, volatility Z is 0.68—not panic liquidation, more like a dull blade cutting the position slowly.
The OI percentile is abnormally high at 82.5%; overall pool anomaly is #14, notional change #25. In terms of data it’s definitely among the top, but the order book hasn’t shown the kind of breakdown-style volume yet. Let’s see when this deleveraging wave finally stops—don’t rush to catch the falling knife.
121

·
--
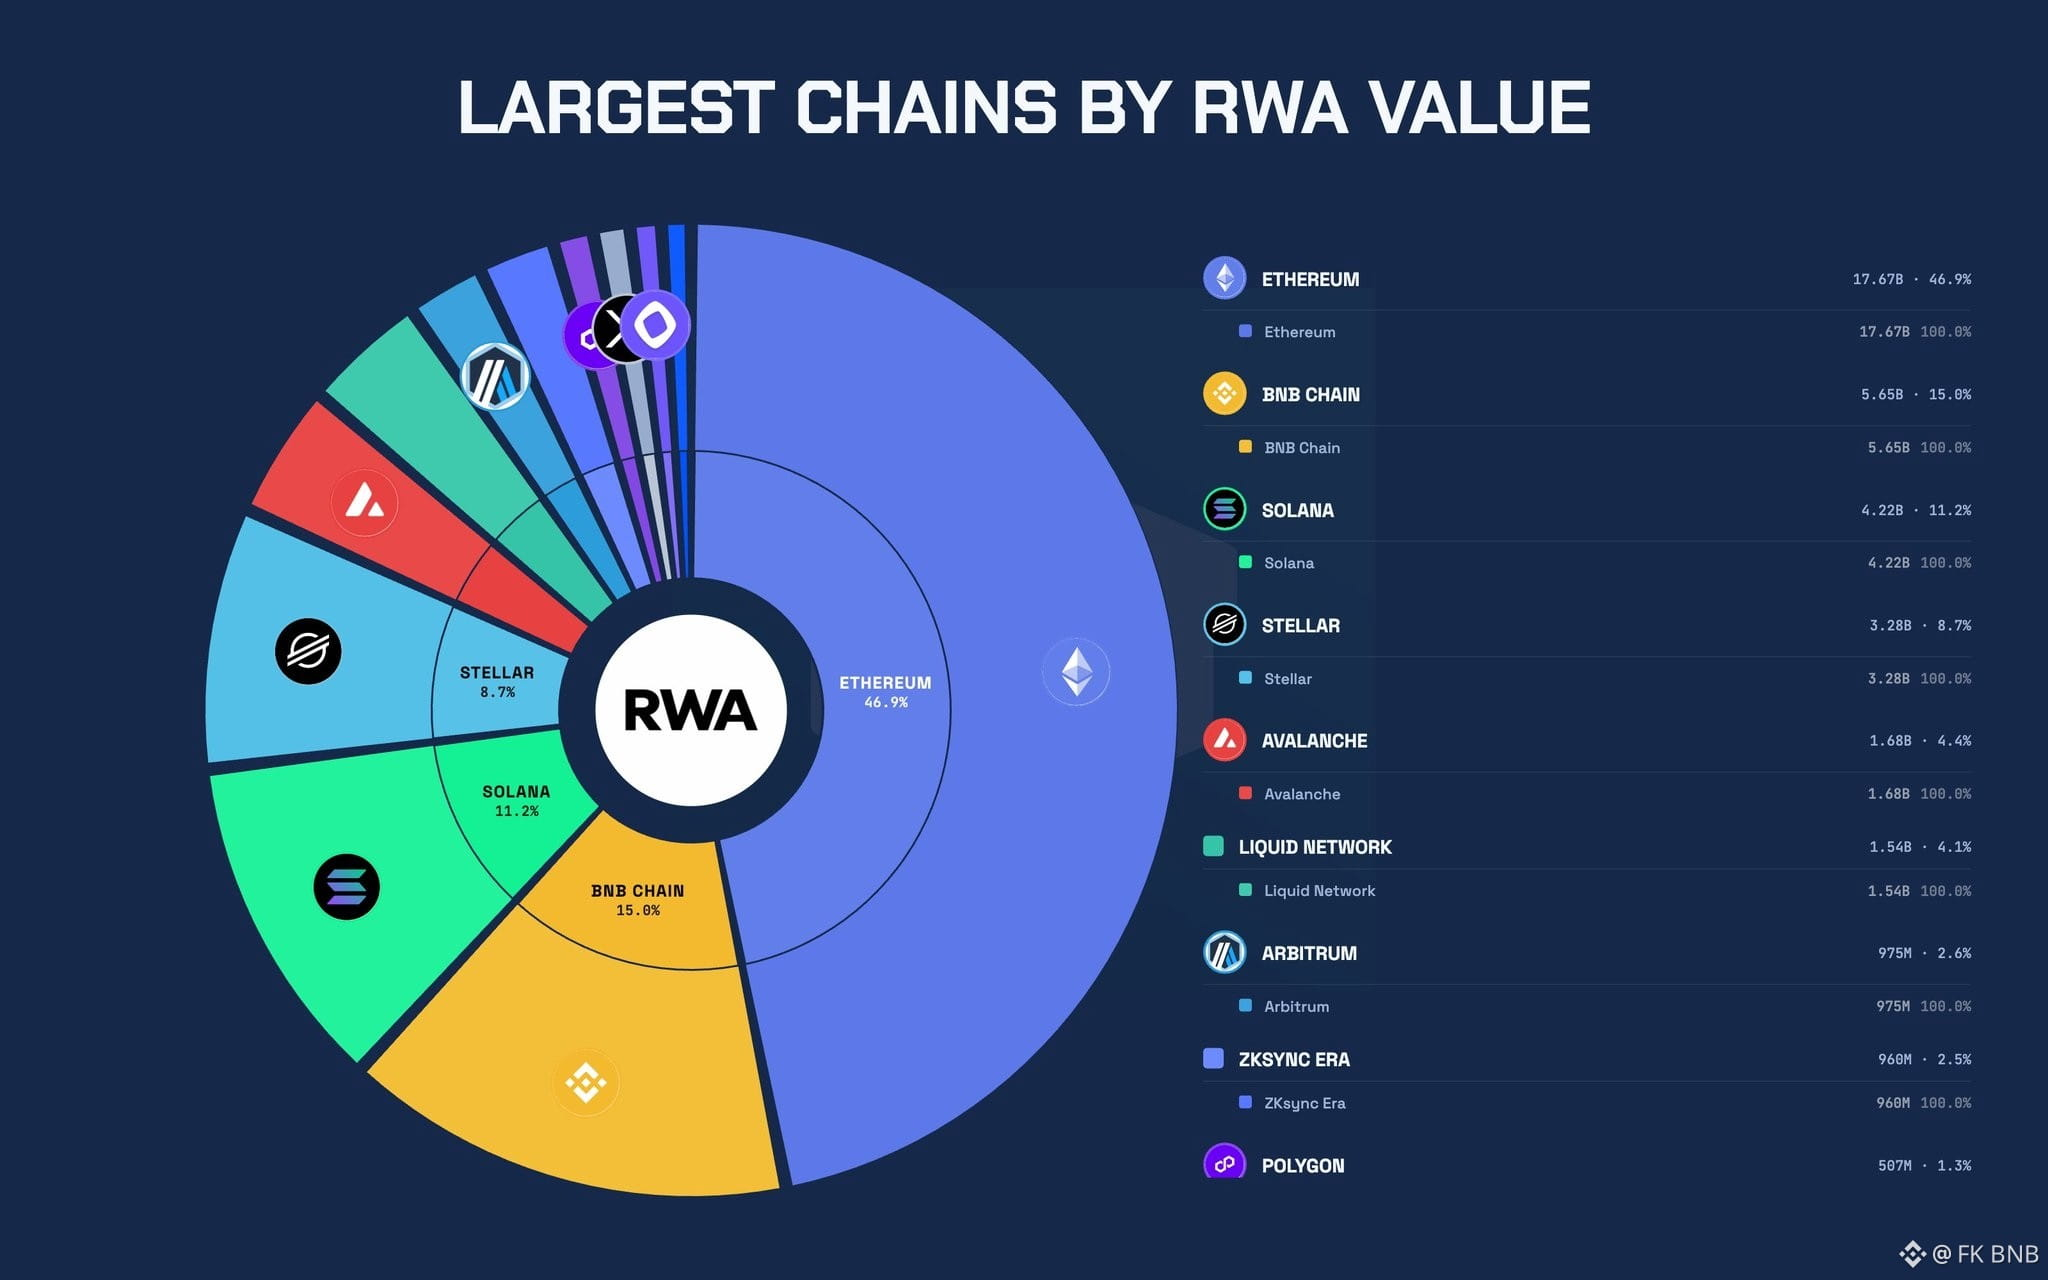
On-chain RWAs just crossed ~$37B in active market cap.
Top 10 chains by REAL distributed RWA value:
→ Ethereum: $17.67B (99.4% distributed)
→ $BNB Chain: $5.65B (100%)
→ $SOL : $4.23B (97.1%), 400K holders, most of any chain
→ Stellar: $3.28B (97.7%)
→ Avalanche: $1.68B (only 12.8% distributed, the $13B "total" is mostly represented)
→ Liquid Network: $1.54B (100%, just 62 holders)
→ Arbitrum: $975M (97.5%)
→ ZKsync Era: $960M (32.6%)
→ Polygon: $507M (40.6%)
→ XRP Ledger: $458M (10.2% distributed, $4.5B "total" is 90% bookkeeping)
✦ Points to note from the info:
- Ethereum still owns ~46%. Its share is only shrinking because the pie is growing, not because assets are leaving. Most RWA volume is still on $ETH despite the Sol and RH hype lately.
- Solana has the highest number of RWA holders at 400,084.
- Avalanche and XRP Ledger look top-5 until you separate transferable tokens from chain records on assets held the old way. On distributed value XRP barely makes the list, and Avalanche drops from an apparent 3rd to 5th.
- Some important projects outside the top 10 are:
→ SEI : #13
→ Mantle : #14
→ Robinhood : #16
→ Algorand : #21
→ SUI : #23
{future}(ETHUSDT)
{future}(BNBUSDT)
{future}(SOLUSDT)
On-chain RWAs just crossed ~$37B in active market cap.
Top 10 chains by REAL distributed RWA value:
→ Ethereum: $17.67B (99.4% distributed)
→ $BNB Chain: $5.65B (100%)
→ $SOL : $4.23B (97.1%), 400K holders, most of any chain
→ Stellar: $3.28B (97.7%)
→ Avalanche: $1.68B (only 12.8% distributed, the $13B "total" is mostly represented)
→ Liquid Network: $1.54B (100%, just 62 holders)
→ Arbitrum: $975M (97.5%)
→ ZKsync Era: $960M (32.6%)
→ Polygon: $507M (40.6%)
→ XRP Ledger: $458M (10.2% distributed, $4.5B "total" is 90% bookkeeping)
✦ Points to note from the info:
- Ethereum still owns ~46%. Its share is only shrinking because the pie is growing, not because assets are leaving. Most RWA volume is still on $ETH despite the Sol and RH hype lately.
- Solana has the highest number of RWA holders at 400,084.
- Avalanche and XRP Ledger look top-5 until you separate transferable tokens from chain records on assets held the old way. On distributed value XRP barely makes the list, and Avalanche drops from an apparent 3rd to 5th.
- Some important projects outside the top 10 are:
→ SEI : #13
→ Mantle : #14
→ Robinhood : #16
→ Algorand : #21
→ SUI : #23
Top 10 chains by REAL distributed RWA value:
→ Ethereum: $17.67B (99.4% distributed)
→ $BNB Chain: $5.65B (100%)
→ $SOL : $4.23B (97.1%), 400K holders, most of any chain
→ Stellar: $3.28B (97.7%)
→ Avalanche: $1.68B (only 12.8% distributed, the $13B "total" is mostly represented)
→ Liquid Network: $1.54B (100%, just 62 holders)
→ Arbitrum: $975M (97.5%)
→ ZKsync Era: $960M (32.6%)
→ Polygon: $507M (40.6%)
→ XRP Ledger: $458M (10.2% distributed, $4.5B "total" is 90% bookkeeping)
✦ Points to note from the info:
- Ethereum still owns ~46%. Its share is only shrinking because the pie is growing, not because assets are leaving. Most RWA volume is still on $ETH despite the Sol and RH hype lately.
- Solana has the highest number of RWA holders at 400,084.
- Avalanche and XRP Ledger look top-5 until you separate transferable tokens from chain records on assets held the old way. On distributed value XRP barely makes the list, and Avalanche drops from an apparent 3rd to 5th.
- Some important projects outside the top 10 are:
→ SEI : #13
→ Mantle : #14
→ Robinhood : #16
→ Algorand : #21
→ SUI : #23
28

·
--
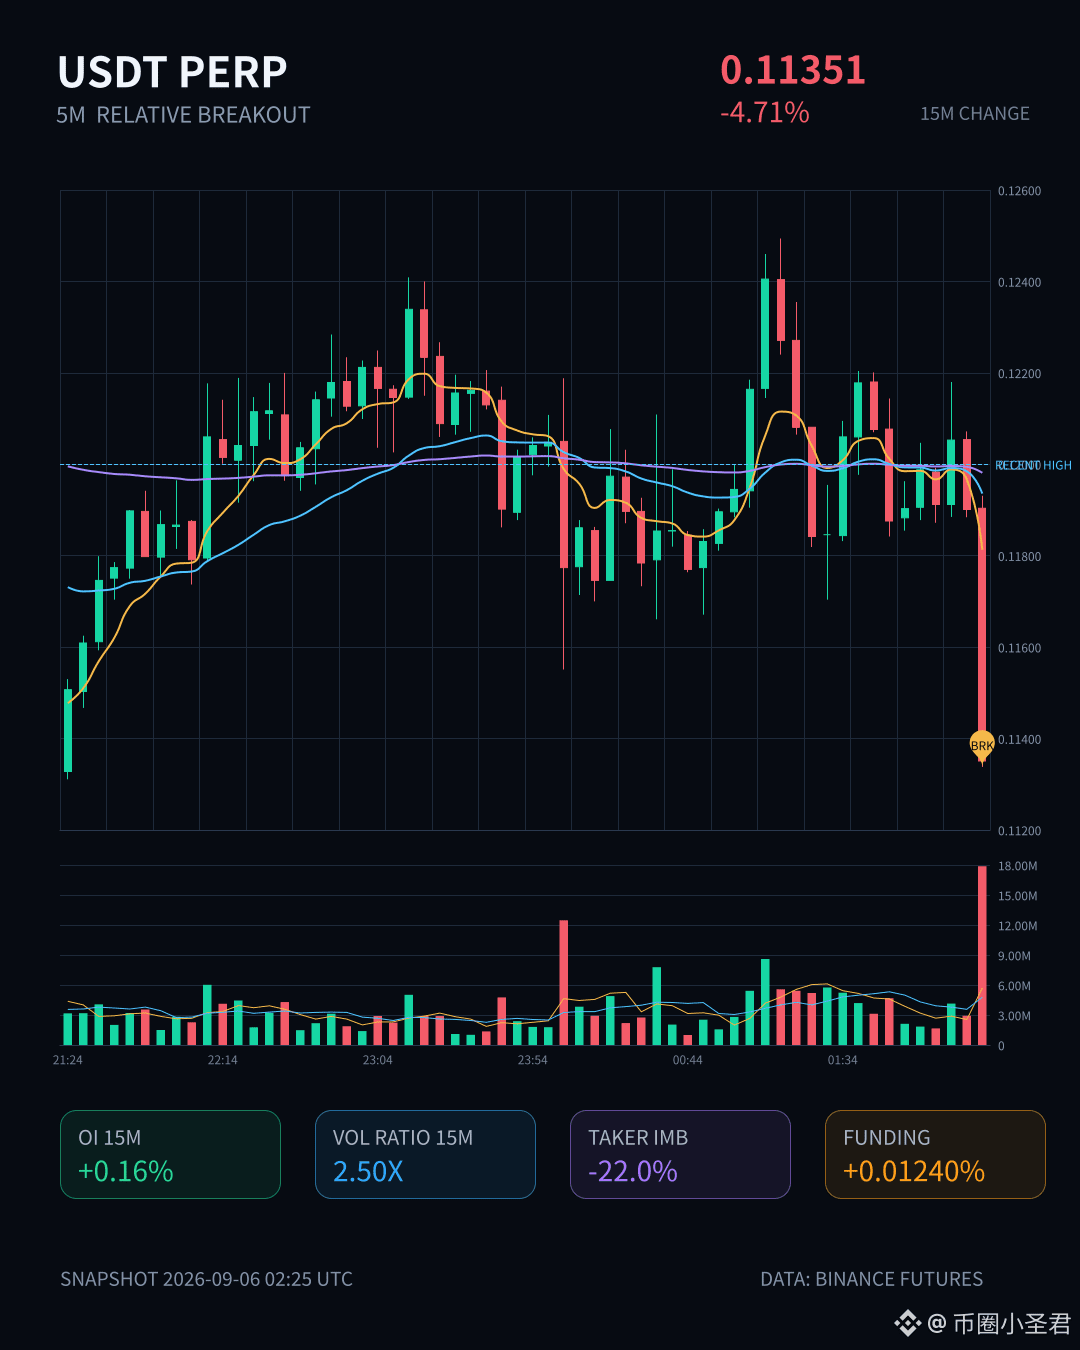
$Niul来 This sell-off has some substance; it dropped 4.71% in just 15 minutes.
It looks like it has broken below the lower boundary of the range formed by the last 20 five-minute candles, but don’t panic yet. The key point is that although the price is falling, OI is rising: 1-hour contract open interest increased by 1.68%. That’s not a good sign. It looks more like newly opened leveraged shorts are coming in to smash the price, rather than longs passively capitulating.
What’s even more concerning is that aggressive trading imbalance is -22%, with bids clearly failing to absorb the selling, and the bid-ask ratio is only 0.64. The volatility Z-score is 2.89, and volume is 2.5 times normal—this kind of price-volume behavior suggests it’s not an ordinary shakeout.
To be honest, this "price down + OI up" combination ranks #14 in all-pool anomalies, and the notional change also made the top 7. This move is being driven by newly added short leverage pushing the price down, which is fundamentally different from profit-taking.
Don’t rush to buy the dip. Wait for signs that short pressure is weakening first. $Niul来 is in a delicate spot right now; it’s already too late to chase shorts, and it’s also too early to bottom-fish, so staying on the sidelines is the main move.
$Niul来 This sell-off has some substance; it dropped 4.71% in just 15 minutes.
It looks like it has broken below the lower boundary of the range formed by the last 20 five-minute candles, but don’t panic yet. The key point is that although the price is falling, OI is rising: 1-hour contract open interest increased by 1.68%. That’s not a good sign. It looks more like newly opened leveraged shorts are coming in to smash the price, rather than longs passively capitulating.
What’s even more concerning is that aggressive trading imbalance is -22%, with bids clearly failing to absorb the selling, and the bid-ask ratio is only 0.64. The volatility Z-score is 2.89, and volume is 2.5 times normal—this kind of price-volume behavior suggests it’s not an ordinary shakeout.
To be honest, this "price down + OI up" combination ranks #14 in all-pool anomalies, and the notional change also made the top 7. This move is being driven by newly added short leverage pushing the price down, which is fundamentally different from profit-taking.
Don’t rush to buy the dip. Wait for signs that short pressure is weakening first. $Niul来 is in a delicate spot right now; it’s already too late to chase shorts, and it’s also too early to bottom-fish, so staying on the sidelines is the main move.
It looks like it has broken below the lower boundary of the range formed by the last 20 five-minute candles, but don’t panic yet. The key point is that although the price is falling, OI is rising: 1-hour contract open interest increased by 1.68%. That’s not a good sign. It looks more like newly opened leveraged shorts are coming in to smash the price, rather than longs passively capitulating.
What’s even more concerning is that aggressive trading imbalance is -22%, with bids clearly failing to absorb the selling, and the bid-ask ratio is only 0.64. The volatility Z-score is 2.89, and volume is 2.5 times normal—this kind of price-volume behavior suggests it’s not an ordinary shakeout.
To be honest, this "price down + OI up" combination ranks #14 in all-pool anomalies, and the notional change also made the top 7. This move is being driven by newly added short leverage pushing the price down, which is fundamentally different from profit-taking.
Don’t rush to buy the dip. Wait for signs that short pressure is weakening first. $Niul来 is in a delicate spot right now; it’s already too late to chase shorts, and it’s also too early to bottom-fish, so staying on the sidelines is the main move.
39
·
--
$PROM This 15-minute surge in volume is quite interesting; trading volume jumped to more than 5 times the normal level. Although the price only rose by 1.57%, the key point is that the closing price forcefully broke above the upper bound of the range formed by the last 20 candlesticks.
What’s interesting is that this push higher wasn’t the typical logic of incremental capital entering the market — OI actually declined, and the notional open interest for the contract edged down slightly. It looks more like a short-covering move, with someone unable to hold on and getting stopped out. The active trade imbalance widened to 12.8%, with buy-side dominance clearly stronger.
It ranked #14 in overall pool anomaly ranking and #29 in notional change, making it one of the few coins among today’s mid-tier names to show this kind of strength. Many people are watching the mainstream plays in BTC, but something like PROM, tucked away in the corner, suddenly making a move like this is actually more worth observing.
However, with a 1.57% gain paired with more than 5x the volume, the volatility is a bit high, so be careful of a quick cooling-off once the sentiment has played out. Those who chased at the highs should also watch the sustainability of OI changes, because right now this looks more like a technical rebound than the start of a trend.
$PROM This 15-minute surge in volume is quite interesting; trading volume jumped to more than 5 times the normal level. Although the price only rose by 1.57%, the key point is that the closing price forcefully broke above the upper bound of the range formed by the last 20 candlesticks.
What’s interesting is that this push higher wasn’t the typical logic of incremental capital entering the market — OI actually declined, and the notional open interest for the contract edged down slightly. It looks more like a short-covering move, with someone unable to hold on and getting stopped out. The active trade imbalance widened to 12.8%, with buy-side dominance clearly stronger.
It ranked #14 in overall pool anomaly ranking and #29 in notional change, making it one of the few coins among today’s mid-tier names to show this kind of strength. Many people are watching the mainstream plays in BTC, but something like PROM, tucked away in the corner, suddenly making a move like this is actually more worth observing.
However, with a 1.57% gain paired with more than 5x the volume, the volatility is a bit high, so be careful of a quick cooling-off once the sentiment has played out. Those who chased at the highs should also watch the sustainability of OI changes, because right now this looks more like a technical rebound than the start of a trend.
What’s interesting is that this push higher wasn’t the typical logic of incremental capital entering the market — OI actually declined, and the notional open interest for the contract edged down slightly. It looks more like a short-covering move, with someone unable to hold on and getting stopped out. The active trade imbalance widened to 12.8%, with buy-side dominance clearly stronger.
It ranked #14 in overall pool anomaly ranking and #29 in notional change, making it one of the few coins among today’s mid-tier names to show this kind of strength. Many people are watching the mainstream plays in BTC, but something like PROM, tucked away in the corner, suddenly making a move like this is actually more worth observing.
However, with a 1.57% gain paired with more than 5x the volume, the volatility is a bit high, so be careful of a quick cooling-off once the sentiment has played out. Those who chased at the highs should also watch the sustainability of OI changes, because right now this looks more like a technical rebound than the start of a trend.
18

·
--
$4 This move is just plain unreasonable: it surged 8.73% in 15 minutes, and trading volume expanded to more than 6x, with capital almost rushing in to get on board. Even more interestingly, OI contracts followed the rise over 15 minutes, but over 1 hour they were actually decreasing, which means the short-term hot money was a pure long-side charge, not the kind of false pump caused by shorts being forced to cover. The newly added leveraged exposure is real money at work. The closing price directly pierced the upper range of the most recent 20 five-minute candlesticks, and the abnormal percentile for the whole pool was pushed all the way to 100%, already making it the most extreme coin in the entire pool. Nominal change also ranked at #14, and this kind of breakout with multiple confirmations is hard to dismiss as noise.
But looking at it calmly, the active trade imbalance is negative—that is, during this push, active sell orders actually outnumbered buy orders a bit. Although the gap is only at the retail level, that doesn’t mean it has to pull back immediately; it only suggests that some major players are placing orders high up to absorb supply. With 13M in 24-hour volume, it’s not small for the GameFi sector, and the overall float still looks relatively light. In the current structure, chasing it on the short term is no longer a good entry point. Wait for a retest of the upper boundary of the confirmation zone, then look for a second leg.
Don’t ask me whether I’m bullish. I only know that this kind of wild coin doesn’t wait for people—but it kills people even more readily.
$4 This move is just plain unreasonable: it surged 8.73% in 15 minutes, and trading volume expanded to more than 6x, with capital almost rushing in to get on board. Even more interestingly, OI contracts followed the rise over 15 minutes, but over 1 hour they were actually decreasing, which means the short-term hot money was a pure long-side charge, not the kind of false pump caused by shorts being forced to cover. The newly added leveraged exposure is real money at work. The closing price directly pierced the upper range of the most recent 20 five-minute candlesticks, and the abnormal percentile for the whole pool was pushed all the way to 100%, already making it the most extreme coin in the entire pool. Nominal change also ranked at #14, and this kind of breakout with multiple confirmations is hard to dismiss as noise.
But looking at it calmly, the active trade imbalance is negative—that is, during this push, active sell orders actually outnumbered buy orders a bit. Although the gap is only at the retail level, that doesn’t mean it has to pull back immediately; it only suggests that some major players are placing orders high up to absorb supply. With 13M in 24-hour volume, it’s not small for the GameFi sector, and the overall float still looks relatively light. In the current structure, chasing it on the short term is no longer a good entry point. Wait for a retest of the upper boundary of the confirmation zone, then look for a second leg.
Don’t ask me whether I’m bullish. I only know that this kind of wild coin doesn’t wait for people—but it kills people even more readily.
But looking at it calmly, the active trade imbalance is negative—that is, during this push, active sell orders actually outnumbered buy orders a bit. Although the gap is only at the retail level, that doesn’t mean it has to pull back immediately; it only suggests that some major players are placing orders high up to absorb supply. With 13M in 24-hour volume, it’s not small for the GameFi sector, and the overall float still looks relatively light. In the current structure, chasing it on the short term is no longer a good entry point. Wait for a retest of the upper boundary of the confirmation zone, then look for a second leg.
Don’t ask me whether I’m bullish. I only know that this kind of wild coin doesn’t wait for people—but it kills people even more readily.
5
·
--
$BULLA This move is kind of interesting 🚀
In just 15 minutes, it jumped nearly 3 percentage points. The contract open interest and price are rising in sync—this isn’t as simple as shorts being hunted. It looks more like newly added leveraged longs are stepping in with real money. The funding rate is already up to 0.0748%, with the percentile pinned at 99%. The whole market is adding leverage and chasing the heat—makes you uneasy.
But don’t get too carried away too early. Net主动成交 (active taker trades) is still negative. Sell orders are heavier than buy orders, which suggests that behind this surge there’s a “smart money” vibe quietly distributing. Whole-pool abnormal ranking is #14, nominal change is #13, and attention from capital is definitely maxed out—but when everyone else’s FOMO is at its wildest, you have to ask yourself: who, exactly, is still taking the bag?
The faster it rises, the deeper the pit that’s being dug. Watch if you want, but remember to keep your knife steady in hand.
$BULLA This move is kind of interesting 🚀
In just 15 minutes, it jumped nearly 3 percentage points. The contract open interest and price are rising in sync—this isn’t as simple as shorts being hunted. It looks more like newly added leveraged longs are stepping in with real money. The funding rate is already up to 0.0748%, with the percentile pinned at 99%. The whole market is adding leverage and chasing the heat—makes you uneasy.
But don’t get too carried away too early. Net主动成交 (active taker trades) is still negative. Sell orders are heavier than buy orders, which suggests that behind this surge there’s a “smart money” vibe quietly distributing. Whole-pool abnormal ranking is #14, nominal change is #13, and attention from capital is definitely maxed out—but when everyone else’s FOMO is at its wildest, you have to ask yourself: who, exactly, is still taking the bag?
The faster it rises, the deeper the pit that’s being dug. Watch if you want, but remember to keep your knife steady in hand.
In just 15 minutes, it jumped nearly 3 percentage points. The contract open interest and price are rising in sync—this isn’t as simple as shorts being hunted. It looks more like newly added leveraged longs are stepping in with real money. The funding rate is already up to 0.0748%, with the percentile pinned at 99%. The whole market is adding leverage and chasing the heat—makes you uneasy.
But don’t get too carried away too early. Net主动成交 (active taker trades) is still negative. Sell orders are heavier than buy orders, which suggests that behind this surge there’s a “smart money” vibe quietly distributing. Whole-pool abnormal ranking is #14, nominal change is #13, and attention from capital is definitely maxed out—but when everyone else’s FOMO is at its wildest, you have to ask yourself: who, exactly, is still taking the bag?
The faster it rises, the deeper the pit that’s being dug. Watch if you want, but remember to keep your knife steady in hand.
261

·
--
Bullish
60-SECOND ALPHA #14 | $OP
OP shows why token unlocks deserve attention even when the broader ecosystem remains active.
👉🏻 Before entering an altcoin, check its supply schedule. New tokens entering circulation can change the supply-demand balance and affect price action.
{future}(OPUSDT)
60-SECOND ALPHA #14 | $OP
OP shows why token unlocks deserve attention even when the broader ecosystem remains active.
👉🏻 Before entering an altcoin, check its supply schedule. New tokens entering circulation can change the supply-demand balance and affect price action.
OP shows why token unlocks deserve attention even when the broader ecosystem remains active.
👉🏻 Before entering an altcoin, check its supply schedule. New tokens entering circulation can change the supply-demand balance and affect price action.
91
·
--
$BTR This 15-minute timeframe move is really strong.
I just glanced at the order book data: the price jumped straight up by 7%, the trading volume exploded to more than 4 times the usual level, and—more importantly—it was a genuine breakout. It directly pierced through the recent high zone of the last 20 candlesticks. The key is OI: the contract open interest is rising in sync. This structure is completely different from just pumping the price without volume—it looks like newly added long leverage capital, real money, is actually entering the market.
In terms of how abnormal this is across the whole pool, it ranks at #14. The notional change in trading volume is also in the top ten; the 24-hour trading value is already up to $328 million. The share of aggressive buy orders is clearly dominant: the buy/sell ratio is 1.24, and the buying is still very aggressive.
Honestly, this kind of “new price highs + OI expansion + volume amplification” converging move is, in the short term, the most comfortable setup—it indicates the capital has aligned. But with volatility at this level, when chasing price you need to keep a clear head. Parabolic rallies and sharp collapses are twins. Positioning and risk/position control still require self-discipline—don’t let emotion take over.
The order book is moving; it’s not always something you’re watching every moment, but the quality of these few K-lines from BTR is definitely worth recording.
$BTR This 15-minute timeframe move is really strong.
I just glanced at the order book data: the price jumped straight up by 7%, the trading volume exploded to more than 4 times the usual level, and—more importantly—it was a genuine breakout. It directly pierced through the recent high zone of the last 20 candlesticks. The key is OI: the contract open interest is rising in sync. This structure is completely different from just pumping the price without volume—it looks like newly added long leverage capital, real money, is actually entering the market.
In terms of how abnormal this is across the whole pool, it ranks at #14. The notional change in trading volume is also in the top ten; the 24-hour trading value is already up to $328 million. The share of aggressive buy orders is clearly dominant: the buy/sell ratio is 1.24, and the buying is still very aggressive.
Honestly, this kind of “new price highs + OI expansion + volume amplification” converging move is, in the short term, the most comfortable setup—it indicates the capital has aligned. But with volatility at this level, when chasing price you need to keep a clear head. Parabolic rallies and sharp collapses are twins. Positioning and risk/position control still require self-discipline—don’t let emotion take over.
The order book is moving; it’s not always something you’re watching every moment, but the quality of these few K-lines from BTR is definitely worth recording.
I just glanced at the order book data: the price jumped straight up by 7%, the trading volume exploded to more than 4 times the usual level, and—more importantly—it was a genuine breakout. It directly pierced through the recent high zone of the last 20 candlesticks. The key is OI: the contract open interest is rising in sync. This structure is completely different from just pumping the price without volume—it looks like newly added long leverage capital, real money, is actually entering the market.
In terms of how abnormal this is across the whole pool, it ranks at #14. The notional change in trading volume is also in the top ten; the 24-hour trading value is already up to $328 million. The share of aggressive buy orders is clearly dominant: the buy/sell ratio is 1.24, and the buying is still very aggressive.
Honestly, this kind of “new price highs + OI expansion + volume amplification” converging move is, in the short term, the most comfortable setup—it indicates the capital has aligned. But with volatility at this level, when chasing price you need to keep a clear head. Parabolic rallies and sharp collapses are twins. Positioning and risk/position control still require self-discipline—don’t let emotion take over.
The order book is moving; it’s not always something you’re watching every moment, but the quality of these few K-lines from BTR is definitely worth recording.
113

·
--
Lately, I’ve been watching a trend: trading as a business is increasingly becoming a traffic/flow business.
Whoever can keep users on their own platform isn’t just earning a one-off fee.
Applied to $HOOD , I’m leaning bullish.
It’s not that it’s “exploding” today—over the past 24 hours it’s only up 0.80%. The current price is $106.86, moving around in a range of $101.19 to $107.59.
But for stocks like this, a lot of the time you look at this kind of “refusing to fall behind” state.
If you look at the Binance U.S. stock perpetual section, it’s #14 on the gainers list, and #29 on the trading volume list. Over the last 24 hours, there’s $33.56M USDT cycling in and out.
That tells you one thing: there are plenty of people watching it, and it’s not the kind of cold, one-day novelty ticket.
My understanding of Robinhood is pretty straightforward.
From what I know, it’s basically a company positioned at the entry point for retail trading—capturing the trend/benefit of the broader flow.
As long as the market is still chasing lower entry barriers, higher frequency, and a trading experience that feels more like a product than a trading counter, platforms like this will always have a story to tell.
You can think of it like this: the more active the market is, the easier it is for them to get noticed.
The more the market likes to tinker and trade, the stronger their presence.
There’s another point I care about.
On the $HOOD perpetual side, the funding rate is +0.0000%, which suggests bullish and bearish sentiment hasn’t turned scorching.
But the open position volume is already 136,207 contracts.
This combination makes me usually look at it one more time—meaning people are coming in, but the emotions haven’t fully consolidated to one side yet.
For a relatively strong stock, this state is more comfortable than overheating right out of the gate.
Of course, I’m not blindly charging in with it.
These platform stocks have an old problem: once the market turns cold and trading heat fades, their valuation imagination tends to get discounted too.
Also, it’s already very close to the 24-hour high of $107.59. If you chase it too urgently, the timing is easy to feel uncomfortable.
But if you ask me whether this stock is worth continuing to keep on your watchlist.
My answer is yes.
If it were me, I’d rather wait for it to keep hovering around the high area for a bit than wait until it’s gone too far away and end up slapping my thigh.
That’s my take. Your money is your decision. $HOOD #美股
Lately, I’ve been watching a trend: trading as a business is increasingly becoming a traffic/flow business.
Whoever can keep users on their own platform isn’t just earning a one-off fee.
Applied to $HOOD , I’m leaning bullish.
It’s not that it’s “exploding” today—over the past 24 hours it’s only up 0.80%. The current price is $106.86, moving around in a range of $101.19 to $107.59.
But for stocks like this, a lot of the time you look at this kind of “refusing to fall behind” state.
If you look at the Binance U.S. stock perpetual section, it’s #14 on the gainers list, and #29 on the trading volume list. Over the last 24 hours, there’s $33.56M USDT cycling in and out.
That tells you one thing: there are plenty of people watching it, and it’s not the kind of cold, one-day novelty ticket.
My understanding of Robinhood is pretty straightforward.
From what I know, it’s basically a company positioned at the entry point for retail trading—capturing the trend/benefit of the broader flow.
As long as the market is still chasing lower entry barriers, higher frequency, and a trading experience that feels more like a product than a trading counter, platforms like this will always have a story to tell.
You can think of it like this: the more active the market is, the easier it is for them to get noticed.
The more the market likes to tinker and trade, the stronger their presence.
There’s another point I care about.
On the $HOOD perpetual side, the funding rate is +0.0000%, which suggests bullish and bearish sentiment hasn’t turned scorching.
But the open position volume is already 136,207 contracts.
This combination makes me usually look at it one more time—meaning people are coming in, but the emotions haven’t fully consolidated to one side yet.
For a relatively strong stock, this state is more comfortable than overheating right out of the gate.
Of course, I’m not blindly charging in with it.
These platform stocks have an old problem: once the market turns cold and trading heat fades, their valuation imagination tends to get discounted too.
Also, it’s already very close to the 24-hour high of $107.59. If you chase it too urgently, the timing is easy to feel uncomfortable.
But if you ask me whether this stock is worth continuing to keep on your watchlist.
My answer is yes.
If it were me, I’d rather wait for it to keep hovering around the high area for a bit than wait until it’s gone too far away and end up slapping my thigh.
That’s my take. Your money is your decision. $HOOD #美股
Whoever can keep users on their own platform isn’t just earning a one-off fee.
Applied to $HOOD , I’m leaning bullish.
It’s not that it’s “exploding” today—over the past 24 hours it’s only up 0.80%. The current price is $106.86, moving around in a range of $101.19 to $107.59.
But for stocks like this, a lot of the time you look at this kind of “refusing to fall behind” state.
If you look at the Binance U.S. stock perpetual section, it’s #14 on the gainers list, and #29 on the trading volume list. Over the last 24 hours, there’s $33.56M USDT cycling in and out.
That tells you one thing: there are plenty of people watching it, and it’s not the kind of cold, one-day novelty ticket.
My understanding of Robinhood is pretty straightforward.
From what I know, it’s basically a company positioned at the entry point for retail trading—capturing the trend/benefit of the broader flow.
As long as the market is still chasing lower entry barriers, higher frequency, and a trading experience that feels more like a product than a trading counter, platforms like this will always have a story to tell.
You can think of it like this: the more active the market is, the easier it is for them to get noticed.
The more the market likes to tinker and trade, the stronger their presence.
There’s another point I care about.
On the $HOOD perpetual side, the funding rate is +0.0000%, which suggests bullish and bearish sentiment hasn’t turned scorching.
But the open position volume is already 136,207 contracts.
This combination makes me usually look at it one more time—meaning people are coming in, but the emotions haven’t fully consolidated to one side yet.
For a relatively strong stock, this state is more comfortable than overheating right out of the gate.
Of course, I’m not blindly charging in with it.
These platform stocks have an old problem: once the market turns cold and trading heat fades, their valuation imagination tends to get discounted too.
Also, it’s already very close to the 24-hour high of $107.59. If you chase it too urgently, the timing is easy to feel uncomfortable.
But if you ask me whether this stock is worth continuing to keep on your watchlist.
My answer is yes.
If it were me, I’d rather wait for it to keep hovering around the high area for a bit than wait until it’s gone too far away and end up slapping my thigh.
That’s my take. Your money is your decision. $HOOD #美股
27
·
--
After dinner, I leaned on the couch, and my phone was still playing the kids’ animated show. I casually swiped to Binance’s US stock perpetual futures ranking, and $GOOGL was sitting at the front of that row.
Today, this coin isn’t exactly lively—down 0.18% over the last 24 hours. The price has been hovering around $336.35, and the day’s high-low range is only from $339.75 to $333.43.
But precisely because it hasn’t really put on a show, I’m actually more willing to take a couple more looks.
I’m bullish—not because I think the chart looks particularly good today.
It’s because I’ve always believed that for a company like Alphabet, what it holds are some of the least replaceable entry points on the internet.
No matter how market themes rotate—from ads, to search, to the AI track—the broader direction still stays within the scope of what it can catch.
If you’ve been trading crypto for long enough, you develop a habit: you always want the one with the most leverage.
But once you really put money in, many times the thing you can actually sleep at night with is still a business with thick fundamentals and a long runway.
AI is loud right now, but whether it can ultimately tie traffic, products, and monetization into one cohesive force—big platforms naturally have an edge over smaller companies.
On the order book, it’s not like nobody’s watching.
It ranks #14 on Binance’s US stock perpetual futures gains leaderboard, #21 on the volume leaderboard, and clocked $65.94M USDT in the last 24 hours.
The funding rate is only +0.0040%, with an open position of 205,535 contracts. That “flavor” feels more like someone is steadily squatting here, not like a panic-driven stampede fueled by emotion.
For my own part, I’d treat a coin like this as the kind you can research during a pullback—not the kind you charge into at the daily limit-up.
This sideways grind right now actually makes me more comfortable than suddenly getting one big bullish candle.
That said, even a company like $GOOGL can’t be without variables.
If the market cools down on AI expectations next, or risk appetite in the broader market drops, it will still get dragged along.
And for a company of this size, expecting it to sprint out some exaggerated slope just based on a few days of sentiment is, frankly, unrealistic.
If I were you—I mean, if it were me—I’d rather keep watching these kinds of coins that aren’t overly hyped, but where the money hasn’t left, and take them in slowly.
If you can’t hold up, don’t board. Anyway, I’m speaking from experience that I’ve already lost money from.
$GOOGL #US Stocks
I might be wrong too. I’m just making my own judgment.
After dinner, I leaned on the couch, and my phone was still playing the kids’ animated show. I casually swiped to Binance’s US stock perpetual futures ranking, and $GOOGL was sitting at the front of that row.
Today, this coin isn’t exactly lively—down 0.18% over the last 24 hours. The price has been hovering around $336.35, and the day’s high-low range is only from $339.75 to $333.43.
But precisely because it hasn’t really put on a show, I’m actually more willing to take a couple more looks.
I’m bullish—not because I think the chart looks particularly good today.
It’s because I’ve always believed that for a company like Alphabet, what it holds are some of the least replaceable entry points on the internet.
No matter how market themes rotate—from ads, to search, to the AI track—the broader direction still stays within the scope of what it can catch.
If you’ve been trading crypto for long enough, you develop a habit: you always want the one with the most leverage.
But once you really put money in, many times the thing you can actually sleep at night with is still a business with thick fundamentals and a long runway.
AI is loud right now, but whether it can ultimately tie traffic, products, and monetization into one cohesive force—big platforms naturally have an edge over smaller companies.
On the order book, it’s not like nobody’s watching.
It ranks #14 on Binance’s US stock perpetual futures gains leaderboard, #21 on the volume leaderboard, and clocked $65.94M USDT in the last 24 hours.
The funding rate is only +0.0040%, with an open position of 205,535 contracts. That “flavor” feels more like someone is steadily squatting here, not like a panic-driven stampede fueled by emotion.
For my own part, I’d treat a coin like this as the kind you can research during a pullback—not the kind you charge into at the daily limit-up.
This sideways grind right now actually makes me more comfortable than suddenly getting one big bullish candle.
That said, even a company like $GOOGL can’t be without variables.
If the market cools down on AI expectations next, or risk appetite in the broader market drops, it will still get dragged along.
And for a company of this size, expecting it to sprint out some exaggerated slope just based on a few days of sentiment is, frankly, unrealistic.
If I were you—I mean, if it were me—I’d rather keep watching these kinds of coins that aren’t overly hyped, but where the money hasn’t left, and take them in slowly.
If you can’t hold up, don’t board. Anyway, I’m speaking from experience that I’ve already lost money from.
$GOOGL #US Stocks
I might be wrong too. I’m just making my own judgment.
Today, this coin isn’t exactly lively—down 0.18% over the last 24 hours. The price has been hovering around $336.35, and the day’s high-low range is only from $339.75 to $333.43.
But precisely because it hasn’t really put on a show, I’m actually more willing to take a couple more looks.
I’m bullish—not because I think the chart looks particularly good today.
It’s because I’ve always believed that for a company like Alphabet, what it holds are some of the least replaceable entry points on the internet.
No matter how market themes rotate—from ads, to search, to the AI track—the broader direction still stays within the scope of what it can catch.
If you’ve been trading crypto for long enough, you develop a habit: you always want the one with the most leverage.
But once you really put money in, many times the thing you can actually sleep at night with is still a business with thick fundamentals and a long runway.
AI is loud right now, but whether it can ultimately tie traffic, products, and monetization into one cohesive force—big platforms naturally have an edge over smaller companies.
On the order book, it’s not like nobody’s watching.
It ranks #14 on Binance’s US stock perpetual futures gains leaderboard, #21 on the volume leaderboard, and clocked $65.94M USDT in the last 24 hours.
The funding rate is only +0.0040%, with an open position of 205,535 contracts. That “flavor” feels more like someone is steadily squatting here, not like a panic-driven stampede fueled by emotion.
For my own part, I’d treat a coin like this as the kind you can research during a pullback—not the kind you charge into at the daily limit-up.
This sideways grind right now actually makes me more comfortable than suddenly getting one big bullish candle.
That said, even a company like $GOOGL can’t be without variables.
If the market cools down on AI expectations next, or risk appetite in the broader market drops, it will still get dragged along.
And for a company of this size, expecting it to sprint out some exaggerated slope just based on a few days of sentiment is, frankly, unrealistic.
If I were you—I mean, if it were me—I’d rather keep watching these kinds of coins that aren’t overly hyped, but where the money hasn’t left, and take them in slowly.
If you can’t hold up, don’t board. Anyway, I’m speaking from experience that I’ve already lost money from.
$GOOGL #US Stocks
I might be wrong too. I’m just making my own judgment.
48

·
--
This 15-minute line on CRV is a bit interesting. The price broke above the upper band of the last nearly 20 five-minute K-lines, and the trading volume shot straight to 2.4x the normal level. The volatility Z has also jumped to 2.28. More importantly, the funding rate is in the high percentile recently, and OI is rising at the same time—this clearly isn’t short covering, it’s real leveraged longs entering. Even though the nominal change doesn’t look huge—only +465K in 15 minutes—at the hourly level there’s already a net increase of 1.17M USDT, and the pool’s abnormal ranking is as high as #14. That indicates this flow isn’t interested in big BTC; it’s specifically targeting CRV, a small-cap, to stir things up. The only thing to be mindful of is that with this kind of high-leverage push, once the funding rate gets ridiculously high, the risk of a short-term long squeeze/pullback is also building. But with this momentum right now, at least at the 15-minute level, the move hasn’t fully finished yet.
This 15-minute line on CRV is a bit interesting. The price broke above the upper band of the last nearly 20 five-minute K-lines, and the trading volume shot straight to 2.4x the normal level. The volatility Z has also jumped to 2.28. More importantly, the funding rate is in the high percentile recently, and OI is rising at the same time—this clearly isn’t short covering, it’s real leveraged longs entering. Even though the nominal change doesn’t look huge—only +465K in 15 minutes—at the hourly level there’s already a net increase of 1.17M USDT, and the pool’s abnormal ranking is as high as #14. That indicates this flow isn’t interested in big BTC; it’s specifically targeting CRV, a small-cap, to stir things up. The only thing to be mindful of is that with this kind of high-leverage push, once the funding rate gets ridiculously high, the risk of a short-term long squeeze/pullback is also building. But with this momentum right now, at least at the 15-minute level, the move hasn’t fully finished yet.
5
·
--
The funding rate is hanging at +0.0000%, but the U.S. stock perpetual volume for $NVDA is still $40.75M USDT, and the open interest has also topped out at 210,052 contracts—this contrast will make me look twice. Usually, if emotions are really overheating, the funding rate wouldn’t be this calm. What it looks like now is funds repeatedly rotating in this coin, but no one is willing to chase with high costs. With this kind of order book, the bulls are not disadvantaged.
The price is also interesting. Over the past 24 hours, the high/low is $219.25 / $216.04, and the current price is $219.19—basically closing near the upper end of the day’s range. The intraday swing isn’t large, and the 24h gain/loss is only +0.08%. This doesn’t look like an emotion-driven breakout; it feels more like high-level support and consolidation still holding. For a large-cap, there isn’t any big, dramatic surge or dump; instead, it suggests the chips (positions) are relatively stable. Especially since it ranks #7 on the U.S. stock perpetuals gainers list by percentage, and #14 by volume—this indicates both attention and trading depth, not a cold, odd move.
From the company perspective, I’m bullish, and the reasons are not complicated. NVIDIA’s bigger direction is still the AI compute theme. From what I understand, in this round of infrastructure narrative, it has always been in the most central position. The market isn’t just asking “is there an AI story or not” anymore—it’s asking who can continuously lock up upstream resources, who has pricing power, and who isn’t dispensable in the value chain. If $NVDA is being traded repeatedly, it means those expectations behind it haven’t fallen apart.
As for me, I won’t chase directly above $219. My limit orders will be placed back in the pullback zone—near the $216 area—and I’ll start with a 3% position. The logic is simple: the intraday low is already established, so using that level for risk control is straightforward. If later it pulls back and sells off in volume back below $216, I won’t buy, and I’ll even cancel the position I was planning to open. If I’m wrong, I won’t stubbornly hold on.
If we want to pick variables, there are still some. The funding rate is too steady, which suggests consensus isn’t extremely one-sided. But it also implies there aren’t the conditions for a squeeze. If later the open interest keeps increasing while the price can’t stay firm near the intraday highs, it can easily turn into high-level back-and-forth swapping of positions, and that rhythm will drag. My approach is still to stay lightly positioned and buy on retracements—not chase prices on emotion.
$NVDA #U.S. stocks perpetual
The market flips its face faster than turning a page—leave some room in your position.
The funding rate is hanging at +0.0000%, but the U.S. stock perpetual volume for $NVDA is still $40.75M USDT, and the open interest has also topped out at 210,052 contracts—this contrast will make me look twice. Usually, if emotions are really overheating, the funding rate wouldn’t be this calm. What it looks like now is funds repeatedly rotating in this coin, but no one is willing to chase with high costs. With this kind of order book, the bulls are not disadvantaged.
The price is also interesting. Over the past 24 hours, the high/low is $219.25 / $216.04, and the current price is $219.19—basically closing near the upper end of the day’s range. The intraday swing isn’t large, and the 24h gain/loss is only +0.08%. This doesn’t look like an emotion-driven breakout; it feels more like high-level support and consolidation still holding. For a large-cap, there isn’t any big, dramatic surge or dump; instead, it suggests the chips (positions) are relatively stable. Especially since it ranks #7 on the U.S. stock perpetuals gainers list by percentage, and #14 by volume—this indicates both attention and trading depth, not a cold, odd move.
From the company perspective, I’m bullish, and the reasons are not complicated. NVIDIA’s bigger direction is still the AI compute theme. From what I understand, in this round of infrastructure narrative, it has always been in the most central position. The market isn’t just asking “is there an AI story or not” anymore—it’s asking who can continuously lock up upstream resources, who has pricing power, and who isn’t dispensable in the value chain. If $NVDA is being traded repeatedly, it means those expectations behind it haven’t fallen apart.
As for me, I won’t chase directly above $219. My limit orders will be placed back in the pullback zone—near the $216 area—and I’ll start with a 3% position. The logic is simple: the intraday low is already established, so using that level for risk control is straightforward. If later it pulls back and sells off in volume back below $216, I won’t buy, and I’ll even cancel the position I was planning to open. If I’m wrong, I won’t stubbornly hold on.
If we want to pick variables, there are still some. The funding rate is too steady, which suggests consensus isn’t extremely one-sided. But it also implies there aren’t the conditions for a squeeze. If later the open interest keeps increasing while the price can’t stay firm near the intraday highs, it can easily turn into high-level back-and-forth swapping of positions, and that rhythm will drag. My approach is still to stay lightly positioned and buy on retracements—not chase prices on emotion.
$NVDA #U.S. stocks perpetual
The market flips its face faster than turning a page—leave some room in your position.
The price is also interesting. Over the past 24 hours, the high/low is $219.25 / $216.04, and the current price is $219.19—basically closing near the upper end of the day’s range. The intraday swing isn’t large, and the 24h gain/loss is only +0.08%. This doesn’t look like an emotion-driven breakout; it feels more like high-level support and consolidation still holding. For a large-cap, there isn’t any big, dramatic surge or dump; instead, it suggests the chips (positions) are relatively stable. Especially since it ranks #7 on the U.S. stock perpetuals gainers list by percentage, and #14 by volume—this indicates both attention and trading depth, not a cold, odd move.
From the company perspective, I’m bullish, and the reasons are not complicated. NVIDIA’s bigger direction is still the AI compute theme. From what I understand, in this round of infrastructure narrative, it has always been in the most central position. The market isn’t just asking “is there an AI story or not” anymore—it’s asking who can continuously lock up upstream resources, who has pricing power, and who isn’t dispensable in the value chain. If $NVDA is being traded repeatedly, it means those expectations behind it haven’t fallen apart.
As for me, I won’t chase directly above $219. My limit orders will be placed back in the pullback zone—near the $216 area—and I’ll start with a 3% position. The logic is simple: the intraday low is already established, so using that level for risk control is straightforward. If later it pulls back and sells off in volume back below $216, I won’t buy, and I’ll even cancel the position I was planning to open. If I’m wrong, I won’t stubbornly hold on.
If we want to pick variables, there are still some. The funding rate is too steady, which suggests consensus isn’t extremely one-sided. But it also implies there aren’t the conditions for a squeeze. If later the open interest keeps increasing while the price can’t stay firm near the intraday highs, it can easily turn into high-level back-and-forth swapping of positions, and that rhythm will drag. My approach is still to stay lightly positioned and buy on retracements—not chase prices on emotion.
$NVDA #U.S. stocks perpetual
The market flips its face faster than turning a page—leave some room in your position.
38
·
--
$GOOGL The thing that piqued my interest isn’t that it’s up +1.28%—it’s that the funding rate is still +0.0000%.
That feels really off.
The price is $346.56. In the last 24 hours, it touched a high of $349.16 and a low of $340.52. Trading volume is already $72.60M USDT, and open interest is still sitting at 186,476 contracts.
On paper, with this showing up at #14 on the US stock perpetuals gainers list and #17 on the volume list, long sentiment should be a bit hotter.
But here the rate hasn’t been lifted, which suggests the “chasing” fire hasn’t turned into a one-sided blaze.
People like me—who’ve been burned trading contracts—actually tend to take a closer look at setups like this.
If a stock is too hot, I generally don’t like touching it. When everyone crowds into the same direction, it’s easiest to get whipped back and forth.
With $GOOGL in particular, the situation feels more like someone is trading seriously, but the sentiment hasn’t spun out of control.
Also, the company itself: even if you don’t go digging into financial reports, common sense tells you it isn’t the kind of stock that relies on a single story to justify its valuation.
From what I understand, it’s positioned around a few big areas: internet entry points, advertising, cloud, and AI.
The main reason I’m more willing to be bullish on it is that it has both an internet traffic/inflow entry and the ability to turn new technology into a business.
A lot of companies talk about AI. But the real opportunity is whether they can actually plug AI into their existing products and gradually monetize it—which, in practice, often isn’t as common as people think.
$GOOGL is the kind of name you usually find annoying, but once the market starts repricing big platforms, it’s a label that’s hard to get around.
There’s another detail I’ll be watching closely.
In the perpetuals market, there’s volume and open interest, but the funding rate is flat—this indicates the “heat” isn’t from a stampede chasing it.
If later the basis stays stable and the funding rate doesn’t suddenly spike too high, personally I’d be more willing to stand on the bullish side.
I’m not pretending it’s risk-free—this trade also has variables.
Big-platform companies are most afraid of two things: first, the market thinks they’re moving too slowly; second, the new narrative doesn’t land as fast as expected.
As long as the external style rotates back to high-volatility small caps, a big heavyweight like $GOOGL can easily start to look less exciting.
But if you ask me which “old name” in Binance’s TradFi space I’m willing to keep watching—and even to take another look when it dips—among the US stocks, I’d put $GOOGL first.
That’s my take. Your money is your call. $GOOGL #USStocks
$GOOGL The thing that piqued my interest isn’t that it’s up +1.28%—it’s that the funding rate is still +0.0000%.
That feels really off.
The price is $346.56. In the last 24 hours, it touched a high of $349.16 and a low of $340.52. Trading volume is already $72.60M USDT, and open interest is still sitting at 186,476 contracts.
On paper, with this showing up at #14 on the US stock perpetuals gainers list and #17 on the volume list, long sentiment should be a bit hotter.
But here the rate hasn’t been lifted, which suggests the “chasing” fire hasn’t turned into a one-sided blaze.
People like me—who’ve been burned trading contracts—actually tend to take a closer look at setups like this.
If a stock is too hot, I generally don’t like touching it. When everyone crowds into the same direction, it’s easiest to get whipped back and forth.
With $GOOGL in particular, the situation feels more like someone is trading seriously, but the sentiment hasn’t spun out of control.
Also, the company itself: even if you don’t go digging into financial reports, common sense tells you it isn’t the kind of stock that relies on a single story to justify its valuation.
From what I understand, it’s positioned around a few big areas: internet entry points, advertising, cloud, and AI.
The main reason I’m more willing to be bullish on it is that it has both an internet traffic/inflow entry and the ability to turn new technology into a business.
A lot of companies talk about AI. But the real opportunity is whether they can actually plug AI into their existing products and gradually monetize it—which, in practice, often isn’t as common as people think.
$GOOGL is the kind of name you usually find annoying, but once the market starts repricing big platforms, it’s a label that’s hard to get around.
There’s another detail I’ll be watching closely.
In the perpetuals market, there’s volume and open interest, but the funding rate is flat—this indicates the “heat” isn’t from a stampede chasing it.
If later the basis stays stable and the funding rate doesn’t suddenly spike too high, personally I’d be more willing to stand on the bullish side.
I’m not pretending it’s risk-free—this trade also has variables.
Big-platform companies are most afraid of two things: first, the market thinks they’re moving too slowly; second, the new narrative doesn’t land as fast as expected.
As long as the external style rotates back to high-volatility small caps, a big heavyweight like $GOOGL can easily start to look less exciting.
But if you ask me which “old name” in Binance’s TradFi space I’m willing to keep watching—and even to take another look when it dips—among the US stocks, I’d put $GOOGL first.
That’s my take. Your money is your call. $GOOGL #USStocks
That feels really off.
The price is $346.56. In the last 24 hours, it touched a high of $349.16 and a low of $340.52. Trading volume is already $72.60M USDT, and open interest is still sitting at 186,476 contracts.
On paper, with this showing up at #14 on the US stock perpetuals gainers list and #17 on the volume list, long sentiment should be a bit hotter.
But here the rate hasn’t been lifted, which suggests the “chasing” fire hasn’t turned into a one-sided blaze.
People like me—who’ve been burned trading contracts—actually tend to take a closer look at setups like this.
If a stock is too hot, I generally don’t like touching it. When everyone crowds into the same direction, it’s easiest to get whipped back and forth.
With $GOOGL in particular, the situation feels more like someone is trading seriously, but the sentiment hasn’t spun out of control.
Also, the company itself: even if you don’t go digging into financial reports, common sense tells you it isn’t the kind of stock that relies on a single story to justify its valuation.
From what I understand, it’s positioned around a few big areas: internet entry points, advertising, cloud, and AI.
The main reason I’m more willing to be bullish on it is that it has both an internet traffic/inflow entry and the ability to turn new technology into a business.
A lot of companies talk about AI. But the real opportunity is whether they can actually plug AI into their existing products and gradually monetize it—which, in practice, often isn’t as common as people think.
$GOOGL is the kind of name you usually find annoying, but once the market starts repricing big platforms, it’s a label that’s hard to get around.
There’s another detail I’ll be watching closely.
In the perpetuals market, there’s volume and open interest, but the funding rate is flat—this indicates the “heat” isn’t from a stampede chasing it.
If later the basis stays stable and the funding rate doesn’t suddenly spike too high, personally I’d be more willing to stand on the bullish side.
I’m not pretending it’s risk-free—this trade also has variables.
Big-platform companies are most afraid of two things: first, the market thinks they’re moving too slowly; second, the new narrative doesn’t land as fast as expected.
As long as the external style rotates back to high-volatility small caps, a big heavyweight like $GOOGL can easily start to look less exciting.
But if you ask me which “old name” in Binance’s TradFi space I’m willing to keep watching—and even to take another look when it dips—among the US stocks, I’d put $GOOGL first.
That’s my take. Your money is your call. $GOOGL #USStocks
14
·
--
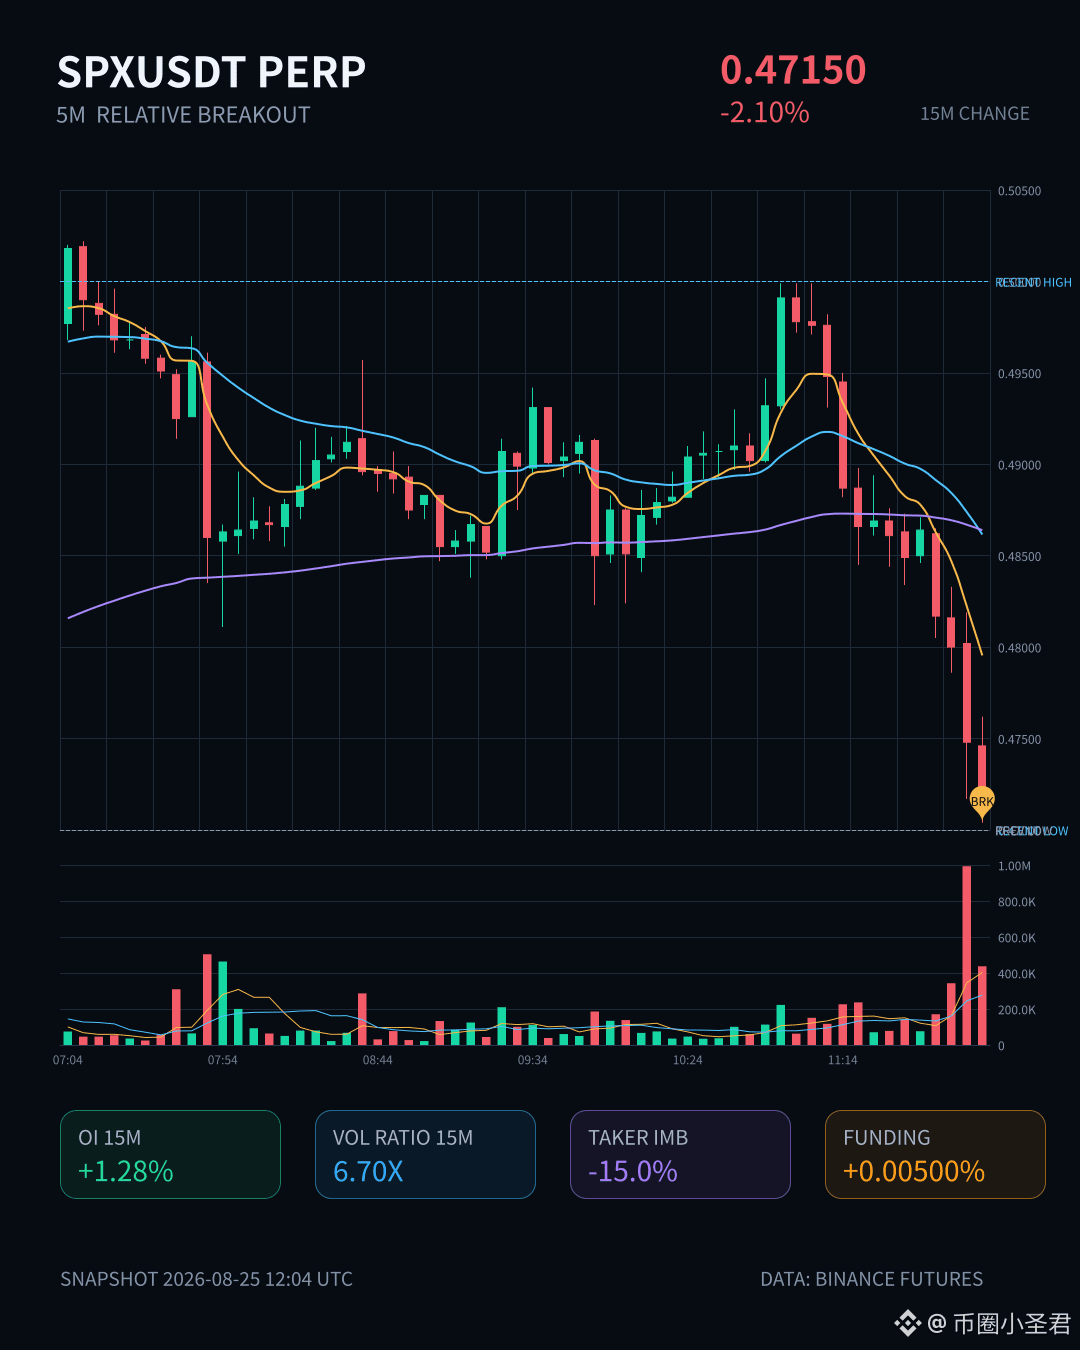
$SPX Just got pinned to the ground by a massive bearish long black candle. In just 15 minutes it’s down -2.1%, while volume surged to 6.7x. The volatility Z-score is up close to 2.44—this isn’t a normal slip, it’s like someone is pressing your head down and forcing the price lower.
Even more noteworthy: while the price is falling, OI is actually rising. Contract open interest is up +1.28%, yet nominally it’s shrinking. This scene is very typical: fresh long positions are getting smashed, while shorts are taking the opportunity to add. Active trade volume is down 15%, and the buy/sell ratio is 0.74. Even the lower wick of the last 20 five-minute candles has been directly pierced through.
This isn’t just a simple pullback—it looks more like a resonance between newly entered leveraged shorts and passive longs conceding defeat. The funding rate is still sitting at a high level, which suggests many people are still holding long positions waiting for a bounce, but the market action is no longer behaving rationally. The overall abnormality score for the whole pool is ranked #14, and it’s been hanging there for several consecutive cycles—the system really is watching it.
Honestly, I don’t dare catch this falling knife right now. Unless you see a clear move where selloff slows down on shrinking volume and a stop to the decline, it’s just a meat grinder. Of course, it could also be an opportunity—it all depends on who ends up being the bagholder. Be cautious. Don’t fight leverage.
$SPX Just got pinned to the ground by a massive bearish long black candle. In just 15 minutes it’s down -2.1%, while volume surged to 6.7x. The volatility Z-score is up close to 2.44—this isn’t a normal slip, it’s like someone is pressing your head down and forcing the price lower.
Even more noteworthy: while the price is falling, OI is actually rising. Contract open interest is up +1.28%, yet nominally it’s shrinking. This scene is very typical: fresh long positions are getting smashed, while shorts are taking the opportunity to add. Active trade volume is down 15%, and the buy/sell ratio is 0.74. Even the lower wick of the last 20 five-minute candles has been directly pierced through.
This isn’t just a simple pullback—it looks more like a resonance between newly entered leveraged shorts and passive longs conceding defeat. The funding rate is still sitting at a high level, which suggests many people are still holding long positions waiting for a bounce, but the market action is no longer behaving rationally. The overall abnormality score for the whole pool is ranked #14, and it’s been hanging there for several consecutive cycles—the system really is watching it.
Honestly, I don’t dare catch this falling knife right now. Unless you see a clear move where selloff slows down on shrinking volume and a stop to the decline, it’s just a meat grinder. Of course, it could also be an opportunity—it all depends on who ends up being the bagholder. Be cautious. Don’t fight leverage.
Even more noteworthy: while the price is falling, OI is actually rising. Contract open interest is up +1.28%, yet nominally it’s shrinking. This scene is very typical: fresh long positions are getting smashed, while shorts are taking the opportunity to add. Active trade volume is down 15%, and the buy/sell ratio is 0.74. Even the lower wick of the last 20 five-minute candles has been directly pierced through.
This isn’t just a simple pullback—it looks more like a resonance between newly entered leveraged shorts and passive longs conceding defeat. The funding rate is still sitting at a high level, which suggests many people are still holding long positions waiting for a bounce, but the market action is no longer behaving rationally. The overall abnormality score for the whole pool is ranked #14, and it’s been hanging there for several consecutive cycles—the system really is watching it.
Honestly, I don’t dare catch this falling knife right now. Unless you see a clear move where selloff slows down on shrinking volume and a stop to the decline, it’s just a meat grinder. Of course, it could also be an opportunity—it all depends on who ends up being the bagholder. Be cautious. Don’t fight leverage.
13
·
--
$ENA This 15-minute sideways-down move looks kind of interesting. The volume was pulled directly up to 1.66x, and the price has also broken through the lower band of nearly 20 consecutive 5-minute K-lines.
The key isn’t how much it’s falling, but that the OI is shrinking at the same time—on the 15m contracts the notional value dropped by 1.26M, and on the 1-hour dimension it’s also moving downward. A pullback combined with position reduction like this is more like longs cutting losses and exiting, rather than shorts proactively piling on to crush the move. Active trade imbalance is -30%, the buy/sell ratio is 0.54. The market’s bearish sentiment is real and tangible. But with the anomaly across the whole pool at the level of #14 , it indicates that today’s downside move is already among the leading performers in the ecosystem.
The 24h trading volume of 410M is strong enough to hold it up, and liquidity is also fine. With this kind of structure, I won’t rush to chase short positions. Instead, I’ll watch for signals that the shrinking positions coincide with a bottoming-out. After all, de-leveraging at high levels and a trend reversal can look pretty similar on the K-line chart.
$ENA This 15-minute sideways-down move looks kind of interesting. The volume was pulled directly up to 1.66x, and the price has also broken through the lower band of nearly 20 consecutive 5-minute K-lines.
The key isn’t how much it’s falling, but that the OI is shrinking at the same time—on the 15m contracts the notional value dropped by 1.26M, and on the 1-hour dimension it’s also moving downward. A pullback combined with position reduction like this is more like longs cutting losses and exiting, rather than shorts proactively piling on to crush the move. Active trade imbalance is -30%, the buy/sell ratio is 0.54. The market’s bearish sentiment is real and tangible. But with the anomaly across the whole pool at the level of #14 , it indicates that today’s downside move is already among the leading performers in the ecosystem.
The 24h trading volume of 410M is strong enough to hold it up, and liquidity is also fine. With this kind of structure, I won’t rush to chase short positions. Instead, I’ll watch for signals that the shrinking positions coincide with a bottoming-out. After all, de-leveraging at high levels and a trend reversal can look pretty similar on the K-line chart.
The key isn’t how much it’s falling, but that the OI is shrinking at the same time—on the 15m contracts the notional value dropped by 1.26M, and on the 1-hour dimension it’s also moving downward. A pullback combined with position reduction like this is more like longs cutting losses and exiting, rather than shorts proactively piling on to crush the move. Active trade imbalance is -30%, the buy/sell ratio is 0.54. The market’s bearish sentiment is real and tangible. But with the anomaly across the whole pool at the level of #14 , it indicates that today’s downside move is already among the leading performers in the ecosystem.
The 24h trading volume of 410M is strong enough to hold it up, and liquidity is also fine. With this kind of structure, I won’t rush to chase short positions. Instead, I’ll watch for signals that the shrinking positions coincide with a bottoming-out. After all, de-leveraging at high levels and a trend reversal can look pretty similar on the K-line chart.
6
·
--
XPL is at it again.
In just 15 minutes, it dropped 1.43%. Trading volume surged to more than three times, and the price even broke through the lower bound of nearly 20 five-minute candlestick ranges. On the order book, there’s a clear主动卖压 (active selling pressure). The buy/sell ratio is 0.58, and the主动成交差 (active trade imbalance) is -26.4%. In plain terms, this wasn’t a sideways-to-bearish slow bleed—someone is genuinely making a move.
What’s interesting is that OI is actually shrinking instead. The 15m nominal change is -1.60%, and the 1h is also a slight net outflow. Combined with the fee rate still being at a high level, this looks more like longs deleveraging—after liquidation and stop-losses get hit in a chain—followed by a contraction phase, rather than the kind of plunge caused by new short positions rushing in.
It ranks #14 in abnormal orders across the whole pool, and #12 by nominal change—arguably one of the most front-row anomaly moves today.
Positions are down, price is down, and volatility has expanded—textbook-style liquidation of long positions at high levels. Next comes the question: will it keep grinding lower to wash out liquidity, or will it drop and then pull up a single spike to lure people back? It depends on whether, at this level, the volume can stop growing and start contracting.
$XPL —keep an eye on it for now. Don’t rush to catch it.
XPL is at it again.
In just 15 minutes, it dropped 1.43%. Trading volume surged to more than three times, and the price even broke through the lower bound of nearly 20 five-minute candlestick ranges. On the order book, there’s a clear主动卖压 (active selling pressure). The buy/sell ratio is 0.58, and the主动成交差 (active trade imbalance) is -26.4%. In plain terms, this wasn’t a sideways-to-bearish slow bleed—someone is genuinely making a move.
What’s interesting is that OI is actually shrinking instead. The 15m nominal change is -1.60%, and the 1h is also a slight net outflow. Combined with the fee rate still being at a high level, this looks more like longs deleveraging—after liquidation and stop-losses get hit in a chain—followed by a contraction phase, rather than the kind of plunge caused by new short positions rushing in.
It ranks #14 in abnormal orders across the whole pool, and #12 by nominal change—arguably one of the most front-row anomaly moves today.
Positions are down, price is down, and volatility has expanded—textbook-style liquidation of long positions at high levels. Next comes the question: will it keep grinding lower to wash out liquidity, or will it drop and then pull up a single spike to lure people back? It depends on whether, at this level, the volume can stop growing and start contracting.
$XPL —keep an eye on it for now. Don’t rush to catch it.
In just 15 minutes, it dropped 1.43%. Trading volume surged to more than three times, and the price even broke through the lower bound of nearly 20 five-minute candlestick ranges. On the order book, there’s a clear主动卖压 (active selling pressure). The buy/sell ratio is 0.58, and the主动成交差 (active trade imbalance) is -26.4%. In plain terms, this wasn’t a sideways-to-bearish slow bleed—someone is genuinely making a move.
What’s interesting is that OI is actually shrinking instead. The 15m nominal change is -1.60%, and the 1h is also a slight net outflow. Combined with the fee rate still being at a high level, this looks more like longs deleveraging—after liquidation and stop-losses get hit in a chain—followed by a contraction phase, rather than the kind of plunge caused by new short positions rushing in.
It ranks #14 in abnormal orders across the whole pool, and #12 by nominal change—arguably one of the most front-row anomaly moves today.
Positions are down, price is down, and volatility has expanded—textbook-style liquidation of long positions at high levels. Next comes the question: will it keep grinding lower to wash out liquidity, or will it drop and then pull up a single spike to lure people back? It depends on whether, at this level, the volume can stop growing and start contracting.
$XPL —keep an eye on it for now. Don’t rush to catch it.
29
·
--
$1000PEPE This move is kind of interesting.
In just 15 minutes, it’s up 2.19%. Volume surged to 6 times the usual level, and the price also broke above the upper bound of the range from the past ~20 candlesticks. On the surface, it looks like a breakout— but the OI is moving downward. In the 15-minute contracts, open interest fell by 0.19%, while nominal change is still +2%. This “price up + OI down” structure, plain and simple, looks more like short covering than fresh long entries.
At the 1-hour level, OI is also shrinking, -0.94%, and this has been a divergence across multiple consecutive cycles. The abnormal percentile has pushed up to 99%; across the whole pool, ranks #15 on the list, and nominal change is #14. This spot is either an excellent place to exit, or the starting point for capital coming in from outside the market. Active trades are down 9%, and the buy/sell ratio is 1.2—suggesting that spot demand on the buy side really is there.
But honestly, the way OI is shrinking—especially the way it behaved during the final leg of the rally—looks like it’s part of cleaning up shorts. The rise is real, but calling it a healthy rally yet would be premature. Over the last 24 hours, spot volume is 380 million U. Depth and liquidity are there. But if OI continues to stay flat rather than turning upward, then you have to be careful whether this is actually topping out.
Not trying to pour cold water—just don’t blindly chase. Structures near historical extreme ranges usually aren’t a one-step, straight-through kind of行情.
$1000PEPE This move is kind of interesting.
In just 15 minutes, it’s up 2.19%. Volume surged to 6 times the usual level, and the price also broke above the upper bound of the range from the past ~20 candlesticks. On the surface, it looks like a breakout— but the OI is moving downward. In the 15-minute contracts, open interest fell by 0.19%, while nominal change is still +2%. This “price up + OI down” structure, plain and simple, looks more like short covering than fresh long entries.
At the 1-hour level, OI is also shrinking, -0.94%, and this has been a divergence across multiple consecutive cycles. The abnormal percentile has pushed up to 99%; across the whole pool, ranks #15 on the list, and nominal change is #14. This spot is either an excellent place to exit, or the starting point for capital coming in from outside the market. Active trades are down 9%, and the buy/sell ratio is 1.2—suggesting that spot demand on the buy side really is there.
But honestly, the way OI is shrinking—especially the way it behaved during the final leg of the rally—looks like it’s part of cleaning up shorts. The rise is real, but calling it a healthy rally yet would be premature. Over the last 24 hours, spot volume is 380 million U. Depth and liquidity are there. But if OI continues to stay flat rather than turning upward, then you have to be careful whether this is actually topping out.
Not trying to pour cold water—just don’t blindly chase. Structures near historical extreme ranges usually aren’t a one-step, straight-through kind of行情.
In just 15 minutes, it’s up 2.19%. Volume surged to 6 times the usual level, and the price also broke above the upper bound of the range from the past ~20 candlesticks. On the surface, it looks like a breakout— but the OI is moving downward. In the 15-minute contracts, open interest fell by 0.19%, while nominal change is still +2%. This “price up + OI down” structure, plain and simple, looks more like short covering than fresh long entries.
At the 1-hour level, OI is also shrinking, -0.94%, and this has been a divergence across multiple consecutive cycles. The abnormal percentile has pushed up to 99%; across the whole pool, ranks #15 on the list, and nominal change is #14. This spot is either an excellent place to exit, or the starting point for capital coming in from outside the market. Active trades are down 9%, and the buy/sell ratio is 1.2—suggesting that spot demand on the buy side really is there.
But honestly, the way OI is shrinking—especially the way it behaved during the final leg of the rally—looks like it’s part of cleaning up shorts. The rise is real, but calling it a healthy rally yet would be premature. Over the last 24 hours, spot volume is 380 million U. Depth and liquidity are there. But if OI continues to stay flat rather than turning upward, then you have to be careful whether this is actually topping out.
Not trying to pour cold water—just don’t blindly chase. Structures near historical extreme ranges usually aren’t a one-step, straight-through kind of行情.
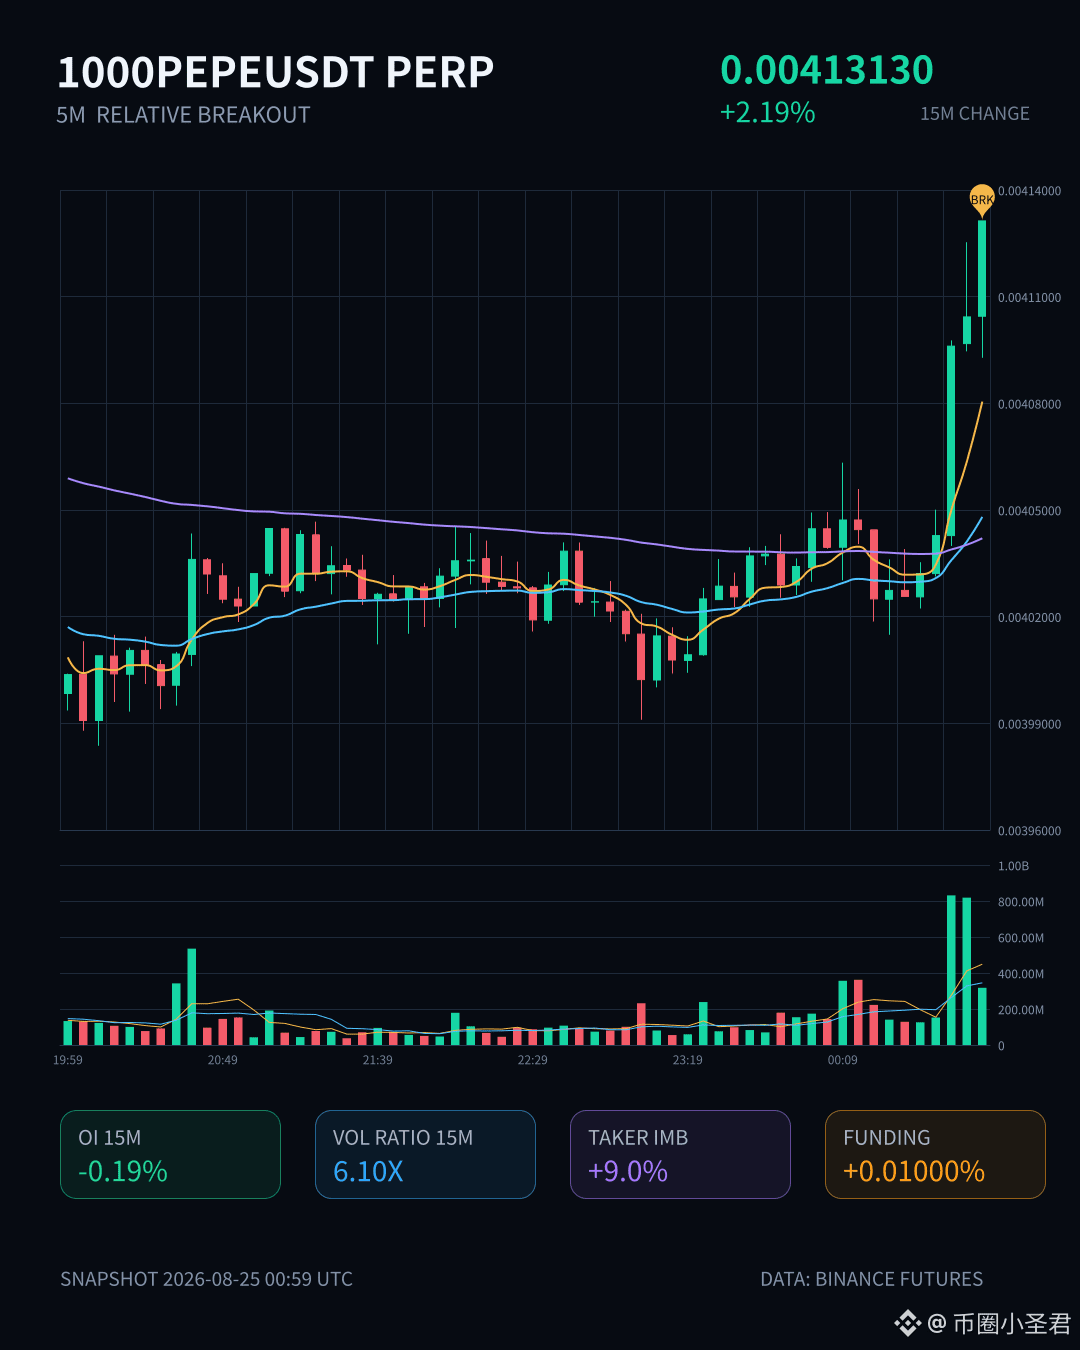
100
·
--
$PENGU This move has some substance.
In just 15 minutes it rose 1.53%. The closing price broke above the upper edge of the last roughly 20 five-minute K-line range—very textbook relative breakout structure. Volume expanded by 1.49x and volatility reached 2.04; it’s not one of those fake breakouts caused by low-volume drifting down.
More importantly, OI is climbing in sync—15-minute notional change +1.82%, and the 1-hour figure is directly +3.83%. Leveraged longs are putting real money in, not just a quick pump by retail/speculators and then running.
Funding rate is already at a high percentile recently, indicating market sentiment is running hot.
Passive trade gap is -9.4%, and the buy/sell ratio is 1.21. The bids are really pressing against the asks and hitting them.
In the whole pool, the abnormal percentile ranks #9, notional change is #14, and the 15-minute trading value is $294 million. At this scale, you can’t ignore it across the entire market.
My take: with price and OI rising together, going long is momentum-following. But since the funding rate and volatility are both swelling, don’t chase too high in the short term. If you want to get on board, wait for a pullback to the breakout-range upper edge and confirm it as support before entering; the stop-loss will also be comfortable. Don’t get carried away at this level.
$PENGU 15m breakout, OI resonance, and volume confirmation—the script is still fairly complete; the rest depends on whether the funds are willing to keep flowing in.
$PENGU This move has some substance.
In just 15 minutes it rose 1.53%. The closing price broke above the upper edge of the last roughly 20 five-minute K-line range—very textbook relative breakout structure. Volume expanded by 1.49x and volatility reached 2.04; it’s not one of those fake breakouts caused by low-volume drifting down.
More importantly, OI is climbing in sync—15-minute notional change +1.82%, and the 1-hour figure is directly +3.83%. Leveraged longs are putting real money in, not just a quick pump by retail/speculators and then running.
Funding rate is already at a high percentile recently, indicating market sentiment is running hot.
Passive trade gap is -9.4%, and the buy/sell ratio is 1.21. The bids are really pressing against the asks and hitting them.
In the whole pool, the abnormal percentile ranks #9, notional change is #14, and the 15-minute trading value is $294 million. At this scale, you can’t ignore it across the entire market.
My take: with price and OI rising together, going long is momentum-following. But since the funding rate and volatility are both swelling, don’t chase too high in the short term. If you want to get on board, wait for a pullback to the breakout-range upper edge and confirm it as support before entering; the stop-loss will also be comfortable. Don’t get carried away at this level.
$PENGU 15m breakout, OI resonance, and volume confirmation—the script is still fairly complete; the rest depends on whether the funds are willing to keep flowing in.
In just 15 minutes it rose 1.53%. The closing price broke above the upper edge of the last roughly 20 five-minute K-line range—very textbook relative breakout structure. Volume expanded by 1.49x and volatility reached 2.04; it’s not one of those fake breakouts caused by low-volume drifting down.
More importantly, OI is climbing in sync—15-minute notional change +1.82%, and the 1-hour figure is directly +3.83%. Leveraged longs are putting real money in, not just a quick pump by retail/speculators and then running.
Funding rate is already at a high percentile recently, indicating market sentiment is running hot.
Passive trade gap is -9.4%, and the buy/sell ratio is 1.21. The bids are really pressing against the asks and hitting them.
In the whole pool, the abnormal percentile ranks #9, notional change is #14, and the 15-minute trading value is $294 million. At this scale, you can’t ignore it across the entire market.
My take: with price and OI rising together, going long is momentum-following. But since the funding rate and volatility are both swelling, don’t chase too high in the short term. If you want to get on board, wait for a pullback to the breakout-range upper edge and confirm it as support before entering; the stop-loss will also be comfortable. Don’t get carried away at this level.
$PENGU 15m breakout, OI resonance, and volume confirmation—the script is still fairly complete; the rest depends on whether the funds are willing to keep flowing in.
26
·
--
$XPIN This move is indeed pretty interesting.
In just 15 minutes, it surged 1.85%. Volume also expanded to 1.87x, and the closing price stubbornly pushed through the upper boundary of the range formed by nearly 20 consecutive 5-minute candlesticks. Without saying anything else, just the quality of this breakout is enough to put it among the top abnormal performers across the whole pool.
Even more noteworthy is that OI and price are rising in sync—on the 15-minute horizon, contract positions increased by +0.23%, with a nominal change of 229K. The 1-hour view is also in a buildup state. This combination of “price up + positions up” indicates that more of the entrants are new leveraged longs, not that kind of fake rally caused by shorts covering.
The aggressive trade volume gap is -48.8%, the buy/sell ratio is 2.91, and the intent on the order book from the buyers is quite direct. Abnormal ranking #15 across the whole pool, nominal change ranking #14—so market attention is definitely not low.
In the last 24 hours, trading volume is over $13 million, so liquidity is sufficient, but it’s not the kind of huge, mega-sized order book either. On the trend side, it has stepped up; next, we’ll see whether the longs can hold this breakout level.
$XPIN This kind of movement is either the starting point of a short-term momentum cycle, or it’s the peak of a wave of sentiment—just keep an eye on how the volume changes.
$XPIN This move is indeed pretty interesting.
In just 15 minutes, it surged 1.85%. Volume also expanded to 1.87x, and the closing price stubbornly pushed through the upper boundary of the range formed by nearly 20 consecutive 5-minute candlesticks. Without saying anything else, just the quality of this breakout is enough to put it among the top abnormal performers across the whole pool.
Even more noteworthy is that OI and price are rising in sync—on the 15-minute horizon, contract positions increased by +0.23%, with a nominal change of 229K. The 1-hour view is also in a buildup state. This combination of “price up + positions up” indicates that more of the entrants are new leveraged longs, not that kind of fake rally caused by shorts covering.
The aggressive trade volume gap is -48.8%, the buy/sell ratio is 2.91, and the intent on the order book from the buyers is quite direct. Abnormal ranking #15 across the whole pool, nominal change ranking #14—so market attention is definitely not low.
In the last 24 hours, trading volume is over $13 million, so liquidity is sufficient, but it’s not the kind of huge, mega-sized order book either. On the trend side, it has stepped up; next, we’ll see whether the longs can hold this breakout level.
$XPIN This kind of movement is either the starting point of a short-term momentum cycle, or it’s the peak of a wave of sentiment—just keep an eye on how the volume changes.
In just 15 minutes, it surged 1.85%. Volume also expanded to 1.87x, and the closing price stubbornly pushed through the upper boundary of the range formed by nearly 20 consecutive 5-minute candlesticks. Without saying anything else, just the quality of this breakout is enough to put it among the top abnormal performers across the whole pool.
Even more noteworthy is that OI and price are rising in sync—on the 15-minute horizon, contract positions increased by +0.23%, with a nominal change of 229K. The 1-hour view is also in a buildup state. This combination of “price up + positions up” indicates that more of the entrants are new leveraged longs, not that kind of fake rally caused by shorts covering.
The aggressive trade volume gap is -48.8%, the buy/sell ratio is 2.91, and the intent on the order book from the buyers is quite direct. Abnormal ranking #15 across the whole pool, nominal change ranking #14—so market attention is definitely not low.
In the last 24 hours, trading volume is over $13 million, so liquidity is sufficient, but it’s not the kind of huge, mega-sized order book either. On the trend side, it has stepped up; next, we’ll see whether the longs can hold this breakout level.
$XPIN This kind of movement is either the starting point of a short-term momentum cycle, or it’s the peak of a wave of sentiment—just keep an eye on how the volume changes.
5
Log in to explore more content
Join global crypto users on Binance Square
⚡️ Get latest and useful information about crypto.
💬 Trusted by the world’s largest crypto exchange.
👍 Discover real insights from verified creators.
Email / Phone number
Trending Topics
1
#AppleDebutsFoldablePhone
29,615 views
623 Discussing
2
#TSMCAugustRevenueUp53.3%YoY
1,800 views
112 Discussing
3
#IranSaysReadyToEscalateWarWithUS
5,394 views
157 Discussing
4
#EUExtendsCentralContactPointToCASPs
8,523 views
232 Discussing
5
#US10YTreasuryYieldHitsHighestSinceNov2023
28,924 views
453 Discussing
6
#USTreasuryToBuyBackUpTo$6BLongDatedDebt
17,940 views
173 Discussing
7
#BitcoinSurpasses$79K
68,228 views
282 Discussing
8
#BrentCrudeTops$100
126,958 views
410 Discussing
9
#USADPWeeklyEmploymentRises12000
112,995 views
1,359 Discussing
10
#BankOfAmericaGroupPilotsUSBDCStablecoin
85,447 views
1,075 Discussing