
#17
17
20,295 views
170 Discussing
Hot
Latest

·
--
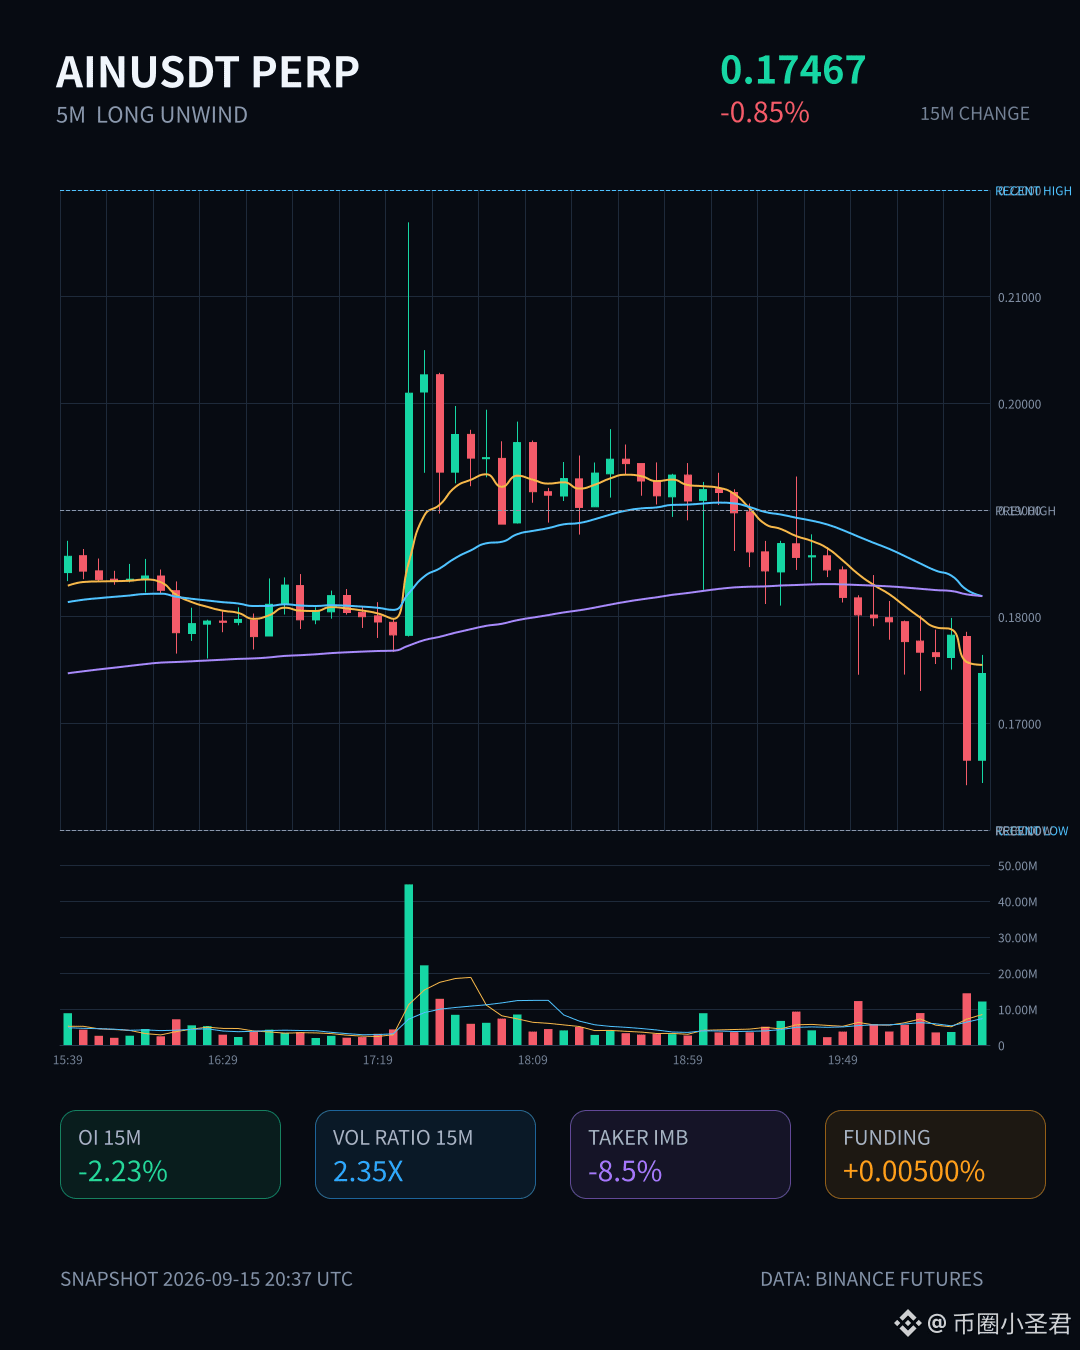
$AIN This dip isn’t that harsh—on the 15m timeframe it’s only -0.85%, but the OI is dropping much faster than the price.
On the 1h contracts, the notional open interest decreased directly by 1.47M USDT, -7.91%; on 15m it also ran off 549K. The price only dipped slightly, while OI fell hard—this is a typical deleveraging by longs: not a panic sell-off, but stop-losses and position trimming queuing up. Active executions were down -8.5%, the buy/sell ratio is 0.84, and there’s selling pressure, but it hasn’t reached a loss-of-control level.
What’s interesting is that the trade volume is 2.35x, with an abnormal percentile of 82.7%; the overall pool’s notional change ranks #17. In the last 24h, turnover is 341M—there’s still a lot of money in the pool. With this kind of volume paired with such OI contraction, it looks more like washing leverage rather than a trend reversal.
For now, I won’t move—I'll wait for OI to stabilize. Until the leverage is fully cleared, any bounce is still just a mirage.
$AIN This dip isn’t that harsh—on the 15m timeframe it’s only -0.85%, but the OI is dropping much faster than the price.
On the 1h contracts, the notional open interest decreased directly by 1.47M USDT, -7.91%; on 15m it also ran off 549K. The price only dipped slightly, while OI fell hard—this is a typical deleveraging by longs: not a panic sell-off, but stop-losses and position trimming queuing up. Active executions were down -8.5%, the buy/sell ratio is 0.84, and there’s selling pressure, but it hasn’t reached a loss-of-control level.
What’s interesting is that the trade volume is 2.35x, with an abnormal percentile of 82.7%; the overall pool’s notional change ranks #17. In the last 24h, turnover is 341M—there’s still a lot of money in the pool. With this kind of volume paired with such OI contraction, it looks more like washing leverage rather than a trend reversal.
For now, I won’t move—I'll wait for OI to stabilize. Until the leverage is fully cleared, any bounce is still just a mirage.
On the 1h contracts, the notional open interest decreased directly by 1.47M USDT, -7.91%; on 15m it also ran off 549K. The price only dipped slightly, while OI fell hard—this is a typical deleveraging by longs: not a panic sell-off, but stop-losses and position trimming queuing up. Active executions were down -8.5%, the buy/sell ratio is 0.84, and there’s selling pressure, but it hasn’t reached a loss-of-control level.
What’s interesting is that the trade volume is 2.35x, with an abnormal percentile of 82.7%; the overall pool’s notional change ranks #17. In the last 24h, turnover is 341M—there’s still a lot of money in the pool. With this kind of volume paired with such OI contraction, it looks more like washing leverage rather than a trend reversal.
For now, I won’t move—I'll wait for OI to stabilize. Until the leverage is fully cleared, any bounce is still just a mirage.
5

·
--
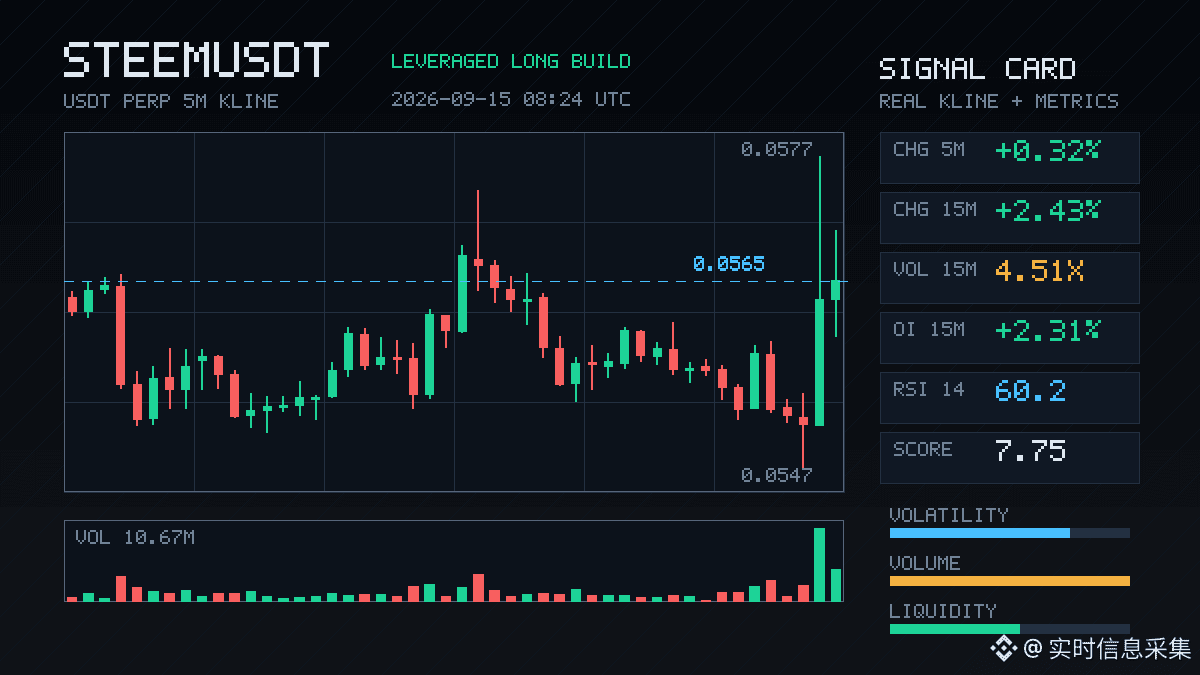
STEEM, this move has something.
In 15m, it pulled directly up 2.43%, with volume hitting 4.51x, volatility Z reaching 3.00—clearly not the kind of volume that random retail clicks can produce. Even more important: OI is rising in sync—15m +2.31%, 1h +1.98%. The abnormal percentile is already at 91.9%, and it ranks #17 across the whole pool.
When price rises and OI also rises, this structure looks more like new leveraged longs are entering rather than shorts being squeezed. Active trade imbalance is 11.3%, buy/sell ratio is 1.25—there are definitely people pushing on the buy side.
24h traded value is 41.7M. In the deep pool, being able to push out this kind of multiple suggests it’s not that sort of行情 that shatters the moment it touches. That said, the level #17 is also a bit tricky—too many front-row spectators. If anyone’s really going to run the next leg, we’ll need to see whether someone is willing to keep pushing higher.
Old coin—every time it moves, people start shouting “resurrection.” Don’t jump to conclusions yet this time. Watch whether OI can keep adding. If it’s just an intraday burst by liquidity hunters, then it’s only there for the excitement.
$STEEM
STEEM, this move has something.
In 15m, it pulled directly up 2.43%, with volume hitting 4.51x, volatility Z reaching 3.00—clearly not the kind of volume that random retail clicks can produce. Even more important: OI is rising in sync—15m +2.31%, 1h +1.98%. The abnormal percentile is already at 91.9%, and it ranks #17 across the whole pool.
When price rises and OI also rises, this structure looks more like new leveraged longs are entering rather than shorts being squeezed. Active trade imbalance is 11.3%, buy/sell ratio is 1.25—there are definitely people pushing on the buy side.
24h traded value is 41.7M. In the deep pool, being able to push out this kind of multiple suggests it’s not that sort of行情 that shatters the moment it touches. That said, the level #17 is also a bit tricky—too many front-row spectators. If anyone’s really going to run the next leg, we’ll need to see whether someone is willing to keep pushing higher.
Old coin—every time it moves, people start shouting “resurrection.” Don’t jump to conclusions yet this time. Watch whether OI can keep adding. If it’s just an intraday burst by liquidity hunters, then it’s only there for the excitement.
$STEEM
In 15m, it pulled directly up 2.43%, with volume hitting 4.51x, volatility Z reaching 3.00—clearly not the kind of volume that random retail clicks can produce. Even more important: OI is rising in sync—15m +2.31%, 1h +1.98%. The abnormal percentile is already at 91.9%, and it ranks #17 across the whole pool.
When price rises and OI also rises, this structure looks more like new leveraged longs are entering rather than shorts being squeezed. Active trade imbalance is 11.3%, buy/sell ratio is 1.25—there are definitely people pushing on the buy side.
24h traded value is 41.7M. In the deep pool, being able to push out this kind of multiple suggests it’s not that sort of行情 that shatters the moment it touches. That said, the level #17 is also a bit tricky—too many front-row spectators. If anyone’s really going to run the next leg, we’ll need to see whether someone is willing to keep pushing higher.
Old coin—every time it moves, people start shouting “resurrection.” Don’t jump to conclusions yet this time. Watch whether OI can keep adding. If it’s just an intraday burst by liquidity hunters, then it’s only there for the excitement.
$STEEM
10
·
--
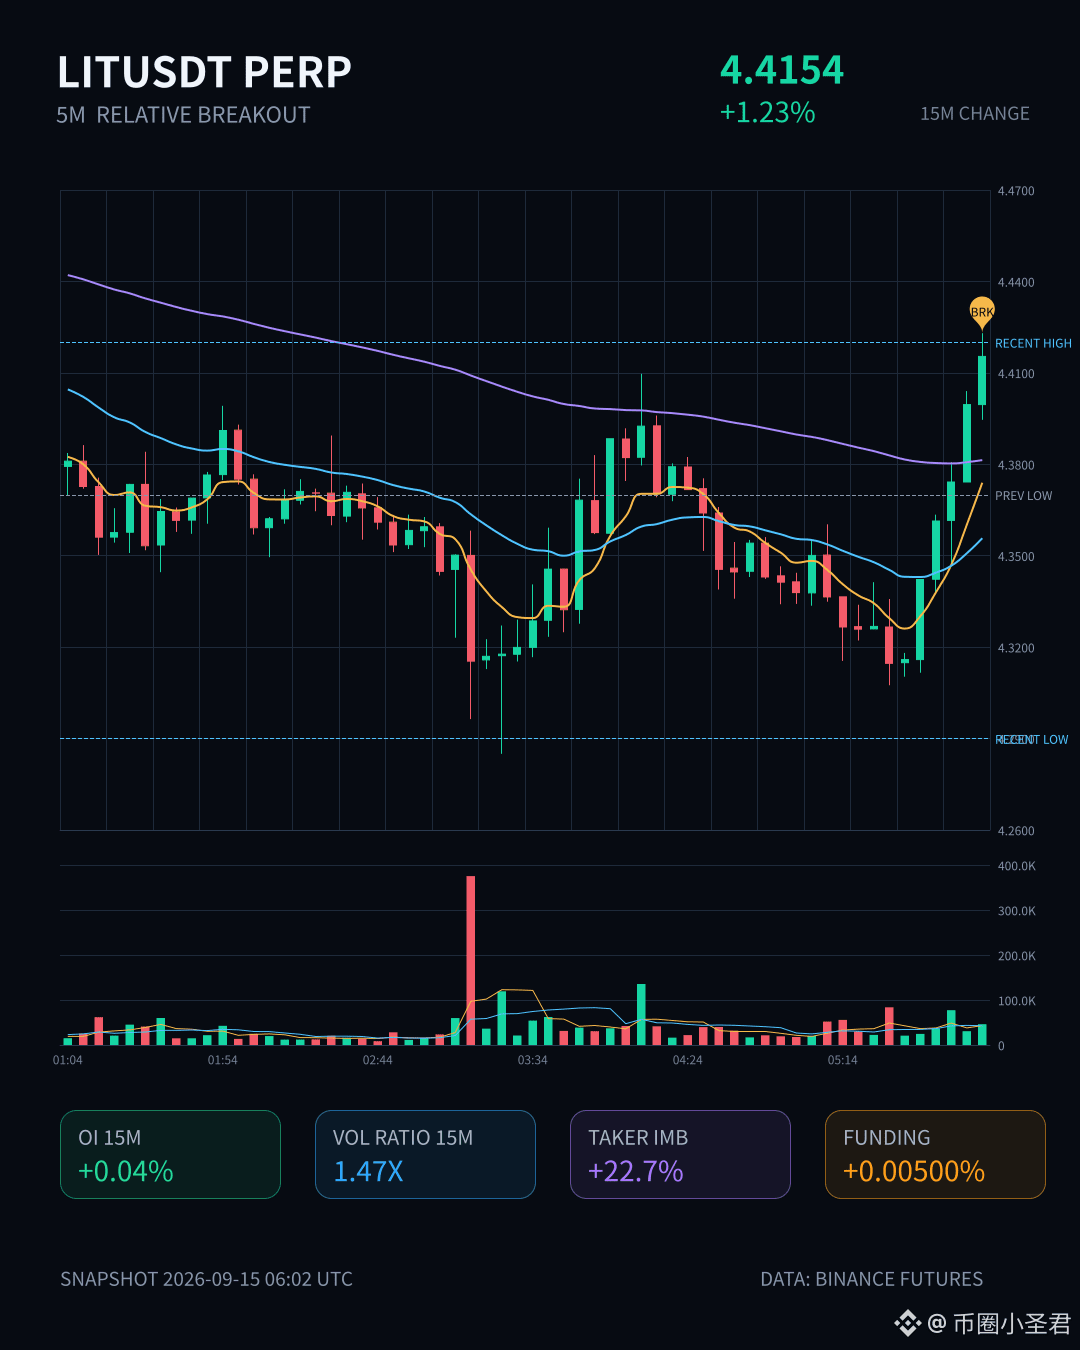
$LIT This one is a bit interesting.
On the 15m, it pulled up 1.23%. Volume is 1.47x, and the volatility (Z) hit 2.68—straight up reclaiming the upper edge of the last 20 or so 5m candles.
The key is that OI moves together with the price, and the vibe of newly added leveraged longs is quite strong. Active trades are down 22.7%, the buy/sell ratio is 1.59, and buy orders are clearly dominant.
The abnormal percentile for the whole pool is 88.3%, with an abnormal rank of #17 and a notional change rank of #11. It’s been continuing across several consecutive cycles—this isn’t the kind of one-off wick.
Over the past 24h, turnover is 82.26M, and the order book depth is also solid.
First, watch whether it can hold steady at the boundary of this range.
$LIT This one is a bit interesting.
On the 15m, it pulled up 1.23%. Volume is 1.47x, and the volatility (Z) hit 2.68—straight up reclaiming the upper edge of the last 20 or so 5m candles.
The key is that OI moves together with the price, and the vibe of newly added leveraged longs is quite strong. Active trades are down 22.7%, the buy/sell ratio is 1.59, and buy orders are clearly dominant.
The abnormal percentile for the whole pool is 88.3%, with an abnormal rank of #17 and a notional change rank of #11. It’s been continuing across several consecutive cycles—this isn’t the kind of one-off wick.
Over the past 24h, turnover is 82.26M, and the order book depth is also solid.
First, watch whether it can hold steady at the boundary of this range.
On the 15m, it pulled up 1.23%. Volume is 1.47x, and the volatility (Z) hit 2.68—straight up reclaiming the upper edge of the last 20 or so 5m candles.
The key is that OI moves together with the price, and the vibe of newly added leveraged longs is quite strong. Active trades are down 22.7%, the buy/sell ratio is 1.59, and buy orders are clearly dominant.
The abnormal percentile for the whole pool is 88.3%, with an abnormal rank of #17 and a notional change rank of #11. It’s been continuing across several consecutive cycles—this isn’t the kind of one-off wick.
Over the past 24h, turnover is 82.26M, and the order book depth is also solid.
First, watch whether it can hold steady at the boundary of this range.
8

$MARSCOIN · BREAKOUT DOWN: is it a real breakout or just a 24h fluctuation?🧠 Smart Money flow on $MARSCOIN: 1 intelligent wallet/trader · MONEY FLOW. Market: 0.0898 · 24h -15.12% · volume ~74.7M USDT · 992,586 trades.
Observed net Smart Money flow: ~-0.01M USD. Smart Money data is evidence for verification, not a copy-trading order.
Confirmation level if: Breaking 0.08352 with expanded volume will make the ongoing bearish scenario more credible.
Evidence is denied if: You fail to hold the lower zone, and taking back the midpoint 0.095895 will make the pressure weaken. 🎯 Priority trend: **SHORT · STRONG · 91/100**.
$MARSCOIN · BREAKOUT DOWN: is it a real breakout or just a 24h fluctuation?
🧠 Smart Money flow on $MARSCOIN : 1 intelligent wallet/trader · MONEY FLOW. Market: 0.0898 · 24h -15.12% · volume ~74.7M USDT · 992,586 trades.
Observed net Smart Money flow: ~-0.01M USD. Smart Money data is evidence for verification, not a copy-trading order.
Confirmation level if: Breaking 0.08352 with expanded volume will make the ongoing bearish scenario more credible.
Evidence is denied if: You fail to hold the lower zone, and taking back the midpoint 0.095895 will make the pressure weaken. 🎯 Priority trend: **SHORT · STRONG · 91/100**.
Observed net Smart Money flow: ~-0.01M USD. Smart Money data is evidence for verification, not a copy-trading order.
Confirmation level if: Breaking 0.08352 with expanded volume will make the ongoing bearish scenario more credible.
Evidence is denied if: You fail to hold the lower zone, and taking back the midpoint 0.095895 will make the pressure weaken. 🎯 Priority trend: **SHORT · STRONG · 91/100**.
8

·
--
$Bull's here, this 15m just dropped 2.47% straight away—volume hit 4.62x, volatility (Z) 3.98, clearly something is going on with capital.
Over the 1h window, OI fell 0.44%, nominally down by 1.4M; coupled with the price decline, this is a classic long-position de-leveraging script. The closing price broke below the lower edge of the recent ~20 5m bars. Active trade imbalance is -25.6%, and the buy/sell ratio is 0.59, indicating sell pressure is dominant.
However, OI’s abnormal percentile is 83.1%—it ranks #17 in abnormality across the whole pool, with nominal change at #4—suggesting this spike is among the more prominent ones in the entire pool. The 24h trading value is still 221.8M, so liquidity isn’t a big issue.
With this kind of structure, it’s either a washout or a sign of a potential regime change. Don’t rush to catch the knife—wait for signs of stabilization.
$Bull's here, this 15m just dropped 2.47% straight away—volume hit 4.62x, volatility (Z) 3.98, clearly something is going on with capital.
Over the 1h window, OI fell 0.44%, nominally down by 1.4M; coupled with the price decline, this is a classic long-position de-leveraging script. The closing price broke below the lower edge of the recent ~20 5m bars. Active trade imbalance is -25.6%, and the buy/sell ratio is 0.59, indicating sell pressure is dominant.
However, OI’s abnormal percentile is 83.1%—it ranks #17 in abnormality across the whole pool, with nominal change at #4—suggesting this spike is among the more prominent ones in the entire pool. The 24h trading value is still 221.8M, so liquidity isn’t a big issue.
With this kind of structure, it’s either a washout or a sign of a potential regime change. Don’t rush to catch the knife—wait for signs of stabilization.
Over the 1h window, OI fell 0.44%, nominally down by 1.4M; coupled with the price decline, this is a classic long-position de-leveraging script. The closing price broke below the lower edge of the recent ~20 5m bars. Active trade imbalance is -25.6%, and the buy/sell ratio is 0.59, indicating sell pressure is dominant.
However, OI’s abnormal percentile is 83.1%—it ranks #17 in abnormality across the whole pool, with nominal change at #4—suggesting this spike is among the more prominent ones in the entire pool. The 24h trading value is still 221.8M, so liquidity isn’t a big issue.
With this kind of structure, it’s either a washout or a sign of a potential regime change. Don’t rush to catch the knife—wait for signs of stabilization.
131

·
--
$EIGEN This dip came a bit fast. In the 15m timeframe, it directly dropped 1.72%; volume surged to more than 7 times the average. The buy/sell ratio is 0.36, and the selling pressure is very clear.
What’s interesting is that OI is also falling—15m -0.97%, 1h -1.02%. Nominally it’s down by a bit over $200k. Price is down while open interest is shrinking. This doesn’t look like fresh shorts entering; it looks more like long positions are getting squeezed out—stop-outs or主动减仓 (active de-risking).
The OI anomaly percentile has already hit 98.4%. It ranks #17 across the whole pool, indicating this divergence isn’t just a small move—it has been sustained across several consecutive cycles. As the candle closes, it also broke below the lower band of the last ~20 5m periods. Structurally, it’s weak.
Over the past 24h, turnover is only 11M, so liquidity isn’t thick. With this kind of volume, leveraging can amplify the downside and trigger knock-on effects. Watch first—don’t rush to catch it.
$EIGEN This dip came a bit fast. In the 15m timeframe, it directly dropped 1.72%; volume surged to more than 7 times the average. The buy/sell ratio is 0.36, and the selling pressure is very clear.
What’s interesting is that OI is also falling—15m -0.97%, 1h -1.02%. Nominally it’s down by a bit over $200k. Price is down while open interest is shrinking. This doesn’t look like fresh shorts entering; it looks more like long positions are getting squeezed out—stop-outs or主动减仓 (active de-risking).
The OI anomaly percentile has already hit 98.4%. It ranks #17 across the whole pool, indicating this divergence isn’t just a small move—it has been sustained across several consecutive cycles. As the candle closes, it also broke below the lower band of the last ~20 5m periods. Structurally, it’s weak.
Over the past 24h, turnover is only 11M, so liquidity isn’t thick. With this kind of volume, leveraging can amplify the downside and trigger knock-on effects. Watch first—don’t rush to catch it.
What’s interesting is that OI is also falling—15m -0.97%, 1h -1.02%. Nominally it’s down by a bit over $200k. Price is down while open interest is shrinking. This doesn’t look like fresh shorts entering; it looks more like long positions are getting squeezed out—stop-outs or主动减仓 (active de-risking).
The OI anomaly percentile has already hit 98.4%. It ranks #17 across the whole pool, indicating this divergence isn’t just a small move—it has been sustained across several consecutive cycles. As the candle closes, it also broke below the lower band of the last ~20 5m periods. Structurally, it’s weak.
Over the past 24h, turnover is only 11M, so liquidity isn’t thick. With this kind of volume, leveraging can amplify the downside and trigger knock-on effects. Watch first—don’t rush to catch it.
10
·
--
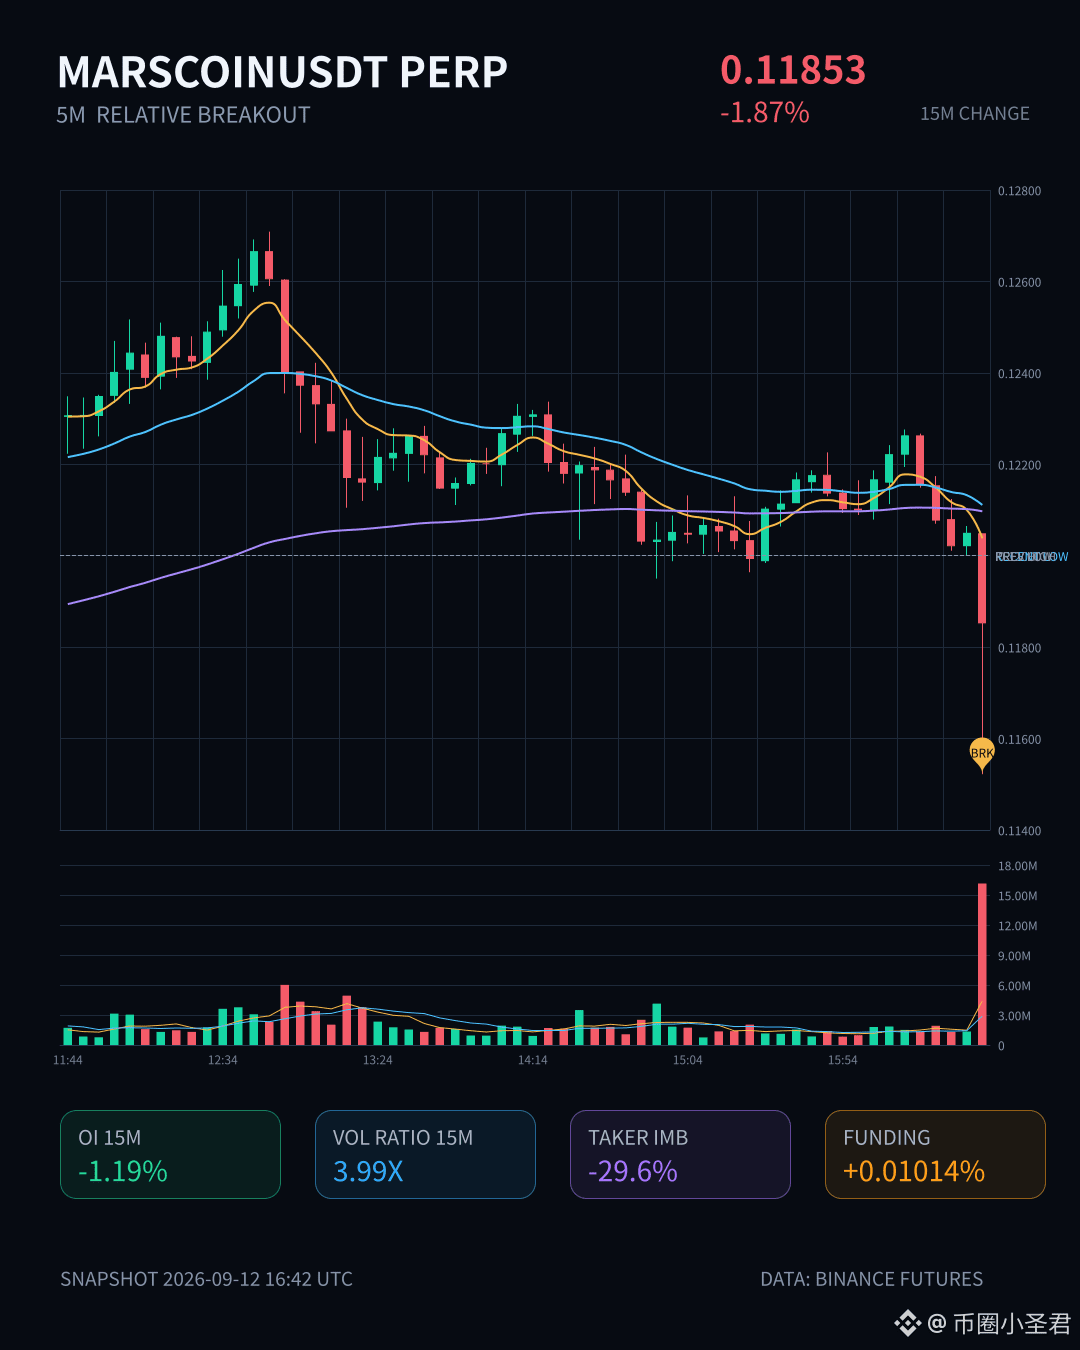
$MARSCOIN This drop is a bit sudden—on the 15m chart it’s directly -1.87%. Trading volume has hit 3.99x, with a Z value of 2.08. This looks like heavy volume driving the price down.
OI is also falling: 15m -1.19% (-734K U), 1h -0.79% (-811K U). Price is down while OI is down too. That’s a typical structure of long deleveraging, stop-losses, or reducing positions—not the kind of setup where shorts are massively adding.
Active buy/sell ratio is 0.54, and active trade volume is down -29.6%—sell pressure is taking the lead.
The 5m chart has already broken below the lower edge of the past ~20 K bars. The 24h traded value is still 117M, so liquidity looks sufficient. But OI’s abnormal percentile is 86.9%, with abnormalities in the whole pool at #17 and nominal change at #11—right here, money is really exiting in cash. Don’t rush to catch it.
Wait and see first. Watch whether OI can stabilize; otherwise, this deleveraging may not be over yet.
$MARSCOIN This drop is a bit sudden—on the 15m chart it’s directly -1.87%. Trading volume has hit 3.99x, with a Z value of 2.08. This looks like heavy volume driving the price down.
OI is also falling: 15m -1.19% (-734K U), 1h -0.79% (-811K U). Price is down while OI is down too. That’s a typical structure of long deleveraging, stop-losses, or reducing positions—not the kind of setup where shorts are massively adding.
Active buy/sell ratio is 0.54, and active trade volume is down -29.6%—sell pressure is taking the lead.
The 5m chart has already broken below the lower edge of the past ~20 K bars. The 24h traded value is still 117M, so liquidity looks sufficient. But OI’s abnormal percentile is 86.9%, with abnormalities in the whole pool at #17 and nominal change at #11—right here, money is really exiting in cash. Don’t rush to catch it.
Wait and see first. Watch whether OI can stabilize; otherwise, this deleveraging may not be over yet.
OI is also falling: 15m -1.19% (-734K U), 1h -0.79% (-811K U). Price is down while OI is down too. That’s a typical structure of long deleveraging, stop-losses, or reducing positions—not the kind of setup where shorts are massively adding.
Active buy/sell ratio is 0.54, and active trade volume is down -29.6%—sell pressure is taking the lead.
The 5m chart has already broken below the lower edge of the past ~20 K bars. The 24h traded value is still 117M, so liquidity looks sufficient. But OI’s abnormal percentile is 86.9%, with abnormalities in the whole pool at #17 and nominal change at #11—right here, money is really exiting in cash. Don’t rush to catch it.
Wait and see first. Watch whether OI can stabilize; otherwise, this deleveraging may not be over yet.
46
·
--
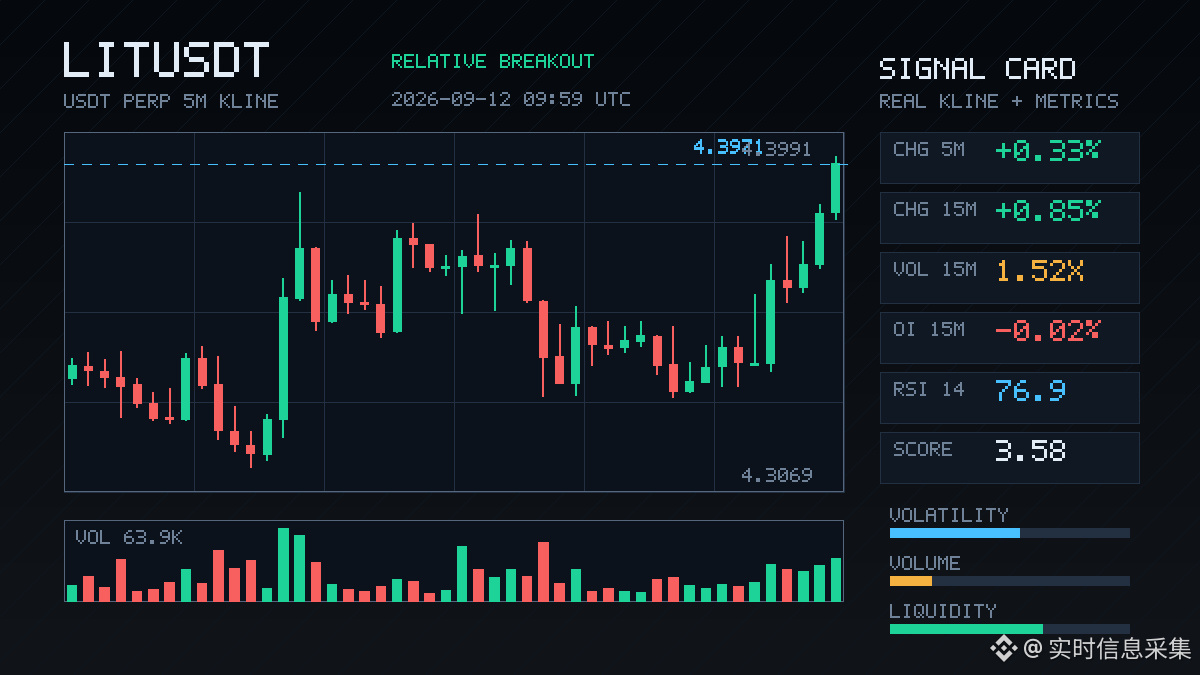
$LIT 15m A breakout with increased volume pulls through the upper edge of about the last 20 bars of the 5m range; volume is 1.52x, volatility Z is 2.16. The whole pool is abnormal #17, and nominal changes #9. There’s definitely something going on at this spot. But OI: 15m -0.02%, 1h +0.07%; the price is up while the open positions don’t follow—more like short-covering pushing prices higher. The active buy/sell ratio (1.01) also doesn’t look like there’s strong bullish accumulation. First, let’s see if it can hold its ground. I’m not comfortable chasing after a surge, because I’m worried it could be a fake breakout.
$LIT 15m A breakout with increased volume pulls through the upper edge of about the last 20 bars of the 5m range; volume is 1.52x, volatility Z is 2.16. The whole pool is abnormal #17, and nominal changes #9. There’s definitely something going on at this spot. But OI: 15m -0.02%, 1h +0.07%; the price is up while the open positions don’t follow—more like short-covering pushing prices higher. The active buy/sell ratio (1.01) also doesn’t look like there’s strong bullish accumulation. First, let’s see if it can hold its ground. I’m not comfortable chasing after a surge, because I’m worried it could be a fake breakout.
47
·
--
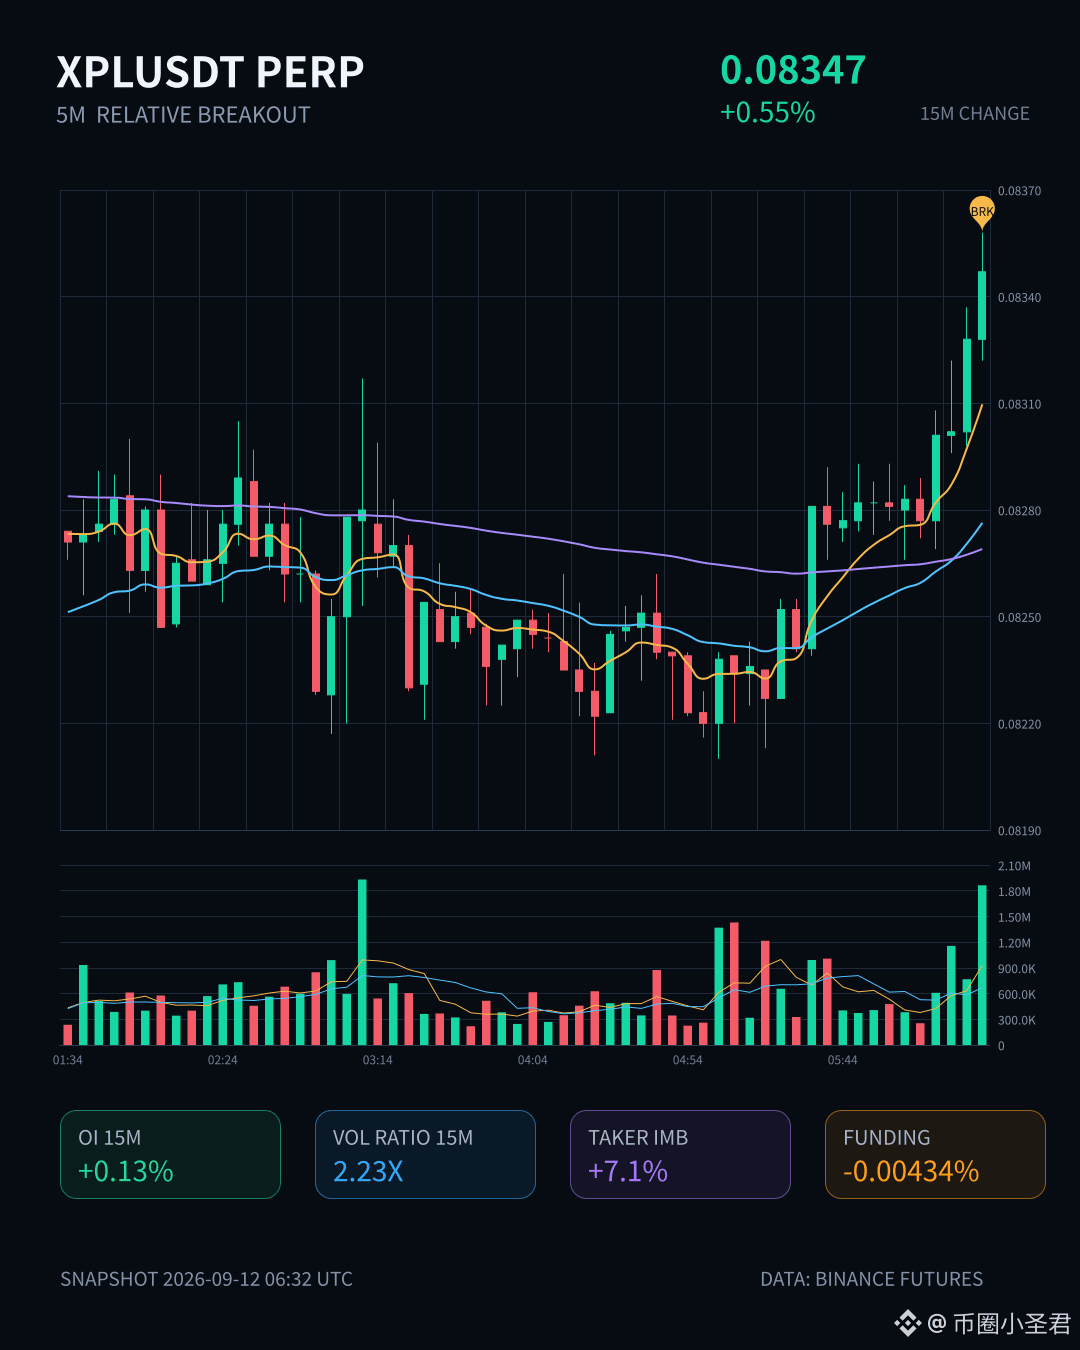
$XPL 15m Suddenly burst in volume, up 2.23x. The price rose 0.55%, directly breaking through the upper edge of nearly 20 of the 5m candles. OI also increased in sync—1h nominal +509K, with the aggressive buy/sell ratio at 1.15. This doesn’t look like short covering or a fake push; it’s more like new long positions coming in with leverage.
Across the whole pool, abnormal activity #17 and nominal changes #21. The depth confirms trades are occurring above the usual pattern. This spot is kind of interesting—keep an eye on whether it can hold steady.
$XPL 15m Suddenly burst in volume, up 2.23x. The price rose 0.55%, directly breaking through the upper edge of nearly 20 of the 5m candles. OI also increased in sync—1h nominal +509K, with the aggressive buy/sell ratio at 1.15. This doesn’t look like short covering or a fake push; it’s more like new long positions coming in with leverage.
Across the whole pool, abnormal activity #17 and nominal changes #21. The depth confirms trades are occurring above the usual pattern. This spot is kind of interesting—keep an eye on whether it can hold steady.
Across the whole pool, abnormal activity #17 and nominal changes #21. The depth confirms trades are occurring above the usual pattern. This spot is kind of interesting—keep an eye on whether it can hold steady.
1
·
--
$LIT This 15m move is a bit off.
Price is down 1.22%, trading volume is up 1.45x, volatility (Z) hit 2.76, and the close dropped straight through the lower bound of the last ~20 5m K-bars. Aggressive volume is worse by -6.1%, buy/sell ratio is 0.89, and sell pressure is pushing.
But what about OI? In the 15m timeframe, it’s still slightly up by +0.05%, and over 1h it’s basically flat at -0.02%. Price is falling while OI isn’t dropping—in fact it’s rising. That looks more like new leveraged short positions being added, not longs getting squeezed into exiting. The nominal change is actually -731K, which indicates positions are being rotated: the old longs are exiting and the new shorts are taking their place.
Abnormal percentile is 76.4%, Pool #17, nominal change #8. Last 24h turnover is 93M—liquidity is sufficient, and the depth confirmation also touched the range boundary.
Structurally it’s bearish, but these shorts at this level are new leverage shorts, not panic selling. If the lower bound can’t be reclaimed, there may be another leg down. If it quickly snaps back into the range, these new shorts will be uncomfortable.
Watch the 5m close.
$LIT This 15m move is a bit off.
Price is down 1.22%, trading volume is up 1.45x, volatility (Z) hit 2.76, and the close dropped straight through the lower bound of the last ~20 5m K-bars. Aggressive volume is worse by -6.1%, buy/sell ratio is 0.89, and sell pressure is pushing.
But what about OI? In the 15m timeframe, it’s still slightly up by +0.05%, and over 1h it’s basically flat at -0.02%. Price is falling while OI isn’t dropping—in fact it’s rising. That looks more like new leveraged short positions being added, not longs getting squeezed into exiting. The nominal change is actually -731K, which indicates positions are being rotated: the old longs are exiting and the new shorts are taking their place.
Abnormal percentile is 76.4%, Pool #17, nominal change #8. Last 24h turnover is 93M—liquidity is sufficient, and the depth confirmation also touched the range boundary.
Structurally it’s bearish, but these shorts at this level are new leverage shorts, not panic selling. If the lower bound can’t be reclaimed, there may be another leg down. If it quickly snaps back into the range, these new shorts will be uncomfortable.
Watch the 5m close.
Price is down 1.22%, trading volume is up 1.45x, volatility (Z) hit 2.76, and the close dropped straight through the lower bound of the last ~20 5m K-bars. Aggressive volume is worse by -6.1%, buy/sell ratio is 0.89, and sell pressure is pushing.
But what about OI? In the 15m timeframe, it’s still slightly up by +0.05%, and over 1h it’s basically flat at -0.02%. Price is falling while OI isn’t dropping—in fact it’s rising. That looks more like new leveraged short positions being added, not longs getting squeezed into exiting. The nominal change is actually -731K, which indicates positions are being rotated: the old longs are exiting and the new shorts are taking their place.
Abnormal percentile is 76.4%, Pool #17, nominal change #8. Last 24h turnover is 93M—liquidity is sufficient, and the depth confirmation also touched the range boundary.
Structurally it’s bearish, but these shorts at this level are new leverage shorts, not panic selling. If the lower bound can’t be reclaimed, there may be another leg down. If it quickly snaps back into the range, these new shorts will be uncomfortable.
Watch the 5m close.
7

·
--
$AKE This spot is kind of interesting. In 15m it pulled 2.31%, the volume surged straight to 2.43x, the volatility Z value is 4.21, and the close even broke above the upper band of the last 20 consecutive 5m candles.
But OI is moving downward—15m -0.17%, 1h -1.15%. Price is rising while open interest is falling; that’s a typical short-covering or position-rebalancing move, not fresh longs aggressively pushing.
The aggressive buy/sell ratio is 1.33, and aggressive trade volume is down 14.2%, though the bids do appear to be slightly favored.
The OI abnormal percentile is 93.3%, the whole pool is #17, and it has been continuing across multiple consecutive cycles; the 24h trading value is 40.64M. This is a signal confirmed by depth—not the kind of thing where one wick and it’s over.
With shorts squeezed this hard, either it keeps pushing upward, or after it’s completed, it cools off. I’m inclined to watch whether OI later rises again—if price continues but OI doesn’t show much further covering, then there’s a high chance it’s a one-wave move. What do you think?
$AKE This spot is kind of interesting. In 15m it pulled 2.31%, the volume surged straight to 2.43x, the volatility Z value is 4.21, and the close even broke above the upper band of the last 20 consecutive 5m candles.
But OI is moving downward—15m -0.17%, 1h -1.15%. Price is rising while open interest is falling; that’s a typical short-covering or position-rebalancing move, not fresh longs aggressively pushing.
The aggressive buy/sell ratio is 1.33, and aggressive trade volume is down 14.2%, though the bids do appear to be slightly favored.
The OI abnormal percentile is 93.3%, the whole pool is #17, and it has been continuing across multiple consecutive cycles; the 24h trading value is 40.64M. This is a signal confirmed by depth—not the kind of thing where one wick and it’s over.
With shorts squeezed this hard, either it keeps pushing upward, or after it’s completed, it cools off. I’m inclined to watch whether OI later rises again—if price continues but OI doesn’t show much further covering, then there’s a high chance it’s a one-wave move. What do you think?
But OI is moving downward—15m -0.17%, 1h -1.15%. Price is rising while open interest is falling; that’s a typical short-covering or position-rebalancing move, not fresh longs aggressively pushing.
The aggressive buy/sell ratio is 1.33, and aggressive trade volume is down 14.2%, though the bids do appear to be slightly favored.
The OI abnormal percentile is 93.3%, the whole pool is #17, and it has been continuing across multiple consecutive cycles; the 24h trading value is 40.64M. This is a signal confirmed by depth—not the kind of thing where one wick and it’s over.
With shorts squeezed this hard, either it keeps pushing upward, or after it’s completed, it cools off. I’m inclined to watch whether OI later rises again—if price continues but OI doesn’t show much further covering, then there’s a high chance it’s a one-wave move. What do you think?
58
·
--
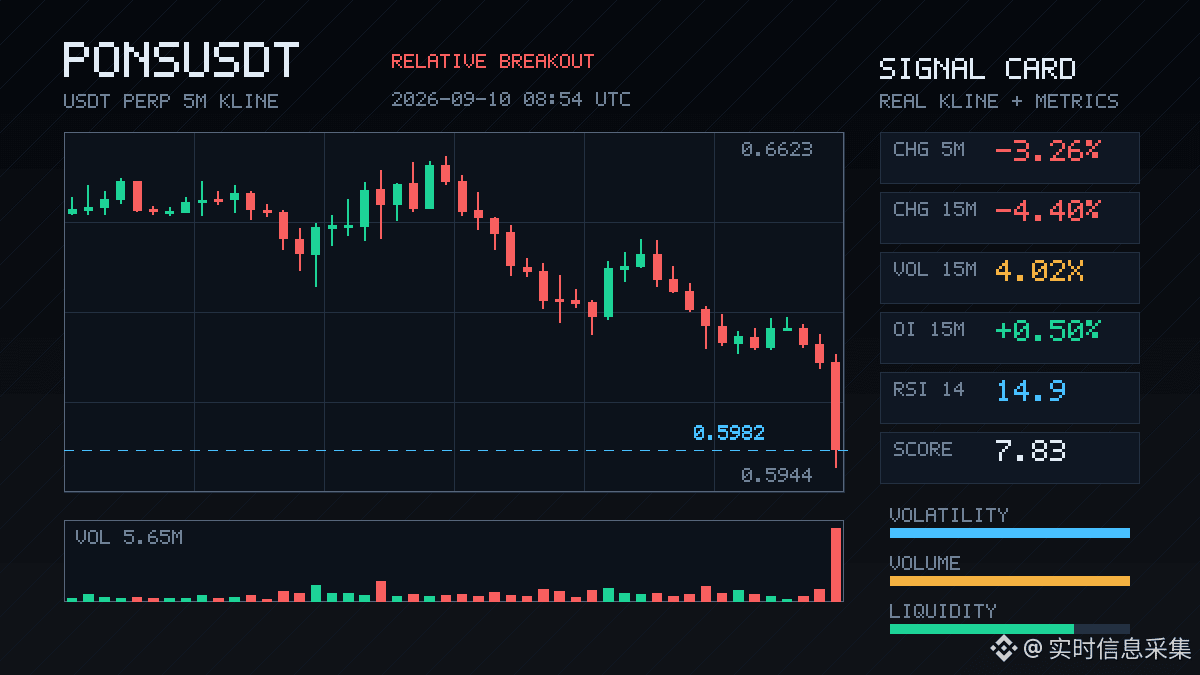
This 15m move of $PONS crushed through pretty decisively, down -4.4%. Volume even jumped to about 4x, with volatility at 4.01—this is the kind of trend that usually doesn’t move much, but once it does, it just drives straight down.
What’s interesting is the OI: on 15m it’s +0.5%, and on 1h it’s +1.68%. Price is falling but open interest is rising—classic signs of newly added leveraged short positions, not just old longs getting liquidated and closing. Active trades are weak at -32.2%, and the buy/sell ratio is 0.51; sellers are clearly in control. The close breaks below the lower bound of the past ~20 5m candles—short-term structure has flipped bearish.
Looking at nominal changes: the whole pool has orders filling up to #17. The abnormal percentile of 33.7% isn’t extreme, but the confirmation on depth is solid—trading volume is higher than usual, it hits the edges of the range with directional bias, and several conditions line up. 24h turnover is 198M. The pool isn’t small, and with this amount smashing the range, it’s not something retail can play.
My take: this move looks more like shorts actively opening positions to push the breakdown, not passive long-liquidation. Next we either see continued volume as it probes lower, or shorts add further to a certain extent then cover into a rebound—but right now there are no signs of a bottom. Don’t rush to catch it. After the first K that breaks the range’s lower bound, chasing shorts or catching a bottom is just gambling—wait for confirmation.
This 15m move of $PONS crushed through pretty decisively, down -4.4%. Volume even jumped to about 4x, with volatility at 4.01—this is the kind of trend that usually doesn’t move much, but once it does, it just drives straight down.
What’s interesting is the OI: on 15m it’s +0.5%, and on 1h it’s +1.68%. Price is falling but open interest is rising—classic signs of newly added leveraged short positions, not just old longs getting liquidated and closing. Active trades are weak at -32.2%, and the buy/sell ratio is 0.51; sellers are clearly in control. The close breaks below the lower bound of the past ~20 5m candles—short-term structure has flipped bearish.
Looking at nominal changes: the whole pool has orders filling up to #17. The abnormal percentile of 33.7% isn’t extreme, but the confirmation on depth is solid—trading volume is higher than usual, it hits the edges of the range with directional bias, and several conditions line up. 24h turnover is 198M. The pool isn’t small, and with this amount smashing the range, it’s not something retail can play.
My take: this move looks more like shorts actively opening positions to push the breakdown, not passive long-liquidation. Next we either see continued volume as it probes lower, or shorts add further to a certain extent then cover into a rebound—but right now there are no signs of a bottom. Don’t rush to catch it. After the first K that breaks the range’s lower bound, chasing shorts or catching a bottom is just gambling—wait for confirmation.
What’s interesting is the OI: on 15m it’s +0.5%, and on 1h it’s +1.68%. Price is falling but open interest is rising—classic signs of newly added leveraged short positions, not just old longs getting liquidated and closing. Active trades are weak at -32.2%, and the buy/sell ratio is 0.51; sellers are clearly in control. The close breaks below the lower bound of the past ~20 5m candles—short-term structure has flipped bearish.
Looking at nominal changes: the whole pool has orders filling up to #17. The abnormal percentile of 33.7% isn’t extreme, but the confirmation on depth is solid—trading volume is higher than usual, it hits the edges of the range with directional bias, and several conditions line up. 24h turnover is 198M. The pool isn’t small, and with this amount smashing the range, it’s not something retail can play.
My take: this move looks more like shorts actively opening positions to push the breakdown, not passive long-liquidation. Next we either see continued volume as it probes lower, or shorts add further to a certain extent then cover into a rebound—but right now there are no signs of a bottom. Don’t rush to catch it. After the first K that breaks the range’s lower bound, chasing shorts or catching a bottom is just gambling—wait for confirmation.
358
·
--
$BULLA This 15m move has something to it. A 4.34% surge paired with more than 4x volume—straight up breaking through the upper edge of nearly 20 5m candles.
What’s even more interesting is the OI: in the 15m window, +1.12%, and in the 1h window, +2.52%—the notional increased by 1.17M. This isn’t short-covering; it’s new leveraged long positions entering the market. The abnormal percentile is 81.7%, and the overall notional change ranks #17 in the whole pool. Depth has been confirmed.
The only thing that makes me hesitate is that the actively executed trades are -0.1%, and the buy/sell ratio is exactly 1.00. The push did lift the price, but the active buy orders didn’t really follow through—it feels a bit like a passive push.
First, see if it can hold above the top of this range. If it can’t, then it’s a false breakout.
$BULLA This 15m move has something to it. A 4.34% surge paired with more than 4x volume—straight up breaking through the upper edge of nearly 20 5m candles.
What’s even more interesting is the OI: in the 15m window, +1.12%, and in the 1h window, +2.52%—the notional increased by 1.17M. This isn’t short-covering; it’s new leveraged long positions entering the market. The abnormal percentile is 81.7%, and the overall notional change ranks #17 in the whole pool. Depth has been confirmed.
The only thing that makes me hesitate is that the actively executed trades are -0.1%, and the buy/sell ratio is exactly 1.00. The push did lift the price, but the active buy orders didn’t really follow through—it feels a bit like a passive push.
First, see if it can hold above the top of this range. If it can’t, then it’s a false breakout.
What’s even more interesting is the OI: in the 15m window, +1.12%, and in the 1h window, +2.52%—the notional increased by 1.17M. This isn’t short-covering; it’s new leveraged long positions entering the market. The abnormal percentile is 81.7%, and the overall notional change ranks #17 in the whole pool. Depth has been confirmed.
The only thing that makes me hesitate is that the actively executed trades are -0.1%, and the buy/sell ratio is exactly 1.00. The push did lift the price, but the active buy orders didn’t really follow through—it feels a bit like a passive push.
First, see if it can hold above the top of this range. If it can’t, then it’s a false breakout.
21
·
--
$KAT In these 15 minutes, the drop was pretty sharp. It fell straight by 3.58%, and the volume also swelled to 1.69x, with volatility (Z) at 1.75—this isn’t the kind of quiet, low-key grinding down.
What’s interesting is OI: the 15m contracts are up +2.75%, nominal change is +153K, but on the 1h dimension it’s actually -0.97%, -150K. That suggests short-term adds to positions, but the hourly timeframe doesn’t follow. This kind of structure, paired with the price decline, looks more like new leveraged shorts entering rather than old long holders closing.
Funding rate is -0.0273%, with the near-end percentile at 97%—this reading feels a bit extreme. With shorts crowded this much, the passive-to-active match is -2.0% and the buy/sell ratio is 0.96. There is selling pressure, but it’s not completely one-sided.
In the last 24h, turnover is 142.20M. The depth is sufficient. The abnormal pool percentile is 83.7%, rank #17, nominal change rank #36—somewhat high in abnormality but not the most eye-catching position.
My take: the short sentiment is being pushed too hard in the short term. At the 97% funding-rate percentile, chasing shorts further down isn’t great value; you should watch for a short squeeze. Of course, the premise is that price can first stabilize and stop falling. $KAT
$KAT In these 15 minutes, the drop was pretty sharp. It fell straight by 3.58%, and the volume also swelled to 1.69x, with volatility (Z) at 1.75—this isn’t the kind of quiet, low-key grinding down.
What’s interesting is OI: the 15m contracts are up +2.75%, nominal change is +153K, but on the 1h dimension it’s actually -0.97%, -150K. That suggests short-term adds to positions, but the hourly timeframe doesn’t follow. This kind of structure, paired with the price decline, looks more like new leveraged shorts entering rather than old long holders closing.
Funding rate is -0.0273%, with the near-end percentile at 97%—this reading feels a bit extreme. With shorts crowded this much, the passive-to-active match is -2.0% and the buy/sell ratio is 0.96. There is selling pressure, but it’s not completely one-sided.
In the last 24h, turnover is 142.20M. The depth is sufficient. The abnormal pool percentile is 83.7%, rank #17, nominal change rank #36—somewhat high in abnormality but not the most eye-catching position.
My take: the short sentiment is being pushed too hard in the short term. At the 97% funding-rate percentile, chasing shorts further down isn’t great value; you should watch for a short squeeze. Of course, the premise is that price can first stabilize and stop falling. $KAT
What’s interesting is OI: the 15m contracts are up +2.75%, nominal change is +153K, but on the 1h dimension it’s actually -0.97%, -150K. That suggests short-term adds to positions, but the hourly timeframe doesn’t follow. This kind of structure, paired with the price decline, looks more like new leveraged shorts entering rather than old long holders closing.
Funding rate is -0.0273%, with the near-end percentile at 97%—this reading feels a bit extreme. With shorts crowded this much, the passive-to-active match is -2.0% and the buy/sell ratio is 0.96. There is selling pressure, but it’s not completely one-sided.
In the last 24h, turnover is 142.20M. The depth is sufficient. The abnormal pool percentile is 83.7%, rank #17, nominal change rank #36—somewhat high in abnormality but not the most eye-catching position.
My take: the short sentiment is being pushed too hard in the short term. At the 97% funding-rate percentile, chasing shorts further down isn’t great value; you should watch for a short squeeze. Of course, the premise is that price can first stabilize and stop falling. $KAT
126

$XMR -4.2% over 24h: breakdown📉 Breakdown of the drop over 24h
Overall: the picture across timeframes is mixed — no single trend is visible; volume is low — the move may be unstable.
Worst momentum: $XMR -4.2% in 24h
Price: $502.45 (range $493.99–$525.33)
Momentum by timeframe: 1h -0.6%, 24h -4.2%, 7d -1.4%, 30d +20.9%
Position within the 24h range: 27% (in the middle of the daily range)
$XMR -4.2% over 24h: breakdown
📉 Breakdown of the drop over 24h
Overall: the picture across timeframes is mixed — no single trend is visible; volume is low — the move may be unstable.
Worst momentum: $XMR -4.2% in 24h
Price: $502.45 (range $493.99–$525.33)
Momentum by timeframe: 1h -0.6%, 24h -4.2%, 7d -1.4%, 30d +20.9%
Position within the 24h range: 27% (in the middle of the daily range)
Overall: the picture across timeframes is mixed — no single trend is visible; volume is low — the move may be unstable.
Worst momentum: $XMR -4.2% in 24h
Price: $502.45 (range $493.99–$525.33)
Momentum by timeframe: 1h -0.6%, 24h -4.2%, 7d -1.4%, 30d +20.9%
Position within the 24h range: 27% (in the middle of the daily range)
110


·
--
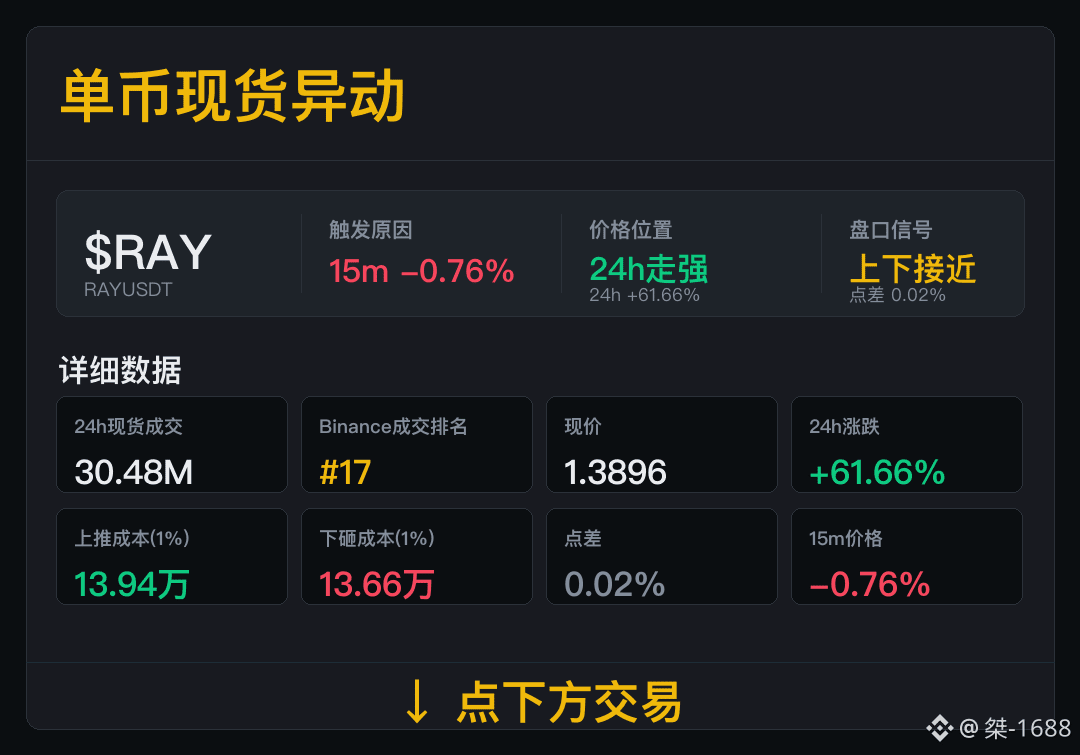
$RAY 15m anomaly has been triggered, and next we should watch spot participation.
Spot volume is 30.48M, with Binance ranking #17 in trading volume. Spot trading volume is the main clue for now, and we will continue tracking participation.
Current 24h change is +61.66%; spread is 0.02%, buy-up cost is 139.4K, and sell-down cost is 136.6K. Order book data shows the current trading difficulty, and the subsequent trend still needs to be confirmed by volume.
If trading remains active and the spread does not widen, the anomaly may continue.
$RAY 15m anomaly has been triggered, and next we should watch spot participation.
Spot volume is 30.48M, with Binance ranking #17 in trading volume. Spot trading volume is the main clue for now, and we will continue tracking participation.
Current 24h change is +61.66%; spread is 0.02%, buy-up cost is 139.4K, and sell-down cost is 136.6K. Order book data shows the current trading difficulty, and the subsequent trend still needs to be confirmed by volume.
If trading remains active and the spread does not widen, the anomaly may continue.
Spot volume is 30.48M, with Binance ranking #17 in trading volume. Spot trading volume is the main clue for now, and we will continue tracking participation.
Current 24h change is +61.66%; spread is 0.02%, buy-up cost is 139.4K, and sell-down cost is 136.6K. Order book data shows the current trading difficulty, and the subsequent trend still needs to be confirmed by volume.
If trading remains active and the spread does not widen, the anomaly may continue.
382
·
--
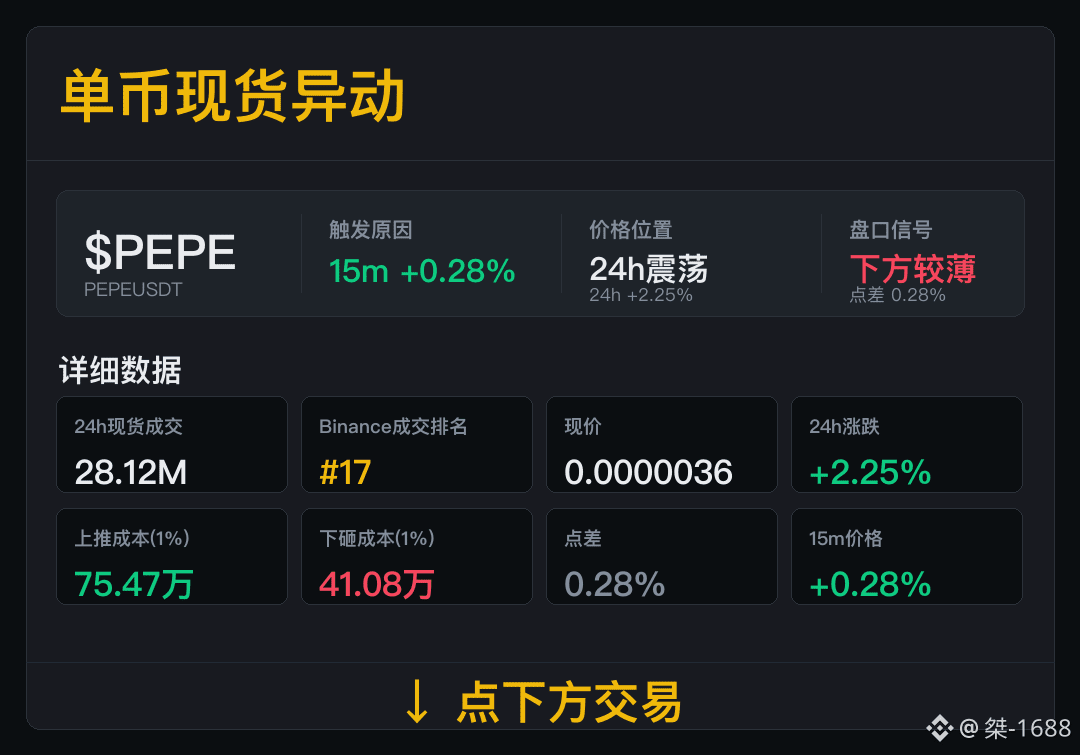
$PEPE has just moved out of a range in price, and spot volume needs further confirmation.
Spot turnover was 28.12M, with Binance ranking #17 in trading volume. As trading volume moves into the front ranks, the next leg of volume still needs further confirmation.
The current 24h change is +2.25%; spread is 0.28%, with push-up cost at 754.7K and dump cost at 410.8K. If subsequent trading does not show a clear weakening, short-term abnormal moves may continue.
The next round should focus on checking trading volume and spread. Continue tracking only after both remain stable at the same time.
$PEPE has just moved out of a range in price, and spot volume needs further confirmation.
Spot turnover was 28.12M, with Binance ranking #17 in trading volume. As trading volume moves into the front ranks, the next leg of volume still needs further confirmation.
The current 24h change is +2.25%; spread is 0.28%, with push-up cost at 754.7K and dump cost at 410.8K. If subsequent trading does not show a clear weakening, short-term abnormal moves may continue.
The next round should focus on checking trading volume and spread. Continue tracking only after both remain stable at the same time.
Spot turnover was 28.12M, with Binance ranking #17 in trading volume. As trading volume moves into the front ranks, the next leg of volume still needs further confirmation.
The current 24h change is +2.25%; spread is 0.28%, with push-up cost at 754.7K and dump cost at 410.8K. If subsequent trading does not show a clear weakening, short-term abnormal moves may continue.
The next round should focus on checking trading volume and spread. Continue tracking only after both remain stable at the same time.
1
397
·
--
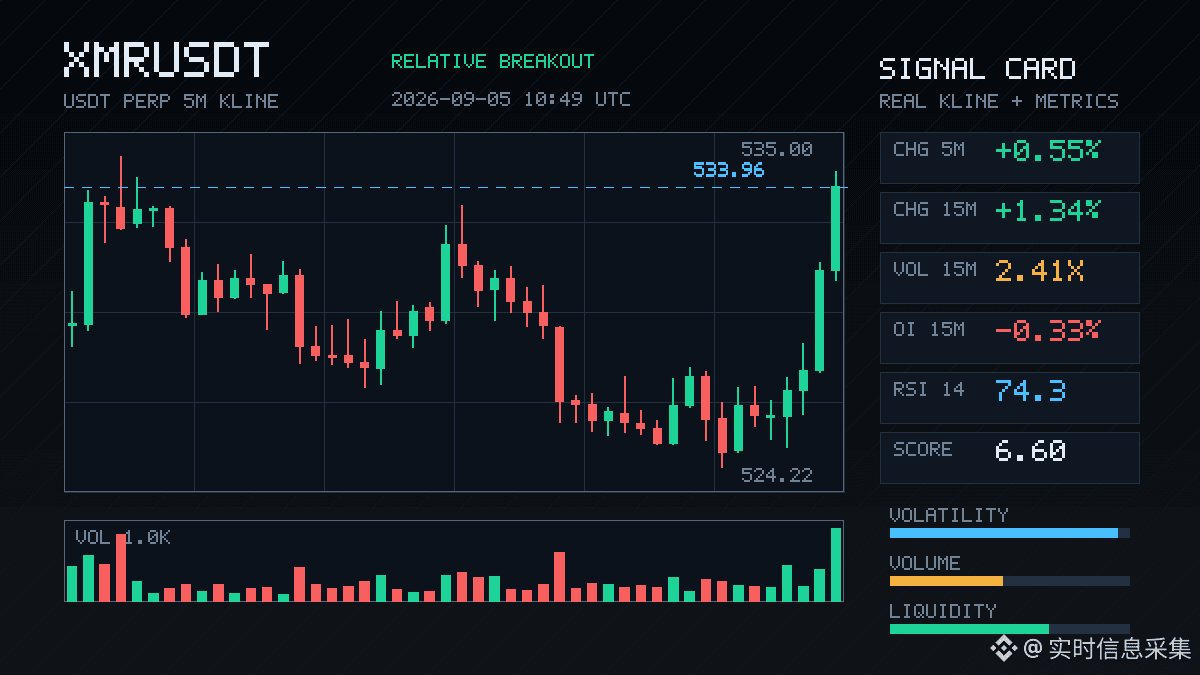
$XMR surged 1.34% in the past 15 minutes, with volume jumping to 2.41x and price breaking above the upper bound of the past 20 K-line range. Interestingly, open interest did not rise along with it but instead fell; OI was down 0.33% in 15 minutes — a classic short-covering move, not a real breakout driven by new long entries.
Aggressive trading imbalance was 25.7%, and the buy/sell ratio was 1.69, with buyers clearly in control. XMR ranked #22 in the abnormal pool today, #17 in nominal change, and its depth data was among the top in the market. At the very least, this is a case of both price and volume rising, but the current structure fits a short squeeze pulse more closely. A short-term follow can work, but be careful that momentum may fade after shorts finish covering at higher levels.
$XMR surged 1.34% in the past 15 minutes, with volume jumping to 2.41x and price breaking above the upper bound of the past 20 K-line range. Interestingly, open interest did not rise along with it but instead fell; OI was down 0.33% in 15 minutes — a classic short-covering move, not a real breakout driven by new long entries.
Aggressive trading imbalance was 25.7%, and the buy/sell ratio was 1.69, with buyers clearly in control. XMR ranked #22 in the abnormal pool today, #17 in nominal change, and its depth data was among the top in the market. At the very least, this is a case of both price and volume rising, but the current structure fits a short squeeze pulse more closely. A short-term follow can work, but be careful that momentum may fade after shorts finish covering at higher levels.
Aggressive trading imbalance was 25.7%, and the buy/sell ratio was 1.69, with buyers clearly in control. XMR ranked #22 in the abnormal pool today, #17 in nominal change, and its depth data was among the top in the market. At the very least, this is a case of both price and volume rising, but the current structure fits a short squeeze pulse more closely. A short-term follow can work, but be careful that momentum may fade after shorts finish covering at higher levels.
18

·
--
Bullish
60-SECOND ALPHA #17 | $MARSCOIN
$MARSCOIN just got a new Binance Futures market, and the reaction has been anything but quiet. The contract launched with up to 20x leverage, bringing fresh liquidity and plenty of speculation into the token.
But here’s the lesson: a new futures listing can create huge attention and volume, but it can also amplify both pumps and dumps. A listing is a catalyst, not a guarantee that price will keep going up.
Alpha: When a new contract launches, watch volatility and liquidity before following the hype.
{future}(MARSCOINUSDT)
60-SECOND ALPHA #17 | $MARSCOIN
$MARSCOIN just got a new Binance Futures market, and the reaction has been anything but quiet. The contract launched with up to 20x leverage, bringing fresh liquidity and plenty of speculation into the token.
But here’s the lesson: a new futures listing can create huge attention and volume, but it can also amplify both pumps and dumps. A listing is a catalyst, not a guarantee that price will keep going up.
Alpha: When a new contract launches, watch volatility and liquidity before following the hype.
$MARSCOIN just got a new Binance Futures market, and the reaction has been anything but quiet. The contract launched with up to 20x leverage, bringing fresh liquidity and plenty of speculation into the token.
But here’s the lesson: a new futures listing can create huge attention and volume, but it can also amplify both pumps and dumps. A listing is a catalyst, not a guarantee that price will keep going up.
Alpha: When a new contract launches, watch volatility and liquidity before following the hype.
83
·
--
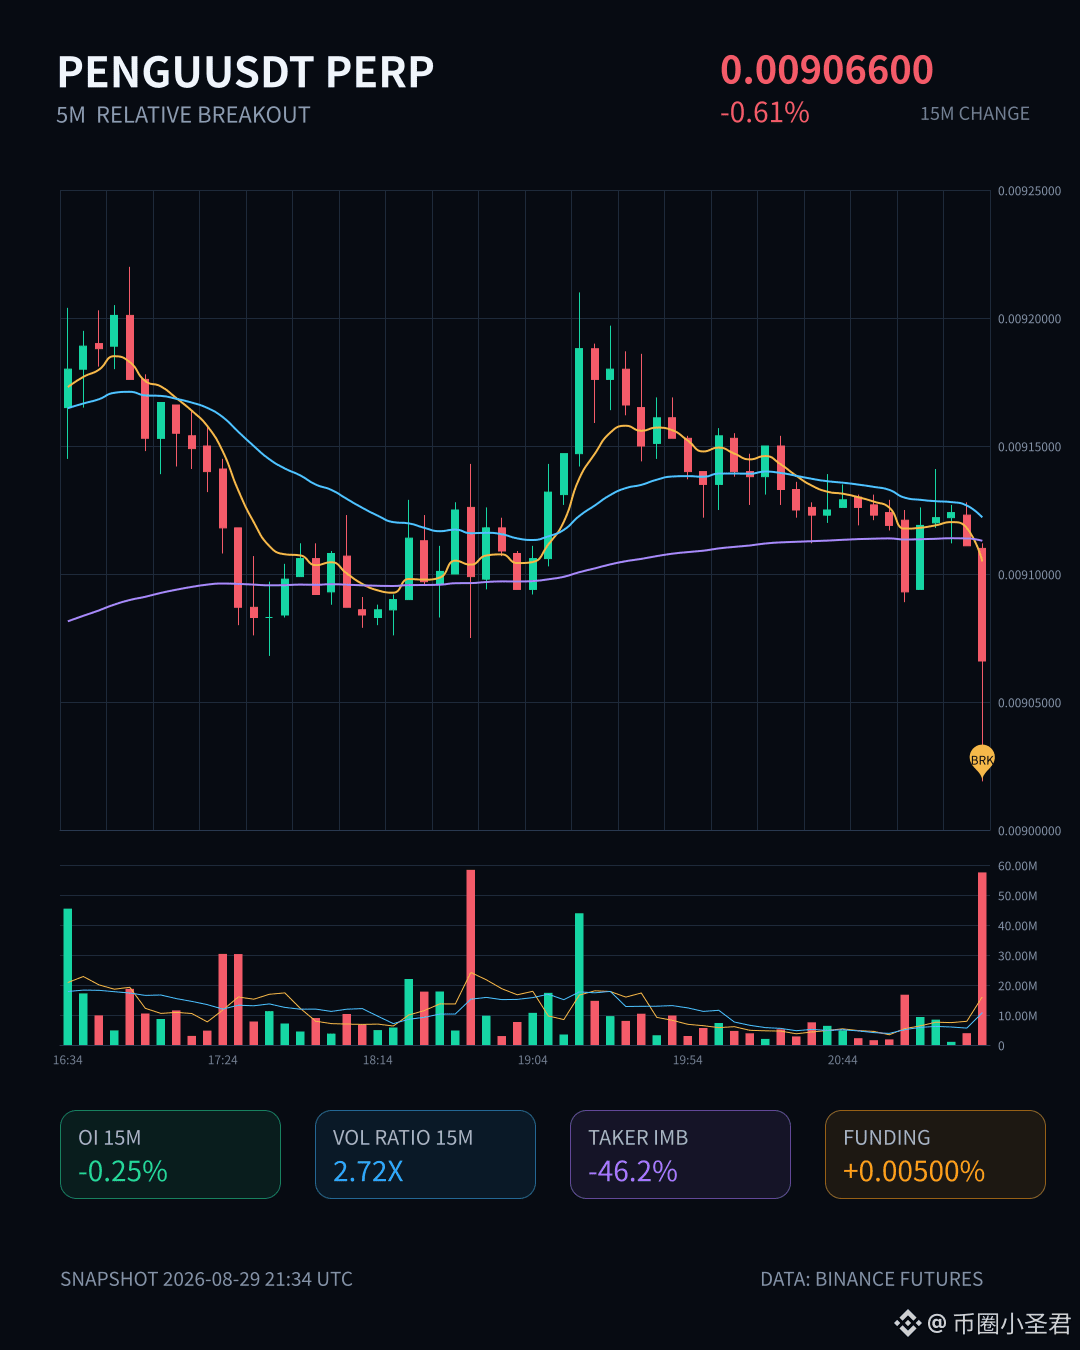
$PENGU This drop is kind of interesting.
On the 15-minute timeframe, it fell 0.61% while volume surged to 2.72x, but open interest didn’t move much—contracts on the 15-minute period only dropped 0.25%, with nominal change of -246K. This isn’t a traditional long-and-short double liquidation or something; it’s more like longs are exiting on their own—stop-losses getting triggered and positions being cut.
What’s especially interesting is that the closing price directly broke below the lower bound of the range of the past 20 five-minute candlesticks, plus the aggressive trade difference is -46.2% and the buy/sell ratio is 0.37—bears are pressing down very firmly.
I checked the whole-pool data: the abnormality level ranks at #12, nominal change at #17, and the funding rate is still in the higher percentile recently. At this point, emotionally it feels like a cooldown after being overheated.
The short-term trend looks a bit weak. Let’s first see if it can hold/support itself—don’t rush to buy the dip.
$PENGU This drop is kind of interesting.
On the 15-minute timeframe, it fell 0.61% while volume surged to 2.72x, but open interest didn’t move much—contracts on the 15-minute period only dropped 0.25%, with nominal change of -246K. This isn’t a traditional long-and-short double liquidation or something; it’s more like longs are exiting on their own—stop-losses getting triggered and positions being cut.
What’s especially interesting is that the closing price directly broke below the lower bound of the range of the past 20 five-minute candlesticks, plus the aggressive trade difference is -46.2% and the buy/sell ratio is 0.37—bears are pressing down very firmly.
I checked the whole-pool data: the abnormality level ranks at #12, nominal change at #17, and the funding rate is still in the higher percentile recently. At this point, emotionally it feels like a cooldown after being overheated.
The short-term trend looks a bit weak. Let’s first see if it can hold/support itself—don’t rush to buy the dip.
On the 15-minute timeframe, it fell 0.61% while volume surged to 2.72x, but open interest didn’t move much—contracts on the 15-minute period only dropped 0.25%, with nominal change of -246K. This isn’t a traditional long-and-short double liquidation or something; it’s more like longs are exiting on their own—stop-losses getting triggered and positions being cut.
What’s especially interesting is that the closing price directly broke below the lower bound of the range of the past 20 five-minute candlesticks, plus the aggressive trade difference is -46.2% and the buy/sell ratio is 0.37—bears are pressing down very firmly.
I checked the whole-pool data: the abnormality level ranks at #12, nominal change at #17, and the funding rate is still in the higher percentile recently. At this point, emotionally it feels like a cooldown after being overheated.
The short-term trend looks a bit weak. Let’s first see if it can hold/support itself—don’t rush to buy the dip.
35
Log in to explore more content
Join global crypto users on Binance Square
⚡️ Get latest and useful information about crypto.
💬 Trusted by the world’s largest crypto exchange.
👍 Discover real insights from verified creators.
Email / Phone number
Trending Topics
1
#FedRateWatch
644,540 views
3,006 Discussing
2
#EthereumFallsBelow$2400
127 views
25 Discussing
3
#USSenateBlocksClarityAct
910 views
59 Discussing
4
#BitcoinSlidesTo$76000
26,681 views
130 Discussing
5
#BitcoinReboundsTo$79K
63,759 views
408 Discussing
6
#StrategyMarketCapPassesFord
46,353 views
733 Discussing
7
#ClarityActOddsHalveOnPolymarket
75,045 views
622 Discussing
8
#US30YTreasuryYieldTops5.40%
39,800 views
410 Discussing
9
#BessentEndorsesFinalClarityActDraft
62,216 views
786 Discussing
10
#ZamaOpens16ConfidentialMorphoVaults
21,863 views
386 Discussing