$1000PEPE This move is kind of interesting.
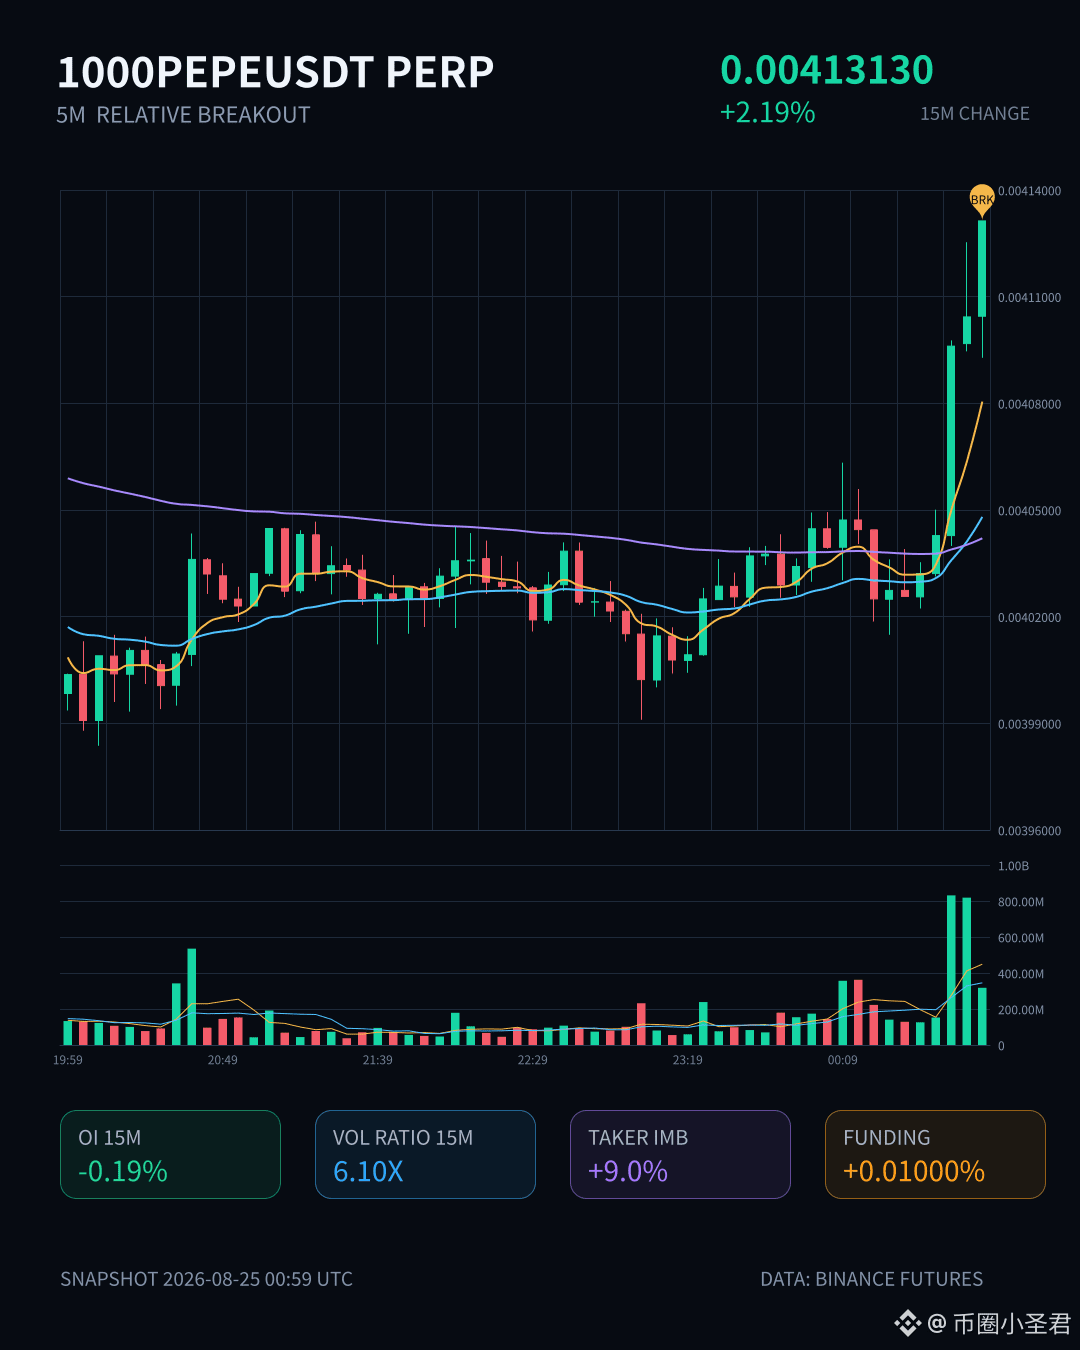
In just 15 minutes, it’s up 2.19%. Volume surged to 6 times the usual level, and the price also broke above the upper bound of the range from the past ~20 candlesticks. On the surface, it looks like a breakout— but the OI is moving downward. In the 15-minute contracts, open interest fell by 0.19%, while nominal change is still +2%. This “price up + OI down” structure, plain and simple, looks more like short covering than fresh long entries.
At the 1-hour level, OI is also shrinking, -0.94%, and this has been a divergence across multiple consecutive cycles. The abnormal percentile has pushed up to 99%; across the whole pool, ranks #15 on the list, and nominal change is #14. This spot is either an excellent place to exit, or the starting point for capital coming in from outside the market. Active trades are down 9%, and the buy/sell ratio is 1.2—suggesting that spot demand on the buy side really is there.
But honestly, the way OI is shrinking—especially the way it behaved during the final leg of the rally—looks like it’s part of cleaning up shorts. The rise is real, but calling it a healthy rally yet would be premature. Over the last 24 hours, spot volume is 380 million U. Depth and liquidity are there. But if OI continues to stay flat rather than turning upward, then you have to be careful whether this is actually topping out.
Not trying to pour cold water—just don’t blindly chase. Structures near historical extreme ranges usually aren’t a one-step, straight-through kind of行情.
In just 15 minutes, it’s up 2.19%. Volume surged to 6 times the usual level, and the price also broke above the upper bound of the range from the past ~20 candlesticks. On the surface, it looks like a breakout— but the OI is moving downward. In the 15-minute contracts, open interest fell by 0.19%, while nominal change is still +2%. This “price up + OI down” structure, plain and simple, looks more like short covering than fresh long entries.
At the 1-hour level, OI is also shrinking, -0.94%, and this has been a divergence across multiple consecutive cycles. The abnormal percentile has pushed up to 99%; across the whole pool, ranks #15 on the list, and nominal change is #14. This spot is either an excellent place to exit, or the starting point for capital coming in from outside the market. Active trades are down 9%, and the buy/sell ratio is 1.2—suggesting that spot demand on the buy side really is there.
But honestly, the way OI is shrinking—especially the way it behaved during the final leg of the rally—looks like it’s part of cleaning up shorts. The rise is real, but calling it a healthy rally yet would be premature. Over the last 24 hours, spot volume is 380 million U. Depth and liquidity are there. But if OI continues to stay flat rather than turning upward, then you have to be careful whether this is actually topping out.
Not trying to pour cold water—just don’t blindly chase. Structures near historical extreme ranges usually aren’t a one-step, straight-through kind of行情.