

Sulaiman 零号猎人
2.4k Публикации

Sulaiman 零号猎人
Отправить жалобу
Заблокировать пользователя
ZeroHunter | Hunting 10X potential in micro-caps & RWA with on-chain research. I show how I check a project's data before I trust it. NFA. #ZeroResearch
Открытая сделка
Трейдер с регулярными сделками
6.1 г
124 подписок(и/а)
769 подписчиков(а)
2.2K+ понравилось
Посты
Портфель
Все
Цитирования
Активно
PINNED
I made about 2.5x on one trade. Here is why I still do not call it skill.
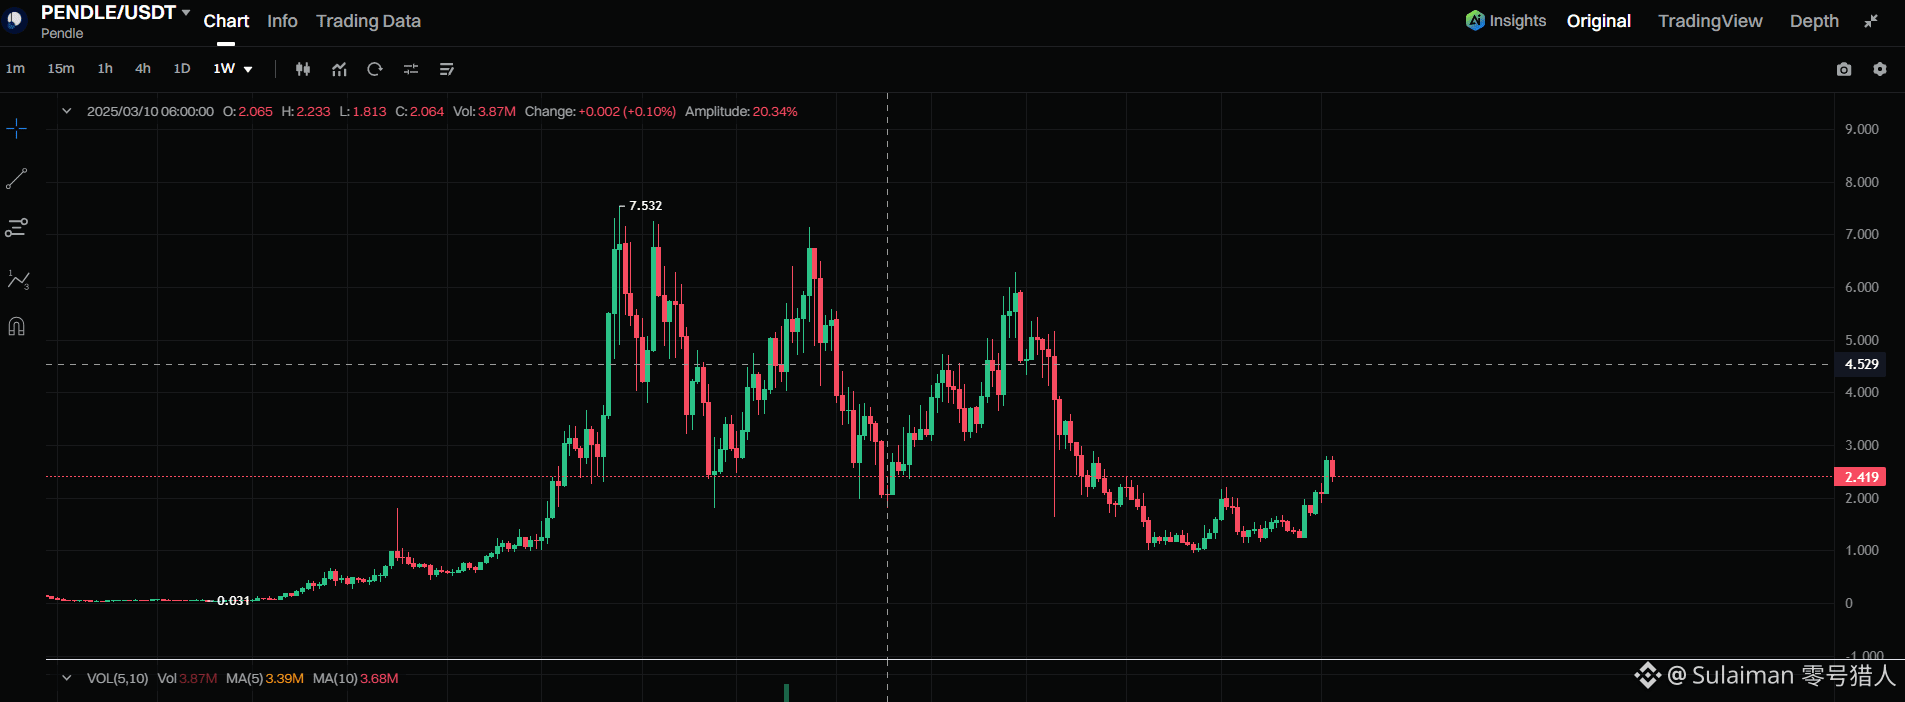
I do not hold $PENDLE now.
In March 2023, I bought PENDLE at around 0.22. I sold at around 0.55 on an exchange. That is about 2.5x, before fees.
Sounds like a win. It was. But I do not call it skill.
Here is the real reason: the project was very good, and its roadmap was bigger than what I had imagined. I bought early, and the project did most of the work.
My part was small. I did not monitor it properly, so I took a smaller profit and left early.
Here's my advice:
Buying early is not the same as having a system.
If you cannot watch a project, you cannot judge when to stay or leave. That was my gap.
Have a reason for your exit before you enter, not after.
Today, before I trust a project, I check the roadmap, real usage and whether I can sell easily. And I only hold what I can actually follow.
A good result does not mean a good process. One good trade does not prove I will win the next one, and I could be wrong.
This is my personal experience, not advice or a promise. Do your own research.
What is one exit you regret, or one you are proud of? 👇
#ZeroResearch #RWA #PENDLE
I made about 2.5x on one trade. Here is why I still do not call it skill.
I do not hold $PENDLE now.
In March 2023, I bought PENDLE at around 0.22. I sold at around 0.55 on an exchange. That is about 2.5x, before fees.
Sounds like a win. It was. But I do not call it skill.
Here is the real reason: the project was very good, and its roadmap was bigger than what I had imagined. I bought early, and the project did most of the work.
My part was small. I did not monitor it properly, so I took a smaller profit and left early.
Here's my advice:
Buying early is not the same as having a system.
If you cannot watch a project, you cannot judge when to stay or leave. That was my gap.
Have a reason for your exit before you enter, not after.
Today, before I trust a project, I check the roadmap, real usage and whether I can sell easily. And I only hold what I can actually follow.
A good result does not mean a good process. One good trade does not prove I will win the next one, and I could be wrong.
This is my personal experience, not advice or a promise. Do your own research.
What is one exit you regret, or one you are proud of? 👇
#ZeroResearch #RWA #PENDLE
I do not hold $PENDLE now.
In March 2023, I bought PENDLE at around 0.22. I sold at around 0.55 on an exchange. That is about 2.5x, before fees.
Sounds like a win. It was. But I do not call it skill.
Here is the real reason: the project was very good, and its roadmap was bigger than what I had imagined. I bought early, and the project did most of the work.
My part was small. I did not monitor it properly, so I took a smaller profit and left early.
Here's my advice:
Buying early is not the same as having a system.
If you cannot watch a project, you cannot judge when to stay or leave. That was my gap.
Have a reason for your exit before you enter, not after.
Today, before I trust a project, I check the roadmap, real usage and whether I can sell easily. And I only hold what I can actually follow.
A good result does not mean a good process. One good trade does not prove I will win the next one, and I could be wrong.
This is my personal experience, not advice or a promise. Do your own research.
What is one exit you regret, or one you are proud of? 👇
#ZeroResearch #RWA #PENDLE
1
2
118
PINNED

Статья
I lost 750 USDT on LUNA because I skipped one stepDisclosure: I hold no Terra coins (LUNA or LUNC).
I lost around 750 USDT on one coin, and it was my own fault.
The worst part? I bought it without checking anything.
LUNA (the old Terra) was a hero back then. Many people, including me, wanted it in their portfolio.
One morning in May 2022, I woke up and saw it at 3.5 USDT. I did not check the news. I did not ask why. I just bought around 350 USDT worth, fast.
Then I opened X and saw CZ's thread. He said some users kept buying LUNA without understanding the risk.
That was me. 👇
Source: CZ (@cz_binance) on X, May 13, 2022
So I started DCA to "save" my money. I kept buying while the supply kept growing and I saw no clear plan from the team. In my opinion, that silence was a red flag.
Later I looked at the burn mechanism and made a decision. I closed my position with a loss of around 750 USDT.
Here's my advice:
"It was a hero before" is not a reason to buy.
Check first, buy later. Five minutes of research could have saved me.
Buying more of a broken project is not a rescue plan. In my opinion, it only makes the loss bigger.
That day changed how I research. Now, before I trust any project, I check:
Supply: Can new tokens be minted? Who controls it?Holders: Do a few wallets own most of the supply?Liquidity: Can people sell without crashing the price?Team: Does the team respond when there is a problem?Real usage: Are people using it, or only talking about it?
None of these guarantees safety. But skipping them cost me.
I share these checks step by step, so you can learn the process too.
Every project is high risk, big names and micro caps both. I could be wrong, and I have been wrong before.
This is my personal opinion, not financial advice. Do your own research.
What is one mistake that taught you the most?
#ZeroResearch
#CryptoEducation
#DYOR
I lost 750 USDT on LUNA because I skipped one step
Disclosure: I hold no Terra coins (LUNA or LUNC).
I lost around 750 USDT on one coin, and it was my own fault.
The worst part? I bought it without checking anything.
LUNA (the old Terra) was a hero back then. Many people, including me, wanted it in their portfolio.
One morning in May 2022, I woke up and saw it at 3.5 USDT. I did not check the news. I did not ask why. I just bought around 350 USDT worth, fast.
Then I opened X and saw CZ's thread. He said some users kept buying LUNA without understanding the risk.
That was me. 👇
Source: CZ (@cz_binance) on X, May 13, 2022
So I started DCA to "save" my money. I kept buying while the supply kept growing and I saw no clear plan from the team. In my opinion, that silence was a red flag.
Later I looked at the burn mechanism and made a decision. I closed my position with a loss of around 750 USDT.
Here's my advice:
"It was a hero before" is not a reason to buy.
Check first, buy later. Five minutes of research could have saved me.
Buying more of a broken project is not a rescue plan. In my opinion, it only makes the loss bigger.
That day changed how I research. Now, before I trust any project, I check:
Supply: Can new tokens be minted? Who controls it?Holders: Do a few wallets own most of the supply?Liquidity: Can people sell without crashing the price?Team: Does the team respond when there is a problem?Real usage: Are people using it, or only talking about it?
None of these guarantees safety. But skipping them cost me.
I share these checks step by step, so you can learn the process too.
Every project is high risk, big names and micro caps both. I could be wrong, and I have been wrong before.
This is my personal opinion, not financial advice. Do your own research.
What is one mistake that taught you the most?
#ZeroResearch
#CryptoEducation
#DYOR
I lost around 750 USDT on one coin, and it was my own fault.
The worst part? I bought it without checking anything.
LUNA (the old Terra) was a hero back then. Many people, including me, wanted it in their portfolio.
One morning in May 2022, I woke up and saw it at 3.5 USDT. I did not check the news. I did not ask why. I just bought around 350 USDT worth, fast.
Then I opened X and saw CZ's thread. He said some users kept buying LUNA without understanding the risk.
That was me. 👇
Source: CZ (@cz_binance) on X, May 13, 2022
So I started DCA to "save" my money. I kept buying while the supply kept growing and I saw no clear plan from the team. In my opinion, that silence was a red flag.
Later I looked at the burn mechanism and made a decision. I closed my position with a loss of around 750 USDT.
Here's my advice:
"It was a hero before" is not a reason to buy.
Check first, buy later. Five minutes of research could have saved me.
Buying more of a broken project is not a rescue plan. In my opinion, it only makes the loss bigger.
That day changed how I research. Now, before I trust any project, I check:
Supply: Can new tokens be minted? Who controls it?Holders: Do a few wallets own most of the supply?Liquidity: Can people sell without crashing the price?Team: Does the team respond when there is a problem?Real usage: Are people using it, or only talking about it?
None of these guarantees safety. But skipping them cost me.
I share these checks step by step, so you can learn the process too.
Every project is high risk, big names and micro caps both. I could be wrong, and I have been wrong before.
This is my personal opinion, not financial advice. Do your own research.
What is one mistake that taught you the most?
#ZeroResearch
#CryptoEducation
#DYOR
1
3
842





🚨 Fed October Rate Hike Odds Jump to 69.7%
The market is suddenly pricing in a much higher chance of another Fed hike.
According to CME FedWatch, traders were pricing:
• 69.7% — 25 bps hike
• 30.3% — rates unchanged
The shift came after stronger U.S. economic data, with the latest flash PMI showing a sharp acceleration in activity.
But here's the part I find more interesting:
This isn't the Fed saying a hike is coming.
It's the market repricing the probability of one.
And that changes the environment for risk assets.
Higher rate expectations can mean:
→ Stronger pressure on liquidity
→ Higher Treasury yields
→ More support for the dollar
→ More cautious positioning across stocks and crypto
For $BTC, the question isn't simply whether the Fed hikes.
It's whether incoming data keeps pushing expectations in the same direction.
One number can move quickly.
The bigger story is whether the narrative becomes persistent.
Macro is back in the driver's seat. 👀
#Fed #FOMC #Bitcoin
$QI
{spot}(QIUSDT)
$SAGA
{spot}(SAGAUSDT)
$ONDO
{spot}(ONDOUSDT)
#fedoctoberratehikeoddsriseto69.7%
🚨 Fed October Rate Hike Odds Jump to 69.7%
The market is suddenly pricing in a much higher chance of another Fed hike.
According to CME FedWatch, traders were pricing:
• 69.7% — 25 bps hike
• 30.3% — rates unchanged
The shift came after stronger U.S. economic data, with the latest flash PMI showing a sharp acceleration in activity.
But here's the part I find more interesting:
This isn't the Fed saying a hike is coming.
It's the market repricing the probability of one.
And that changes the environment for risk assets.
Higher rate expectations can mean:
→ Stronger pressure on liquidity
→ Higher Treasury yields
→ More support for the dollar
→ More cautious positioning across stocks and crypto
For $BTC, the question isn't simply whether the Fed hikes.
It's whether incoming data keeps pushing expectations in the same direction.
One number can move quickly.
The bigger story is whether the narrative becomes persistent.
Macro is back in the driver's seat. 👀
#Fed #FOMC #Bitcoin
$QI
$SAGA
$ONDO
#fedoctoberratehikeoddsriseto69.7%
The market is suddenly pricing in a much higher chance of another Fed hike.
According to CME FedWatch, traders were pricing:
• 69.7% — 25 bps hike
• 30.3% — rates unchanged
The shift came after stronger U.S. economic data, with the latest flash PMI showing a sharp acceleration in activity.
But here's the part I find more interesting:
This isn't the Fed saying a hike is coming.
It's the market repricing the probability of one.
And that changes the environment for risk assets.
Higher rate expectations can mean:
→ Stronger pressure on liquidity
→ Higher Treasury yields
→ More support for the dollar
→ More cautious positioning across stocks and crypto
For $BTC, the question isn't simply whether the Fed hikes.
It's whether incoming data keeps pushing expectations in the same direction.
One number can move quickly.
The bigger story is whether the narrative becomes persistent.
Macro is back in the driver's seat. 👀
#Fed #FOMC #Bitcoin
$QI
$SAGA
$ONDO
#fedoctoberratehikeoddsriseto69.7%
1
90
A 19-year high in the U.S. 10-year yield deserves attention from crypto investors.
Recent market reports said the U.S. 10-year Treasury yield reached its highest level in roughly 19 years as investors reassessed the path for interest rates and inflation.
Why does this matter to $BTC?
Because the 10-year Treasury is one of the most important reference points for global capital.
When its yield rises, investors have to rethink the return they demand from riskier assets.
Crypto doesn't exist outside that system.
Bitcoin may have a unique monetary narrative, but the people buying Bitcoin still operate inside the global financial market.
That's why I think macro research belongs beside crypto research.
Not because Treasury yields tell us exactly where Bitcoin will go.
They don't.
But they can tell us something about the environment investors are operating in.
And right now, that environment is changing.
This is my personal opinion, not financial advice. Do your own research.
$QNT
{spot}(QNTUSDT)
$ONDO
{spot}(ONDOUSDT)
$HYPE
{spot}(HYPEUSDT)
#US10YTreasuryYieldHits19YearHigh
A 19-year high in the U.S. 10-year yield deserves attention from crypto investors.
Recent market reports said the U.S. 10-year Treasury yield reached its highest level in roughly 19 years as investors reassessed the path for interest rates and inflation.
Why does this matter to $BTC?
Because the 10-year Treasury is one of the most important reference points for global capital.
When its yield rises, investors have to rethink the return they demand from riskier assets.
Crypto doesn't exist outside that system.
Bitcoin may have a unique monetary narrative, but the people buying Bitcoin still operate inside the global financial market.
That's why I think macro research belongs beside crypto research.
Not because Treasury yields tell us exactly where Bitcoin will go.
They don't.
But they can tell us something about the environment investors are operating in.
And right now, that environment is changing.
This is my personal opinion, not financial advice. Do your own research.
$QNT
$ONDO
$HYPE
#US10YTreasuryYieldHits19YearHigh
Recent market reports said the U.S. 10-year Treasury yield reached its highest level in roughly 19 years as investors reassessed the path for interest rates and inflation.
Why does this matter to $BTC?
Because the 10-year Treasury is one of the most important reference points for global capital.
When its yield rises, investors have to rethink the return they demand from riskier assets.
Crypto doesn't exist outside that system.
Bitcoin may have a unique monetary narrative, but the people buying Bitcoin still operate inside the global financial market.
That's why I think macro research belongs beside crypto research.
Not because Treasury yields tell us exactly where Bitcoin will go.
They don't.
But they can tell us something about the environment investors are operating in.
And right now, that environment is changing.
This is my personal opinion, not financial advice. Do your own research.
$QNT
$ONDO
$HYPE
#US10YTreasuryYieldHits19YearHigh
1
114
The next big stablecoin story may have less to do with crypto—and more to do with the dollar.
Reports say the U.S. government is considering ways to encourage dollar-backed stablecoins overseas, potentially involving public-private partnerships. The proposal remains under consideration.
If such a policy moves forward, the bigger story isn't simply “stablecoins go global.”
It's the potential expansion of digital dollars as payment infrastructure.
Imagine sending a dollar-based digital asset across borders without using the traditional banking process for every step.
That could matter for:
> Payments
> Remittances
> Digital commerce
> Global savings
> On-chain finance
But adoption isn't automatic.
People still need easy conversion, reliable redemption, clear regulation and useful local payment rails.
So I wouldn't treat this as an instant crypto catalyst.
I'd treat it as a potentially important financial infrastructure story.
The question is simple:
Could stablecoins become one of the main ways the world interacts with digital dollars?
This is my personal opinion, not financial advice. Do your own research.
Why stablecoin adoption could matter even if Bitcoin doesn't move.
$TRX
{spot}(TRXUSDT)
$QNT
{spot}(QNTUSDT)
$ONDO
{spot}(ONDOUSDT)
#usweighspromotingdollarstablecoinsabroad
The next big stablecoin story may have less to do with crypto—and more to do with the dollar.
Reports say the U.S. government is considering ways to encourage dollar-backed stablecoins overseas, potentially involving public-private partnerships. The proposal remains under consideration.
If such a policy moves forward, the bigger story isn't simply “stablecoins go global.”
It's the potential expansion of digital dollars as payment infrastructure.
Imagine sending a dollar-based digital asset across borders without using the traditional banking process for every step.
That could matter for:
> Payments
> Remittances
> Digital commerce
> Global savings
> On-chain finance
But adoption isn't automatic.
People still need easy conversion, reliable redemption, clear regulation and useful local payment rails.
So I wouldn't treat this as an instant crypto catalyst.
I'd treat it as a potentially important financial infrastructure story.
The question is simple:
Could stablecoins become one of the main ways the world interacts with digital dollars?
This is my personal opinion, not financial advice. Do your own research.
Why stablecoin adoption could matter even if Bitcoin doesn't move.
$TRX
$QNT
$ONDO
#usweighspromotingdollarstablecoinsabroad
Reports say the U.S. government is considering ways to encourage dollar-backed stablecoins overseas, potentially involving public-private partnerships. The proposal remains under consideration.
If such a policy moves forward, the bigger story isn't simply “stablecoins go global.”
It's the potential expansion of digital dollars as payment infrastructure.
Imagine sending a dollar-based digital asset across borders without using the traditional banking process for every step.
That could matter for:
> Payments
> Remittances
> Digital commerce
> Global savings
> On-chain finance
But adoption isn't automatic.
People still need easy conversion, reliable redemption, clear regulation and useful local payment rails.
So I wouldn't treat this as an instant crypto catalyst.
I'd treat it as a potentially important financial infrastructure story.
The question is simple:
Could stablecoins become one of the main ways the world interacts with digital dollars?
This is my personal opinion, not financial advice. Do your own research.
Why stablecoin adoption could matter even if Bitcoin doesn't move.
$TRX
$QNT
$ONDO
#usweighspromotingdollarstablecoinsabroad
1
140
$ETH crossing $2,700 gets attention. But price alone doesn't answer the important question.**
Ethereum recently traded above the $2,700 area after a strong multi-session advance.
The bigger question is whether this move is being supported by real interest in the Ethereum ecosystem.
Price can attract attention.
Attention can attract traders.
But long-term value usually needs something underneath it.
For Ethereum, I keep coming back to:
> Network activity
> Developer activity
> Stablecoin usage
> DeFi demand
> Institutional interest
A higher price is interesting.
Growing usage is more interesting.
That distinction matters because crypto markets can move much faster than fundamentals.
So I wouldn't reduce the ETH story to one number.
The useful question is:
**Is Ethereum becoming more useful while the market is becoming more interested?**
If both happen together, the story becomes much more meaningful.
What are you watching for ETH beyond price?
This is my personal opinion, not financial advice. Do your own research.
5 Ethereum metrics I would check before forming a long-term view.
$QNT
{spot}(QNTUSDT)
$ONDO
{spot}(ONDOUSDT)
#ETHBreaksAbove$2 ,700
#ETHBrakes2k
$ETH crossing $2,700 gets attention. But price alone doesn't answer the important question.**
Ethereum recently traded above the $2,700 area after a strong multi-session advance.
The bigger question is whether this move is being supported by real interest in the Ethereum ecosystem.
Price can attract attention.
Attention can attract traders.
But long-term value usually needs something underneath it.
For Ethereum, I keep coming back to:
> Network activity
> Developer activity
> Stablecoin usage
> DeFi demand
> Institutional interest
A higher price is interesting.
Growing usage is more interesting.
That distinction matters because crypto markets can move much faster than fundamentals.
So I wouldn't reduce the ETH story to one number.
The useful question is:
**Is Ethereum becoming more useful while the market is becoming more interested?**
If both happen together, the story becomes much more meaningful.
What are you watching for ETH beyond price?
This is my personal opinion, not financial advice. Do your own research.
5 Ethereum metrics I would check before forming a long-term view.
$QNT
$ONDO
#ETHBreaksAbove$2 ,700
#ETHBrakes2k
Ethereum recently traded above the $2,700 area after a strong multi-session advance.
The bigger question is whether this move is being supported by real interest in the Ethereum ecosystem.
Price can attract attention.
Attention can attract traders.
But long-term value usually needs something underneath it.
For Ethereum, I keep coming back to:
> Network activity
> Developer activity
> Stablecoin usage
> DeFi demand
> Institutional interest
A higher price is interesting.
Growing usage is more interesting.
That distinction matters because crypto markets can move much faster than fundamentals.
So I wouldn't reduce the ETH story to one number.
The useful question is:
**Is Ethereum becoming more useful while the market is becoming more interested?**
If both happen together, the story becomes much more meaningful.
What are you watching for ETH beyond price?
This is my personal opinion, not financial advice. Do your own research.
5 Ethereum metrics I would check before forming a long-term view.
$QNT
$ONDO
#ETHBreaksAbove$2 ,700
#ETHBrakes2k
18
One of the biggest stories in crypto right now isn't happening on a crypto exchange.
The U.S. 30-year Treasury yield recently reached levels not seen since 2004, amid a broader bond-market selloff.
Why should crypto people care?
Because long-term Treasury yields influence how investors value almost every risk asset.
Think of it simply:
If safer government debt offers increasingly attractive yields, investors have another place to put capital.
That doesn't automatically mean crypto loses.
But it changes the competition for capital.
And the 30-year yield is especially interesting because it reflects long-term expectations around inflation, borrowing costs and government financing.
For crypto, this creates a bigger macro question:
How much risk appetite remains when traditional yields become more attractive?
That is a much more useful question than simply asking whether Bitcoin is bullish or bearish today.
Markets are connected.
Sometimes the bond market speaks first.
Crypto simply reacts later.
This is my personal opinion, not financial advice. Do your own research.
Why rising Treasury yields can change the psychology of crypto investors.
$ZEC
{spot}(ZECUSDT)
$BTC
{spot}(BTCUSDT)
$QNT
{spot}(QNTUSDT)
#US30YearYieldHighestSince2004
#US30YearYieldHitsHighestSince2007
#US30YTreasuryYieldTops5.40%
#US30YearYieldClimbsToNear5.23%
One of the biggest stories in crypto right now isn't happening on a crypto exchange.
The U.S. 30-year Treasury yield recently reached levels not seen since 2004, amid a broader bond-market selloff.
Why should crypto people care?
Because long-term Treasury yields influence how investors value almost every risk asset.
Think of it simply:
If safer government debt offers increasingly attractive yields, investors have another place to put capital.
That doesn't automatically mean crypto loses.
But it changes the competition for capital.
And the 30-year yield is especially interesting because it reflects long-term expectations around inflation, borrowing costs and government financing.
For crypto, this creates a bigger macro question:
How much risk appetite remains when traditional yields become more attractive?
That is a much more useful question than simply asking whether Bitcoin is bullish or bearish today.
Markets are connected.
Sometimes the bond market speaks first.
Crypto simply reacts later.
This is my personal opinion, not financial advice. Do your own research.
Why rising Treasury yields can change the psychology of crypto investors.
$ZEC
$BTC
$QNT
#US30YearYieldHighestSince2004
#US30YearYieldHitsHighestSince2007
#US30YTreasuryYieldTops5.40%
#US30YearYieldClimbsToNear5.23%
The U.S. 30-year Treasury yield recently reached levels not seen since 2004, amid a broader bond-market selloff.
Why should crypto people care?
Because long-term Treasury yields influence how investors value almost every risk asset.
Think of it simply:
If safer government debt offers increasingly attractive yields, investors have another place to put capital.
That doesn't automatically mean crypto loses.
But it changes the competition for capital.
And the 30-year yield is especially interesting because it reflects long-term expectations around inflation, borrowing costs and government financing.
For crypto, this creates a bigger macro question:
How much risk appetite remains when traditional yields become more attractive?
That is a much more useful question than simply asking whether Bitcoin is bullish or bearish today.
Markets are connected.
Sometimes the bond market speaks first.
Crypto simply reacts later.
This is my personal opinion, not financial advice. Do your own research.
Why rising Treasury yields can change the psychology of crypto investors.
$ZEC
$BTC
$QNT
#US30YearYieldHighestSince2004
#US30YearYieldHitsHighestSince2007
#US30YTreasuryYieldTops5.40%
#US30YearYieldClimbsToNear5.23%
1
229
$84,600 doesn't tell the whole Bitcoin story. The reason behind the move does.
Binance News reported Bitcoin slipping back toward **$84,600** after failing to hold the higher area around $87,300. The move came alongside a stronger dollar and higher U.S. yields.
This is where many traders make the same mistake.
They look at the price first.
I prefer starting with the environment.
What is happening to the dollar?
What are bond yields doing?
What are traders pricing for the Fed?
And most importantly:
Is capital still entering Bitcoin through regulated investment products?
Because Bitcoin doesn't move independently from global money conditions.
A pullback can simply be a period of uncertainty.
It can also become something bigger if macro pressure continues.
We don't know which one it becomes yet.
That's why I would rather watch the **reason behind the move** than react emotionally to one number.
What are you watching right now: Bitcoin, the dollar, or Treasury yields?
This is my personal opinion, not financial advice. Do your own research.
Why Bitcoin, the dollar and Treasury yields often end up in the same conversation.
$BTC
{spot}(BTCUSDT)
$SOL
{spot}(SOLUSDT)
$QTUM
{spot}(QTUMUSDT)
#BitcoinFallsToAround$84 ,600ThisWeek
$84,600 doesn't tell the whole Bitcoin story. The reason behind the move does.
Binance News reported Bitcoin slipping back toward **$84,600** after failing to hold the higher area around $87,300. The move came alongside a stronger dollar and higher U.S. yields.
This is where many traders make the same mistake.
They look at the price first.
I prefer starting with the environment.
What is happening to the dollar?
What are bond yields doing?
What are traders pricing for the Fed?
And most importantly:
Is capital still entering Bitcoin through regulated investment products?
Because Bitcoin doesn't move independently from global money conditions.
A pullback can simply be a period of uncertainty.
It can also become something bigger if macro pressure continues.
We don't know which one it becomes yet.
That's why I would rather watch the **reason behind the move** than react emotionally to one number.
What are you watching right now: Bitcoin, the dollar, or Treasury yields?
This is my personal opinion, not financial advice. Do your own research.
Why Bitcoin, the dollar and Treasury yields often end up in the same conversation.
$BTC
$SOL
$QTUM
#BitcoinFallsToAround$84 ,600ThisWeek
Binance News reported Bitcoin slipping back toward **$84,600** after failing to hold the higher area around $87,300. The move came alongside a stronger dollar and higher U.S. yields.
This is where many traders make the same mistake.
They look at the price first.
I prefer starting with the environment.
What is happening to the dollar?
What are bond yields doing?
What are traders pricing for the Fed?
And most importantly:
Is capital still entering Bitcoin through regulated investment products?
Because Bitcoin doesn't move independently from global money conditions.
A pullback can simply be a period of uncertainty.
It can also become something bigger if macro pressure continues.
We don't know which one it becomes yet.
That's why I would rather watch the **reason behind the move** than react emotionally to one number.
What are you watching right now: Bitcoin, the dollar, or Treasury yields?
This is my personal opinion, not financial advice. Do your own research.
Why Bitcoin, the dollar and Treasury yields often end up in the same conversation.
$BTC
$SOL
$QTUM
#BitcoinFallsToAround$84 ,600ThisWeek
56
Bitcoin slipping below $83,000 is less interesting than why the market is watching it.
$BTC
{spot}(BTCUSDT)
Recent market coverage linked Bitcoin weakness with rising Treasury yields, a stronger dollar and increased expectations for additional Fed tightening.
That combination matters because Bitcoin is still traded inside a much bigger global liquidity environment.
When investors become more cautious, speculative assets can feel that change quickly.
But one price level doesn't explain the entire market.
The more useful question is:
> Is this just short-term positioning?
Or:
> Are investors genuinely becoming more defensive?
That distinction matters.
Bitcoin can move lower without changing its long-term thesis.
At the same time, macro pressure can persist longer than traders expect.
So instead of obsessing over one number, I'm watching the bigger picture:
Dollar strength.
Treasury yields.
Rate expectations.
And whether capital continues flowing into Bitcoin products.
Price gets the headline.
Liquidity often tells the deeper story.
This is my personal opinion, not financial advice. Do your own research.
Three macro indicators I watch when Bitcoin suddenly loses momentum.
$ETH
{spot}(ETHUSDT)
$BNB
{spot}(BNBUSDT)
#BitcoinFallsBelow$83,000
Bitcoin slipping below $83,000 is less interesting than why the market is watching it.
$BTC
Recent market coverage linked Bitcoin weakness with rising Treasury yields, a stronger dollar and increased expectations for additional Fed tightening.
That combination matters because Bitcoin is still traded inside a much bigger global liquidity environment.
When investors become more cautious, speculative assets can feel that change quickly.
But one price level doesn't explain the entire market.
The more useful question is:
> Is this just short-term positioning?
Or:
> Are investors genuinely becoming more defensive?
That distinction matters.
Bitcoin can move lower without changing its long-term thesis.
At the same time, macro pressure can persist longer than traders expect.
So instead of obsessing over one number, I'm watching the bigger picture:
Dollar strength.
Treasury yields.
Rate expectations.
And whether capital continues flowing into Bitcoin products.
Price gets the headline.
Liquidity often tells the deeper story.
This is my personal opinion, not financial advice. Do your own research.
Three macro indicators I watch when Bitcoin suddenly loses momentum.
$ETH
$BNB
#BitcoinFallsBelow$83,000
$BTC
Recent market coverage linked Bitcoin weakness with rising Treasury yields, a stronger dollar and increased expectations for additional Fed tightening.
That combination matters because Bitcoin is still traded inside a much bigger global liquidity environment.
When investors become more cautious, speculative assets can feel that change quickly.
But one price level doesn't explain the entire market.
The more useful question is:
> Is this just short-term positioning?
Or:
> Are investors genuinely becoming more defensive?
That distinction matters.
Bitcoin can move lower without changing its long-term thesis.
At the same time, macro pressure can persist longer than traders expect.
So instead of obsessing over one number, I'm watching the bigger picture:
Dollar strength.
Treasury yields.
Rate expectations.
And whether capital continues flowing into Bitcoin products.
Price gets the headline.
Liquidity often tells the deeper story.
This is my personal opinion, not financial advice. Do your own research.
Three macro indicators I watch when Bitcoin suddenly loses momentum.
$ETH
$BNB
#BitcoinFallsBelow$83,000
72
Crypto doesn't trade in a vacuum. Right now, the Fed is becoming part of the Bitcoin conversation again.
Market pricing recently put the probability of another Fed rate hike in October at 69.7%, according to reported CME FedWatch pricing.
Why does this matter for crypto?
Because interest rates influence how investors think about risk.
When cash and government bonds offer higher returns, speculative assets have to compete for attention.
That doesn't automatically mean Bitcoin must fall.
It simply changes the environment.
The bigger issue is expectations.
$SAGA
{spot}(SAGAUSDT)
$XPL
{spot}(XPLUSDT)
If markets suddenly expect tighter monetary policy for longer, investors may become more selective across crypto.
> Higher rates → tighter financial conditions
> Tighter conditions → less room for speculation
> Less speculation → stronger focus on quality and liquidity
For $BTC, I think the Fed narrative is now something worth watching alongside crypto-specific data.
Macro can change the mood before the chart tells the story.
What happens next depends heavily on incoming economic data.
This is my personal opinion, not financial advice. Do your own research.
Why do interest rates matter to Bitcoin even though Bitcoin isn't controlled by the Fed?
#fedoctoberratehikeoddsriseto69.7%
Crypto doesn't trade in a vacuum. Right now, the Fed is becoming part of the Bitcoin conversation again.
Market pricing recently put the probability of another Fed rate hike in October at 69.7%, according to reported CME FedWatch pricing.
Why does this matter for crypto?
Because interest rates influence how investors think about risk.
When cash and government bonds offer higher returns, speculative assets have to compete for attention.
That doesn't automatically mean Bitcoin must fall.
It simply changes the environment.
The bigger issue is expectations.
$SAGA
$XPL
If markets suddenly expect tighter monetary policy for longer, investors may become more selective across crypto.
> Higher rates → tighter financial conditions
> Tighter conditions → less room for speculation
> Less speculation → stronger focus on quality and liquidity
For $BTC, I think the Fed narrative is now something worth watching alongside crypto-specific data.
Macro can change the mood before the chart tells the story.
What happens next depends heavily on incoming economic data.
This is my personal opinion, not financial advice. Do your own research.
Why do interest rates matter to Bitcoin even though Bitcoin isn't controlled by the Fed?
#fedoctoberratehikeoddsriseto69.7%
Market pricing recently put the probability of another Fed rate hike in October at 69.7%, according to reported CME FedWatch pricing.
Why does this matter for crypto?
Because interest rates influence how investors think about risk.
When cash and government bonds offer higher returns, speculative assets have to compete for attention.
That doesn't automatically mean Bitcoin must fall.
It simply changes the environment.
The bigger issue is expectations.
$SAGA
$XPL
If markets suddenly expect tighter monetary policy for longer, investors may become more selective across crypto.
> Higher rates → tighter financial conditions
> Tighter conditions → less room for speculation
> Less speculation → stronger focus on quality and liquidity
For $BTC, I think the Fed narrative is now something worth watching alongside crypto-specific data.
Macro can change the mood before the chart tells the story.
What happens next depends heavily on incoming economic data.
This is my personal opinion, not financial advice. Do your own research.
Why do interest rates matter to Bitcoin even though Bitcoin isn't controlled by the Fed?
#fedoctoberratehikeoddsriseto69.7%
2
555
$HYPE Binance listed HYPE. Now the interesting part begins.
Binance has listed Hyperliquid’s HYPE for spot trading, giving the token access to one of the largest centralized exchange audiences.
For me, the interesting part is what happens after the headline fades.
A major listing can bring:
> More liquidity
> More visibility
> More new holders
> More attention from traders who previously ignored the asset
But attention cuts both ways.
More people also means more expectations, more speculation, and more short-term noise.
Hyperliquid already has a strong identity in decentralized derivatives. The Binance listing gives that ecosystem another bridge to centralized-market participants.
The real question isn't simply, “Will HYPE move?”
It is whether the additional attention turns into lasting demand and actual ecosystem usage.
That is the part worth researching.
This is my personal opinion, not financial advice. Do your own research.
What should investors watch after a major exchange listing: liquidity, users, revenue, or narrative?
$QNT
{spot}(QNTUSDT)
$ONDO
{spot}(ONDOUSDT)
#binancewilllisthyperliquid(hype)
$HYPE Binance listed HYPE. Now the interesting part begins.
Binance has listed Hyperliquid’s HYPE for spot trading, giving the token access to one of the largest centralized exchange audiences.
For me, the interesting part is what happens after the headline fades.
A major listing can bring:
> More liquidity
> More visibility
> More new holders
> More attention from traders who previously ignored the asset
But attention cuts both ways.
More people also means more expectations, more speculation, and more short-term noise.
Hyperliquid already has a strong identity in decentralized derivatives. The Binance listing gives that ecosystem another bridge to centralized-market participants.
The real question isn't simply, “Will HYPE move?”
It is whether the additional attention turns into lasting demand and actual ecosystem usage.
That is the part worth researching.
This is my personal opinion, not financial advice. Do your own research.
What should investors watch after a major exchange listing: liquidity, users, revenue, or narrative?
$QNT
$ONDO
#binancewilllisthyperliquid(hype)
Binance has listed Hyperliquid’s HYPE for spot trading, giving the token access to one of the largest centralized exchange audiences.
For me, the interesting part is what happens after the headline fades.
A major listing can bring:
> More liquidity
> More visibility
> More new holders
> More attention from traders who previously ignored the asset
But attention cuts both ways.
More people also means more expectations, more speculation, and more short-term noise.
Hyperliquid already has a strong identity in decentralized derivatives. The Binance listing gives that ecosystem another bridge to centralized-market participants.
The real question isn't simply, “Will HYPE move?”
It is whether the additional attention turns into lasting demand and actual ecosystem usage.
That is the part worth researching.
This is my personal opinion, not financial advice. Do your own research.
What should investors watch after a major exchange listing: liquidity, users, revenue, or narrative?
$QNT
$ONDO
#binancewilllisthyperliquid(hype)
2
421
Частичная правда
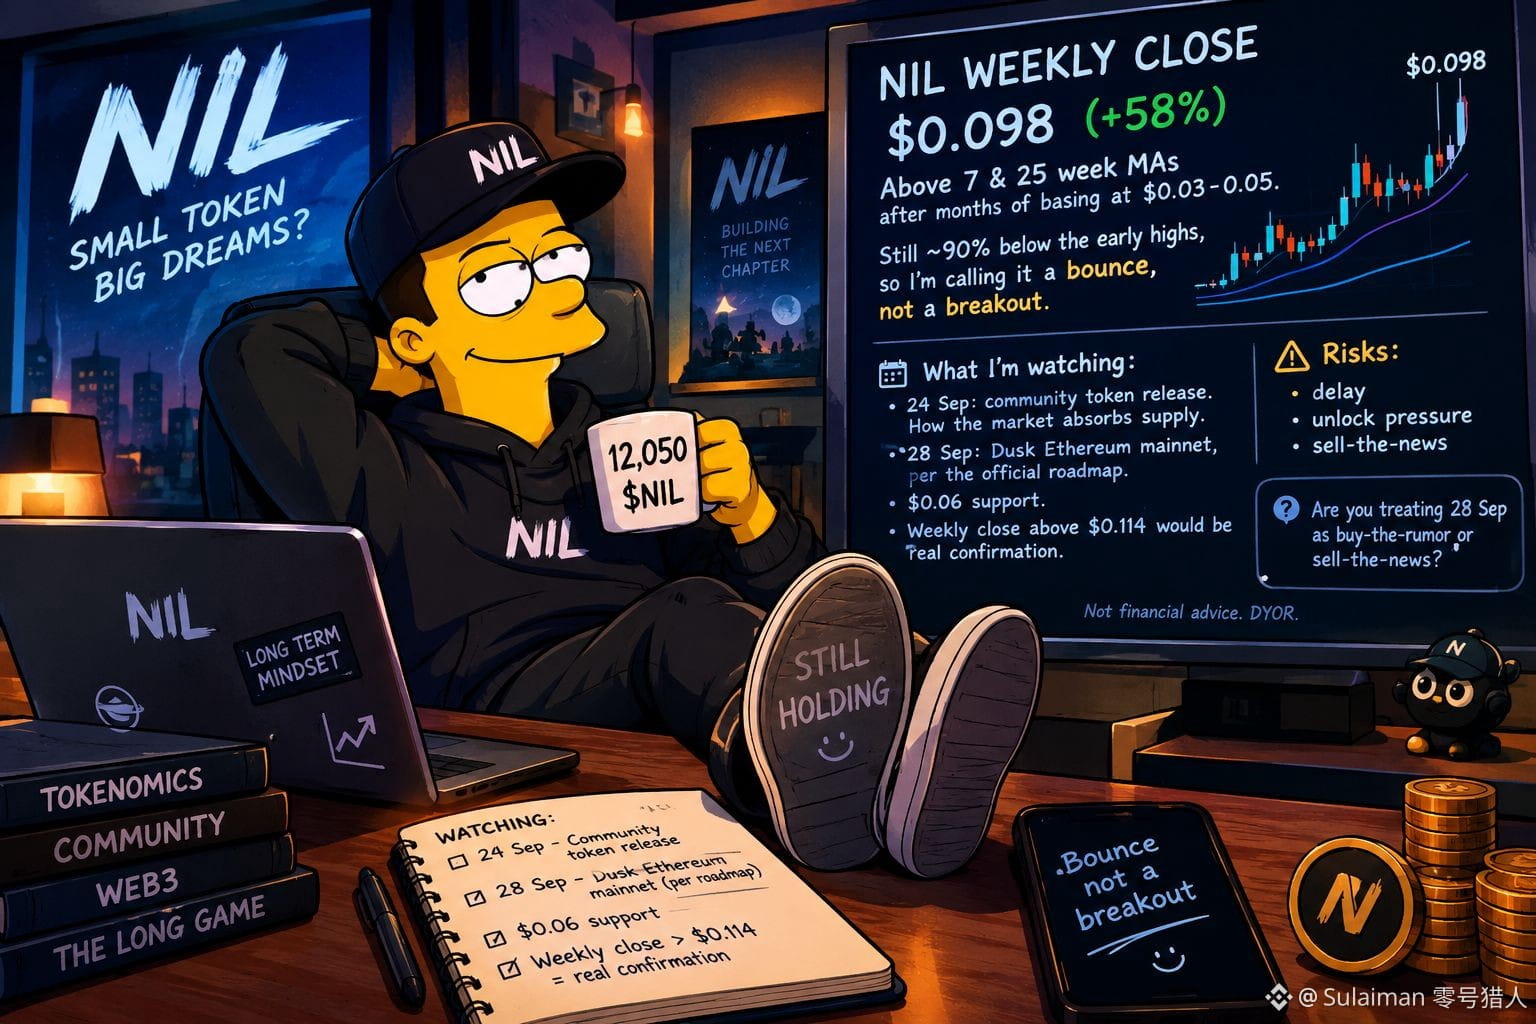
I hold 12,050 $NIL 🪙
Up ~58% this week to ~$0.098 📈 Still far below old highs, so I'm calling it a bounce for now.
24 Sep: token unlock
28 Sep: Dusk goes live on Ethereum 👀
Buying the rumor or selling the news? 🤔
Not financial advice, DYOR.
#Nillion #NIL #Crypto #PrivacyCoins #Ethereum
$SAGA
$MET
I hold 12,050 $NIL 🪙
Up ~58% this week to ~$0.098 📈 Still far below old highs, so I'm calling it a bounce for now.
24 Sep: token unlock
28 Sep: Dusk goes live on Ethereum 👀
Buying the rumor or selling the news? 🤔
Not financial advice, DYOR.
#Nillion #NIL #Crypto #PrivacyCoins #Ethereum
$SAGA
$MET
Up ~58% this week to ~$0.098 📈 Still far below old highs, so I'm calling it a bounce for now.
24 Sep: token unlock
28 Sep: Dusk goes live on Ethereum 👀
Buying the rumor or selling the news? 🤔
Not financial advice, DYOR.
#Nillion #NIL #Crypto #PrivacyCoins #Ethereum
$SAGA
$MET
2
3
111
🎙️ 🎉2026狂暴牛市,号角已吹响,行情尽在BSC链!!11月1号马斯克将为火星狗Marvin庆祝生日,这波链上行情一定要抓住!
Завершено
02 ч 21 мин 30 сек
7k
15
44
$ZRO
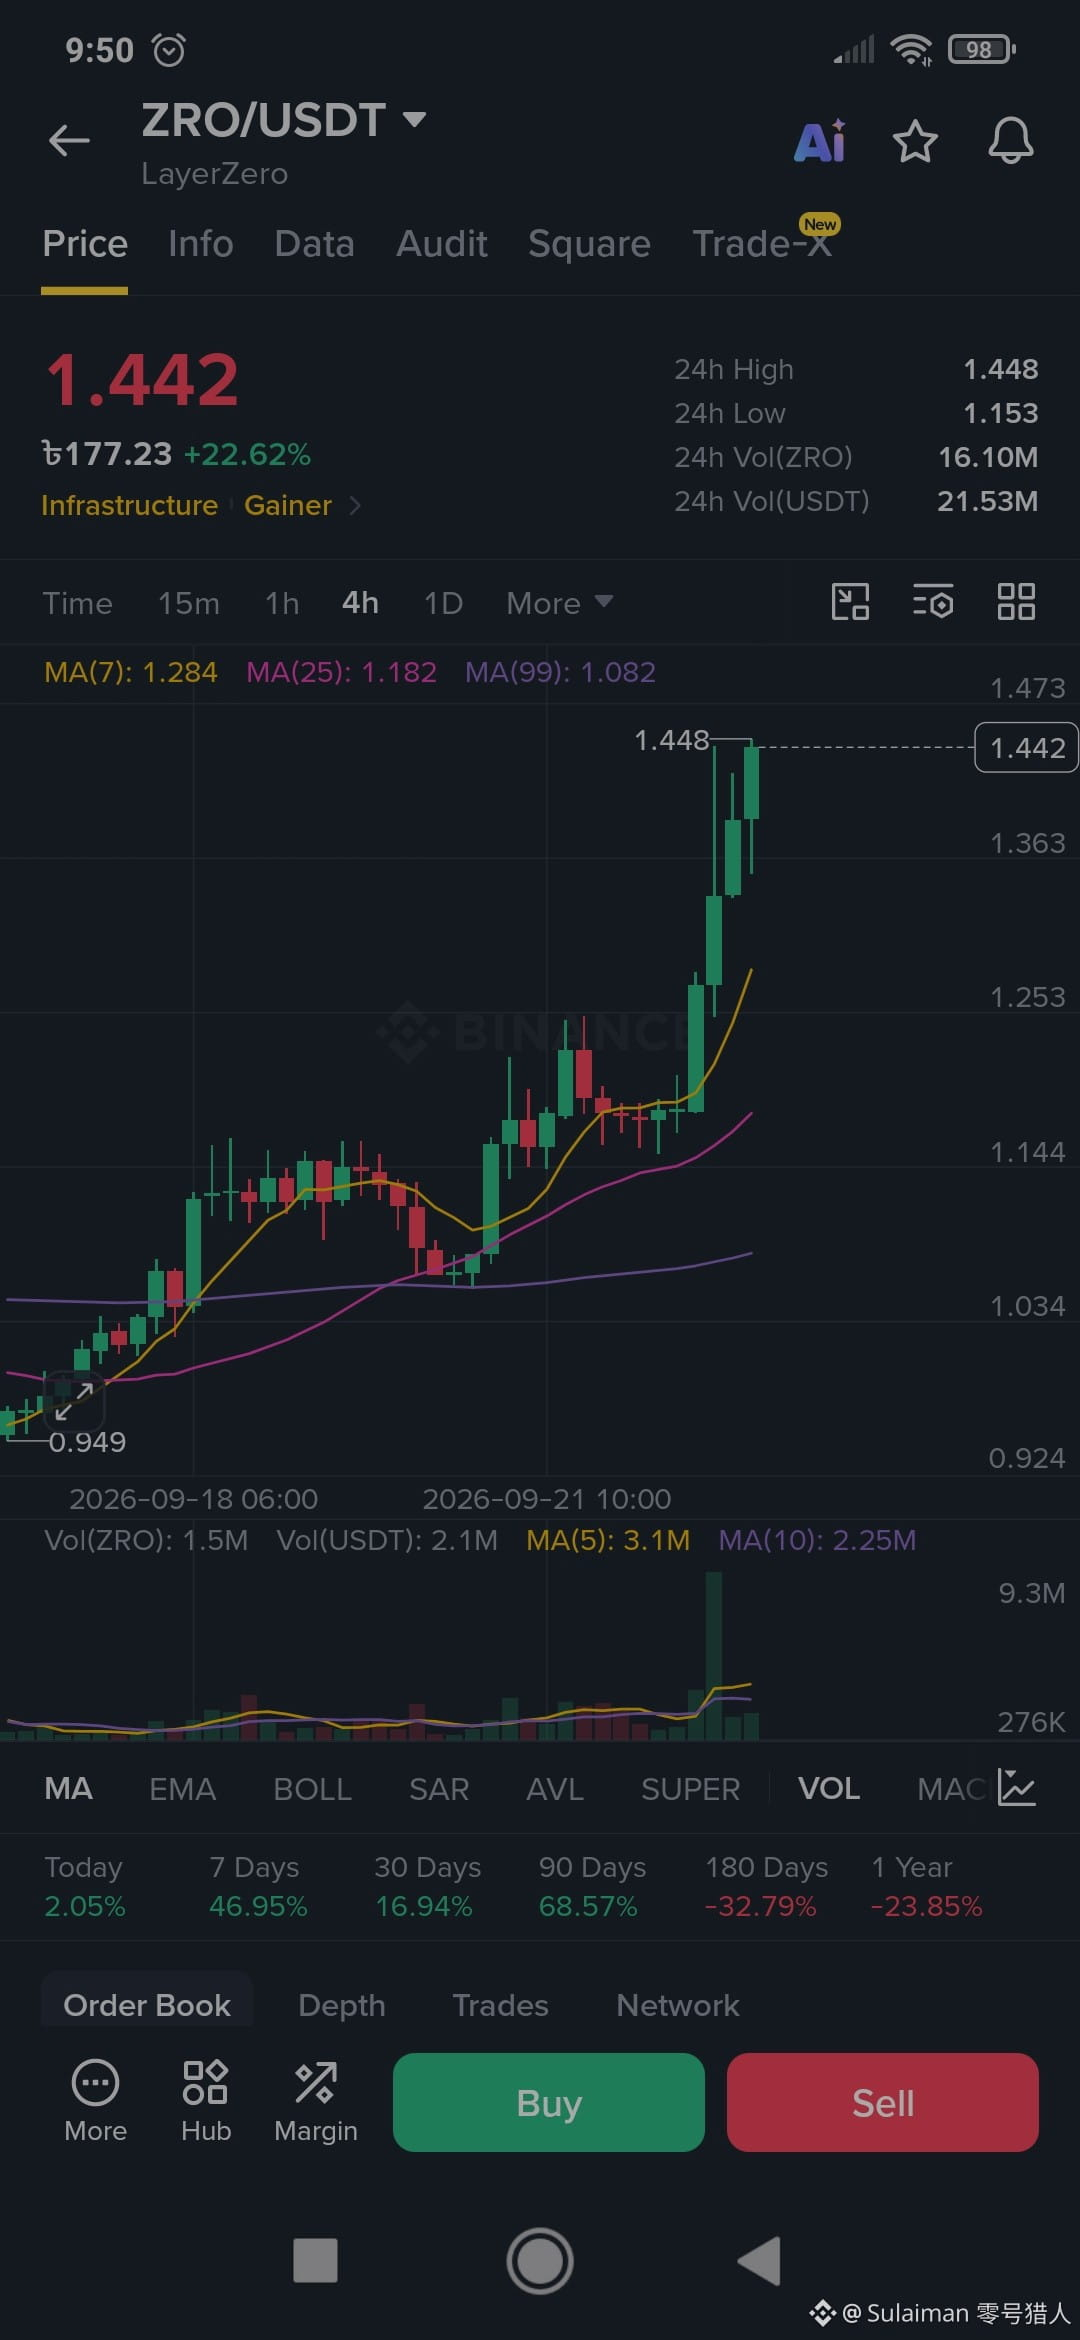
$ZRO holders 😎
After holding this long, there’s only one thing we want:
Profit better not be shy when it finally arrives. 😂
Respect to everyone still here.
We didn’t come here to panic.
We’re waiting for that one beautiful moment:
“Finally… worth the wait.” 🤑🔥
#Zro
$ZRO
$ZRO holders 😎
After holding this long, there’s only one thing we want:
Profit better not be shy when it finally arrives. 😂
Respect to everyone still here.
We didn’t come here to panic.
We’re waiting for that one beautiful moment:
“Finally… worth the wait.” 🤑🔥
#Zro
$ZRO holders 😎
After holding this long, there’s only one thing we want:
Profit better not be shy when it finally arrives. 😂
Respect to everyone still here.
We didn’t come here to panic.
We’re waiting for that one beautiful moment:
“Finally… worth the wait.” 🤑🔥
#Zro
21
$MINA
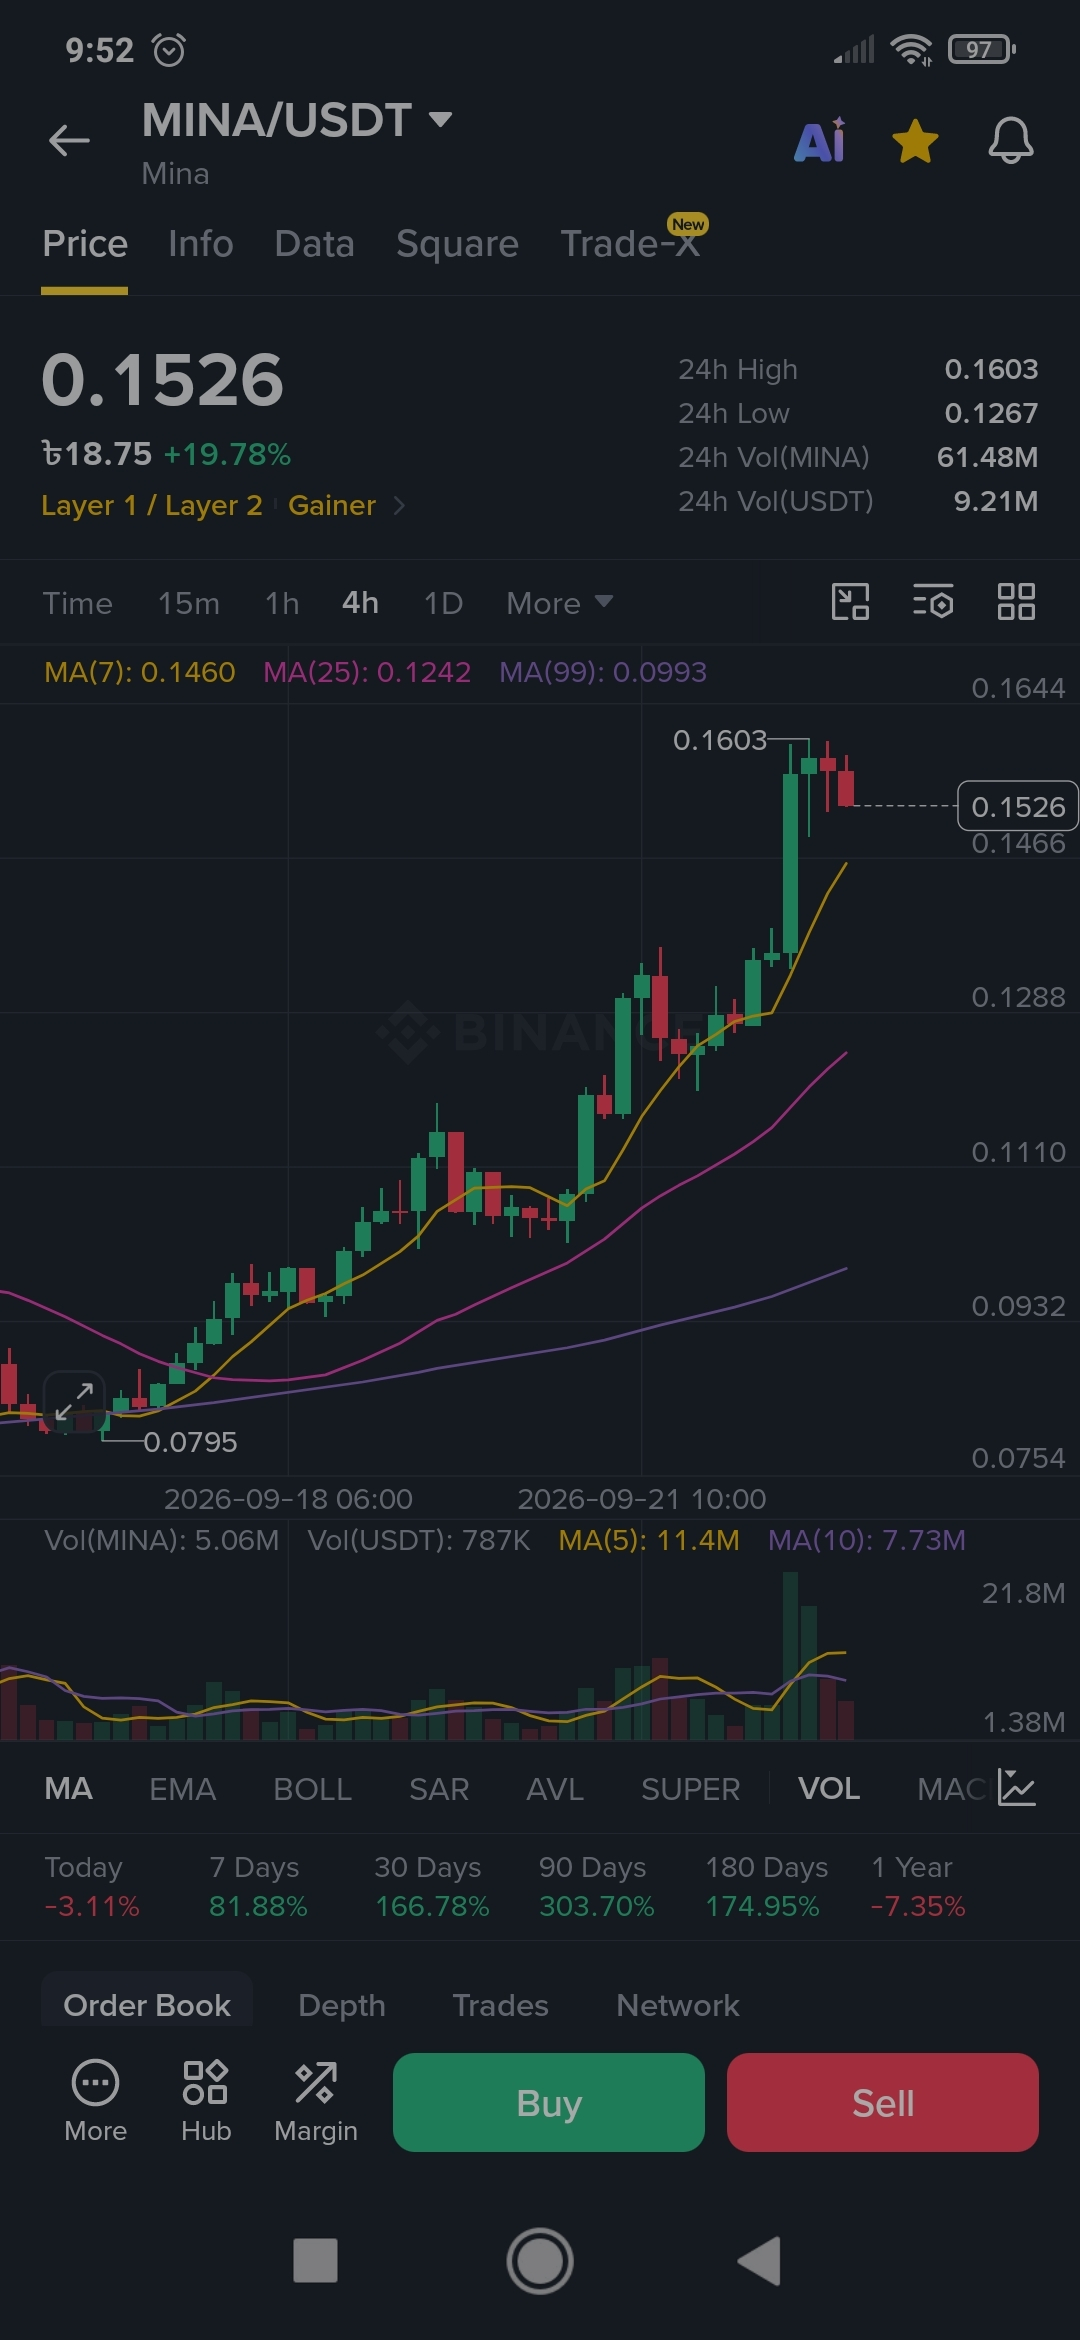
$MINA holders ❤️
Anyone still holding MINA knows what patience really means. 😂
At this point, we don’t ask for much…
Just one day, open the portfolio…
See the profit…
And quietly smile.
MINA family, we deserve that moment. 💰🔥
#Mina
$MINA
$MINA holders ❤️
Anyone still holding MINA knows what patience really means. 😂
At this point, we don’t ask for much…
Just one day, open the portfolio…
See the profit…
And quietly smile.
MINA family, we deserve that moment. 💰🔥
#Mina
$MINA holders ❤️
Anyone still holding MINA knows what patience really means. 😂
At this point, we don’t ask for much…
Just one day, open the portfolio…
See the profit…
And quietly smile.
MINA family, we deserve that moment. 💰🔥
#Mina
75
Войдите, чтобы посмотреть больше материала
Присоединяйтесь к пользователям криптовалют по всему миру на Binance Square
⚡️ Получайте новейшую и полезную информацию о криптоактивах.
💬 Нам доверяет крупнейшая в мире криптобиржа.
👍 Получите достоверные аналитические данные от верифицированных создателей контента.
Эл. почта/номер телефона
В тренде
BinanceKZ
Просмотров: 7,543
45 обсуждают
Как я потерял 180 000 тенге на «менеджере Binance» из WhatsApp — и почему всё равно остался в крипте
phpdead
·Лайков: 5
·Просмотров: 1.1k
CircleMints500MUSDCOnSolana
Просмотров: 67,934
1,624 обсуждают
PolymarketBankFailureBetsDrawFDICConcern
Просмотров: 77,897
1,578 обсуждают