
AbdullRauf
8.2k Публикации

AbdullRauf
 Square Verified
Отправить жалобу
Заблокировать пользователя
Hi Guys i am Spot trader specialist in Intra Daytrade, DCA and Swing trade. Follow me tostay updated about market and Binance reward Campaigns.
Открытая сделка

Владелец DUSK
Трейдер с регулярными сделками
1.3 г
1.1K+ подписок(и/а)
32.8K+ подписчиков(а)
29.2K+ понравилось
Посты
Портфель
Все
Цитирования
Видео
Активно
PINNED
·
--
Assalamu Alaikum, Square Family! 💐🧧🎉
Your support means everything to us. To show our heartfelt gratitude, we’re excited to launch a special giveaway — we’re giving away 2000 Giveaway!
🎁 How to Enter:
1. ✅ Follow our page
2. ✅ Share this post with your community
3. ✅ Comment “222!” below
Winners will be chosen randomly — don’t miss your chance to be one of them!
Thank you for being an amazing part of our journey. Let’s celebrate together! 🎊
Assalamu Alaikum, Square Family! 💐🧧🎉
Your support means everything to us. To show our heartfelt gratitude, we’re excited to launch a special giveaway — we’re giving away 2000 Giveaway!
🎁 How to Enter:
1. ✅ Follow our page
2. ✅ Share this post with your community
3. ✅ Comment “222!” below
Winners will be chosen randomly — don’t miss your chance to be one of them!
Thank you for being an amazing part of our journey. Let’s celebrate together! 🎊
Your support means everything to us. To show our heartfelt gratitude, we’re excited to launch a special giveaway — we’re giving away 2000 Giveaway!
🎁 How to Enter:
1. ✅ Follow our page
2. ✅ Share this post with your community
3. ✅ Comment “222!” below
Winners will be chosen randomly — don’t miss your chance to be one of them!
Thank you for being an amazing part of our journey. Let’s celebrate together! 🎊

779
25
41
779
·
--
go
go
AbdullRauf
·
--
Assalamu Alaikum, Square Family! 💐🧧🎉
Your support means everything to us. To show our heartfelt gratitude, we’re excited to launch a special giveaway — we’re giving away 2000 Giveaway!
🎁 How to Enter:
1. ✅ Follow our page
2. ✅ Share this post with your community
3. ✅ Comment “222!” below
Winners will be chosen randomly — don’t miss your chance to be one of them!
Thank you for being an amazing part of our journey. Let’s celebrate together! 🎊
Your support means everything to us. To show our heartfelt gratitude, we’re excited to launch a special giveaway — we’re giving away 2000 Giveaway!
🎁 How to Enter:
1. ✅ Follow our page
2. ✅ Share this post with your community
3. ✅ Comment “222!” below
Winners will be chosen randomly — don’t miss your chance to be one of them!
Thank you for being an amazing part of our journey. Let’s celebrate together! 🎊

1
325
·
--
Статья
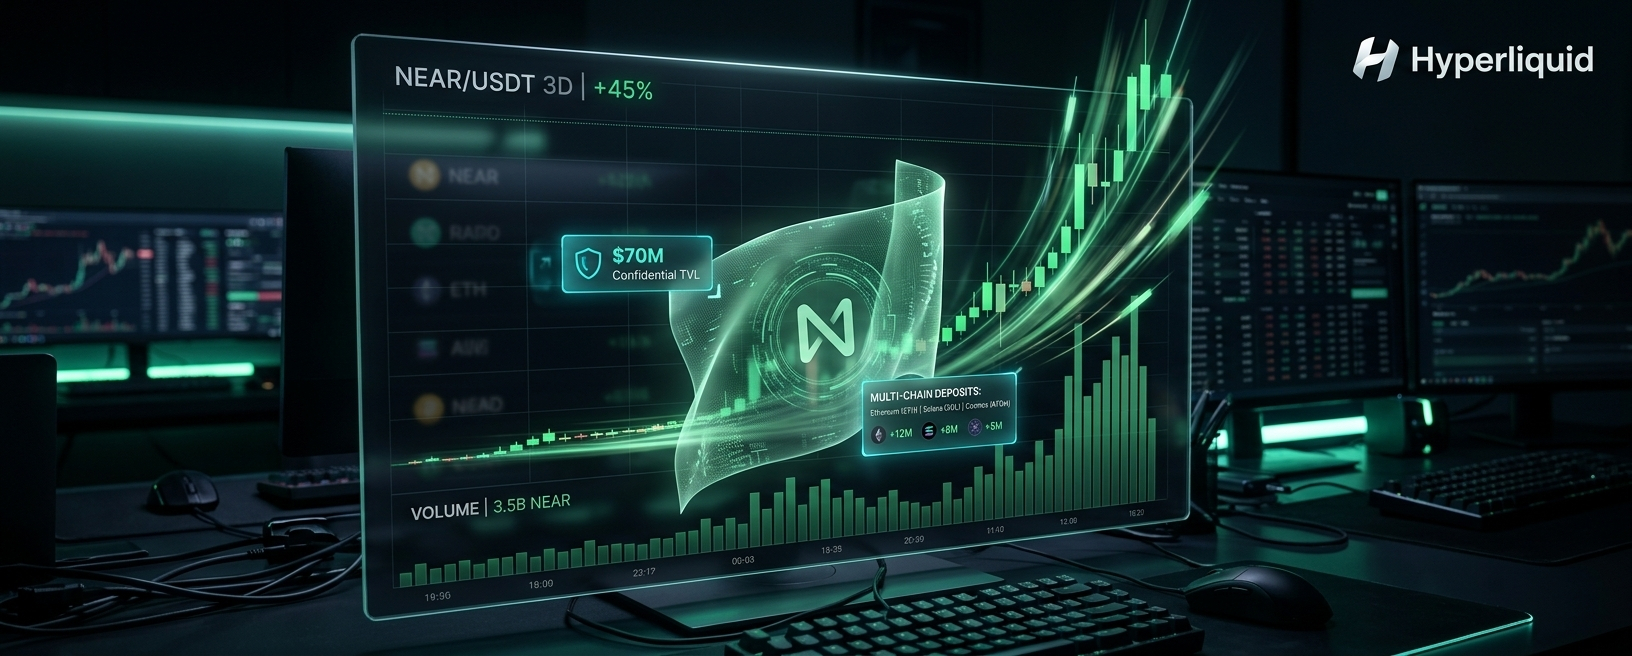
NEAR’s Confidential Perps Bet Meets Real VolumeA privacy feature rarely moves a large-cap L1 this fast. NEAR has climbed roughly 45% in three days, trading in the $3.20 to $3.45 range, after the rollout of confidential perpetual trading tied to Hyperliquid. HYPE has extended toward prior highs near $90. Sentiment across Fear & Greed trackers has been sitting in Greed territory, roughly 57 to 71. Risk appetite is there. The more important question is whether this is a short-lived catalyst trade or the first clear signal that private on-chain derivatives can attract meaningful size.
What makes the setup different is the pairing. Hyperliquid has been processing on the order of $240 billion in perps volume over the prior 30 days. NEAR Intents have been generating more than $5 million in monthly fees. Confidential mode is not being launched into an empty venue. It is being attached to an engine that already has liquidity and to an L1 that has been pushing hard into AI, agents, and privacy-preserving execution.
Why the Timing Matters
Broader market tone has been willing to fund growth narratives again. That helps any strong catalyst. But the NEAR move is more specific than a generic risk-on bounce. Confidential TVL in the relevant intents and secret-mode activity has crossed about $70 million, with incentive snapshots tied to that threshold. Multi-chain deposits from more than 35 networks are active. That points to capital arriving from outside a single ecosystem rather than pure native rotation.
For pro traders, the combination of a sharp price response, rising volume, and a measurable TVL print is the kind of package that forces a decision. Either the market is front-running a durable new use case, or it is pricing a product launch too aggressively before retention is proven. Both readings are still open.
Technical and Market Structure
NEAR’s volume has been reported up around 120% with the move, which supports the idea that the advance is not just thin short-covering. Momentum is clearly strong. That also means shorter-term indicators are stretched. Moves of this speed often need either consolidation or a deeper retest before the next clean leg.
HYPE’s push toward prior all-time-high resistance after consecutive daily gains adds a second axis. If Hyperliquid’s token is firm while confidential activity on NEAR is rising, the market is treating the integration as additive rather than zero-sum. Funding and open interest on Hyperliquid have remained constructive, which suggests leverage is still engaging with the complex rather than exiting into the spike.
The practical read is straightforward. Strength with expanding volume and constructive derivatives metrics favors continuation after digestion. Strength with fading volume and rapidly elevated funding would favor a more tactical fade. So far the former description fits better than the latter, but the window after a 45% run is where that assessment can change quickly.
On-Chain and Product Reality
The $70 million confidential TVL figure is the number that separates this from pure narrative. Incentive programs can inflate short-term deposits, and that risk should not be ignored. Still, crossing a clear threshold while multi-chain deposits are active is more useful than a press release alone.
Privacy-by-default perps aim at a real friction in on-chain trading. Public mempools and transparent positioning make certain strategies harder to execute without leakage. A setup that keeps execution details shielded while still routing into a deep order book tries to solve that without forcing traders onto a fully isolated venue. That is the hybrid the market is responding to: privacy where it matters for the trader, liquidity where it matters for the fill.
Whether that hybrid holds depends on retention after incentives, fee quality, and whether larger accounts actually keep flow in confidential mode once the initial campaign window passes. Early TVL is a start. Sustained usage is the test.
Fundamentals, Risks, and Positioning
From a fundamental angle, the addressable user is not only the retail perps trader. It includes participants who want on-chain settlement and self-custody characteristics without broadcasting every aspect of their positioning. Pure L2 offerings and centralized exchanges each solve part of that problem. The NEAR–Hyperliquid combination is an attempt to sit in the middle: high-throughput settlement and confidential intents on one side, a dominant perps execution environment on the other.
Risks are clear. Product launches in crypto often produce a front-loaded price response that decays if metrics stall. Confidential systems also add operational and trust assumptions; users and institutions will care about the exact privacy guarantees, auditability, and failure modes. Correlation risk is another factor. If broader risk sentiment turns, NEAR and HYPE can both give back gains regardless of product quality.
For pro traders, the cleaner approach is to separate the catalyst from the trend. The catalyst has already been expressed in price. The trend case requires follow-through in confidential TVL, fees, and open interest without an immediate collapse in momentum. For longer-term investors, the question is whether this becomes a repeatable liquidity venue for private strategy execution or remains a one-cycle narrative premium.
Closing View
NEAR’s rally is tied to something more concrete than a vague AI or privacy story. Confidential perps, a $70 million secret-mode TVL print, multi-chain deposit activity, and Hyperliquid’s existing volume base give the move a real product anchor. HYPE’s strength alongside it suggests the market sees the pairing as complementary.
That does not make the advance low-risk. A 45% move in three days discounts a lot of good news quickly. What I'm watching from here is whether confidential activity continues to build after the first incentive checkpoints and whether price can hold a higher range without relying on continuous new headline flow. If the product keeps attracting size, the privacy-liquidity hybrid thesis gets harder to dismiss. If TVL and volume fade with the news cycle, this will look like another well-marketed catalyst that outran usage. The next few weeks of retention data will matter more than the size of the initial candle.
#Near #Hyperliquid #CryptoPrivacy #defi #bullish
$NEAR
{spot}(NEARUSDT)
$HYPE
{future}(HYPEUSDT)
NEAR’s Confidential Perps Bet Meets Real Volume
A privacy feature rarely moves a large-cap L1 this fast. NEAR has climbed roughly 45% in three days, trading in the $3.20 to $3.45 range, after the rollout of confidential perpetual trading tied to Hyperliquid. HYPE has extended toward prior highs near $90. Sentiment across Fear & Greed trackers has been sitting in Greed territory, roughly 57 to 71. Risk appetite is there. The more important question is whether this is a short-lived catalyst trade or the first clear signal that private on-chain derivatives can attract meaningful size.
What makes the setup different is the pairing. Hyperliquid has been processing on the order of $240 billion in perps volume over the prior 30 days. NEAR Intents have been generating more than $5 million in monthly fees. Confidential mode is not being launched into an empty venue. It is being attached to an engine that already has liquidity and to an L1 that has been pushing hard into AI, agents, and privacy-preserving execution.
Why the Timing Matters
Broader market tone has been willing to fund growth narratives again. That helps any strong catalyst. But the NEAR move is more specific than a generic risk-on bounce. Confidential TVL in the relevant intents and secret-mode activity has crossed about $70 million, with incentive snapshots tied to that threshold. Multi-chain deposits from more than 35 networks are active. That points to capital arriving from outside a single ecosystem rather than pure native rotation.
For pro traders, the combination of a sharp price response, rising volume, and a measurable TVL print is the kind of package that forces a decision. Either the market is front-running a durable new use case, or it is pricing a product launch too aggressively before retention is proven. Both readings are still open.
Technical and Market Structure
NEAR’s volume has been reported up around 120% with the move, which supports the idea that the advance is not just thin short-covering. Momentum is clearly strong. That also means shorter-term indicators are stretched. Moves of this speed often need either consolidation or a deeper retest before the next clean leg.
HYPE’s push toward prior all-time-high resistance after consecutive daily gains adds a second axis. If Hyperliquid’s token is firm while confidential activity on NEAR is rising, the market is treating the integration as additive rather than zero-sum. Funding and open interest on Hyperliquid have remained constructive, which suggests leverage is still engaging with the complex rather than exiting into the spike.
The practical read is straightforward. Strength with expanding volume and constructive derivatives metrics favors continuation after digestion. Strength with fading volume and rapidly elevated funding would favor a more tactical fade. So far the former description fits better than the latter, but the window after a 45% run is where that assessment can change quickly.
On-Chain and Product Reality
The $70 million confidential TVL figure is the number that separates this from pure narrative. Incentive programs can inflate short-term deposits, and that risk should not be ignored. Still, crossing a clear threshold while multi-chain deposits are active is more useful than a press release alone.
Privacy-by-default perps aim at a real friction in on-chain trading. Public mempools and transparent positioning make certain strategies harder to execute without leakage. A setup that keeps execution details shielded while still routing into a deep order book tries to solve that without forcing traders onto a fully isolated venue. That is the hybrid the market is responding to: privacy where it matters for the trader, liquidity where it matters for the fill.
Whether that hybrid holds depends on retention after incentives, fee quality, and whether larger accounts actually keep flow in confidential mode once the initial campaign window passes. Early TVL is a start. Sustained usage is the test.
Fundamentals, Risks, and Positioning
From a fundamental angle, the addressable user is not only the retail perps trader. It includes participants who want on-chain settlement and self-custody characteristics without broadcasting every aspect of their positioning. Pure L2 offerings and centralized exchanges each solve part of that problem. The NEAR–Hyperliquid combination is an attempt to sit in the middle: high-throughput settlement and confidential intents on one side, a dominant perps execution environment on the other.
Risks are clear. Product launches in crypto often produce a front-loaded price response that decays if metrics stall. Confidential systems also add operational and trust assumptions; users and institutions will care about the exact privacy guarantees, auditability, and failure modes. Correlation risk is another factor. If broader risk sentiment turns, NEAR and HYPE can both give back gains regardless of product quality.
For pro traders, the cleaner approach is to separate the catalyst from the trend. The catalyst has already been expressed in price. The trend case requires follow-through in confidential TVL, fees, and open interest without an immediate collapse in momentum. For longer-term investors, the question is whether this becomes a repeatable liquidity venue for private strategy execution or remains a one-cycle narrative premium.
Closing View
NEAR’s rally is tied to something more concrete than a vague AI or privacy story. Confidential perps, a $70 million secret-mode TVL print, multi-chain deposit activity, and Hyperliquid’s existing volume base give the move a real product anchor. HYPE’s strength alongside it suggests the market sees the pairing as complementary.
That does not make the advance low-risk. A 45% move in three days discounts a lot of good news quickly. What I'm watching from here is whether confidential activity continues to build after the first incentive checkpoints and whether price can hold a higher range without relying on continuous new headline flow. If the product keeps attracting size, the privacy-liquidity hybrid thesis gets harder to dismiss. If TVL and volume fade with the news cycle, this will look like another well-marketed catalyst that outran usage. The next few weeks of retention data will matter more than the size of the initial candle.
#Near #Hyperliquid #CryptoPrivacy #defi #bullish
$NEAR
$HYPE
What makes the setup different is the pairing. Hyperliquid has been processing on the order of $240 billion in perps volume over the prior 30 days. NEAR Intents have been generating more than $5 million in monthly fees. Confidential mode is not being launched into an empty venue. It is being attached to an engine that already has liquidity and to an L1 that has been pushing hard into AI, agents, and privacy-preserving execution.
Why the Timing Matters
Broader market tone has been willing to fund growth narratives again. That helps any strong catalyst. But the NEAR move is more specific than a generic risk-on bounce. Confidential TVL in the relevant intents and secret-mode activity has crossed about $70 million, with incentive snapshots tied to that threshold. Multi-chain deposits from more than 35 networks are active. That points to capital arriving from outside a single ecosystem rather than pure native rotation.
For pro traders, the combination of a sharp price response, rising volume, and a measurable TVL print is the kind of package that forces a decision. Either the market is front-running a durable new use case, or it is pricing a product launch too aggressively before retention is proven. Both readings are still open.
Technical and Market Structure
NEAR’s volume has been reported up around 120% with the move, which supports the idea that the advance is not just thin short-covering. Momentum is clearly strong. That also means shorter-term indicators are stretched. Moves of this speed often need either consolidation or a deeper retest before the next clean leg.
HYPE’s push toward prior all-time-high resistance after consecutive daily gains adds a second axis. If Hyperliquid’s token is firm while confidential activity on NEAR is rising, the market is treating the integration as additive rather than zero-sum. Funding and open interest on Hyperliquid have remained constructive, which suggests leverage is still engaging with the complex rather than exiting into the spike.
The practical read is straightforward. Strength with expanding volume and constructive derivatives metrics favors continuation after digestion. Strength with fading volume and rapidly elevated funding would favor a more tactical fade. So far the former description fits better than the latter, but the window after a 45% run is where that assessment can change quickly.
On-Chain and Product Reality
The $70 million confidential TVL figure is the number that separates this from pure narrative. Incentive programs can inflate short-term deposits, and that risk should not be ignored. Still, crossing a clear threshold while multi-chain deposits are active is more useful than a press release alone.
Privacy-by-default perps aim at a real friction in on-chain trading. Public mempools and transparent positioning make certain strategies harder to execute without leakage. A setup that keeps execution details shielded while still routing into a deep order book tries to solve that without forcing traders onto a fully isolated venue. That is the hybrid the market is responding to: privacy where it matters for the trader, liquidity where it matters for the fill.
Whether that hybrid holds depends on retention after incentives, fee quality, and whether larger accounts actually keep flow in confidential mode once the initial campaign window passes. Early TVL is a start. Sustained usage is the test.
Fundamentals, Risks, and Positioning
From a fundamental angle, the addressable user is not only the retail perps trader. It includes participants who want on-chain settlement and self-custody characteristics without broadcasting every aspect of their positioning. Pure L2 offerings and centralized exchanges each solve part of that problem. The NEAR–Hyperliquid combination is an attempt to sit in the middle: high-throughput settlement and confidential intents on one side, a dominant perps execution environment on the other.
Risks are clear. Product launches in crypto often produce a front-loaded price response that decays if metrics stall. Confidential systems also add operational and trust assumptions; users and institutions will care about the exact privacy guarantees, auditability, and failure modes. Correlation risk is another factor. If broader risk sentiment turns, NEAR and HYPE can both give back gains regardless of product quality.
For pro traders, the cleaner approach is to separate the catalyst from the trend. The catalyst has already been expressed in price. The trend case requires follow-through in confidential TVL, fees, and open interest without an immediate collapse in momentum. For longer-term investors, the question is whether this becomes a repeatable liquidity venue for private strategy execution or remains a one-cycle narrative premium.
Closing View
NEAR’s rally is tied to something more concrete than a vague AI or privacy story. Confidential perps, a $70 million secret-mode TVL print, multi-chain deposit activity, and Hyperliquid’s existing volume base give the move a real product anchor. HYPE’s strength alongside it suggests the market sees the pairing as complementary.
That does not make the advance low-risk. A 45% move in three days discounts a lot of good news quickly. What I'm watching from here is whether confidential activity continues to build after the first incentive checkpoints and whether price can hold a higher range without relying on continuous new headline flow. If the product keeps attracting size, the privacy-liquidity hybrid thesis gets harder to dismiss. If TVL and volume fade with the news cycle, this will look like another well-marketed catalyst that outran usage. The next few weeks of retention data will matter more than the size of the initial candle.
#Near #Hyperliquid #CryptoPrivacy #defi #bullish
$NEAR
$HYPE
365
·
--

Статья
BTC’s $81K Push Meets a Familiar Question: Inflow or Distribution?You've seen this pattern before. Price runs hard, shorts get squeezed, and then the tape starts sending mixed signals. Bitcoin reclaimed the $81,000 area with a roughly 4.6% to 5.9% move over 24 hours. Short liquidations dominated the recent totals, running into the hundreds of millions. At the same time, whale real-flow volume jumped about 71% above the seven-day average, and net exchange inflow printed near 4,999 BTC.
That combination is what makes this moment interesting. A clean short squeeze can mark the start of the next leg. It can also mark the point where larger players begin feeding supply into strength. Traders are trying to decide which version they're looking at.
Why This Setup Matters Now
Fear & Greed has been sitting in Greed territory, with readings across trackers roughly in the 57 to 71 range. Risk appetite is present. It is not extreme euphoria, but it is firm enough to support momentum trades.
The ETF side added another layer. U.S. spot Bitcoin ETFs logged about $433 million in net inflows on September 18, led by Fidelity’s FBTC at roughly $311 million and BlackRock’s IBIT at about $108 million. Ethereum ETFs also saw around $144 million in net inflows. That is real capital, not just perpetual leverage recycling itself.
What stands out is the contrast. ETF flows suggest institutional demand is still active. Exchange-bound whale flow suggests some large holders are moving coins to venues where they can be sold. Both can be true at once. The market is deciding which force is stronger in the near term.
Leverage, Funding, and the Liquidation Map
Funding rates have stayed positive, around 0.01% per interval, or roughly 11% annualized on major venues. That means longs are still paying shorts. Hyperliquid’s BTC open interest holding near $3.5 billion shows the derivatives complex remains heavily engaged.
Liquidation heatmaps have been tight around the $80,000 to $82,000 band. That helps explain the speed of the move. When price pushes into a dense cluster of short positions, the cascade can feed itself for a while. Once that fuel is spent, the next direction often depends on whether fresh demand appears or whether the market simply digests the squeeze.
Positive funding after a sharp rally is not automatically bearish. It does raise the cost of staying long and increases the chance of a sharp mean-reversion if spot demand slows. This is where things get interesting for pro traders: the same conditions that powered the squeeze can also amplify the pullback.
On-Chain: Whales, Reserves, and the Flow Signal
On-chain data shows elevated large-holder activity. Whale volume has been substantial, with reports pointing to more than 151,000 BTC in whale-related volume and thousands of transactions, including notable mega-whale activity at the 1,000 BTC and above level. Exchange reserves have been rising after a multi-day stretch of net inflows.
Rising exchange balances after a strong price advance are the classic caution flag. Coins do not move to exchanges for storage. They move there when someone wants optionality to sell. That does not guarantee immediate distribution. Some of the flow can be market-making, ETF-related inventory, or simple repositioning. Still, the direction of travel matters. Persistent net inflows into exchanges while price is elevated usually deserve more attention than the same flows during a quiet range.
The data suggests a market that is active at the top of the size distribution. Whether those whales are preparing to sell into strength or simply rotating collateral is the open question. Price action over the next several sessions will do more to answer it than any single print.
Technical Structure and Practical Levels
From a market-structure perspective, the move has the look of a liquidity sweep above recent highs, followed by a test of whether acceptance holds above the breakout zone. RSI has been pushing toward overbought territory after the short-liquidation cascade. That fits the speed of the advance. It also fits a market that may need time or a deeper retest before the next sustained leg.
The $76,000 to $78,000 region has been discussed as an area of prior order-block and support interest. If price holds higher and only dips shallowly, the squeeze-to-trend interpretation stays alive. If the market loses the post-breakout area and starts probing back toward those lower supports with rising exchange reserves, the distribution interpretation gains weight.
For pro traders, the practical implication is straightforward. The easy short-covering phase may already be behind us. From here, sizing and invalidation levels matter more than narrative. A continued grind higher with stable or declining exchange reserves would support the bullish case. A failure to hold the breakout area while whale inflows persist would argue for patience rather than chase.
Closing View
This is a classic post-squeeze decision point. ETF inflows and a reclaimed $81,000 handle show that demand has not disappeared. Net exchange inflow near 5,000 BTC and elevated whale activity show that supply is also becoming more available at these prices. Funding remains positive and open interest is still large, so leverage is still in the game.
What I'm seeing is less a clean breakout story and more a balance of forces. The market has cleared a layer of short liquidity. It has not yet proven that the next buyers are strong enough to absorb whatever large holders may offer. Until that becomes clearer, treating the rally as a completed squeeze rather than a guaranteed trend extension is the more disciplined read. The next decisive signal will likely come from the interaction between ETF flow persistence, exchange reserve direction, and whether price can hold above the zone it just reclaimed.
#BTCBreaks80K #BitcoinMarketCapTopsTesla #BTC走势分析
$BTC
{spot}(BTCUSDT)
BTC’s $81K Push Meets a Familiar Question: Inflow or Distribution?
You've seen this pattern before. Price runs hard, shorts get squeezed, and then the tape starts sending mixed signals. Bitcoin reclaimed the $81,000 area with a roughly 4.6% to 5.9% move over 24 hours. Short liquidations dominated the recent totals, running into the hundreds of millions. At the same time, whale real-flow volume jumped about 71% above the seven-day average, and net exchange inflow printed near 4,999 BTC.
That combination is what makes this moment interesting. A clean short squeeze can mark the start of the next leg. It can also mark the point where larger players begin feeding supply into strength. Traders are trying to decide which version they're looking at.
Why This Setup Matters Now
Fear & Greed has been sitting in Greed territory, with readings across trackers roughly in the 57 to 71 range. Risk appetite is present. It is not extreme euphoria, but it is firm enough to support momentum trades.
The ETF side added another layer. U.S. spot Bitcoin ETFs logged about $433 million in net inflows on September 18, led by Fidelity’s FBTC at roughly $311 million and BlackRock’s IBIT at about $108 million. Ethereum ETFs also saw around $144 million in net inflows. That is real capital, not just perpetual leverage recycling itself.
What stands out is the contrast. ETF flows suggest institutional demand is still active. Exchange-bound whale flow suggests some large holders are moving coins to venues where they can be sold. Both can be true at once. The market is deciding which force is stronger in the near term.
Leverage, Funding, and the Liquidation Map
Funding rates have stayed positive, around 0.01% per interval, or roughly 11% annualized on major venues. That means longs are still paying shorts. Hyperliquid’s BTC open interest holding near $3.5 billion shows the derivatives complex remains heavily engaged.
Liquidation heatmaps have been tight around the $80,000 to $82,000 band. That helps explain the speed of the move. When price pushes into a dense cluster of short positions, the cascade can feed itself for a while. Once that fuel is spent, the next direction often depends on whether fresh demand appears or whether the market simply digests the squeeze.
Positive funding after a sharp rally is not automatically bearish. It does raise the cost of staying long and increases the chance of a sharp mean-reversion if spot demand slows. This is where things get interesting for pro traders: the same conditions that powered the squeeze can also amplify the pullback.
On-Chain: Whales, Reserves, and the Flow Signal
On-chain data shows elevated large-holder activity. Whale volume has been substantial, with reports pointing to more than 151,000 BTC in whale-related volume and thousands of transactions, including notable mega-whale activity at the 1,000 BTC and above level. Exchange reserves have been rising after a multi-day stretch of net inflows.
Rising exchange balances after a strong price advance are the classic caution flag. Coins do not move to exchanges for storage. They move there when someone wants optionality to sell. That does not guarantee immediate distribution. Some of the flow can be market-making, ETF-related inventory, or simple repositioning. Still, the direction of travel matters. Persistent net inflows into exchanges while price is elevated usually deserve more attention than the same flows during a quiet range.
The data suggests a market that is active at the top of the size distribution. Whether those whales are preparing to sell into strength or simply rotating collateral is the open question. Price action over the next several sessions will do more to answer it than any single print.
Technical Structure and Practical Levels
From a market-structure perspective, the move has the look of a liquidity sweep above recent highs, followed by a test of whether acceptance holds above the breakout zone. RSI has been pushing toward overbought territory after the short-liquidation cascade. That fits the speed of the advance. It also fits a market that may need time or a deeper retest before the next sustained leg.
The $76,000 to $78,000 region has been discussed as an area of prior order-block and support interest. If price holds higher and only dips shallowly, the squeeze-to-trend interpretation stays alive. If the market loses the post-breakout area and starts probing back toward those lower supports with rising exchange reserves, the distribution interpretation gains weight.
For pro traders, the practical implication is straightforward. The easy short-covering phase may already be behind us. From here, sizing and invalidation levels matter more than narrative. A continued grind higher with stable or declining exchange reserves would support the bullish case. A failure to hold the breakout area while whale inflows persist would argue for patience rather than chase.
Closing View
This is a classic post-squeeze decision point. ETF inflows and a reclaimed $81,000 handle show that demand has not disappeared. Net exchange inflow near 5,000 BTC and elevated whale activity show that supply is also becoming more available at these prices. Funding remains positive and open interest is still large, so leverage is still in the game.
What I'm seeing is less a clean breakout story and more a balance of forces. The market has cleared a layer of short liquidity. It has not yet proven that the next buyers are strong enough to absorb whatever large holders may offer. Until that becomes clearer, treating the rally as a completed squeeze rather than a guaranteed trend extension is the more disciplined read. The next decisive signal will likely come from the interaction between ETF flow persistence, exchange reserve direction, and whether price can hold above the zone it just reclaimed.
#BTCBreaks80K #BitcoinMarketCapTopsTesla #BTC走势分析
$BTC
That combination is what makes this moment interesting. A clean short squeeze can mark the start of the next leg. It can also mark the point where larger players begin feeding supply into strength. Traders are trying to decide which version they're looking at.
Why This Setup Matters Now
Fear & Greed has been sitting in Greed territory, with readings across trackers roughly in the 57 to 71 range. Risk appetite is present. It is not extreme euphoria, but it is firm enough to support momentum trades.
The ETF side added another layer. U.S. spot Bitcoin ETFs logged about $433 million in net inflows on September 18, led by Fidelity’s FBTC at roughly $311 million and BlackRock’s IBIT at about $108 million. Ethereum ETFs also saw around $144 million in net inflows. That is real capital, not just perpetual leverage recycling itself.
What stands out is the contrast. ETF flows suggest institutional demand is still active. Exchange-bound whale flow suggests some large holders are moving coins to venues where they can be sold. Both can be true at once. The market is deciding which force is stronger in the near term.
Leverage, Funding, and the Liquidation Map
Funding rates have stayed positive, around 0.01% per interval, or roughly 11% annualized on major venues. That means longs are still paying shorts. Hyperliquid’s BTC open interest holding near $3.5 billion shows the derivatives complex remains heavily engaged.
Liquidation heatmaps have been tight around the $80,000 to $82,000 band. That helps explain the speed of the move. When price pushes into a dense cluster of short positions, the cascade can feed itself for a while. Once that fuel is spent, the next direction often depends on whether fresh demand appears or whether the market simply digests the squeeze.
Positive funding after a sharp rally is not automatically bearish. It does raise the cost of staying long and increases the chance of a sharp mean-reversion if spot demand slows. This is where things get interesting for pro traders: the same conditions that powered the squeeze can also amplify the pullback.
On-Chain: Whales, Reserves, and the Flow Signal
On-chain data shows elevated large-holder activity. Whale volume has been substantial, with reports pointing to more than 151,000 BTC in whale-related volume and thousands of transactions, including notable mega-whale activity at the 1,000 BTC and above level. Exchange reserves have been rising after a multi-day stretch of net inflows.
Rising exchange balances after a strong price advance are the classic caution flag. Coins do not move to exchanges for storage. They move there when someone wants optionality to sell. That does not guarantee immediate distribution. Some of the flow can be market-making, ETF-related inventory, or simple repositioning. Still, the direction of travel matters. Persistent net inflows into exchanges while price is elevated usually deserve more attention than the same flows during a quiet range.
The data suggests a market that is active at the top of the size distribution. Whether those whales are preparing to sell into strength or simply rotating collateral is the open question. Price action over the next several sessions will do more to answer it than any single print.
Technical Structure and Practical Levels
From a market-structure perspective, the move has the look of a liquidity sweep above recent highs, followed by a test of whether acceptance holds above the breakout zone. RSI has been pushing toward overbought territory after the short-liquidation cascade. That fits the speed of the advance. It also fits a market that may need time or a deeper retest before the next sustained leg.
The $76,000 to $78,000 region has been discussed as an area of prior order-block and support interest. If price holds higher and only dips shallowly, the squeeze-to-trend interpretation stays alive. If the market loses the post-breakout area and starts probing back toward those lower supports with rising exchange reserves, the distribution interpretation gains weight.
For pro traders, the practical implication is straightforward. The easy short-covering phase may already be behind us. From here, sizing and invalidation levels matter more than narrative. A continued grind higher with stable or declining exchange reserves would support the bullish case. A failure to hold the breakout area while whale inflows persist would argue for patience rather than chase.
Closing View
This is a classic post-squeeze decision point. ETF inflows and a reclaimed $81,000 handle show that demand has not disappeared. Net exchange inflow near 5,000 BTC and elevated whale activity show that supply is also becoming more available at these prices. Funding remains positive and open interest is still large, so leverage is still in the game.
What I'm seeing is less a clean breakout story and more a balance of forces. The market has cleared a layer of short liquidity. It has not yet proven that the next buyers are strong enough to absorb whatever large holders may offer. Until that becomes clearer, treating the rally as a completed squeeze rather than a guaranteed trend extension is the more disciplined read. The next decisive signal will likely come from the interaction between ETF flow persistence, exchange reserve direction, and whether price can hold above the zone it just reclaimed.
#BTCBreaks80K #BitcoinMarketCapTopsTesla #BTC走势分析
$BTC
266
·
--

Статья
AI Tokens Find Bid as Compute Narrative Regains TractionYou've probably noticed the rotation. While much of the market has been choppy, a cluster of AI-linked and DePIN names has quietly pushed higher. The sector added roughly $1.6 billion in market value, taking the AI token complex toward $18.6 billion. NEAR led with a gain of about 20.8%. RENDER advanced around 10%. Broader AI and DePIN names rose between 5% and 9%.
Fear & Greed sitting near 57 helps explain the tone. Risk appetite is present without being euphoric. That is usually the window where capital tests growth narratives instead of chasing pure momentum. The question is whether this move is just another narrative bounce or whether it is starting to track something more durable: real demand for decentralized compute.
Why This Matters Now
What stands out is the combination of price and a few concrete signals. Confidential TVL on NEAR has moved past $70 million. That is not speculative volume; it is capital sitting inside privacy-preserving applications on a chain that has spent years positioning itself for AI and agentic workloads. At the same time, the market keeps returning to the same bottleneck: high-quality GPU capacity remains scarce and expensive.
DePIN projects that can coordinate real hardware and pay node operators in a transparent way sit at the intersection of those two forces. Traders are treating the latest strength as more than a meme rotation. They are treating it as an early read on whether decentralized compute can capture a slice of institutional and commercial demand that used to flow only to centralized cloud providers.
Funding rates and open interest in AI perpetual markets have expanded with the move. That tells you leverage is participating. It also tells you the move is no longer purely spot-driven. When OI rises alongside price, the next leg usually depends on whether new buyers keep showing up or whether the trade becomes crowded and mean-reverts.
Technical and On-Chain Picture
NEAR and RENDER both show RSI readings that are approaching overbought territory on shorter timeframes. That does not automatically mean the move is over. It does mean the easy part of the rally may be behind us. Order-block and prior-breakout retests become more important from here. If those zones hold on pullbacks, the structure stays constructive. If they fail quickly, the advance starts to look like a squeeze rather than a trend.
On-chain, the more interesting data is not just price. Active addresses in several GPU and compute-related tokens have risen. There are signs of whale accumulation in names tied to rendering and decentralized infrastructure. In DePIN networks, supply dynamics often favor longer-term holders when node growth and real usage increase, because emissions and rewards are at least partially tied to actual work rather than pure inflation. That does not remove drawdown risk. It does change the quality of the buyer.
What I'm watching closely is whether rising activity is concentrated in a few large wallets or whether it is broadening. Speculative runs often look the same on the surface. Sustainable ones usually show wider participation over time.
Fundamentals and Tokenomics Angle
The core claim behind this complex is straightforward. AI training and inference need compute. Centralized providers dominate today, but cost, availability, and, increasingly, concerns around control and data handling create room for alternatives. Decentralized physical infrastructure networks try to turn idle or distributed hardware into a market. Tokens sit in the middle as coordination and incentive layers.
NEAR's positioning around confidential computing and AI agents gives it a different flavor from pure GPU marketplaces. RENDER and similar names are more directly exposed to rendering and compute supply. The sector-wide bid suggests the market is not picking a single winner yet. It is re-rating the category.
Tokenomics still matter. High emissions without corresponding demand for the service can cap upside even when the narrative is strong. Networks that can show rising node counts, utilization, and fee or reward flows tied to real workloads have a clearer path. Those that only offer exposure to the AI story without usage metrics will likely lag once the initial rotation fades.
Risks, Opportunities, and Practical Implications
The main risk is obvious. AI and DePIN have already delivered several narrative-driven rallies that faded when usage did not follow price. Overbought technicals, rising leverage, and a still-moderate Fear & Greed reading leave room for a sharp pullback if broader risk sentiment turns or if the next wave of catalysts disappoints.
There is also concentration risk. A handful of names can dominate sector performance. When they correct, the entire basket often moves with them.
The opportunity sits on the other side of that. If institutional and commercial demand for decentralized or hybrid compute continues to grow, the tokens that sit closest to real hardware and real workloads can re-rate on fundamentals rather than pure narrative. For pro traders, that means treating strength as a signal to manage risk around technical levels and funding, not as a reason to abandon sizing discipline. For longer-term investors, it means separating projects with measurable network activity from those that mainly offer thematic exposure.
One practical approach is to watch three things together: price structure on pullbacks, on-chain activity and whale behavior, and any hard metrics around TVL, node growth, or compute utilization. When all three align, the case is stronger. When only price is rising, caution is warranted.
Closing View
This rally is real in market terms. AI-linked tokens have taken meaningful capital and attention. NEAR's relative strength and the confidential TVL print give the move more texture than a pure meme rotation. At the same time, the sector has a history of running ahead of adoption.
What the data suggests right now is a market willing to pay for exposure to decentralized compute while the broader tone remains risk-on but not euphoric. Whether that payment proves justified depends on the next set of usage and infrastructure signals, not on the size of the latest percentage move. The interesting phase is the one that comes after the easy bid—when the market has to decide which projects are still priced for narrative and which ones are starting to be priced for work.
#AI #DePIN #Near #crypto #DecentralizedCompute
AI Tokens Find Bid as Compute Narrative Regains Traction
You've probably noticed the rotation. While much of the market has been choppy, a cluster of AI-linked and DePIN names has quietly pushed higher. The sector added roughly $1.6 billion in market value, taking the AI token complex toward $18.6 billion. NEAR led with a gain of about 20.8%. RENDER advanced around 10%. Broader AI and DePIN names rose between 5% and 9%.
Fear & Greed sitting near 57 helps explain the tone. Risk appetite is present without being euphoric. That is usually the window where capital tests growth narratives instead of chasing pure momentum. The question is whether this move is just another narrative bounce or whether it is starting to track something more durable: real demand for decentralized compute.
Why This Matters Now
What stands out is the combination of price and a few concrete signals. Confidential TVL on NEAR has moved past $70 million. That is not speculative volume; it is capital sitting inside privacy-preserving applications on a chain that has spent years positioning itself for AI and agentic workloads. At the same time, the market keeps returning to the same bottleneck: high-quality GPU capacity remains scarce and expensive.
DePIN projects that can coordinate real hardware and pay node operators in a transparent way sit at the intersection of those two forces. Traders are treating the latest strength as more than a meme rotation. They are treating it as an early read on whether decentralized compute can capture a slice of institutional and commercial demand that used to flow only to centralized cloud providers.
Funding rates and open interest in AI perpetual markets have expanded with the move. That tells you leverage is participating. It also tells you the move is no longer purely spot-driven. When OI rises alongside price, the next leg usually depends on whether new buyers keep showing up or whether the trade becomes crowded and mean-reverts.
Technical and On-Chain Picture
NEAR and RENDER both show RSI readings that are approaching overbought territory on shorter timeframes. That does not automatically mean the move is over. It does mean the easy part of the rally may be behind us. Order-block and prior-breakout retests become more important from here. If those zones hold on pullbacks, the structure stays constructive. If they fail quickly, the advance starts to look like a squeeze rather than a trend.
On-chain, the more interesting data is not just price. Active addresses in several GPU and compute-related tokens have risen. There are signs of whale accumulation in names tied to rendering and decentralized infrastructure. In DePIN networks, supply dynamics often favor longer-term holders when node growth and real usage increase, because emissions and rewards are at least partially tied to actual work rather than pure inflation. That does not remove drawdown risk. It does change the quality of the buyer.
What I'm watching closely is whether rising activity is concentrated in a few large wallets or whether it is broadening. Speculative runs often look the same on the surface. Sustainable ones usually show wider participation over time.
Fundamentals and Tokenomics Angle
The core claim behind this complex is straightforward. AI training and inference need compute. Centralized providers dominate today, but cost, availability, and, increasingly, concerns around control and data handling create room for alternatives. Decentralized physical infrastructure networks try to turn idle or distributed hardware into a market. Tokens sit in the middle as coordination and incentive layers.
NEAR's positioning around confidential computing and AI agents gives it a different flavor from pure GPU marketplaces. RENDER and similar names are more directly exposed to rendering and compute supply. The sector-wide bid suggests the market is not picking a single winner yet. It is re-rating the category.
Tokenomics still matter. High emissions without corresponding demand for the service can cap upside even when the narrative is strong. Networks that can show rising node counts, utilization, and fee or reward flows tied to real workloads have a clearer path. Those that only offer exposure to the AI story without usage metrics will likely lag once the initial rotation fades.
Risks, Opportunities, and Practical Implications
The main risk is obvious. AI and DePIN have already delivered several narrative-driven rallies that faded when usage did not follow price. Overbought technicals, rising leverage, and a still-moderate Fear & Greed reading leave room for a sharp pullback if broader risk sentiment turns or if the next wave of catalysts disappoints.
There is also concentration risk. A handful of names can dominate sector performance. When they correct, the entire basket often moves with them.
The opportunity sits on the other side of that. If institutional and commercial demand for decentralized or hybrid compute continues to grow, the tokens that sit closest to real hardware and real workloads can re-rate on fundamentals rather than pure narrative. For pro traders, that means treating strength as a signal to manage risk around technical levels and funding, not as a reason to abandon sizing discipline. For longer-term investors, it means separating projects with measurable network activity from those that mainly offer thematic exposure.
One practical approach is to watch three things together: price structure on pullbacks, on-chain activity and whale behavior, and any hard metrics around TVL, node growth, or compute utilization. When all three align, the case is stronger. When only price is rising, caution is warranted.
Closing View
This rally is real in market terms. AI-linked tokens have taken meaningful capital and attention. NEAR's relative strength and the confidential TVL print give the move more texture than a pure meme rotation. At the same time, the sector has a history of running ahead of adoption.
What the data suggests right now is a market willing to pay for exposure to decentralized compute while the broader tone remains risk-on but not euphoric. Whether that payment proves justified depends on the next set of usage and infrastructure signals, not on the size of the latest percentage move. The interesting phase is the one that comes after the easy bid—when the market has to decide which projects are still priced for narrative and which ones are starting to be priced for work.
#AI #DePIN #Near #crypto #DecentralizedCompute
Fear & Greed sitting near 57 helps explain the tone. Risk appetite is present without being euphoric. That is usually the window where capital tests growth narratives instead of chasing pure momentum. The question is whether this move is just another narrative bounce or whether it is starting to track something more durable: real demand for decentralized compute.
Why This Matters Now
What stands out is the combination of price and a few concrete signals. Confidential TVL on NEAR has moved past $70 million. That is not speculative volume; it is capital sitting inside privacy-preserving applications on a chain that has spent years positioning itself for AI and agentic workloads. At the same time, the market keeps returning to the same bottleneck: high-quality GPU capacity remains scarce and expensive.
DePIN projects that can coordinate real hardware and pay node operators in a transparent way sit at the intersection of those two forces. Traders are treating the latest strength as more than a meme rotation. They are treating it as an early read on whether decentralized compute can capture a slice of institutional and commercial demand that used to flow only to centralized cloud providers.
Funding rates and open interest in AI perpetual markets have expanded with the move. That tells you leverage is participating. It also tells you the move is no longer purely spot-driven. When OI rises alongside price, the next leg usually depends on whether new buyers keep showing up or whether the trade becomes crowded and mean-reverts.
Technical and On-Chain Picture
NEAR and RENDER both show RSI readings that are approaching overbought territory on shorter timeframes. That does not automatically mean the move is over. It does mean the easy part of the rally may be behind us. Order-block and prior-breakout retests become more important from here. If those zones hold on pullbacks, the structure stays constructive. If they fail quickly, the advance starts to look like a squeeze rather than a trend.
On-chain, the more interesting data is not just price. Active addresses in several GPU and compute-related tokens have risen. There are signs of whale accumulation in names tied to rendering and decentralized infrastructure. In DePIN networks, supply dynamics often favor longer-term holders when node growth and real usage increase, because emissions and rewards are at least partially tied to actual work rather than pure inflation. That does not remove drawdown risk. It does change the quality of the buyer.
What I'm watching closely is whether rising activity is concentrated in a few large wallets or whether it is broadening. Speculative runs often look the same on the surface. Sustainable ones usually show wider participation over time.
Fundamentals and Tokenomics Angle
The core claim behind this complex is straightforward. AI training and inference need compute. Centralized providers dominate today, but cost, availability, and, increasingly, concerns around control and data handling create room for alternatives. Decentralized physical infrastructure networks try to turn idle or distributed hardware into a market. Tokens sit in the middle as coordination and incentive layers.
NEAR's positioning around confidential computing and AI agents gives it a different flavor from pure GPU marketplaces. RENDER and similar names are more directly exposed to rendering and compute supply. The sector-wide bid suggests the market is not picking a single winner yet. It is re-rating the category.
Tokenomics still matter. High emissions without corresponding demand for the service can cap upside even when the narrative is strong. Networks that can show rising node counts, utilization, and fee or reward flows tied to real workloads have a clearer path. Those that only offer exposure to the AI story without usage metrics will likely lag once the initial rotation fades.
Risks, Opportunities, and Practical Implications
The main risk is obvious. AI and DePIN have already delivered several narrative-driven rallies that faded when usage did not follow price. Overbought technicals, rising leverage, and a still-moderate Fear & Greed reading leave room for a sharp pullback if broader risk sentiment turns or if the next wave of catalysts disappoints.
There is also concentration risk. A handful of names can dominate sector performance. When they correct, the entire basket often moves with them.
The opportunity sits on the other side of that. If institutional and commercial demand for decentralized or hybrid compute continues to grow, the tokens that sit closest to real hardware and real workloads can re-rate on fundamentals rather than pure narrative. For pro traders, that means treating strength as a signal to manage risk around technical levels and funding, not as a reason to abandon sizing discipline. For longer-term investors, it means separating projects with measurable network activity from those that mainly offer thematic exposure.
One practical approach is to watch three things together: price structure on pullbacks, on-chain activity and whale behavior, and any hard metrics around TVL, node growth, or compute utilization. When all three align, the case is stronger. When only price is rising, caution is warranted.
Closing View
This rally is real in market terms. AI-linked tokens have taken meaningful capital and attention. NEAR's relative strength and the confidential TVL print give the move more texture than a pure meme rotation. At the same time, the sector has a history of running ahead of adoption.
What the data suggests right now is a market willing to pay for exposure to decentralized compute while the broader tone remains risk-on but not euphoric. Whether that payment proves justified depends on the next set of usage and infrastructure signals, not on the size of the latest percentage move. The interesting phase is the one that comes after the easy bid—when the market has to decide which projects are still priced for narrative and which ones are starting to be priced for work.
#AI #DePIN #Near #crypto #DecentralizedCompute
444
·
--
Статья
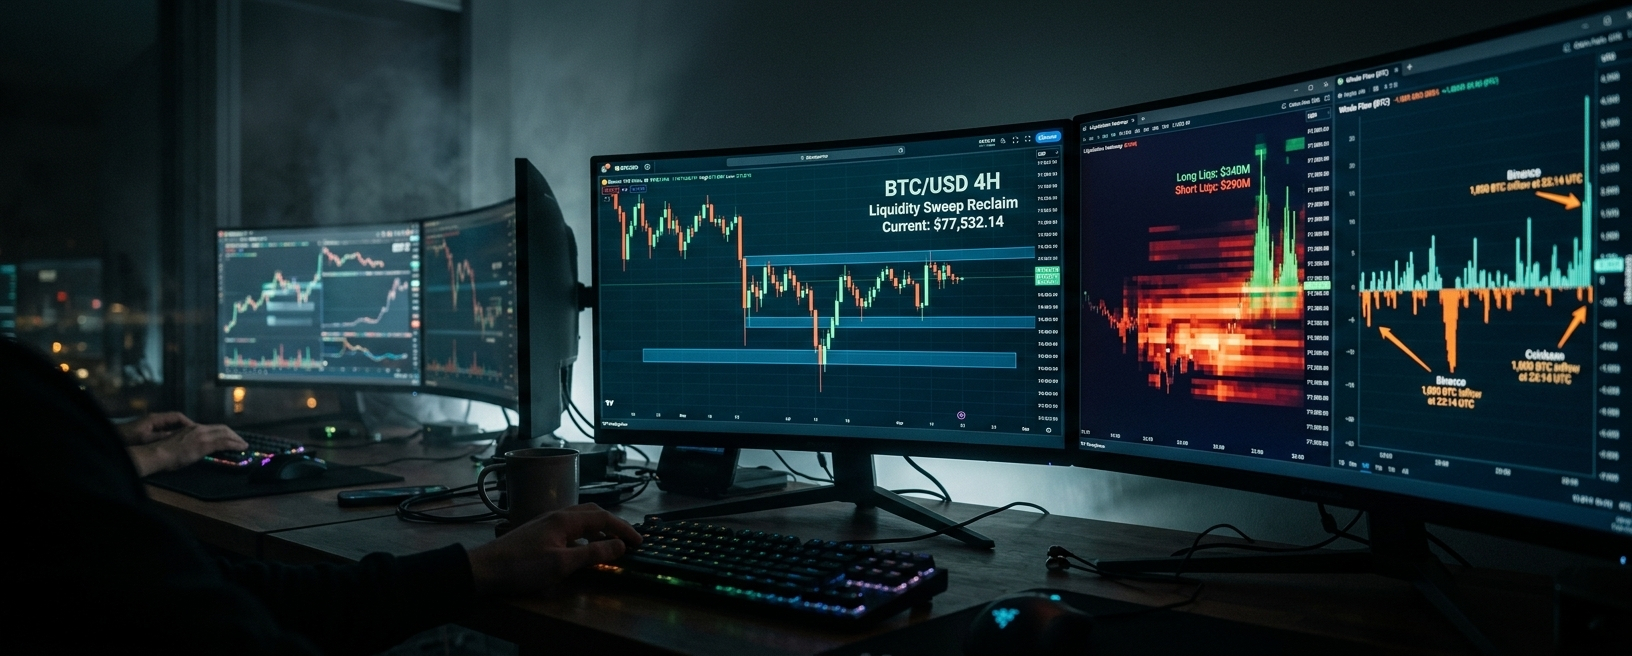
BTC Holds $77.7K Amid Whale Distribution SignalsYou've probably watched Bitcoin grind higher over the past day and felt that familiar mix of relief and suspicion. Price is sitting near $77,500–$77,750, up roughly 1.6% in 24 hours, after sweeping lower levels and reclaiming them. The move looks constructive on the surface. Yet the tape underneath tells a more complicated story one that serious traders are already pricing into their range models rather than treating as a clean breakout.
The problem right now isn't whether BTC can hold this level. It's whether the short-heavy liquidation cascade and simultaneous whale distribution are setting the boundaries of the next multi-week range. That interaction matters more than any single green candle.
Why Now
The Crypto Fear & Greed Index sits at 57, firmly in the greed zone according to Coinglass, and up six points from the prior reading. That mild shift toward optimism tracks with recent rate expectations and the bounce off the lows. Still, it feels cautious rather than euphoric. Average readings over the past week and month remain higher, so the current print is more of a reversion than a new peak in sentiment.
On the derivatives side, the 24-hour liquidation total reached $426 million, with $339 million in shorts versus just $87 million in longs. That imbalance is hard to ignore. Shorts got squeezed hard, yet funding rates on BTC perps remain only mildly positive—around 0.008%. Open interest has shifted but hasn't exploded higher in a way that screams aggressive long crowding.
Meanwhile, on-chain data shows elevated whale volume and net exchange inflows of several thousand BTC across recent sessions. Exchange reserves are mixed: some accumulation elsewhere, but the flow into venues is the clearest signal of potential distribution pressure. These aren't the quiet, patient transfers of long-term holders. They're the kind of moves that often precede range definition after a liquidity event.
What stands out to me is how cleanly the price action fits the post-sweep narrative. Liquidity was taken below recent lows, then reclaimed. That is classic SMC/ICT behavior. Order blocks near $77K are now the level everyone is watching for defense or failure.
Technical & On-Chain View: Range Boundaries Forming
The technical picture is less about continuation and more about the edges of the box. After the liquidity sweep and reclaim, price is consolidating right into the zone where order blocks and prior demand sit. Funding remaining only slightly positive suggests the market hasn't fully flipped to aggressive long bias yet. That leaves room for either a measured squeeze higher or a fade back into the range if the inflows keep coming.
On-chain, the elevated whale volume combined with net exchange inflows is the sharper signal. When large holders move size onto venues while shorts are already being flushed, it often marks the transition from forced selling/buying into deliberate positioning. Exchange reserves showing mixed accumulation doesn't contradict this it simply means not every large wallet is distributing at the same pace. The net flow still leans distribution.
I've seen this setup before. Short liquidations clear the path, but whale inflows define how far the path actually goes. Right now the data points to the $77K area acting as a pivot rather than a springboard. If price holds and absorbs the inflows without breaking lower, the upper range boundary becomes the next focus. If the inflows accelerate and funding turns more positive too quickly, the risk of a sharp rejection rises.
The Macro and Supply Context Most Traders Are Underweighting
Bitcoin's circulating supply sits near 20.08 million, with the remaining issuance schedule still tightly constrained. That long-term scarcity narrative hasn't changed. What has changed is the short-term supply hitting the market through exchange inflows. Several thousand BTC moving toward venues in a short window is not massive relative to total float, but it is meaningful when layered on top of a short-liquidation flush.
ETF flows and broader institutional positioning aren't screaming panic, yet they also aren't providing the kind of relentless bid that would absorb distribution without friction. The result is a market that can grind higher on residual short covering while still feeling the weight of whale supply. This is the environment where ranges form rather than trends extend cleanly.
The data suggests the current price action is less a conviction-driven rally and more a liquidity-driven rebalancing. That distinction matters for position sizing.
Risks, Opportunities & What Traders Should Actually Watch
The primary risk is straightforward: continued net exchange inflows from whales while funding stays positive can create a classic distribution-into-strength scenario. Shorts have already paid a heavy price. If new longs pile in chasing the reclaim without absorption of the on-chain supply, the next move lower can be sharp once the squeeze exhausts.
The opportunity sits in the opposite direction but only if the $77K order block holds and the inflows slow. In that case the short-heavy liquidation event leaves the market with relatively cleaner positioning for a measured push higher. Higher-timeframe squeeze setups remain possible precisely because so much short leverage was removed.
Practical implications for pro traders are narrow and specific:
Monitor order blocks and the speed of reclaim attempts around $77K.
Track funding rates closely any rapid move above the current mild positive levels increases squeeze risk but also rejection risk.
Watch net exchange flow and whale volume as the real-time filter for whether distribution is intensifying or fading.
Treat the recent liquidation imbalance as a one-time event rather than a perpetual bullish catalyst.
This is where things get interesting. The market is giving clear signals on both the derivatives and on-chain sides. They just happen to be pointing in slightly different directions. That tension is exactly what defines range boundaries.
The balanced takeaway is simple. Bitcoin is holding the $77.7K zone after a classic liquidity sweep and short flush. Whale distribution pressure is real and visible in the exchange inflows. Funding remains only mildly positive, and sentiment has shifted into cautious greed rather than euphoria. The next range is more likely to be defined by how these forces interact than by any clean breakout narrative. Stay focused on the data that is actually moving order blocks, net flows, and funding rather than the story the green candles want to tell. That approach has kept more accounts intact through similar post-liquidation environments than any prediction ever has.
#Bitcoin #cryptotrading #Liquidations #CryptoMarket #TechnicalAnalysis
$BTC
{spot}(BTCUSDT)
BTC Holds $77.7K Amid Whale Distribution Signals
You've probably watched Bitcoin grind higher over the past day and felt that familiar mix of relief and suspicion. Price is sitting near $77,500–$77,750, up roughly 1.6% in 24 hours, after sweeping lower levels and reclaiming them. The move looks constructive on the surface. Yet the tape underneath tells a more complicated story one that serious traders are already pricing into their range models rather than treating as a clean breakout.
The problem right now isn't whether BTC can hold this level. It's whether the short-heavy liquidation cascade and simultaneous whale distribution are setting the boundaries of the next multi-week range. That interaction matters more than any single green candle.
Why Now
The Crypto Fear & Greed Index sits at 57, firmly in the greed zone according to Coinglass, and up six points from the prior reading. That mild shift toward optimism tracks with recent rate expectations and the bounce off the lows. Still, it feels cautious rather than euphoric. Average readings over the past week and month remain higher, so the current print is more of a reversion than a new peak in sentiment.
On the derivatives side, the 24-hour liquidation total reached $426 million, with $339 million in shorts versus just $87 million in longs. That imbalance is hard to ignore. Shorts got squeezed hard, yet funding rates on BTC perps remain only mildly positive—around 0.008%. Open interest has shifted but hasn't exploded higher in a way that screams aggressive long crowding.
Meanwhile, on-chain data shows elevated whale volume and net exchange inflows of several thousand BTC across recent sessions. Exchange reserves are mixed: some accumulation elsewhere, but the flow into venues is the clearest signal of potential distribution pressure. These aren't the quiet, patient transfers of long-term holders. They're the kind of moves that often precede range definition after a liquidity event.
What stands out to me is how cleanly the price action fits the post-sweep narrative. Liquidity was taken below recent lows, then reclaimed. That is classic SMC/ICT behavior. Order blocks near $77K are now the level everyone is watching for defense or failure.
Technical & On-Chain View: Range Boundaries Forming
The technical picture is less about continuation and more about the edges of the box. After the liquidity sweep and reclaim, price is consolidating right into the zone where order blocks and prior demand sit. Funding remaining only slightly positive suggests the market hasn't fully flipped to aggressive long bias yet. That leaves room for either a measured squeeze higher or a fade back into the range if the inflows keep coming.
On-chain, the elevated whale volume combined with net exchange inflows is the sharper signal. When large holders move size onto venues while shorts are already being flushed, it often marks the transition from forced selling/buying into deliberate positioning. Exchange reserves showing mixed accumulation doesn't contradict this it simply means not every large wallet is distributing at the same pace. The net flow still leans distribution.
I've seen this setup before. Short liquidations clear the path, but whale inflows define how far the path actually goes. Right now the data points to the $77K area acting as a pivot rather than a springboard. If price holds and absorbs the inflows without breaking lower, the upper range boundary becomes the next focus. If the inflows accelerate and funding turns more positive too quickly, the risk of a sharp rejection rises.
The Macro and Supply Context Most Traders Are Underweighting
Bitcoin's circulating supply sits near 20.08 million, with the remaining issuance schedule still tightly constrained. That long-term scarcity narrative hasn't changed. What has changed is the short-term supply hitting the market through exchange inflows. Several thousand BTC moving toward venues in a short window is not massive relative to total float, but it is meaningful when layered on top of a short-liquidation flush.
ETF flows and broader institutional positioning aren't screaming panic, yet they also aren't providing the kind of relentless bid that would absorb distribution without friction. The result is a market that can grind higher on residual short covering while still feeling the weight of whale supply. This is the environment where ranges form rather than trends extend cleanly.
The data suggests the current price action is less a conviction-driven rally and more a liquidity-driven rebalancing. That distinction matters for position sizing.
Risks, Opportunities & What Traders Should Actually Watch
The primary risk is straightforward: continued net exchange inflows from whales while funding stays positive can create a classic distribution-into-strength scenario. Shorts have already paid a heavy price. If new longs pile in chasing the reclaim without absorption of the on-chain supply, the next move lower can be sharp once the squeeze exhausts.
The opportunity sits in the opposite direction but only if the $77K order block holds and the inflows slow. In that case the short-heavy liquidation event leaves the market with relatively cleaner positioning for a measured push higher. Higher-timeframe squeeze setups remain possible precisely because so much short leverage was removed.
Practical implications for pro traders are narrow and specific:
Monitor order blocks and the speed of reclaim attempts around $77K.
Track funding rates closely any rapid move above the current mild positive levels increases squeeze risk but also rejection risk.
Watch net exchange flow and whale volume as the real-time filter for whether distribution is intensifying or fading.
Treat the recent liquidation imbalance as a one-time event rather than a perpetual bullish catalyst.
This is where things get interesting. The market is giving clear signals on both the derivatives and on-chain sides. They just happen to be pointing in slightly different directions. That tension is exactly what defines range boundaries.
The balanced takeaway is simple. Bitcoin is holding the $77.7K zone after a classic liquidity sweep and short flush. Whale distribution pressure is real and visible in the exchange inflows. Funding remains only mildly positive, and sentiment has shifted into cautious greed rather than euphoria. The next range is more likely to be defined by how these forces interact than by any clean breakout narrative. Stay focused on the data that is actually moving order blocks, net flows, and funding rather than the story the green candles want to tell. That approach has kept more accounts intact through similar post-liquidation environments than any prediction ever has.
#Bitcoin #cryptotrading #Liquidations #CryptoMarket #TechnicalAnalysis
$BTC
The problem right now isn't whether BTC can hold this level. It's whether the short-heavy liquidation cascade and simultaneous whale distribution are setting the boundaries of the next multi-week range. That interaction matters more than any single green candle.
Why Now
The Crypto Fear & Greed Index sits at 57, firmly in the greed zone according to Coinglass, and up six points from the prior reading. That mild shift toward optimism tracks with recent rate expectations and the bounce off the lows. Still, it feels cautious rather than euphoric. Average readings over the past week and month remain higher, so the current print is more of a reversion than a new peak in sentiment.
On the derivatives side, the 24-hour liquidation total reached $426 million, with $339 million in shorts versus just $87 million in longs. That imbalance is hard to ignore. Shorts got squeezed hard, yet funding rates on BTC perps remain only mildly positive—around 0.008%. Open interest has shifted but hasn't exploded higher in a way that screams aggressive long crowding.
Meanwhile, on-chain data shows elevated whale volume and net exchange inflows of several thousand BTC across recent sessions. Exchange reserves are mixed: some accumulation elsewhere, but the flow into venues is the clearest signal of potential distribution pressure. These aren't the quiet, patient transfers of long-term holders. They're the kind of moves that often precede range definition after a liquidity event.
What stands out to me is how cleanly the price action fits the post-sweep narrative. Liquidity was taken below recent lows, then reclaimed. That is classic SMC/ICT behavior. Order blocks near $77K are now the level everyone is watching for defense or failure.
Technical & On-Chain View: Range Boundaries Forming
The technical picture is less about continuation and more about the edges of the box. After the liquidity sweep and reclaim, price is consolidating right into the zone where order blocks and prior demand sit. Funding remaining only slightly positive suggests the market hasn't fully flipped to aggressive long bias yet. That leaves room for either a measured squeeze higher or a fade back into the range if the inflows keep coming.
On-chain, the elevated whale volume combined with net exchange inflows is the sharper signal. When large holders move size onto venues while shorts are already being flushed, it often marks the transition from forced selling/buying into deliberate positioning. Exchange reserves showing mixed accumulation doesn't contradict this it simply means not every large wallet is distributing at the same pace. The net flow still leans distribution.
I've seen this setup before. Short liquidations clear the path, but whale inflows define how far the path actually goes. Right now the data points to the $77K area acting as a pivot rather than a springboard. If price holds and absorbs the inflows without breaking lower, the upper range boundary becomes the next focus. If the inflows accelerate and funding turns more positive too quickly, the risk of a sharp rejection rises.
The Macro and Supply Context Most Traders Are Underweighting
Bitcoin's circulating supply sits near 20.08 million, with the remaining issuance schedule still tightly constrained. That long-term scarcity narrative hasn't changed. What has changed is the short-term supply hitting the market through exchange inflows. Several thousand BTC moving toward venues in a short window is not massive relative to total float, but it is meaningful when layered on top of a short-liquidation flush.
ETF flows and broader institutional positioning aren't screaming panic, yet they also aren't providing the kind of relentless bid that would absorb distribution without friction. The result is a market that can grind higher on residual short covering while still feeling the weight of whale supply. This is the environment where ranges form rather than trends extend cleanly.
The data suggests the current price action is less a conviction-driven rally and more a liquidity-driven rebalancing. That distinction matters for position sizing.
Risks, Opportunities & What Traders Should Actually Watch
The primary risk is straightforward: continued net exchange inflows from whales while funding stays positive can create a classic distribution-into-strength scenario. Shorts have already paid a heavy price. If new longs pile in chasing the reclaim without absorption of the on-chain supply, the next move lower can be sharp once the squeeze exhausts.
The opportunity sits in the opposite direction but only if the $77K order block holds and the inflows slow. In that case the short-heavy liquidation event leaves the market with relatively cleaner positioning for a measured push higher. Higher-timeframe squeeze setups remain possible precisely because so much short leverage was removed.
Practical implications for pro traders are narrow and specific:
Monitor order blocks and the speed of reclaim attempts around $77K.
Track funding rates closely any rapid move above the current mild positive levels increases squeeze risk but also rejection risk.
Watch net exchange flow and whale volume as the real-time filter for whether distribution is intensifying or fading.
Treat the recent liquidation imbalance as a one-time event rather than a perpetual bullish catalyst.
This is where things get interesting. The market is giving clear signals on both the derivatives and on-chain sides. They just happen to be pointing in slightly different directions. That tension is exactly what defines range boundaries.
The balanced takeaway is simple. Bitcoin is holding the $77.7K zone after a classic liquidity sweep and short flush. Whale distribution pressure is real and visible in the exchange inflows. Funding remains only mildly positive, and sentiment has shifted into cautious greed rather than euphoria. The next range is more likely to be defined by how these forces interact than by any clean breakout narrative. Stay focused on the data that is actually moving order blocks, net flows, and funding rather than the story the green candles want to tell. That approach has kept more accounts intact through similar post-liquidation environments than any prediction ever has.
#Bitcoin #cryptotrading #Liquidations #CryptoMarket #TechnicalAnalysis
$BTC
272
·
--

Статья
Solana’s Quiet RWA Surge: $348M Inflows Signal Real Ecosystem Strength Amid Neutral SentimentYou’ve probably watched the usual suspects dominate headlines lately. Bitcoin and Ethereum ETFs bleeding capital, macro noise keeping the Fear & Greed Index stuck in neutral territory around 50-51, and SOL grinding sideways near the $99–$100 zone with only modest daily gains. It feels like the market is waiting for something bigger. Yet underneath that surface calm, Solana has been quietly doing something more interesting: leading major chains with $348 million in net real-world asset inflows over the past 30 days.
That’s not memecoin volume or speculative rotation. These are tokenized Treasuries, credit products, and equities moving onto the network. The data shows distributed RWA value climbing and holder counts expanding. Combined with still-positive (if small) Solana ETF flows while larger products saw outflows, this starts to look like a genuine fundamental catalyst rather than another short-lived narrative.
Why This Matters Right Now
The broader market is in a holding pattern. Fear & Greed sits right at the neutral line, reflecting neither panic nor euphoria. SOL has been range-bound near $100 after testing lower levels earlier in the month, with daily moves that feel almost deliberate in their restraint. Institutional money appears selective. BTC and ETH products recorded meaningful outflows on recent sessions, yet Solana ETFs posted a positive daily print of roughly $837k, keeping cumulative inflows near $1.37 billion.
What stands out is the parallel RWA activity. According to RWA.xyz data cited by the RWA Foundation, Solana posted the largest net inflows among major networks over 30 days. Distributed asset value rose about 11%, reaching roughly $4.23 billion, while holder addresses climbed into the 398,000–422,000 range. Transfer volumes and participation in tokenized products from names like BlackRock, Circle, Ondo, Franklin Templeton, and others continue to expand. This is happening while the network’s reputation still rests heavily on speed, low fees, and retail activity. The RWA numbers suggest a different layer of capital is starting to treat Solana as viable infrastructure.
On-Chain and Technical Picture
Price action remains unspectacular, which is exactly why the on-chain RWA data is worth watching. SOL holding the $99–$100 area with limited volatility creates a relatively clean backdrop for observing whether new capital sticks. Active addresses and stablecoin liquidity around RWA pairs will be the real test. If those metrics keep rising alongside holder growth, the inflows look less like temporary parking and more like genuine distribution.
Transfer volume in tokenized Treasuries, credit, and equities has been climbing. That activity tends to generate fees and demand for SOL in a more structural way than pure speculative trading. DEX volume specifically tied to these pairs is still secondary to the overall Solana ecosystem, but the direction is clear. The network’s low-cost settlement is an obvious advantage for frequent, smaller-ticket institutional-style transfers that larger chains handle less efficiently at scale.
Technically, the chart does not scream breakout. Support near recent lows has held, and the price is consolidating rather than breaking down. For traders, that leaves room for the fundamental story to matter more than short-term momentum.
The Tokenomics and Fundamental Angle
Here’s where the picture gets more interesting. Solana’s RWA growth is not purely a TVL story. Holder counts rising faster than pure price appreciation suggests broader participation. Products from established traditional finance names bring a different quality of capital—one that tends to stay longer and demand reliable infrastructure.
The network’s tokenomics benefit in subtler ways. Increased on-chain activity from RWA settlement, even at modest individual sizes, supports fee generation and can influence staking dynamics over time. Stablecoin liquidity remains deep enough to facilitate these flows without creating obvious bottlenecks. Compare the percentage growth rates: Solana’s roughly 11% rise in distributed RWA value over 30 days outpaced Ethereum’s much smaller gain and stood in contrast to declines on some other networks. Absolute size still favors Ethereum, but the recent flow leadership belongs to Solana.
This creates a form of decoupling. While larger assets face ETF outflow pressure and broader institutional caution, Solana is attracting a specific slice of tokenized real-world capital. That does not automatically translate into immediate price appreciation, but it does strengthen the case that the ecosystem’s utility is expanding beyond its retail and DeFi roots.
Risks, Opportunities, and What Actually Matters
Nothing here is risk-free. RWA products still face regulatory scrutiny, custody questions, and the possibility that inflows slow if traditional yields or macro conditions shift. Holder growth can reverse if products underperform or if users prefer other chains for specific asset classes. Solana’s own history of network stress, though much improved, remains a latent concern for larger institutional allocations. And the current price range means any disappointment on the RWA front could pressure sentiment quickly.
On the opportunity side, sticky capital is the key variable. If active addresses, stablecoin depth around these pairs, and transfer activity continue rising, the $348 million figure starts looking like the beginning of a trend rather than a one-month spike. For long-term investors, that points to an ecosystem whose fundamental drivers are broadening. For pro-traders, the combination of neutral macro sentiment, constructive ETF flows relative to peers, and measurable on-chain RWA growth offers a cleaner fundamental thesis than chasing pure narrative rotations.
The practical implication is straightforward: watch the stickiness metrics more than the headline inflow number. Sustained holder growth and transfer volume matter more than a single 30-day print.
Looking Ahead Without the Noise
Solana’s recent RWA leadership does not guarantee a breakout, nor does it erase the broader market’s caution. What it does show is measurable capital preferring the network for tokenized real-world products at a time when larger assets face outflow pressure. The holder base is expanding, the products are real, and the ETF channel remains modestly constructive.
In a market still dominated by neutral sentiment and selective institutional flows, that kind of concrete activity is worth tracking closely. Whether the capital stays and compounds into lasting ecosystem strength will depend on the on-chain follow-through in the weeks ahead. For now, the data gives Solana a clearer fundamental story than many of its peers can claim.
#SolanaETF
#TokenizedAssets
#Onchain
#blockchain
#CryptoMarket
$SOL
Solana’s Quiet RWA Surge: $348M Inflows Signal Real Ecosystem Strength Amid Neutral Sentiment
You’ve probably watched the usual suspects dominate headlines lately. Bitcoin and Ethereum ETFs bleeding capital, macro noise keeping the Fear & Greed Index stuck in neutral territory around 50-51, and SOL grinding sideways near the $99–$100 zone with only modest daily gains. It feels like the market is waiting for something bigger. Yet underneath that surface calm, Solana has been quietly doing something more interesting: leading major chains with $348 million in net real-world asset inflows over the past 30 days.
That’s not memecoin volume or speculative rotation. These are tokenized Treasuries, credit products, and equities moving onto the network. The data shows distributed RWA value climbing and holder counts expanding. Combined with still-positive (if small) Solana ETF flows while larger products saw outflows, this starts to look like a genuine fundamental catalyst rather than another short-lived narrative.
Why This Matters Right Now
The broader market is in a holding pattern. Fear & Greed sits right at the neutral line, reflecting neither panic nor euphoria. SOL has been range-bound near $100 after testing lower levels earlier in the month, with daily moves that feel almost deliberate in their restraint. Institutional money appears selective. BTC and ETH products recorded meaningful outflows on recent sessions, yet Solana ETFs posted a positive daily print of roughly $837k, keeping cumulative inflows near $1.37 billion.
What stands out is the parallel RWA activity. According to RWA.xyz data cited by the RWA Foundation, Solana posted the largest net inflows among major networks over 30 days. Distributed asset value rose about 11%, reaching roughly $4.23 billion, while holder addresses climbed into the 398,000–422,000 range. Transfer volumes and participation in tokenized products from names like BlackRock, Circle, Ondo, Franklin Templeton, and others continue to expand. This is happening while the network’s reputation still rests heavily on speed, low fees, and retail activity. The RWA numbers suggest a different layer of capital is starting to treat Solana as viable infrastructure.
On-Chain and Technical Picture
Price action remains unspectacular, which is exactly why the on-chain RWA data is worth watching. SOL holding the $99–$100 area with limited volatility creates a relatively clean backdrop for observing whether new capital sticks. Active addresses and stablecoin liquidity around RWA pairs will be the real test. If those metrics keep rising alongside holder growth, the inflows look less like temporary parking and more like genuine distribution.
Transfer volume in tokenized Treasuries, credit, and equities has been climbing. That activity tends to generate fees and demand for SOL in a more structural way than pure speculative trading. DEX volume specifically tied to these pairs is still secondary to the overall Solana ecosystem, but the direction is clear. The network’s low-cost settlement is an obvious advantage for frequent, smaller-ticket institutional-style transfers that larger chains handle less efficiently at scale.
Technically, the chart does not scream breakout. Support near recent lows has held, and the price is consolidating rather than breaking down. For traders, that leaves room for the fundamental story to matter more than short-term momentum.
The Tokenomics and Fundamental Angle
Here’s where the picture gets more interesting. Solana’s RWA growth is not purely a TVL story. Holder counts rising faster than pure price appreciation suggests broader participation. Products from established traditional finance names bring a different quality of capital—one that tends to stay longer and demand reliable infrastructure.
The network’s tokenomics benefit in subtler ways. Increased on-chain activity from RWA settlement, even at modest individual sizes, supports fee generation and can influence staking dynamics over time. Stablecoin liquidity remains deep enough to facilitate these flows without creating obvious bottlenecks. Compare the percentage growth rates: Solana’s roughly 11% rise in distributed RWA value over 30 days outpaced Ethereum’s much smaller gain and stood in contrast to declines on some other networks. Absolute size still favors Ethereum, but the recent flow leadership belongs to Solana.
This creates a form of decoupling. While larger assets face ETF outflow pressure and broader institutional caution, Solana is attracting a specific slice of tokenized real-world capital. That does not automatically translate into immediate price appreciation, but it does strengthen the case that the ecosystem’s utility is expanding beyond its retail and DeFi roots.
Risks, Opportunities, and What Actually Matters
Nothing here is risk-free. RWA products still face regulatory scrutiny, custody questions, and the possibility that inflows slow if traditional yields or macro conditions shift. Holder growth can reverse if products underperform or if users prefer other chains for specific asset classes. Solana’s own history of network stress, though much improved, remains a latent concern for larger institutional allocations. And the current price range means any disappointment on the RWA front could pressure sentiment quickly.
On the opportunity side, sticky capital is the key variable. If active addresses, stablecoin depth around these pairs, and transfer activity continue rising, the $348 million figure starts looking like the beginning of a trend rather than a one-month spike. For long-term investors, that points to an ecosystem whose fundamental drivers are broadening. For pro-traders, the combination of neutral macro sentiment, constructive ETF flows relative to peers, and measurable on-chain RWA growth offers a cleaner fundamental thesis than chasing pure narrative rotations.
The practical implication is straightforward: watch the stickiness metrics more than the headline inflow number. Sustained holder growth and transfer volume matter more than a single 30-day print.
Looking Ahead Without the Noise
Solana’s recent RWA leadership does not guarantee a breakout, nor does it erase the broader market’s caution. What it does show is measurable capital preferring the network for tokenized real-world products at a time when larger assets face outflow pressure. The holder base is expanding, the products are real, and the ETF channel remains modestly constructive.
In a market still dominated by neutral sentiment and selective institutional flows, that kind of concrete activity is worth tracking closely. Whether the capital stays and compounds into lasting ecosystem strength will depend on the on-chain follow-through in the weeks ahead. For now, the data gives Solana a clearer fundamental story than many of its peers can claim.
#SolanaETF
#TokenizedAssets
#Onchain
#blockchain
#CryptoMarket
$SOL
That’s not memecoin volume or speculative rotation. These are tokenized Treasuries, credit products, and equities moving onto the network. The data shows distributed RWA value climbing and holder counts expanding. Combined with still-positive (if small) Solana ETF flows while larger products saw outflows, this starts to look like a genuine fundamental catalyst rather than another short-lived narrative.
Why This Matters Right Now
The broader market is in a holding pattern. Fear & Greed sits right at the neutral line, reflecting neither panic nor euphoria. SOL has been range-bound near $100 after testing lower levels earlier in the month, with daily moves that feel almost deliberate in their restraint. Institutional money appears selective. BTC and ETH products recorded meaningful outflows on recent sessions, yet Solana ETFs posted a positive daily print of roughly $837k, keeping cumulative inflows near $1.37 billion.
What stands out is the parallel RWA activity. According to RWA.xyz data cited by the RWA Foundation, Solana posted the largest net inflows among major networks over 30 days. Distributed asset value rose about 11%, reaching roughly $4.23 billion, while holder addresses climbed into the 398,000–422,000 range. Transfer volumes and participation in tokenized products from names like BlackRock, Circle, Ondo, Franklin Templeton, and others continue to expand. This is happening while the network’s reputation still rests heavily on speed, low fees, and retail activity. The RWA numbers suggest a different layer of capital is starting to treat Solana as viable infrastructure.
On-Chain and Technical Picture
Price action remains unspectacular, which is exactly why the on-chain RWA data is worth watching. SOL holding the $99–$100 area with limited volatility creates a relatively clean backdrop for observing whether new capital sticks. Active addresses and stablecoin liquidity around RWA pairs will be the real test. If those metrics keep rising alongside holder growth, the inflows look less like temporary parking and more like genuine distribution.
Transfer volume in tokenized Treasuries, credit, and equities has been climbing. That activity tends to generate fees and demand for SOL in a more structural way than pure speculative trading. DEX volume specifically tied to these pairs is still secondary to the overall Solana ecosystem, but the direction is clear. The network’s low-cost settlement is an obvious advantage for frequent, smaller-ticket institutional-style transfers that larger chains handle less efficiently at scale.
Technically, the chart does not scream breakout. Support near recent lows has held, and the price is consolidating rather than breaking down. For traders, that leaves room for the fundamental story to matter more than short-term momentum.
The Tokenomics and Fundamental Angle
Here’s where the picture gets more interesting. Solana’s RWA growth is not purely a TVL story. Holder counts rising faster than pure price appreciation suggests broader participation. Products from established traditional finance names bring a different quality of capital—one that tends to stay longer and demand reliable infrastructure.
The network’s tokenomics benefit in subtler ways. Increased on-chain activity from RWA settlement, even at modest individual sizes, supports fee generation and can influence staking dynamics over time. Stablecoin liquidity remains deep enough to facilitate these flows without creating obvious bottlenecks. Compare the percentage growth rates: Solana’s roughly 11% rise in distributed RWA value over 30 days outpaced Ethereum’s much smaller gain and stood in contrast to declines on some other networks. Absolute size still favors Ethereum, but the recent flow leadership belongs to Solana.
This creates a form of decoupling. While larger assets face ETF outflow pressure and broader institutional caution, Solana is attracting a specific slice of tokenized real-world capital. That does not automatically translate into immediate price appreciation, but it does strengthen the case that the ecosystem’s utility is expanding beyond its retail and DeFi roots.
Risks, Opportunities, and What Actually Matters
Nothing here is risk-free. RWA products still face regulatory scrutiny, custody questions, and the possibility that inflows slow if traditional yields or macro conditions shift. Holder growth can reverse if products underperform or if users prefer other chains for specific asset classes. Solana’s own history of network stress, though much improved, remains a latent concern for larger institutional allocations. And the current price range means any disappointment on the RWA front could pressure sentiment quickly.
On the opportunity side, sticky capital is the key variable. If active addresses, stablecoin depth around these pairs, and transfer activity continue rising, the $348 million figure starts looking like the beginning of a trend rather than a one-month spike. For long-term investors, that points to an ecosystem whose fundamental drivers are broadening. For pro-traders, the combination of neutral macro sentiment, constructive ETF flows relative to peers, and measurable on-chain RWA growth offers a cleaner fundamental thesis than chasing pure narrative rotations.
The practical implication is straightforward: watch the stickiness metrics more than the headline inflow number. Sustained holder growth and transfer volume matter more than a single 30-day print.
Looking Ahead Without the Noise
Solana’s recent RWA leadership does not guarantee a breakout, nor does it erase the broader market’s caution. What it does show is measurable capital preferring the network for tokenized real-world products at a time when larger assets face outflow pressure. The holder base is expanding, the products are real, and the ETF channel remains modestly constructive.
In a market still dominated by neutral sentiment and selective institutional flows, that kind of concrete activity is worth tracking closely. Whether the capital stays and compounds into lasting ecosystem strength will depend on the on-chain follow-through in the weeks ahead. For now, the data gives Solana a clearer fundamental story than many of its peers can claim.
#SolanaETF
#TokenizedAssets
#Onchain
#blockchain
#CryptoMarket
$SOL
2
447
·
--

Статья
Spot Bitcoin ETFs just posted another heavy redemption day, and the timing is no coincidence.You’ve probably watched the tape and felt that familiar shift. After months where institutional flows acted like a steady bid under Bitcoin, the last two sessions flipped hard. September 15 saw roughly $450 million leave U.S. spot Bitcoin ETFs. The next day, another $296 million walked out. That’s nearly $750 million in 48 hours. The 7-day net sits around –$1.05 billion. Fear & Greed is parked at 50-51, pure neutral territory. Cumulative inflows still stand near $54.6 billion and AUM hovers around $95 billion, so the structure hasn’t collapsed. But the direction of travel has changed fast.
Let me explain why this matters right now. The Fed just delivered a rate hike, and the Senate failed to advance the CLARITY Act. Those two events landed in the same window. Institutional capital that had been accumulating is now de-risking. The question for long-term investors and pro traders is simple: is this temporary defense or the start of a broader pause heading into Q4?
Why the Flow Reversal Hit Now
BlackRock’s IBIT and Fidelity’s FBTC did most of the damage. On September 16, IBIT alone accounted for about $144 million in outflows. ARKB added another $84 million, FBTC roughly $53 million. Morgan Stanley’s smaller product was one of the few that still saw modest creations. The concentration tells you something. The largest, most liquid vehicles are the ones being used for risk management right now.
Ethereum ETFs weren’t spared. They posted around $224 million in net outflows the same day, led by BlackRock’s ETHA. Solana ETFs, by contrast, managed small positive flows—under a million dollars. That rotation inside the complex is worth noting. Capital isn’t fleeing crypto entirely; it’s becoming more selective.
On-chain data lines up with the flow picture. Exchange reserves have shown elevated Bitcoin moving toward trading venues in recent sessions, consistent with short-term holders adjusting positions. When the ETF bid softens and coins start appearing on exchanges at the same time, the market gets more sensitive to every macro headline. Higher rates raise the opportunity cost of holding non-yielding assets. Regulatory uncertainty from the CLARITY setback removes one potential tailwind that many desks had been pricing in for the back half of the year.
What stands out to me is how quickly the tone shifted. Earlier in September we still saw big creation days—over $730 million on one session alone. The residual cumulative inflows of $54.6 billion keep the overall institutional footprint large. But consecutive large redemptions after a rate hike reveal how fast that capital can move from accumulation to defense while total AUM stays elevated.
Technical & On-Chain View
Bitcoin has been grinding near the mid-$70,000s, with the recent flow reversal coinciding with tests of nearby support. Short-term holder cost bases are coming into play. When coins that were acquired in the recent range start moving toward exchanges, it often reflects positioning adjustments rather than wholesale capitulation. Still, the alignment between ETF outflows and rising exchange supply is a classic signal of near-term caution.
The Fear & Greed reading at 50-51 fits. Markets aren’t panicked, but they’re no longer leaning into risk either. Volume patterns in the ETFs themselves show the largest products absorbing the bulk of the selling. That concentration can create temporary liquidity pressure even if the broader AUM base remains solid.
Fundamental Angle: Rates, Regulation, and Residual Demand
The macro overlay is straightforward. A higher policy rate makes the risk-free alternative more attractive. Bitcoin doesn’t pay a yield. When the Fed tightens, the relative appeal of holding BTC through an ETF declines for some allocators, at least at the margin. The failed Senate vote on CLARITY compounds that. Market-structure legislation that many hoped would clarify the regulatory perimeter for digital assets is now delayed. That uncertainty weighs on institutional comfort levels.
Yet the counterpoint is hard to ignore. Cumulative net inflows still sit near $54.6 billion. AUM around $95 billion means a large stock of capital remains committed. These products have changed the ownership structure of Bitcoin permanently. The question is not whether institutions own the asset—they do. It’s whether the marginal buyer is still active or has stepped back for a period of digestion.
Solana’s small positive flows while Bitcoin and Ethereum saw heavy redemptions suggest some rotation is underway inside the complex. That’s not a bullish signal for the majors in the short term, but it does show capital remains engaged with the broader space.
Risks, Opportunities, and Practical Implications
The clear risk is that consecutive outflow days extend. If higher rates and regulatory noise keep pressure on risk assets into October, the ETF bid that supported price earlier this year could stay muted. That would leave Bitcoin more exposed to on-chain selling and derivatives positioning. Pro traders should watch daily flow prints closely; the difference between a two-day pause and a multi-week trend is material for positioning.
For longer-term investors the picture is more nuanced. The absolute size of the outflows looks large in isolation, but relative to total AUM it’s still modest. Institutions that entered through these vehicles tend to have longer holding periods than pure speculative flows. A period of de-risking after a rate hike is not the same as permanent exit. History in traditional markets shows similar patterns when policy shifts.
Practical takeaway: size risk according to the current flow regime rather than the cumulative total. The residual $54.6 billion in net inflows provides a floor of sorts, but it doesn’t protect against short-term volatility if redemptions continue. Watch whether IBIT and FBTC stabilize. Those two products have driven both the upside and the recent downside in flows. Their next few sessions will tell you more about institutional posture than any single price candle.
Here’s what I’m seeing. This looks like classic institutional caution after a policy and regulatory one-two punch. The data doesn’t yet scream panic. Fear & Greed is neutral, not extreme fear. Cumulative ownership remains high. But the speed of the shift from accumulation to defense is a reminder that ETF flows are a two-way street. Positioning into Q4 needs to respect that reality without assuming the entire institutional bid has disappeared.
The next few weeks of flow data will clarify whether this is temporary de-risking or something more structural. Until then, the edge belongs to those who treat the current redemptions as information rather than noise.
#BTC
#BitcoinETF
#SpotBitcoinETF
#SolanaETF
#EthereumETF
$BTC
{spot}(BTCUSDT)
Spot Bitcoin ETFs just posted another heavy redemption day, and the timing is no coincidence.
You’ve probably watched the tape and felt that familiar shift. After months where institutional flows acted like a steady bid under Bitcoin, the last two sessions flipped hard. September 15 saw roughly $450 million leave U.S. spot Bitcoin ETFs. The next day, another $296 million walked out. That’s nearly $750 million in 48 hours. The 7-day net sits around –$1.05 billion. Fear & Greed is parked at 50-51, pure neutral territory. Cumulative inflows still stand near $54.6 billion and AUM hovers around $95 billion, so the structure hasn’t collapsed. But the direction of travel has changed fast.
Let me explain why this matters right now. The Fed just delivered a rate hike, and the Senate failed to advance the CLARITY Act. Those two events landed in the same window. Institutional capital that had been accumulating is now de-risking. The question for long-term investors and pro traders is simple: is this temporary defense or the start of a broader pause heading into Q4?
Why the Flow Reversal Hit Now
BlackRock’s IBIT and Fidelity’s FBTC did most of the damage. On September 16, IBIT alone accounted for about $144 million in outflows. ARKB added another $84 million, FBTC roughly $53 million. Morgan Stanley’s smaller product was one of the few that still saw modest creations. The concentration tells you something. The largest, most liquid vehicles are the ones being used for risk management right now.
Ethereum ETFs weren’t spared. They posted around $224 million in net outflows the same day, led by BlackRock’s ETHA. Solana ETFs, by contrast, managed small positive flows—under a million dollars. That rotation inside the complex is worth noting. Capital isn’t fleeing crypto entirely; it’s becoming more selective.
On-chain data lines up with the flow picture. Exchange reserves have shown elevated Bitcoin moving toward trading venues in recent sessions, consistent with short-term holders adjusting positions. When the ETF bid softens and coins start appearing on exchanges at the same time, the market gets more sensitive to every macro headline. Higher rates raise the opportunity cost of holding non-yielding assets. Regulatory uncertainty from the CLARITY setback removes one potential tailwind that many desks had been pricing in for the back half of the year.
What stands out to me is how quickly the tone shifted. Earlier in September we still saw big creation days—over $730 million on one session alone. The residual cumulative inflows of $54.6 billion keep the overall institutional footprint large. But consecutive large redemptions after a rate hike reveal how fast that capital can move from accumulation to defense while total AUM stays elevated.
Technical & On-Chain View
Bitcoin has been grinding near the mid-$70,000s, with the recent flow reversal coinciding with tests of nearby support. Short-term holder cost bases are coming into play. When coins that were acquired in the recent range start moving toward exchanges, it often reflects positioning adjustments rather than wholesale capitulation. Still, the alignment between ETF outflows and rising exchange supply is a classic signal of near-term caution.
The Fear & Greed reading at 50-51 fits. Markets aren’t panicked, but they’re no longer leaning into risk either. Volume patterns in the ETFs themselves show the largest products absorbing the bulk of the selling. That concentration can create temporary liquidity pressure even if the broader AUM base remains solid.
Fundamental Angle: Rates, Regulation, and Residual Demand
The macro overlay is straightforward. A higher policy rate makes the risk-free alternative more attractive. Bitcoin doesn’t pay a yield. When the Fed tightens, the relative appeal of holding BTC through an ETF declines for some allocators, at least at the margin. The failed Senate vote on CLARITY compounds that. Market-structure legislation that many hoped would clarify the regulatory perimeter for digital assets is now delayed. That uncertainty weighs on institutional comfort levels.
Yet the counterpoint is hard to ignore. Cumulative net inflows still sit near $54.6 billion. AUM around $95 billion means a large stock of capital remains committed. These products have changed the ownership structure of Bitcoin permanently. The question is not whether institutions own the asset—they do. It’s whether the marginal buyer is still active or has stepped back for a period of digestion.
Solana’s small positive flows while Bitcoin and Ethereum saw heavy redemptions suggest some rotation is underway inside the complex. That’s not a bullish signal for the majors in the short term, but it does show capital remains engaged with the broader space.
Risks, Opportunities, and Practical Implications
The clear risk is that consecutive outflow days extend. If higher rates and regulatory noise keep pressure on risk assets into October, the ETF bid that supported price earlier this year could stay muted. That would leave Bitcoin more exposed to on-chain selling and derivatives positioning. Pro traders should watch daily flow prints closely; the difference between a two-day pause and a multi-week trend is material for positioning.
For longer-term investors the picture is more nuanced. The absolute size of the outflows looks large in isolation, but relative to total AUM it’s still modest. Institutions that entered through these vehicles tend to have longer holding periods than pure speculative flows. A period of de-risking after a rate hike is not the same as permanent exit. History in traditional markets shows similar patterns when policy shifts.
Practical takeaway: size risk according to the current flow regime rather than the cumulative total. The residual $54.6 billion in net inflows provides a floor of sorts, but it doesn’t protect against short-term volatility if redemptions continue. Watch whether IBIT and FBTC stabilize. Those two products have driven both the upside and the recent downside in flows. Their next few sessions will tell you more about institutional posture than any single price candle.
Here’s what I’m seeing. This looks like classic institutional caution after a policy and regulatory one-two punch. The data doesn’t yet scream panic. Fear & Greed is neutral, not extreme fear. Cumulative ownership remains high. But the speed of the shift from accumulation to defense is a reminder that ETF flows are a two-way street. Positioning into Q4 needs to respect that reality without assuming the entire institutional bid has disappeared.
The next few weeks of flow data will clarify whether this is temporary de-risking or something more structural. Until then, the edge belongs to those who treat the current redemptions as information rather than noise.
#BTC
#BitcoinETF
#SpotBitcoinETF
#SolanaETF
#EthereumETF
$BTC
Let me explain why this matters right now. The Fed just delivered a rate hike, and the Senate failed to advance the CLARITY Act. Those two events landed in the same window. Institutional capital that had been accumulating is now de-risking. The question for long-term investors and pro traders is simple: is this temporary defense or the start of a broader pause heading into Q4?
Why the Flow Reversal Hit Now
BlackRock’s IBIT and Fidelity’s FBTC did most of the damage. On September 16, IBIT alone accounted for about $144 million in outflows. ARKB added another $84 million, FBTC roughly $53 million. Morgan Stanley’s smaller product was one of the few that still saw modest creations. The concentration tells you something. The largest, most liquid vehicles are the ones being used for risk management right now.
Ethereum ETFs weren’t spared. They posted around $224 million in net outflows the same day, led by BlackRock’s ETHA. Solana ETFs, by contrast, managed small positive flows—under a million dollars. That rotation inside the complex is worth noting. Capital isn’t fleeing crypto entirely; it’s becoming more selective.
On-chain data lines up with the flow picture. Exchange reserves have shown elevated Bitcoin moving toward trading venues in recent sessions, consistent with short-term holders adjusting positions. When the ETF bid softens and coins start appearing on exchanges at the same time, the market gets more sensitive to every macro headline. Higher rates raise the opportunity cost of holding non-yielding assets. Regulatory uncertainty from the CLARITY setback removes one potential tailwind that many desks had been pricing in for the back half of the year.
What stands out to me is how quickly the tone shifted. Earlier in September we still saw big creation days—over $730 million on one session alone. The residual cumulative inflows of $54.6 billion keep the overall institutional footprint large. But consecutive large redemptions after a rate hike reveal how fast that capital can move from accumulation to defense while total AUM stays elevated.
Technical & On-Chain View
Bitcoin has been grinding near the mid-$70,000s, with the recent flow reversal coinciding with tests of nearby support. Short-term holder cost bases are coming into play. When coins that were acquired in the recent range start moving toward exchanges, it often reflects positioning adjustments rather than wholesale capitulation. Still, the alignment between ETF outflows and rising exchange supply is a classic signal of near-term caution.
The Fear & Greed reading at 50-51 fits. Markets aren’t panicked, but they’re no longer leaning into risk either. Volume patterns in the ETFs themselves show the largest products absorbing the bulk of the selling. That concentration can create temporary liquidity pressure even if the broader AUM base remains solid.
Fundamental Angle: Rates, Regulation, and Residual Demand
The macro overlay is straightforward. A higher policy rate makes the risk-free alternative more attractive. Bitcoin doesn’t pay a yield. When the Fed tightens, the relative appeal of holding BTC through an ETF declines for some allocators, at least at the margin. The failed Senate vote on CLARITY compounds that. Market-structure legislation that many hoped would clarify the regulatory perimeter for digital assets is now delayed. That uncertainty weighs on institutional comfort levels.
Yet the counterpoint is hard to ignore. Cumulative net inflows still sit near $54.6 billion. AUM around $95 billion means a large stock of capital remains committed. These products have changed the ownership structure of Bitcoin permanently. The question is not whether institutions own the asset—they do. It’s whether the marginal buyer is still active or has stepped back for a period of digestion.
Solana’s small positive flows while Bitcoin and Ethereum saw heavy redemptions suggest some rotation is underway inside the complex. That’s not a bullish signal for the majors in the short term, but it does show capital remains engaged with the broader space.
Risks, Opportunities, and Practical Implications
The clear risk is that consecutive outflow days extend. If higher rates and regulatory noise keep pressure on risk assets into October, the ETF bid that supported price earlier this year could stay muted. That would leave Bitcoin more exposed to on-chain selling and derivatives positioning. Pro traders should watch daily flow prints closely; the difference between a two-day pause and a multi-week trend is material for positioning.
For longer-term investors the picture is more nuanced. The absolute size of the outflows looks large in isolation, but relative to total AUM it’s still modest. Institutions that entered through these vehicles tend to have longer holding periods than pure speculative flows. A period of de-risking after a rate hike is not the same as permanent exit. History in traditional markets shows similar patterns when policy shifts.
Practical takeaway: size risk according to the current flow regime rather than the cumulative total. The residual $54.6 billion in net inflows provides a floor of sorts, but it doesn’t protect against short-term volatility if redemptions continue. Watch whether IBIT and FBTC stabilize. Those two products have driven both the upside and the recent downside in flows. Their next few sessions will tell you more about institutional posture than any single price candle.
Here’s what I’m seeing. This looks like classic institutional caution after a policy and regulatory one-two punch. The data doesn’t yet scream panic. Fear & Greed is neutral, not extreme fear. Cumulative ownership remains high. But the speed of the shift from accumulation to defense is a reminder that ETF flows are a two-way street. Positioning into Q4 needs to respect that reality without assuming the entire institutional bid has disappeared.
The next few weeks of flow data will clarify whether this is temporary de-risking or something more structural. Until then, the edge belongs to those who treat the current redemptions as information rather than noise.
#BTC
#BitcoinETF
#SpotBitcoinETF
#SolanaETF
#EthereumETF
$BTC
1
404
·
--

Статья
ZEC Surges 18% as Privacy Narrative Gains Traction Amid Broader Market NeutralityYou've probably noticed the same pattern I have over the past few cycles. Majors grind sideways while a mid-cap with a clean story and technical setup suddenly runs. Right now Bitcoin sits near $76,000 and Ethereum around $2,430, both range-bound after the latest Fed move. Fear & Greed sits at 51 dead neutral. Most alts are quiet. Then ZEC prints an 18% move higher, wiping out a cluster of shorts and pushing open interest sharply higher.
That kind of relative strength in a flat tape is worth paying attention to. It’s not beta. It’s selection. Traders watching sector rotation are left asking the same question: is this pure leverage and short covering, or is the privacy narrative finally finding real demand again?
Why Now
The setup is clean. Fear & Greed at 50–51 means the broader market isn’t in risk-on mode. BTC and ETH funding rates remain muted. Volume on the majors is respectable but not euphoric. Against that backdrop ZEC’s move stands out.
Derivatives data showed one of the larger single-asset liquidation clusters in the past 24 hours, with shorts accounting for the majority of forced closes across major venues. One high-profile trader flipped long to short near $767 only to get fully liquidated on a $1 million position as price kept climbing. Funding rates and open interest on ZEC perpetuals shifted in favor of the move—open interest on some venues jumped hard, with reports of Hyperliquid OI alone hitting new highs near $840 million. Contrast that with the relatively quiet readings on BTC and ETH perps.
On the institutional side, Grayscale’s spot Zcash product (ZCSH) has continued to accumulate assets since its late-August launch, providing a regulated vehicle that didn’t exist in prior privacy-coin cycles. Combined with the near-unanimous approval of Network Upgrade 7—cutting block times from 75 seconds to 25 seconds while preserving the existing issuance schedule—the narrative has fresh fuel.
What stands out to me is the timing. The move arrived while the rest of the market stayed neutral. That isolates ZEC as a pure mid-cap relative-strength story rather than another correlated bounce.
Technical & On-Chain View
Price action itself is straightforward. ZEC cleared prior resistance zones that had capped multiple earlier attempts and extended the recovery that began in August from the mid-$500s. The 4-hour structure flipped constructive, with higher lows holding through the recent volatility.
Liquidation heatmaps still show residual short clusters above current levels, which can act as fuel on any further push. At the same time, open interest expansion means the market is more leveraged than it was two weeks ago. That cuts both ways.
On-chain, the more interesting data sits in the shielded pools. Roughly 29% of circulating supply—around 4.9 million ZEC—now sits in shielded addresses, with Ironwood taking the bulk of recent migration. Shielded transaction share has stayed elevated relative to historical averages even as daily transaction counts fluctuate. Exchange reserves have not shown the kind of aggressive deposit spike that usually precedes distribution after a sharp run.
Active address growth and transparent volume have been choppy day-to-day, which is typical after a vertical move. The data suggests accumulation is present but not yet runaway. For now the technical structure and the short-covering cascade are doing the heavy lifting. Mean-reversion risk remains real if volume fades and the broader market stays stuck.
Fundamental & Tokenomics Angle
Tokenomics here are refreshingly simple compared with many mid-caps. Fixed 21 million max supply, Bitcoin-style halvings still intact, and no high-FDV unlock schedule hanging over the market. The value proposition remains privacy utility—zero-knowledge proofs that let users transact without broadcasting every detail on a public ledger.
In an environment where AI-driven surveillance tools keep improving and regulatory pressure on transparent chains continues, that utility narrative has legs. The ETF wrapper gives traditional capital a clean on-ramp without forcing them to hold the coin directly. The NU7 upgrade, by accelerating block times, addresses a long-standing usability complaint without touching the monetary policy.
I’ve watched privacy coins cycle through narrative peaks and troughs for years. Most of the earlier ones faded because the product didn’t improve fast enough or the tokenomics invited constant selling pressure. ZEC’s structure avoids the worst of those issues. That doesn’t guarantee continued outperformance, but it does explain why capital is willing to rotate here while the rest of the market sits on its hands.
Risks, Opportunities & Practical Implications
The obvious risk is that this remains a leverage-driven squeeze. Elevated open interest and the size of the short liquidations mean any sharp reversal could unwind quickly. Correlation with BTC is low right now, but that can change if the majors break lower and risk appetite collapses across the board. Privacy coins also carry persistent regulatory overhang—history shows exchanges can delist or restrict them with little notice.
On the opportunity side, the combination of ETF inflows, improved network parameters, and a still-elevated shielded percentage creates a cleaner fundamental backdrop than ZEC has enjoyed in years. For traders focused on relative strength, the setup is actionable as long as key support levels hold and funding doesn’t flip aggressively positive for too long.
Practically, position sizing matters more than usual. The move has already been sharp. Scaling into strength rather than chasing the first green candle has been the better approach in similar mid-cap relative-strength episodes. Watching exchange net flows and the next few days of open-interest changes will tell you whether genuine demand is stepping in behind the shorts that just got squeezed.
The data doesn’t scream “guaranteed continuation.” It does show a mid-cap that is currently moving independently of the majors in a neutral sentiment environment, with both technical structure and a coherent privacy narrative in its favor. That’s the kind of setup that rewards careful monitoring rather than blind conviction.
In markets this selective, relative strength is often the signal that matters most. ZEC is giving that signal right now. Whether it sustains depends on whether the privacy demand and on-chain accumulation can keep pace with the leverage that already moved the price.
#zec #BTC #Ethereum
$ZEC
{spot}(ZECUSDT)
$BTC
{spot}(BTCUSDT)
$ETH
{spot}(ETHUSDT)
ZEC Surges 18% as Privacy Narrative Gains Traction Amid Broader Market Neutrality
You've probably noticed the same pattern I have over the past few cycles. Majors grind sideways while a mid-cap with a clean story and technical setup suddenly runs. Right now Bitcoin sits near $76,000 and Ethereum around $2,430, both range-bound after the latest Fed move. Fear & Greed sits at 51 dead neutral. Most alts are quiet. Then ZEC prints an 18% move higher, wiping out a cluster of shorts and pushing open interest sharply higher.
That kind of relative strength in a flat tape is worth paying attention to. It’s not beta. It’s selection. Traders watching sector rotation are left asking the same question: is this pure leverage and short covering, or is the privacy narrative finally finding real demand again?
Why Now
The setup is clean. Fear & Greed at 50–51 means the broader market isn’t in risk-on mode. BTC and ETH funding rates remain muted. Volume on the majors is respectable but not euphoric. Against that backdrop ZEC’s move stands out.
Derivatives data showed one of the larger single-asset liquidation clusters in the past 24 hours, with shorts accounting for the majority of forced closes across major venues. One high-profile trader flipped long to short near $767 only to get fully liquidated on a $1 million position as price kept climbing. Funding rates and open interest on ZEC perpetuals shifted in favor of the move—open interest on some venues jumped hard, with reports of Hyperliquid OI alone hitting new highs near $840 million. Contrast that with the relatively quiet readings on BTC and ETH perps.
On the institutional side, Grayscale’s spot Zcash product (ZCSH) has continued to accumulate assets since its late-August launch, providing a regulated vehicle that didn’t exist in prior privacy-coin cycles. Combined with the near-unanimous approval of Network Upgrade 7—cutting block times from 75 seconds to 25 seconds while preserving the existing issuance schedule—the narrative has fresh fuel.
What stands out to me is the timing. The move arrived while the rest of the market stayed neutral. That isolates ZEC as a pure mid-cap relative-strength story rather than another correlated bounce.
Technical & On-Chain View
Price action itself is straightforward. ZEC cleared prior resistance zones that had capped multiple earlier attempts and extended the recovery that began in August from the mid-$500s. The 4-hour structure flipped constructive, with higher lows holding through the recent volatility.
Liquidation heatmaps still show residual short clusters above current levels, which can act as fuel on any further push. At the same time, open interest expansion means the market is more leveraged than it was two weeks ago. That cuts both ways.
On-chain, the more interesting data sits in the shielded pools. Roughly 29% of circulating supply—around 4.9 million ZEC—now sits in shielded addresses, with Ironwood taking the bulk of recent migration. Shielded transaction share has stayed elevated relative to historical averages even as daily transaction counts fluctuate. Exchange reserves have not shown the kind of aggressive deposit spike that usually precedes distribution after a sharp run.
Active address growth and transparent volume have been choppy day-to-day, which is typical after a vertical move. The data suggests accumulation is present but not yet runaway. For now the technical structure and the short-covering cascade are doing the heavy lifting. Mean-reversion risk remains real if volume fades and the broader market stays stuck.
Fundamental & Tokenomics Angle
Tokenomics here are refreshingly simple compared with many mid-caps. Fixed 21 million max supply, Bitcoin-style halvings still intact, and no high-FDV unlock schedule hanging over the market. The value proposition remains privacy utility—zero-knowledge proofs that let users transact without broadcasting every detail on a public ledger.
In an environment where AI-driven surveillance tools keep improving and regulatory pressure on transparent chains continues, that utility narrative has legs. The ETF wrapper gives traditional capital a clean on-ramp without forcing them to hold the coin directly. The NU7 upgrade, by accelerating block times, addresses a long-standing usability complaint without touching the monetary policy.
I’ve watched privacy coins cycle through narrative peaks and troughs for years. Most of the earlier ones faded because the product didn’t improve fast enough or the tokenomics invited constant selling pressure. ZEC’s structure avoids the worst of those issues. That doesn’t guarantee continued outperformance, but it does explain why capital is willing to rotate here while the rest of the market sits on its hands.
Risks, Opportunities & Practical Implications
The obvious risk is that this remains a leverage-driven squeeze. Elevated open interest and the size of the short liquidations mean any sharp reversal could unwind quickly. Correlation with BTC is low right now, but that can change if the majors break lower and risk appetite collapses across the board. Privacy coins also carry persistent regulatory overhang—history shows exchanges can delist or restrict them with little notice.
On the opportunity side, the combination of ETF inflows, improved network parameters, and a still-elevated shielded percentage creates a cleaner fundamental backdrop than ZEC has enjoyed in years. For traders focused on relative strength, the setup is actionable as long as key support levels hold and funding doesn’t flip aggressively positive for too long.
Practically, position sizing matters more than usual. The move has already been sharp. Scaling into strength rather than chasing the first green candle has been the better approach in similar mid-cap relative-strength episodes. Watching exchange net flows and the next few days of open-interest changes will tell you whether genuine demand is stepping in behind the shorts that just got squeezed.
The data doesn’t scream “guaranteed continuation.” It does show a mid-cap that is currently moving independently of the majors in a neutral sentiment environment, with both technical structure and a coherent privacy narrative in its favor. That’s the kind of setup that rewards careful monitoring rather than blind conviction.
In markets this selective, relative strength is often the signal that matters most. ZEC is giving that signal right now. Whether it sustains depends on whether the privacy demand and on-chain accumulation can keep pace with the leverage that already moved the price.
#zec #BTC #Ethereum
$ZEC
$BTC
$ETH
That kind of relative strength in a flat tape is worth paying attention to. It’s not beta. It’s selection. Traders watching sector rotation are left asking the same question: is this pure leverage and short covering, or is the privacy narrative finally finding real demand again?
Why Now
The setup is clean. Fear & Greed at 50–51 means the broader market isn’t in risk-on mode. BTC and ETH funding rates remain muted. Volume on the majors is respectable but not euphoric. Against that backdrop ZEC’s move stands out.
Derivatives data showed one of the larger single-asset liquidation clusters in the past 24 hours, with shorts accounting for the majority of forced closes across major venues. One high-profile trader flipped long to short near $767 only to get fully liquidated on a $1 million position as price kept climbing. Funding rates and open interest on ZEC perpetuals shifted in favor of the move—open interest on some venues jumped hard, with reports of Hyperliquid OI alone hitting new highs near $840 million. Contrast that with the relatively quiet readings on BTC and ETH perps.
On the institutional side, Grayscale’s spot Zcash product (ZCSH) has continued to accumulate assets since its late-August launch, providing a regulated vehicle that didn’t exist in prior privacy-coin cycles. Combined with the near-unanimous approval of Network Upgrade 7—cutting block times from 75 seconds to 25 seconds while preserving the existing issuance schedule—the narrative has fresh fuel.
What stands out to me is the timing. The move arrived while the rest of the market stayed neutral. That isolates ZEC as a pure mid-cap relative-strength story rather than another correlated bounce.
Technical & On-Chain View
Price action itself is straightforward. ZEC cleared prior resistance zones that had capped multiple earlier attempts and extended the recovery that began in August from the mid-$500s. The 4-hour structure flipped constructive, with higher lows holding through the recent volatility.
Liquidation heatmaps still show residual short clusters above current levels, which can act as fuel on any further push. At the same time, open interest expansion means the market is more leveraged than it was two weeks ago. That cuts both ways.
On-chain, the more interesting data sits in the shielded pools. Roughly 29% of circulating supply—around 4.9 million ZEC—now sits in shielded addresses, with Ironwood taking the bulk of recent migration. Shielded transaction share has stayed elevated relative to historical averages even as daily transaction counts fluctuate. Exchange reserves have not shown the kind of aggressive deposit spike that usually precedes distribution after a sharp run.
Active address growth and transparent volume have been choppy day-to-day, which is typical after a vertical move. The data suggests accumulation is present but not yet runaway. For now the technical structure and the short-covering cascade are doing the heavy lifting. Mean-reversion risk remains real if volume fades and the broader market stays stuck.
Fundamental & Tokenomics Angle
Tokenomics here are refreshingly simple compared with many mid-caps. Fixed 21 million max supply, Bitcoin-style halvings still intact, and no high-FDV unlock schedule hanging over the market. The value proposition remains privacy utility—zero-knowledge proofs that let users transact without broadcasting every detail on a public ledger.
In an environment where AI-driven surveillance tools keep improving and regulatory pressure on transparent chains continues, that utility narrative has legs. The ETF wrapper gives traditional capital a clean on-ramp without forcing them to hold the coin directly. The NU7 upgrade, by accelerating block times, addresses a long-standing usability complaint without touching the monetary policy.
I’ve watched privacy coins cycle through narrative peaks and troughs for years. Most of the earlier ones faded because the product didn’t improve fast enough or the tokenomics invited constant selling pressure. ZEC’s structure avoids the worst of those issues. That doesn’t guarantee continued outperformance, but it does explain why capital is willing to rotate here while the rest of the market sits on its hands.
Risks, Opportunities & Practical Implications
The obvious risk is that this remains a leverage-driven squeeze. Elevated open interest and the size of the short liquidations mean any sharp reversal could unwind quickly. Correlation with BTC is low right now, but that can change if the majors break lower and risk appetite collapses across the board. Privacy coins also carry persistent regulatory overhang—history shows exchanges can delist or restrict them with little notice.
On the opportunity side, the combination of ETF inflows, improved network parameters, and a still-elevated shielded percentage creates a cleaner fundamental backdrop than ZEC has enjoyed in years. For traders focused on relative strength, the setup is actionable as long as key support levels hold and funding doesn’t flip aggressively positive for too long.
Practically, position sizing matters more than usual. The move has already been sharp. Scaling into strength rather than chasing the first green candle has been the better approach in similar mid-cap relative-strength episodes. Watching exchange net flows and the next few days of open-interest changes will tell you whether genuine demand is stepping in behind the shorts that just got squeezed.
The data doesn’t scream “guaranteed continuation.” It does show a mid-cap that is currently moving independently of the majors in a neutral sentiment environment, with both technical structure and a coherent privacy narrative in its favor. That’s the kind of setup that rewards careful monitoring rather than blind conviction.
In markets this selective, relative strength is often the signal that matters most. ZEC is giving that signal right now. Whether it sustains depends on whether the privacy demand and on-chain accumulation can keep pace with the leverage that already moved the price.
#zec #BTC #Ethereum
$ZEC
$BTC
$ETH
315
·
--
$BTC 🚨 Fed Decision Today | CME FedWatch Update
Markets are pricing in a 92-93% chance of a 25bps rate hike (first since 2023). Target range expected to move from 3.50-3.75% → 3.75-4.00%.
Bitcoin is trading near $75k–$76k after recent selling pressure. The hike itself is largely priced in — the real market mover will be the Dot Plot and Chair Warsh’s tone in the press conference.
Possible scenarios for Crypto:
• Soft guidance after hike → possible relief bounce
• Hawkish outlook → further downside pressure
• Surprise hold → sharp upside reaction
Volatility expected. Stay disciplined, manage risk.
What’s your bias going into the decision?
#FedWatch #FOMC #BitcoinETFs #crypto #fedratewatch
$BTC
{spot}(BTCUSDT)
$BTC 🚨 Fed Decision Today | CME FedWatch Update
Markets are pricing in a 92-93% chance of a 25bps rate hike (first since 2023). Target range expected to move from 3.50-3.75% → 3.75-4.00%.
Bitcoin is trading near $75k–$76k after recent selling pressure. The hike itself is largely priced in — the real market mover will be the Dot Plot and Chair Warsh’s tone in the press conference.
Possible scenarios for Crypto:
• Soft guidance after hike → possible relief bounce
• Hawkish outlook → further downside pressure
• Surprise hold → sharp upside reaction
Volatility expected. Stay disciplined, manage risk.
What’s your bias going into the decision?
#FedWatch #FOMC #BitcoinETFs #crypto #fedratewatch
$BTC
Markets are pricing in a 92-93% chance of a 25bps rate hike (first since 2023). Target range expected to move from 3.50-3.75% → 3.75-4.00%.
Bitcoin is trading near $75k–$76k after recent selling pressure. The hike itself is largely priced in — the real market mover will be the Dot Plot and Chair Warsh’s tone in the press conference.
Possible scenarios for Crypto:
• Soft guidance after hike → possible relief bounce
• Hawkish outlook → further downside pressure
• Surprise hold → sharp upside reaction
Volatility expected. Stay disciplined, manage risk.
What’s your bias going into the decision?
#FedWatch #FOMC #BitcoinETFs #crypto #fedratewatch
$BTC
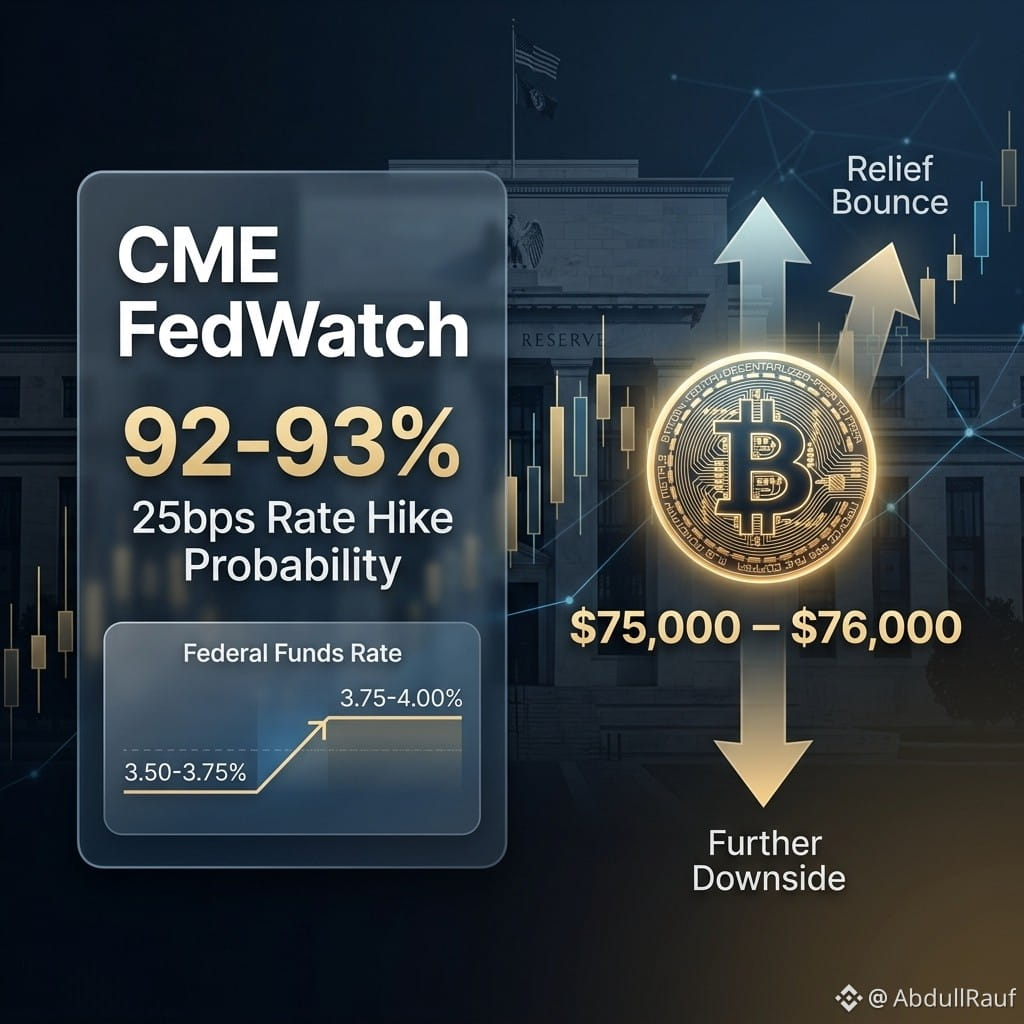
1
1
235
·
--
Проверено

Статья
ARB Up 17.85% as $13M Unlock Looms: A Rare Relative Strength SignalYou've probably noticed the tape getting ugly again. Bitcoin slipped toward and briefly under $75K, most altcoins are bleeding 4-10%, and the broader Layer 2 complex has been soft. Yet Arbitrum's ARB token is doing something different. It just posted a sharp double-digit gain roughly in the 12-16% range depending on the exact window while peers lagged. The move lands right as a scheduled unlock of about 92.65 million ARB (valued near $13-14 million at current prices, or roughly 1.4% of market value) hits on September 16.
That combination is unusual. Tokens typically weaken into unlocks as traders price in fresh supply. When price strengthens instead, it forces a closer look. Here's what I'm seeing.
Why Now
The broader market is in a cautious mood. Bitcoin has been under pressure, trading around the mid-$75Ks after dipping lower, with total crypto market cap taking a hit. The Fear & Greed Index sits near 51-52—neutral territory after swinging around recently. Most altcoins are down. Layer 2 names as a group have averaged losses in the mid-single digits. Against that backdrop, ARB's relative strength stands out.
On-chain and flow data add texture. Volume has expanded meaningfully on the up move, and the token has held above key short-term levels near $0.15 even as the unlock approaches. The tokens unlocking today are primarily from team, advisors, and investor allocations under the original multi-year vesting schedule that began after the 2023 TGE. This is not a surprise cliff; it's part of the ongoing monthly drip that continues into 2027. Still, $13 million of new supply is real, and the market's willingness to bid into it is the signal worth examining.
What stands out to me is the divergence. In a risk-off tape, idiosyncratic demand usually needs a catalyst. ARB has had some fundamental tailwinds from Orbit-chain activity earlier in the month, but those had already been partially digested. The current move feels more like positioning into (or through) the supply event itself.
Technical & On-Chain View: Holding the Line Through Supply
Technically, the setup is straightforward but constructive. ARB has reclaimed and held the $0.15 zone with volume confirmation. That level now acts as near-term support. If it continues to hold through the unlock and the immediate aftermath, the path of least resistance stays higher toward recent swing highs. A clean break below would open room back toward the mid-$0.14s and retest deeper supports.
The outperformance versus the L2 sector average (down roughly 4%) points to something beyond pure beta. Relative strength in a hostile tape often reflects either informed accumulation or a squeeze of short positioning that had been built ahead of the known supply event. Open interest had expanded earlier in the rally, so both explanations are plausible.
On-chain, the practical question is simple: do the unlocked tokens move to exchanges or stay in vesting-related or foundation-linked wallets? Bridging large amounts to CEX deposit addresses would confirm sell pressure. Retention or gradual deployment into ecosystem activity would signal the opposite confidence that the current price still offers value relative to the network's trajectory. Early post-unlock flows will matter more than the headline number itself. Track the wallets associated with team and investor releases closely over the next 24-48 hours.
Fundamental / Tokenomics Angle: Relatively Benign Dilution
The size of this unlock is material but not extreme. At roughly 0.93% of total supply and about 1.4% of current market value, it sits on the lower end of recent L2 unlock events. Compare that with larger percentage releases seen in peers such as certain StarkNet or ZKsync tranches in prior cycles; ARB's monthly cadence has been more predictable and, on a relative basis, more digestible.
This matters because markets discount known, smaller, recurring supply differently from surprise cliffs. The Arbitrum vesting for team and investors has been running for years with a clear end date in 2027. Participants who wanted to sell into strength have had multiple prior windows. The fact that price is firming into this particular release suggests the marginal buyer still sees the remaining locked supply as manageable against the network's activity and competitive position among optimistic rollups.
That does not eliminate dilution risk future monthly unlocks continue but it does reframe today's event as closer to routine emission than a structural overhang. In a market that has punished heavier unlock calendars elsewhere, the relative calm around ARB is notable.
Risks, Opportunities & Practical Implications
The primary risk is straightforward: the unlock could still produce delayed selling. Insiders or early investors may wait for liquidity rather than dump immediately. If BTC resumes its decline or broader risk assets weaken further, ARB's relative strength can evaporate quickly. A failure to hold $0.15 would invalidate the constructive short-term thesis and open downside toward prior consolidation zones.
On the opportunity side, confirmed absorption of the supply price holding or advancing with volume while unlocked tokens do not flood exchanges would reinforce the relative strength signal. For traders focused on mid-cap ecosystem names, that setup favors selective long exposure with tight risk parameters around the support level. Positioning that anticipates a short squeeze if the expected sell pressure fails to materialize is higher-conviction but requires confirmation via order-book depth and on-chain flows.
Practically, this is a tape to watch rather than force. Size accordingly. Use the unlock window to observe rather than predict. Relative strength is valuable precisely because it is rare in risk-off conditions; treating it as automatic continuation is how traders get caught.
Balanced Takeaway
ARB's strength into a known supply event is the anti-pattern. Most tokens fade ahead of unlocks. When one does the opposite while the rest of the market and its peer group struggle, it warrants attention. The data so far price holding key levels, elevated volume, and a relatively modest dilution percentage points to either informed demand or short covering that has not yet fully played out.
None of this guarantees further upside. Markets can absorb supply one day and reject the next, especially with Bitcoin still fragile near $75K and sentiment only neutral. The next 48 hours of post-unlock flows and price action around $0.15 will tell us more than any pre-event narrative. For now, the divergence is real. Treat it as a live relative-strength setup that deserves monitoring, not a finished thesis.
$ARB
{spot}(ARBUSDT)
$BTC
{spot}(BTCUSDT)
ARB Up 17.85% as $13M Unlock Looms: A Rare Relative Strength Signal
You've probably noticed the tape getting ugly again. Bitcoin slipped toward and briefly under $75K, most altcoins are bleeding 4-10%, and the broader Layer 2 complex has been soft. Yet Arbitrum's ARB token is doing something different. It just posted a sharp double-digit gain roughly in the 12-16% range depending on the exact window while peers lagged. The move lands right as a scheduled unlock of about 92.65 million ARB (valued near $13-14 million at current prices, or roughly 1.4% of market value) hits on September 16.
That combination is unusual. Tokens typically weaken into unlocks as traders price in fresh supply. When price strengthens instead, it forces a closer look. Here's what I'm seeing.
Why Now
The broader market is in a cautious mood. Bitcoin has been under pressure, trading around the mid-$75Ks after dipping lower, with total crypto market cap taking a hit. The Fear & Greed Index sits near 51-52—neutral territory after swinging around recently. Most altcoins are down. Layer 2 names as a group have averaged losses in the mid-single digits. Against that backdrop, ARB's relative strength stands out.
On-chain and flow data add texture. Volume has expanded meaningfully on the up move, and the token has held above key short-term levels near $0.15 even as the unlock approaches. The tokens unlocking today are primarily from team, advisors, and investor allocations under the original multi-year vesting schedule that began after the 2023 TGE. This is not a surprise cliff; it's part of the ongoing monthly drip that continues into 2027. Still, $13 million of new supply is real, and the market's willingness to bid into it is the signal worth examining.
What stands out to me is the divergence. In a risk-off tape, idiosyncratic demand usually needs a catalyst. ARB has had some fundamental tailwinds from Orbit-chain activity earlier in the month, but those had already been partially digested. The current move feels more like positioning into (or through) the supply event itself.
Technical & On-Chain View: Holding the Line Through Supply
Technically, the setup is straightforward but constructive. ARB has reclaimed and held the $0.15 zone with volume confirmation. That level now acts as near-term support. If it continues to hold through the unlock and the immediate aftermath, the path of least resistance stays higher toward recent swing highs. A clean break below would open room back toward the mid-$0.14s and retest deeper supports.
The outperformance versus the L2 sector average (down roughly 4%) points to something beyond pure beta. Relative strength in a hostile tape often reflects either informed accumulation or a squeeze of short positioning that had been built ahead of the known supply event. Open interest had expanded earlier in the rally, so both explanations are plausible.
On-chain, the practical question is simple: do the unlocked tokens move to exchanges or stay in vesting-related or foundation-linked wallets? Bridging large amounts to CEX deposit addresses would confirm sell pressure. Retention or gradual deployment into ecosystem activity would signal the opposite confidence that the current price still offers value relative to the network's trajectory. Early post-unlock flows will matter more than the headline number itself. Track the wallets associated with team and investor releases closely over the next 24-48 hours.
Fundamental / Tokenomics Angle: Relatively Benign Dilution
The size of this unlock is material but not extreme. At roughly 0.93% of total supply and about 1.4% of current market value, it sits on the lower end of recent L2 unlock events. Compare that with larger percentage releases seen in peers such as certain StarkNet or ZKsync tranches in prior cycles; ARB's monthly cadence has been more predictable and, on a relative basis, more digestible.
This matters because markets discount known, smaller, recurring supply differently from surprise cliffs. The Arbitrum vesting for team and investors has been running for years with a clear end date in 2027. Participants who wanted to sell into strength have had multiple prior windows. The fact that price is firming into this particular release suggests the marginal buyer still sees the remaining locked supply as manageable against the network's activity and competitive position among optimistic rollups.
That does not eliminate dilution risk future monthly unlocks continue but it does reframe today's event as closer to routine emission than a structural overhang. In a market that has punished heavier unlock calendars elsewhere, the relative calm around ARB is notable.
Risks, Opportunities & Practical Implications
The primary risk is straightforward: the unlock could still produce delayed selling. Insiders or early investors may wait for liquidity rather than dump immediately. If BTC resumes its decline or broader risk assets weaken further, ARB's relative strength can evaporate quickly. A failure to hold $0.15 would invalidate the constructive short-term thesis and open downside toward prior consolidation zones.
On the opportunity side, confirmed absorption of the supply price holding or advancing with volume while unlocked tokens do not flood exchanges would reinforce the relative strength signal. For traders focused on mid-cap ecosystem names, that setup favors selective long exposure with tight risk parameters around the support level. Positioning that anticipates a short squeeze if the expected sell pressure fails to materialize is higher-conviction but requires confirmation via order-book depth and on-chain flows.
Practically, this is a tape to watch rather than force. Size accordingly. Use the unlock window to observe rather than predict. Relative strength is valuable precisely because it is rare in risk-off conditions; treating it as automatic continuation is how traders get caught.
Balanced Takeaway
ARB's strength into a known supply event is the anti-pattern. Most tokens fade ahead of unlocks. When one does the opposite while the rest of the market and its peer group struggle, it warrants attention. The data so far price holding key levels, elevated volume, and a relatively modest dilution percentage points to either informed demand or short covering that has not yet fully played out.
None of this guarantees further upside. Markets can absorb supply one day and reject the next, especially with Bitcoin still fragile near $75K and sentiment only neutral. The next 48 hours of post-unlock flows and price action around $0.15 will tell us more than any pre-event narrative. For now, the divergence is real. Treat it as a live relative-strength setup that deserves monitoring, not a finished thesis.
$ARB
$BTC
That combination is unusual. Tokens typically weaken into unlocks as traders price in fresh supply. When price strengthens instead, it forces a closer look. Here's what I'm seeing.
Why Now
The broader market is in a cautious mood. Bitcoin has been under pressure, trading around the mid-$75Ks after dipping lower, with total crypto market cap taking a hit. The Fear & Greed Index sits near 51-52—neutral territory after swinging around recently. Most altcoins are down. Layer 2 names as a group have averaged losses in the mid-single digits. Against that backdrop, ARB's relative strength stands out.
On-chain and flow data add texture. Volume has expanded meaningfully on the up move, and the token has held above key short-term levels near $0.15 even as the unlock approaches. The tokens unlocking today are primarily from team, advisors, and investor allocations under the original multi-year vesting schedule that began after the 2023 TGE. This is not a surprise cliff; it's part of the ongoing monthly drip that continues into 2027. Still, $13 million of new supply is real, and the market's willingness to bid into it is the signal worth examining.
What stands out to me is the divergence. In a risk-off tape, idiosyncratic demand usually needs a catalyst. ARB has had some fundamental tailwinds from Orbit-chain activity earlier in the month, but those had already been partially digested. The current move feels more like positioning into (or through) the supply event itself.
Technical & On-Chain View: Holding the Line Through Supply
Technically, the setup is straightforward but constructive. ARB has reclaimed and held the $0.15 zone with volume confirmation. That level now acts as near-term support. If it continues to hold through the unlock and the immediate aftermath, the path of least resistance stays higher toward recent swing highs. A clean break below would open room back toward the mid-$0.14s and retest deeper supports.
The outperformance versus the L2 sector average (down roughly 4%) points to something beyond pure beta. Relative strength in a hostile tape often reflects either informed accumulation or a squeeze of short positioning that had been built ahead of the known supply event. Open interest had expanded earlier in the rally, so both explanations are plausible.
On-chain, the practical question is simple: do the unlocked tokens move to exchanges or stay in vesting-related or foundation-linked wallets? Bridging large amounts to CEX deposit addresses would confirm sell pressure. Retention or gradual deployment into ecosystem activity would signal the opposite confidence that the current price still offers value relative to the network's trajectory. Early post-unlock flows will matter more than the headline number itself. Track the wallets associated with team and investor releases closely over the next 24-48 hours.
Fundamental / Tokenomics Angle: Relatively Benign Dilution
The size of this unlock is material but not extreme. At roughly 0.93% of total supply and about 1.4% of current market value, it sits on the lower end of recent L2 unlock events. Compare that with larger percentage releases seen in peers such as certain StarkNet or ZKsync tranches in prior cycles; ARB's monthly cadence has been more predictable and, on a relative basis, more digestible.
This matters because markets discount known, smaller, recurring supply differently from surprise cliffs. The Arbitrum vesting for team and investors has been running for years with a clear end date in 2027. Participants who wanted to sell into strength have had multiple prior windows. The fact that price is firming into this particular release suggests the marginal buyer still sees the remaining locked supply as manageable against the network's activity and competitive position among optimistic rollups.
That does not eliminate dilution risk future monthly unlocks continue but it does reframe today's event as closer to routine emission than a structural overhang. In a market that has punished heavier unlock calendars elsewhere, the relative calm around ARB is notable.
Risks, Opportunities & Practical Implications
The primary risk is straightforward: the unlock could still produce delayed selling. Insiders or early investors may wait for liquidity rather than dump immediately. If BTC resumes its decline or broader risk assets weaken further, ARB's relative strength can evaporate quickly. A failure to hold $0.15 would invalidate the constructive short-term thesis and open downside toward prior consolidation zones.
On the opportunity side, confirmed absorption of the supply price holding or advancing with volume while unlocked tokens do not flood exchanges would reinforce the relative strength signal. For traders focused on mid-cap ecosystem names, that setup favors selective long exposure with tight risk parameters around the support level. Positioning that anticipates a short squeeze if the expected sell pressure fails to materialize is higher-conviction but requires confirmation via order-book depth and on-chain flows.
Practically, this is a tape to watch rather than force. Size accordingly. Use the unlock window to observe rather than predict. Relative strength is valuable precisely because it is rare in risk-off conditions; treating it as automatic continuation is how traders get caught.
Balanced Takeaway
ARB's strength into a known supply event is the anti-pattern. Most tokens fade ahead of unlocks. When one does the opposite while the rest of the market and its peer group struggle, it warrants attention. The data so far price holding key levels, elevated volume, and a relatively modest dilution percentage points to either informed demand or short covering that has not yet fully played out.
None of this guarantees further upside. Markets can absorb supply one day and reject the next, especially with Bitcoin still fragile near $75K and sentiment only neutral. The next 48 hours of post-unlock flows and price action around $0.15 will tell us more than any pre-event narrative. For now, the divergence is real. Treat it as a live relative-strength setup that deserves monitoring, not a finished thesis.
$ARB
$BTC
4
582
·
--
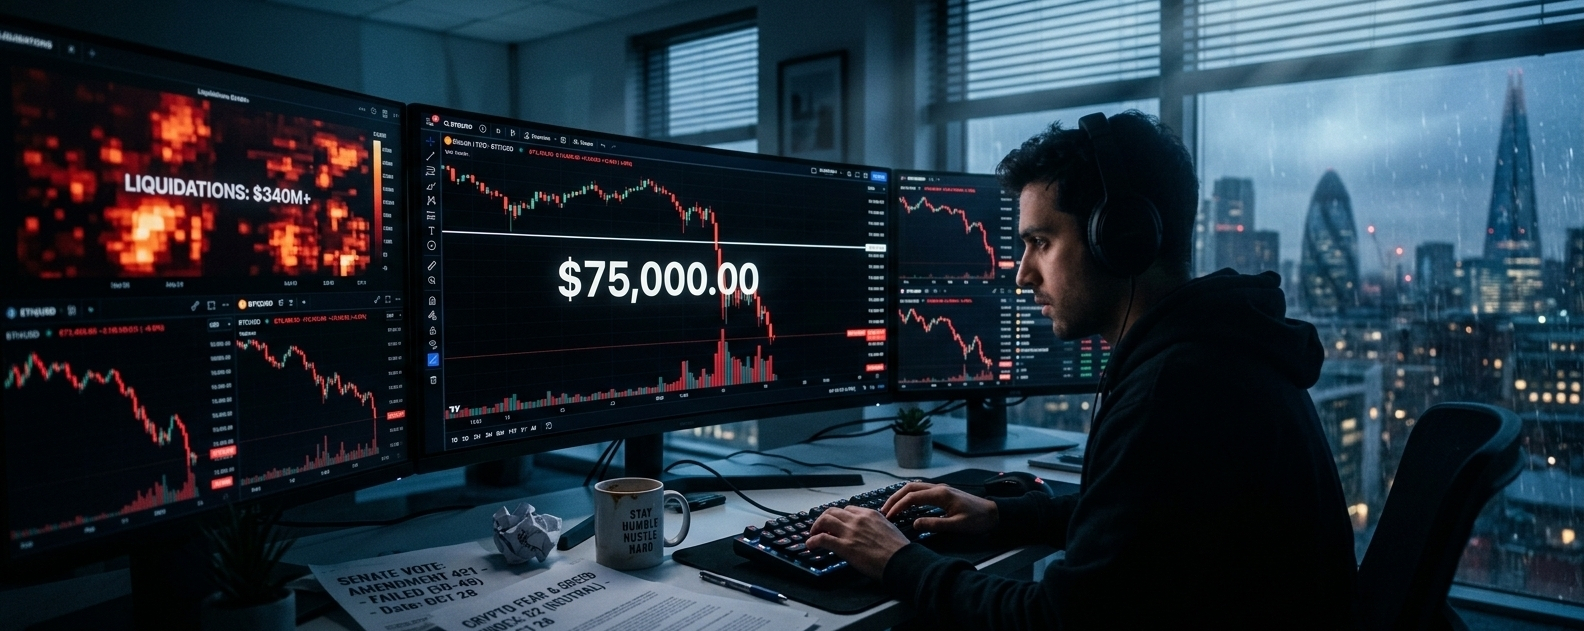
Статья
CLARITY Act Fails: $635M Liquidations as BTC Drops Below $75KYou’ve probably felt it in the order books already. One moment Bitcoin was grinding toward another test of the mid-$70Ks with the usual post-summer optimism, the next it was slicing through $75,000 like the level never mattered. The CLARITY Act’s failure in the Senate wasn’t just political theater. It yanked the last near-term regulatory catalyst off the table and left a lot of leveraged positioning suddenly looking very exposed.
The vote came in at 50-49, well short of the 60 needed to advance. Four Republicans joined a unified Democratic wall, and just like that the most comprehensive market-structure bill crypto has ever seen is effectively on ice until at least 2027. Markets didn’t wait for the spin. Bitcoin briefly traded under $75K, total liquidations hit roughly $635 million in 24 hours, and 115,716 traders got carried out. BTC longs took the brunt at $224 million; ETH wasn’t far behind at $212 million. The Crypto Fear & Greed Index dropped 16 points to 52 Neutral after weeks of sitting in comfortable greed territory. That kind of sentiment reversal doesn’t happen in a vacuum.
Why This Hits Different Right Now
Let me explain why this matters more than the usual Washington noise. For months the bull case leaned heavily on the idea that clearer rules would unlock the next wave of institutional capital. Spot ETF flows had been patchy but still directionally constructive. Longs had been accumulating in the $73K–$76K zone, treating every dip as opportunity. Funding rates stayed modestly positive around +0.0089% aggregate well below the 0.03–0.05% levels that historically flag crowded, cascade-ready positioning. That kept the market from looking wildly overleveraged on the surface.
Then the procedural vote failed. Suddenly the “regulatory clarity by year-end” narrative evaporated. At the same time, Binance BTC reserves had climbed to 691,658 on September 2, sitting near two-year highs. That’s a visible supply overhang. When exchange balances push that high, the market needs sustained spot demand above key levels think $83K and higher to absorb it without repeated tests of support. We’re not seeing that absorption yet. The failed breakout above $76K looks less like a clean rejection and more like a liquidity sweep of the recent long accumulation zones. Price tagged the stops, flushed some of the leverage, and left the rest of the positioning intact. That’s the uncomfortable part.
Technical & On-Chain: Liquidity Sweep, Not Full Flush
Here’s what I’m seeing on the charts and the chain. The move below $75K wasn’t random. It cleaned out a dense cluster of long liquidations that had built up after the summer grind higher. Funding remaining positive but subdued tells you the market still has dry powder on the long side. Historically, the real cascade events tend to arrive when funding spikes into that 0.03–0.05% range and stays there while price starts rolling over. We’re not there yet. That leaves room for a second wave if $73K gives way.
On-chain, the Binance reserve number stands out. Near two-year highs creates a structural headwind until those coins either move into cold storage or get absorbed by genuine spot buyers. Whale wallets haven’t shown aggressive accumulation at these levels the way they did in prior cycles. Exchange inflows spiked into the drop, consistent with profit-taking and forced selling rather than panic. The data suggests this was more of a tactical liquidity reset than the start of a full structural downtrend—so far. But the absence of a sharper funding spike means the flush isn’t complete. Watch the $73K–$74K zone closely. A clean break there with rising open interest on the short side would change the character of the move.
Fundamental Reality Check: The Regulatory Vacuum Just Got Longer
The CLARITY Act wasn’t perfect. No piece of legislation that tries to draw bright lines between securities and commodities ever is. But it was the closest thing the industry had to a comprehensive market-structure framework. Its failure doesn’t just delay clarity—it extends the regulatory vacuum that has kept many traditional institutions on the sidelines. Banks, asset managers, and pensions still face ambiguous guidance on custody, staking, and token classification. That uncertainty has a cost. It shows up in slower capital formation and thinner secondary market depth when volatility hits.
Some will argue the bill’s death is actually bullish long-term because it forces the industry to keep building under existing rules and prove resilience. There’s a kernel of truth there. Crypto has survived worse regulatory winters. Yet the practical effect right now is the removal of a key catalyst from the near-term bull case. Institutions that were waiting for legislative cover have another reason to stay cautious. That doesn’t mean capital never arrives—it just means the timeline stretches and the path gets bumpier.
Risks, Opportunities & What Traders Should Actually Watch
The obvious risk is a second liquidation wave. If price loses $73K with funding still positive and open interest elevated, the cascade can accelerate quickly. Macro isn’t helping either. Higher Treasury yields and sticky inflation expectations keep the Fed narrative alive as a headwind. On the opportunity side, a proper flush that drives funding negative and Fear & Greed deeper into fear territory has historically marked better risk-reward entries for patient capital. The supply overhang on Binance is real, but so is the fact that long-term holder supply remains relatively sticky.
Practically, this is a market that rewards tighter risk management over conviction. Position sizing matters more than directional calls when the catalyst that many were leaning on disappears overnight. Watch the relationship between spot volume and futures funding over the next few sessions. Sustained spot absorption above $76K would be the first sign the liquidity sweep is complete. Failure to reclaim that level keeps the door open for deeper tests.
Looking Ahead Without the Hype
The legislative failure removes one of the cleaner bullish narratives from the table. That much is clear. What stands out to me is how orderly the initial flush remained. Funding didn’t explode higher, liquidations were significant but not historic by 2022 standards, and the Fear & Greed Index only made it back to neutral. That combination usually means the market still has work to do on the downside before a durable low forms.
None of this precludes a recovery. Markets can and do climb walls of worry. But the path just got less straightforward. The regulatory vacuum is longer, the supply on exchanges is elevated, and leveraged longs haven’t been fully cleaned out. For pro traders and institutional desks, the next few weeks are about watching whether this stays a tactical reset or morphs into something more structural. Price action around $73K and the behavior of funding rates will tell that story clearer than any headline.
$BTC
{spot}(BTCUSDT)
#FedRateWatch #ClarityActOddsHalveOnPolymarket #BitcoinSlidesTo$76000 #BTC走势分析
CLARITY Act Fails: $635M Liquidations as BTC Drops Below $75K
You’ve probably felt it in the order books already. One moment Bitcoin was grinding toward another test of the mid-$70Ks with the usual post-summer optimism, the next it was slicing through $75,000 like the level never mattered. The CLARITY Act’s failure in the Senate wasn’t just political theater. It yanked the last near-term regulatory catalyst off the table and left a lot of leveraged positioning suddenly looking very exposed.
The vote came in at 50-49, well short of the 60 needed to advance. Four Republicans joined a unified Democratic wall, and just like that the most comprehensive market-structure bill crypto has ever seen is effectively on ice until at least 2027. Markets didn’t wait for the spin. Bitcoin briefly traded under $75K, total liquidations hit roughly $635 million in 24 hours, and 115,716 traders got carried out. BTC longs took the brunt at $224 million; ETH wasn’t far behind at $212 million. The Crypto Fear & Greed Index dropped 16 points to 52 Neutral after weeks of sitting in comfortable greed territory. That kind of sentiment reversal doesn’t happen in a vacuum.
Why This Hits Different Right Now
Let me explain why this matters more than the usual Washington noise. For months the bull case leaned heavily on the idea that clearer rules would unlock the next wave of institutional capital. Spot ETF flows had been patchy but still directionally constructive. Longs had been accumulating in the $73K–$76K zone, treating every dip as opportunity. Funding rates stayed modestly positive around +0.0089% aggregate well below the 0.03–0.05% levels that historically flag crowded, cascade-ready positioning. That kept the market from looking wildly overleveraged on the surface.
Then the procedural vote failed. Suddenly the “regulatory clarity by year-end” narrative evaporated. At the same time, Binance BTC reserves had climbed to 691,658 on September 2, sitting near two-year highs. That’s a visible supply overhang. When exchange balances push that high, the market needs sustained spot demand above key levels think $83K and higher to absorb it without repeated tests of support. We’re not seeing that absorption yet. The failed breakout above $76K looks less like a clean rejection and more like a liquidity sweep of the recent long accumulation zones. Price tagged the stops, flushed some of the leverage, and left the rest of the positioning intact. That’s the uncomfortable part.
Technical & On-Chain: Liquidity Sweep, Not Full Flush
Here’s what I’m seeing on the charts and the chain. The move below $75K wasn’t random. It cleaned out a dense cluster of long liquidations that had built up after the summer grind higher. Funding remaining positive but subdued tells you the market still has dry powder on the long side. Historically, the real cascade events tend to arrive when funding spikes into that 0.03–0.05% range and stays there while price starts rolling over. We’re not there yet. That leaves room for a second wave if $73K gives way.
On-chain, the Binance reserve number stands out. Near two-year highs creates a structural headwind until those coins either move into cold storage or get absorbed by genuine spot buyers. Whale wallets haven’t shown aggressive accumulation at these levels the way they did in prior cycles. Exchange inflows spiked into the drop, consistent with profit-taking and forced selling rather than panic. The data suggests this was more of a tactical liquidity reset than the start of a full structural downtrend—so far. But the absence of a sharper funding spike means the flush isn’t complete. Watch the $73K–$74K zone closely. A clean break there with rising open interest on the short side would change the character of the move.
Fundamental Reality Check: The Regulatory Vacuum Just Got Longer
The CLARITY Act wasn’t perfect. No piece of legislation that tries to draw bright lines between securities and commodities ever is. But it was the closest thing the industry had to a comprehensive market-structure framework. Its failure doesn’t just delay clarity—it extends the regulatory vacuum that has kept many traditional institutions on the sidelines. Banks, asset managers, and pensions still face ambiguous guidance on custody, staking, and token classification. That uncertainty has a cost. It shows up in slower capital formation and thinner secondary market depth when volatility hits.
Some will argue the bill’s death is actually bullish long-term because it forces the industry to keep building under existing rules and prove resilience. There’s a kernel of truth there. Crypto has survived worse regulatory winters. Yet the practical effect right now is the removal of a key catalyst from the near-term bull case. Institutions that were waiting for legislative cover have another reason to stay cautious. That doesn’t mean capital never arrives—it just means the timeline stretches and the path gets bumpier.
Risks, Opportunities & What Traders Should Actually Watch
The obvious risk is a second liquidation wave. If price loses $73K with funding still positive and open interest elevated, the cascade can accelerate quickly. Macro isn’t helping either. Higher Treasury yields and sticky inflation expectations keep the Fed narrative alive as a headwind. On the opportunity side, a proper flush that drives funding negative and Fear & Greed deeper into fear territory has historically marked better risk-reward entries for patient capital. The supply overhang on Binance is real, but so is the fact that long-term holder supply remains relatively sticky.
Practically, this is a market that rewards tighter risk management over conviction. Position sizing matters more than directional calls when the catalyst that many were leaning on disappears overnight. Watch the relationship between spot volume and futures funding over the next few sessions. Sustained spot absorption above $76K would be the first sign the liquidity sweep is complete. Failure to reclaim that level keeps the door open for deeper tests.
Looking Ahead Without the Hype
The legislative failure removes one of the cleaner bullish narratives from the table. That much is clear. What stands out to me is how orderly the initial flush remained. Funding didn’t explode higher, liquidations were significant but not historic by 2022 standards, and the Fear & Greed Index only made it back to neutral. That combination usually means the market still has work to do on the downside before a durable low forms.
None of this precludes a recovery. Markets can and do climb walls of worry. But the path just got less straightforward. The regulatory vacuum is longer, the supply on exchanges is elevated, and leveraged longs haven’t been fully cleaned out. For pro traders and institutional desks, the next few weeks are about watching whether this stays a tactical reset or morphs into something more structural. Price action around $73K and the behavior of funding rates will tell that story clearer than any headline.
$BTC
#FedRateWatch #ClarityActOddsHalveOnPolymarket #BitcoinSlidesTo$76000 #BTC走势分析
The vote came in at 50-49, well short of the 60 needed to advance. Four Republicans joined a unified Democratic wall, and just like that the most comprehensive market-structure bill crypto has ever seen is effectively on ice until at least 2027. Markets didn’t wait for the spin. Bitcoin briefly traded under $75K, total liquidations hit roughly $635 million in 24 hours, and 115,716 traders got carried out. BTC longs took the brunt at $224 million; ETH wasn’t far behind at $212 million. The Crypto Fear & Greed Index dropped 16 points to 52 Neutral after weeks of sitting in comfortable greed territory. That kind of sentiment reversal doesn’t happen in a vacuum.
Why This Hits Different Right Now
Let me explain why this matters more than the usual Washington noise. For months the bull case leaned heavily on the idea that clearer rules would unlock the next wave of institutional capital. Spot ETF flows had been patchy but still directionally constructive. Longs had been accumulating in the $73K–$76K zone, treating every dip as opportunity. Funding rates stayed modestly positive around +0.0089% aggregate well below the 0.03–0.05% levels that historically flag crowded, cascade-ready positioning. That kept the market from looking wildly overleveraged on the surface.
Then the procedural vote failed. Suddenly the “regulatory clarity by year-end” narrative evaporated. At the same time, Binance BTC reserves had climbed to 691,658 on September 2, sitting near two-year highs. That’s a visible supply overhang. When exchange balances push that high, the market needs sustained spot demand above key levels think $83K and higher to absorb it without repeated tests of support. We’re not seeing that absorption yet. The failed breakout above $76K looks less like a clean rejection and more like a liquidity sweep of the recent long accumulation zones. Price tagged the stops, flushed some of the leverage, and left the rest of the positioning intact. That’s the uncomfortable part.
Technical & On-Chain: Liquidity Sweep, Not Full Flush
Here’s what I’m seeing on the charts and the chain. The move below $75K wasn’t random. It cleaned out a dense cluster of long liquidations that had built up after the summer grind higher. Funding remaining positive but subdued tells you the market still has dry powder on the long side. Historically, the real cascade events tend to arrive when funding spikes into that 0.03–0.05% range and stays there while price starts rolling over. We’re not there yet. That leaves room for a second wave if $73K gives way.
On-chain, the Binance reserve number stands out. Near two-year highs creates a structural headwind until those coins either move into cold storage or get absorbed by genuine spot buyers. Whale wallets haven’t shown aggressive accumulation at these levels the way they did in prior cycles. Exchange inflows spiked into the drop, consistent with profit-taking and forced selling rather than panic. The data suggests this was more of a tactical liquidity reset than the start of a full structural downtrend—so far. But the absence of a sharper funding spike means the flush isn’t complete. Watch the $73K–$74K zone closely. A clean break there with rising open interest on the short side would change the character of the move.
Fundamental Reality Check: The Regulatory Vacuum Just Got Longer
The CLARITY Act wasn’t perfect. No piece of legislation that tries to draw bright lines between securities and commodities ever is. But it was the closest thing the industry had to a comprehensive market-structure framework. Its failure doesn’t just delay clarity—it extends the regulatory vacuum that has kept many traditional institutions on the sidelines. Banks, asset managers, and pensions still face ambiguous guidance on custody, staking, and token classification. That uncertainty has a cost. It shows up in slower capital formation and thinner secondary market depth when volatility hits.
Some will argue the bill’s death is actually bullish long-term because it forces the industry to keep building under existing rules and prove resilience. There’s a kernel of truth there. Crypto has survived worse regulatory winters. Yet the practical effect right now is the removal of a key catalyst from the near-term bull case. Institutions that were waiting for legislative cover have another reason to stay cautious. That doesn’t mean capital never arrives—it just means the timeline stretches and the path gets bumpier.
Risks, Opportunities & What Traders Should Actually Watch
The obvious risk is a second liquidation wave. If price loses $73K with funding still positive and open interest elevated, the cascade can accelerate quickly. Macro isn’t helping either. Higher Treasury yields and sticky inflation expectations keep the Fed narrative alive as a headwind. On the opportunity side, a proper flush that drives funding negative and Fear & Greed deeper into fear territory has historically marked better risk-reward entries for patient capital. The supply overhang on Binance is real, but so is the fact that long-term holder supply remains relatively sticky.
Practically, this is a market that rewards tighter risk management over conviction. Position sizing matters more than directional calls when the catalyst that many were leaning on disappears overnight. Watch the relationship between spot volume and futures funding over the next few sessions. Sustained spot absorption above $76K would be the first sign the liquidity sweep is complete. Failure to reclaim that level keeps the door open for deeper tests.
Looking Ahead Without the Hype
The legislative failure removes one of the cleaner bullish narratives from the table. That much is clear. What stands out to me is how orderly the initial flush remained. Funding didn’t explode higher, liquidations were significant but not historic by 2022 standards, and the Fear & Greed Index only made it back to neutral. That combination usually means the market still has work to do on the downside before a durable low forms.
None of this precludes a recovery. Markets can and do climb walls of worry. But the path just got less straightforward. The regulatory vacuum is longer, the supply on exchanges is elevated, and leveraged longs haven’t been fully cleaned out. For pro traders and institutional desks, the next few weeks are about watching whether this stays a tactical reset or morphs into something more structural. Price action around $73K and the behavior of funding rates will tell that story clearer than any headline.
$BTC
#FedRateWatch #ClarityActOddsHalveOnPolymarket #BitcoinSlidesTo$76000 #BTC走势分析
3
253
·
--
$DASH /USDT Long Scalp Setup
Price has confirmed a local bottom at 52.59. Buying on a pullback provides an optimal Risk-to-Reward ratio.
Best Entry Zone: 52.80 – 53.10 (On a retest of 5 EMA)
Stop Loss (SL): Below 52.40 (Exit immediately if a 15m candle closes below the 52.59 low)
Take Profit Targets:
TP 1: 54.65
TP 2: 55.05
TP 3: 55.78
$DASH /USDT Long Scalp Setup
Price has confirmed a local bottom at 52.59. Buying on a pullback provides an optimal Risk-to-Reward ratio.
Best Entry Zone: 52.80 – 53.10 (On a retest of 5 EMA)
Stop Loss (SL): Below 52.40 (Exit immediately if a 15m candle closes below the 52.59 low)
Take Profit Targets:
TP 1: 54.65
TP 2: 55.05
TP 3: 55.78
Price has confirmed a local bottom at 52.59. Buying on a pullback provides an optimal Risk-to-Reward ratio.
Best Entry Zone: 52.80 – 53.10 (On a retest of 5 EMA)
Stop Loss (SL): Below 52.40 (Exit immediately if a 15m candle closes below the 52.59 low)
Take Profit Targets:
TP 1: 54.65
TP 2: 55.05
TP 3: 55.78
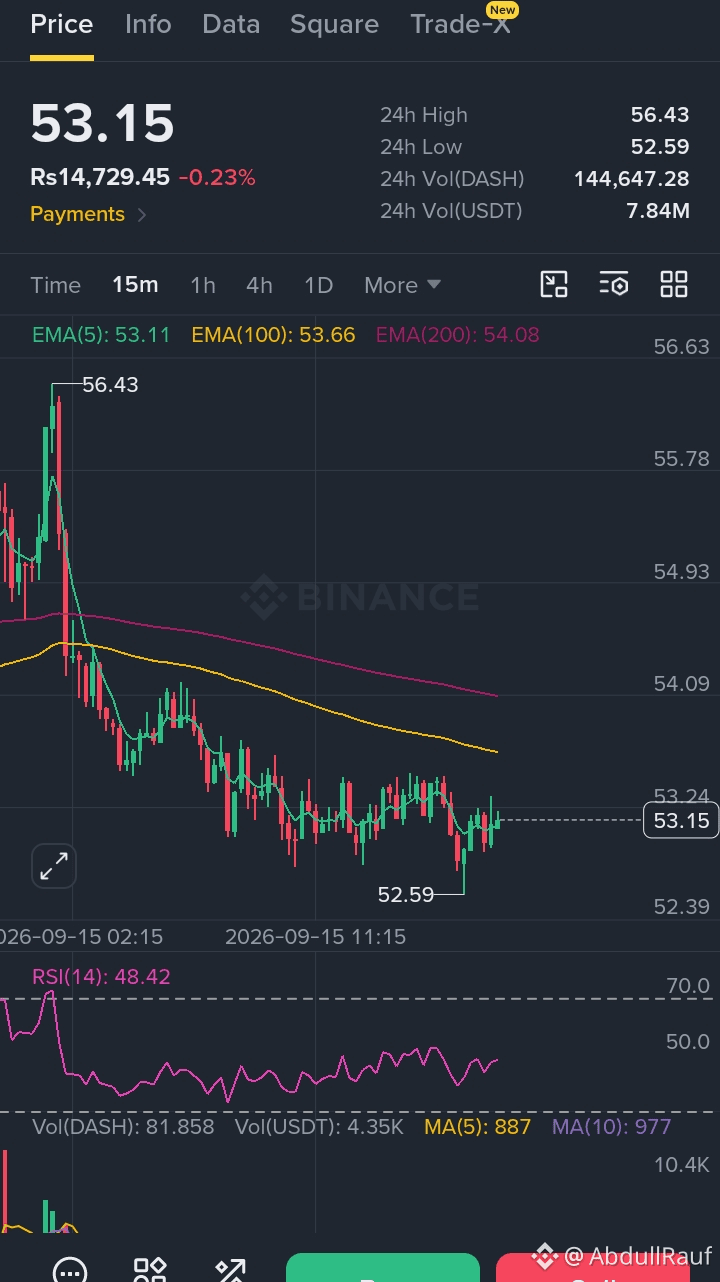
1
401
·
--
Проверено
Impact of Strong Jobs + CPI on Stocks and Gold
August added 162,000 jobs — while the average over the previous 12 months was only around 31,000. That’s a significant difference.
The key question now is how today’s CPI will move the markets.
If CPI comes in lower, rate-hike fears ease and stocks could rise. Technology and growth stocks would likely benefit the most.
If CPI comes in hotter, rate-hike odds increase and stocks especially growth names could face pressure.
Gold usually moves inversely. A hotter CPI tends to strengthen the dollar and weigh on gold. A cooler CPI can weaken the dollar and support gold.
Jobs are strong, but inflation has been showing gradual signs of cooling. These two signals are making the Fed’s decision more complicated. Today’s CPI will play an important role in clarifying the picture.
What will be your first reaction after today’s CPI release?
#CPIWatch #cpi #CPIdata $NVDAB $XAU $BTC
Impact of Strong Jobs + CPI on Stocks and Gold
August added 162,000 jobs — while the average over the previous 12 months was only around 31,000. That’s a significant difference.
The key question now is how today’s CPI will move the markets.
If CPI comes in lower, rate-hike fears ease and stocks could rise. Technology and growth stocks would likely benefit the most.
If CPI comes in hotter, rate-hike odds increase and stocks especially growth names could face pressure.
Gold usually moves inversely. A hotter CPI tends to strengthen the dollar and weigh on gold. A cooler CPI can weaken the dollar and support gold.
Jobs are strong, but inflation has been showing gradual signs of cooling. These two signals are making the Fed’s decision more complicated. Today’s CPI will play an important role in clarifying the picture.
What will be your first reaction after today’s CPI release?
#CPIWatch #cpi #CPIdata $NVDAB $XAU $BTC
August added 162,000 jobs — while the average over the previous 12 months was only around 31,000. That’s a significant difference.
The key question now is how today’s CPI will move the markets.
If CPI comes in lower, rate-hike fears ease and stocks could rise. Technology and growth stocks would likely benefit the most.
If CPI comes in hotter, rate-hike odds increase and stocks especially growth names could face pressure.
Gold usually moves inversely. A hotter CPI tends to strengthen the dollar and weigh on gold. A cooler CPI can weaken the dollar and support gold.
Jobs are strong, but inflation has been showing gradual signs of cooling. These two signals are making the Fed’s decision more complicated. Today’s CPI will play an important role in clarifying the picture.
What will be your first reaction after today’s CPI release?
#CPIWatch #cpi #CPIdata $NVDAB $XAU $BTC

5
10
664
·
--
$VVV Hits $28 After Massive 59% Surge – Is This Sustainable?
Looking at the VVVUSDT chart right now:
Last Price: 28.101
24h Change: +59.19%
24h High: 29.289
24h Low: 17.647
24h Volume: Over $505 Million
The chart shows a powerful rally from the 17.5 area, with price currently holding above the short-term moving averages (MA7 at 27.62 and MA25 at 26.16). RSI is at 66.9 — elevated but not yet in extreme overbought territory.
The move is backed by strong volume and real catalysts (token burns + emission cuts + growing AI platform usage). This is not a low-volume pump. However, after a nearly 60% move in a single day, short-term profit-taking or a healthy pullback is very possible. Traders already in profit can consider trailing stops or partial booking. New entries at current levels carry higher risk — waiting for a retest of the 26–27 zone might offer a better risk-reward.
I’m watching $VVV with interest due to its solid fundamentals in the AI + privacy narrative, but I’m not chasing this candle blindly.
What’s your view? Do you think it continues higher or do we see a correction first?
Follow for more balanced market analysis.
$VVV #VeniceToken #Aİ
$VVV Hits $28 After Massive 59% Surge – Is This Sustainable?
Looking at the VVVUSDT chart right now:
Last Price: 28.101
24h Change: +59.19%
24h High: 29.289
24h Low: 17.647
24h Volume: Over $505 Million
The chart shows a powerful rally from the 17.5 area, with price currently holding above the short-term moving averages (MA7 at 27.62 and MA25 at 26.16). RSI is at 66.9 — elevated but not yet in extreme overbought territory.
The move is backed by strong volume and real catalysts (token burns + emission cuts + growing AI platform usage). This is not a low-volume pump. However, after a nearly 60% move in a single day, short-term profit-taking or a healthy pullback is very possible. Traders already in profit can consider trailing stops or partial booking. New entries at current levels carry higher risk — waiting for a retest of the 26–27 zone might offer a better risk-reward.
I’m watching $VVV with interest due to its solid fundamentals in the AI + privacy narrative, but I’m not chasing this candle blindly.
What’s your view? Do you think it continues higher or do we see a correction first?
Follow for more balanced market analysis.
$VVV #VeniceToken #Aİ
Looking at the VVVUSDT chart right now:
Last Price: 28.101
24h Change: +59.19%
24h High: 29.289
24h Low: 17.647
24h Volume: Over $505 Million
The chart shows a powerful rally from the 17.5 area, with price currently holding above the short-term moving averages (MA7 at 27.62 and MA25 at 26.16). RSI is at 66.9 — elevated but not yet in extreme overbought territory.
The move is backed by strong volume and real catalysts (token burns + emission cuts + growing AI platform usage). This is not a low-volume pump. However, after a nearly 60% move in a single day, short-term profit-taking or a healthy pullback is very possible. Traders already in profit can consider trailing stops or partial booking. New entries at current levels carry higher risk — waiting for a retest of the 26–27 zone might offer a better risk-reward.
I’m watching $VVV with interest due to its solid fundamentals in the AI + privacy narrative, but I’m not chasing this candle blindly.
What’s your view? Do you think it continues higher or do we see a correction first?
Follow for more balanced market analysis.
$VVV #VeniceToken #Aİ
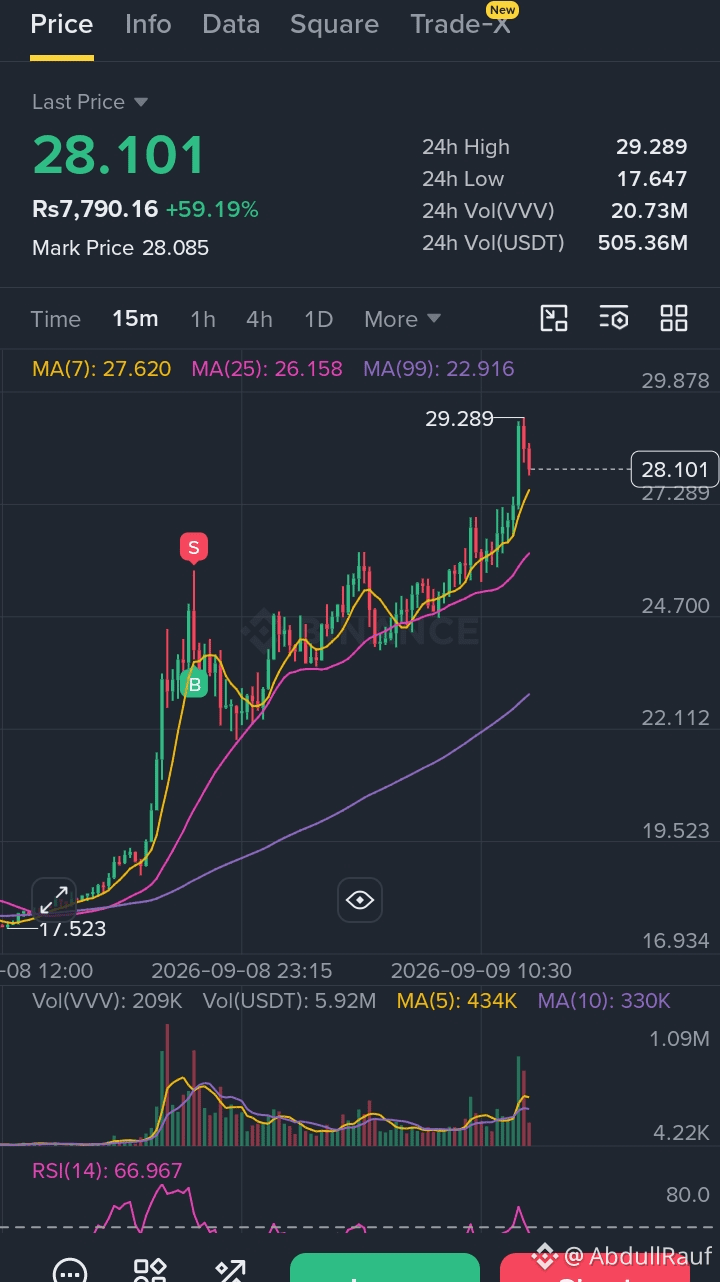
305
·
--
$TUT /USDT Entry Plan/ Long Scalp Setup)
Since a local bottom of 0.02401 has formed and the RSI on the 15m chart is moving upward, a tight scalping trade setup is available:
Best Entry Zone: 0.02430 – 0.02460 (If price takes a small pullback to retest the 5 EMA)
Stop Loss (SL): Below 0.02380 (Immediately close position if a 15m candle closes below the 0.02401 low)
Take Profit Targets:
Target 1 : 0.02540
Target 2 : 0.02580
Target 3 : 0.02640
$TUT /USDT Entry Plan/ Long Scalp Setup)
Since a local bottom of 0.02401 has formed and the RSI on the 15m chart is moving upward, a tight scalping trade setup is available:
Best Entry Zone: 0.02430 – 0.02460 (If price takes a small pullback to retest the 5 EMA)
Stop Loss (SL): Below 0.02380 (Immediately close position if a 15m candle closes below the 0.02401 low)
Take Profit Targets:
Target 1 : 0.02540
Target 2 : 0.02580
Target 3 : 0.02640
Since a local bottom of 0.02401 has formed and the RSI on the 15m chart is moving upward, a tight scalping trade setup is available:
Best Entry Zone: 0.02430 – 0.02460 (If price takes a small pullback to retest the 5 EMA)
Stop Loss (SL): Below 0.02380 (Immediately close position if a 15m candle closes below the 0.02401 low)
Take Profit Targets:
Target 1 : 0.02540
Target 2 : 0.02580
Target 3 : 0.02640
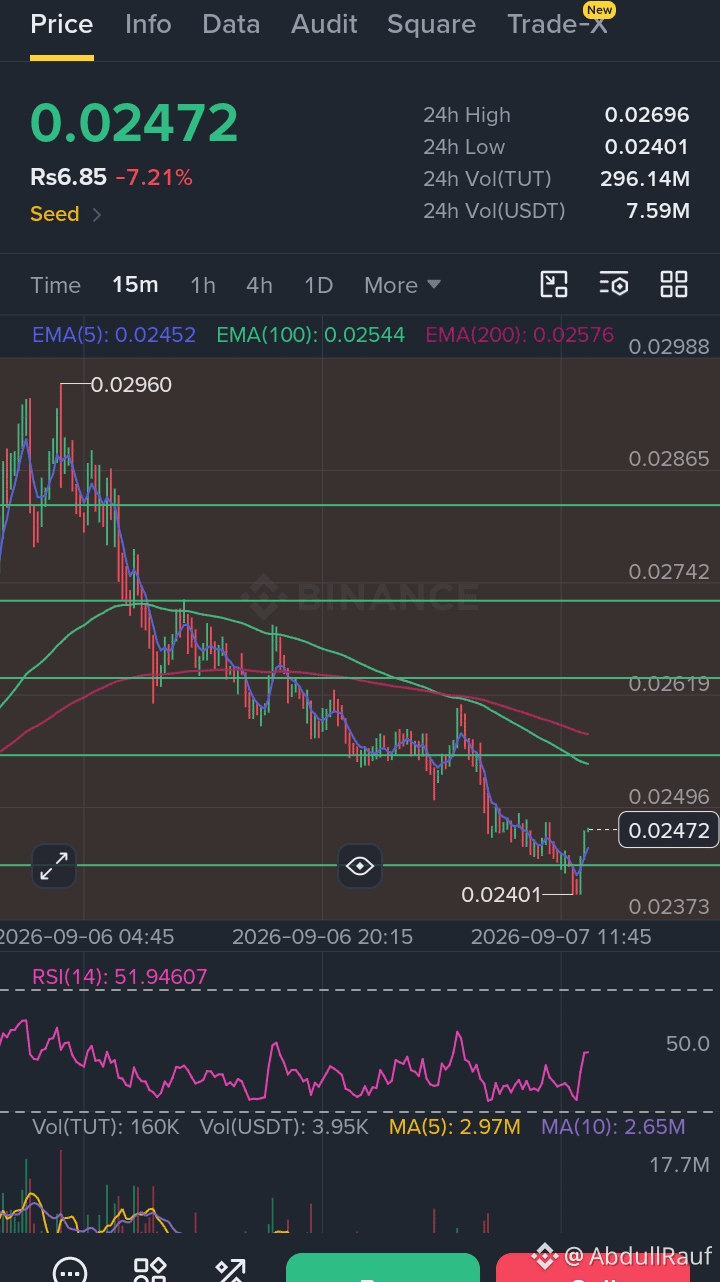
1
335
·
--
Проверено
At first I assumed the two transaction models on Dusk were just a privacy toggle. Public or private. One switch. Simple choice.
The actual difference runs deeper than that.
Moonlight works like Ethereum. Your account has a nonce. Every transaction increments it publicly. Anyone can see your balance, your history, your sequence. The nonce is a counter. It is also a trail.
Phoenix works differently. There is no account. No visible balance. No sequential counter. Instead, when you spend a note, you produce a nullifier. The network records that nullifier and knows the note is gone. But it cannot link the nullifier back to the note it came from. The spending is provable. The identity of what was spent is not.
That distinction matters more than it sounds. In Moonlight, your transaction history is a readable story. In Phoenix, the network knows chapters are being written without knowing what they say.
What I keep thinking about is which institutions actually want which model. A bank processing a settlement might need Moonlight for audit trails. A fund executing a strategy might need Phoenix to avoid front-running. Both can live on the same chain. Neither forces the other to compromise.
What I cannot find in the documentation is how regulators treat nullifiers as evidence. A nonce proves sequence. A nullifier proves spending without revealing the note. Are those legally equivalent in a compliance context?
What do you think — when a regulator asks for proof of transaction, does a nullifier satisfy the requirement or does it just raise a harder question?
#dusk $DUSK @Dusk_Foundation
At first I assumed the two transaction models on Dusk were just a privacy toggle. Public or private. One switch. Simple choice.
The actual difference runs deeper than that.
Moonlight works like Ethereum. Your account has a nonce. Every transaction increments it publicly. Anyone can see your balance, your history, your sequence. The nonce is a counter. It is also a trail.
Phoenix works differently. There is no account. No visible balance. No sequential counter. Instead, when you spend a note, you produce a nullifier. The network records that nullifier and knows the note is gone. But it cannot link the nullifier back to the note it came from. The spending is provable. The identity of what was spent is not.
That distinction matters more than it sounds. In Moonlight, your transaction history is a readable story. In Phoenix, the network knows chapters are being written without knowing what they say.
What I keep thinking about is which institutions actually want which model. A bank processing a settlement might need Moonlight for audit trails. A fund executing a strategy might need Phoenix to avoid front-running. Both can live on the same chain. Neither forces the other to compromise.
What I cannot find in the documentation is how regulators treat nullifiers as evidence. A nonce proves sequence. A nullifier proves spending without revealing the note. Are those legally equivalent in a compliance context?
What do you think — when a regulator asks for proof of transaction, does a nullifier satisfy the requirement or does it just raise a harder question?
#dusk $DUSK @Dusk
The actual difference runs deeper than that.
Moonlight works like Ethereum. Your account has a nonce. Every transaction increments it publicly. Anyone can see your balance, your history, your sequence. The nonce is a counter. It is also a trail.
Phoenix works differently. There is no account. No visible balance. No sequential counter. Instead, when you spend a note, you produce a nullifier. The network records that nullifier and knows the note is gone. But it cannot link the nullifier back to the note it came from. The spending is provable. The identity of what was spent is not.
That distinction matters more than it sounds. In Moonlight, your transaction history is a readable story. In Phoenix, the network knows chapters are being written without knowing what they say.
What I keep thinking about is which institutions actually want which model. A bank processing a settlement might need Moonlight for audit trails. A fund executing a strategy might need Phoenix to avoid front-running. Both can live on the same chain. Neither forces the other to compromise.
What I cannot find in the documentation is how regulators treat nullifiers as evidence. A nonce proves sequence. A nullifier proves spending without revealing the note. Are those legally equivalent in a compliance context?
What do you think — when a regulator asks for proof of transaction, does a nullifier satisfy the requirement or does it just raise a harder question?
#dusk $DUSK @Dusk

1
4
10
957
·
--
Privacy bolted onto EVM is not the same as privacy built in from day one.#dusk
Privacy bolted onto EVM is not the same as privacy built in from day one.#dusk
AbdullRauf
·
--
At first I assumed adding privacy to an EVM environment was the same as building privacy from the start. From the outside the two look similar. On the inside they are not.
The EVM account model carries a structural assumption. Addresses persist. Activity accumulates. Even when individual transactions are encrypted, the account itself becomes a pattern over time. Hedger adds confidentiality on top of that model. Transaction data can become opaque. The account structure remains visible.
So the real question is narrower. When Hedger encrypts a transaction, what exactly is hidden and what is not? Amounts and internal logic may stay private. The fact that this account interacted with this contract at this time is often still visible. In regulated finance, who traded with whom and when can matter as much as what they traded.
This is not a flaw in the design. Account-based EVM is practical for developers. Hedger is a real privacy layer. The risk is misunderstanding. A privacy layer that people overestimate can be more dangerous than no privacy layer at all.
Does transaction-level confidentiality give institutions enough protection, or does the account model underneath quietly limit the whole promise?
#dusk $DUSK @Dusk
The EVM account model carries a structural assumption. Addresses persist. Activity accumulates. Even when individual transactions are encrypted, the account itself becomes a pattern over time. Hedger adds confidentiality on top of that model. Transaction data can become opaque. The account structure remains visible.
So the real question is narrower. When Hedger encrypts a transaction, what exactly is hidden and what is not? Amounts and internal logic may stay private. The fact that this account interacted with this contract at this time is often still visible. In regulated finance, who traded with whom and when can matter as much as what they traded.
This is not a flaw in the design. Account-based EVM is practical for developers. Hedger is a real privacy layer. The risk is misunderstanding. A privacy layer that people overestimate can be more dangerous than no privacy layer at all.
Does transaction-level confidentiality give institutions enough protection, or does the account model underneath quietly limit the whole promise?
#dusk $DUSK @Dusk

1
2
1.1k
·
--
Проверено
I used to look at a new consensus design and ask one question first. How does an attacker break this?
Studying Dusk changed that habit. With Succinct Attestation, a different scenario appears. Imagine you are already selected to generate a block in a later iteration. You are also voting on the current one. Do you help the current block succeed and take the voter reward, or stay quiet so the iteration fails and your future generator position improves?
That is the Future Generator Incentive Problem. It does not come from outside. It comes from the incentives available to a legitimate participant.
Dusk’s response was to reshape those incentives. Separate generator and voter rewards. Exclude the next-iteration generator from current voting. Limit how many iterations can run.
There is a trade-off. Every extra incentive rule adds another assumption that still needs to hold under pressure.
The real game underneath the cryptography is whether the most rational move stays the honest one.
#dusk $DUSK @Dusk_Foundation
I used to look at a new consensus design and ask one question first. How does an attacker break this?
Studying Dusk changed that habit. With Succinct Attestation, a different scenario appears. Imagine you are already selected to generate a block in a later iteration. You are also voting on the current one. Do you help the current block succeed and take the voter reward, or stay quiet so the iteration fails and your future generator position improves?
That is the Future Generator Incentive Problem. It does not come from outside. It comes from the incentives available to a legitimate participant.
Dusk’s response was to reshape those incentives. Separate generator and voter rewards. Exclude the next-iteration generator from current voting. Limit how many iterations can run.
There is a trade-off. Every extra incentive rule adds another assumption that still needs to hold under pressure.
The real game underneath the cryptography is whether the most rational move stays the honest one.
#dusk $DUSK @Dusk
Studying Dusk changed that habit. With Succinct Attestation, a different scenario appears. Imagine you are already selected to generate a block in a later iteration. You are also voting on the current one. Do you help the current block succeed and take the voter reward, or stay quiet so the iteration fails and your future generator position improves?
That is the Future Generator Incentive Problem. It does not come from outside. It comes from the incentives available to a legitimate participant.
Dusk’s response was to reshape those incentives. Separate generator and voter rewards. Exclude the next-iteration generator from current voting. Limit how many iterations can run.
There is a trade-off. Every extra incentive rule adds another assumption that still needs to hold under pressure.
The real game underneath the cryptography is whether the most rational move stays the honest one.
#dusk $DUSK @Dusk

6
7
853
·
--
$DUSK Is Down 93%… Yet Holding Partnerships and a €200M+ Issuance Pipeline Most Protocols at This Price Don’t Have
$DUSK Is Down 93%… Yet Holding Partnerships and a €200M+ Issuance Pipeline Most Protocols at This Price Don’t Have
AbdullRauf
·
--
Spent time trying to read two signals that point in different directions. The price is down ninety-three percent from its all-time high. The NPEX partnership is live. A confirmed issuance pipeline of over two hundred million euros exists. The Boreas upgrade shipped in May. Those two pictures do not belong to the same narrative. One suggests a project that failed to hold its launch momentum. The other suggests a project that kept building while the price declined. Infrastructure tokens have a timing problem that equity markets do not. A company's stock price and its revenue usually move in the same direction over time. A protocol's token price and its actual usage can diverge for years. The price reflects what traders think today. The usage reflects what institutions decided months ago. What I cannot reconcile is the gap between the confirmed issuance number and the daily trading volume. Two hundred million euros in pipeline against three and a half million in daily volume is a wide distance. Either the issuance has not reached the chain yet or volume is not the right measure. @Dusk has partnerships that most protocols at this price would not. Whether that eventually shows up in the price or just in the history books is the question price charts were never designed to answer. When price and adoption diverge this far, which one is lying?
#dusk $DUSK @Dusk
#dusk $DUSK @Dusk

1.2k
Войдите, чтобы посмотреть больше материала
Присоединяйтесь к пользователям криптовалют по всему миру на Binance Square
⚡️ Получайте новейшую и полезную информацию о криптоактивах.
💬 Нам доверяет крупнейшая в мире криптобиржа.
👍 Получите достоверные аналитические данные от верифицированных создателей контента.
Эл. почта/номер телефона
В тренде
BOJRaisesRatesTo31YearHigh
Просмотров: 9,194
335 обсуждают
Bitcoin Reclaims the Spotlight as Macro Pressure Fails to Break Crypto Demand
Fatima_Tariq
·Лайков: 5
·Просмотров: 3.2k
BuffettStepsDownAsBerkshireChairman
Просмотров: 974
70 обсуждают
XRPExchangeReservesHitSevenYearLow
Просмотров: 1,828
119 обсуждают