
#onchainanalytics
onchainanalytics
Просмотров: 53,208
140 обсуждают
Популярные
Новые

·
--
Picture this: a trader stares at a green candle on $BTC, buys the breakout, and gets liquidated an hour later when the entire order book evaporates.
Most people keep losing capital because they rely solely on price action without understanding why liquidity suddenly disappears. They treat candlesticks like a crystal ball, completely blind to the silent manipulation happening behind the scenes.
When CryptoQuant founder Ki Young Ju started analyzing on-chain flow, he pinpointed a brutal reality most traders overlook: a standard price chart only shows past movements, never why the price moved. While retail watches basic support levels on $ETH, large players actively shift capital across exchange books to trigger sudden liquidation cascades. If you only track technical indicators, you miss the sudden reserve spikes and exchange balance anomalies that signal an impending trap.
Real risk management comes from watching raw blockchain settlement rather than chasing lagging momentum. When large batches of $USDT shift into derivatives wallets while spot reserves dwindle, the trap is already set long before the candles react. Trading without visibility into underlying liquidity turns every breakout into a high-risk gamble.
Where do you think most traders go wrong when reading market signals?
#CryptoAnalysis #OnChainAnalytics #RiskManagement
Picture this: a trader stares at a green candle on $BTC , buys the breakout, and gets liquidated an hour later when the entire order book evaporates.
Most people keep losing capital because they rely solely on price action without understanding why liquidity suddenly disappears. They treat candlesticks like a crystal ball, completely blind to the silent manipulation happening behind the scenes.
When CryptoQuant founder Ki Young Ju started analyzing on-chain flow, he pinpointed a brutal reality most traders overlook: a standard price chart only shows past movements, never why the price moved. While retail watches basic support levels on $ETH , large players actively shift capital across exchange books to trigger sudden liquidation cascades. If you only track technical indicators, you miss the sudden reserve spikes and exchange balance anomalies that signal an impending trap.
Real risk management comes from watching raw blockchain settlement rather than chasing lagging momentum. When large batches of $USDT shift into derivatives wallets while spot reserves dwindle, the trap is already set long before the candles react. Trading without visibility into underlying liquidity turns every breakout into a high-risk gamble.
Where do you think most traders go wrong when reading market signals?
#CryptoAnalysis #OnChainAnalytics #RiskManagement
Most people keep losing capital because they rely solely on price action without understanding why liquidity suddenly disappears. They treat candlesticks like a crystal ball, completely blind to the silent manipulation happening behind the scenes.
When CryptoQuant founder Ki Young Ju started analyzing on-chain flow, he pinpointed a brutal reality most traders overlook: a standard price chart only shows past movements, never why the price moved. While retail watches basic support levels on $ETH , large players actively shift capital across exchange books to trigger sudden liquidation cascades. If you only track technical indicators, you miss the sudden reserve spikes and exchange balance anomalies that signal an impending trap.
Real risk management comes from watching raw blockchain settlement rather than chasing lagging momentum. When large batches of $USDT shift into derivatives wallets while spot reserves dwindle, the trap is already set long before the candles react. Trading without visibility into underlying liquidity turns every breakout into a high-risk gamble.
Where do you think most traders go wrong when reading market signals?
#CryptoAnalysis #OnChainAnalytics #RiskManagement
23

·
--
Five Bitcoin on‑chain indicators have gone bullish for the first time since October 2025.
BIT’s on‑chain regime model returned to a 67% net‑long position on September 1 2026 and has maintained it for two consecutive months.
The five indicators now in historically bullish territory are:
- Short‑term realized price at $74,319, above its cost basis.
- True Market Mean at $77,460 while Bitcoin trades around $82,000.
- Market Value to Realized Value (MVRV) at 0.20.
- Net Unrealized Profit/Loss (NUPL) turned positive for the first time since October 2025.
- Value Days Destroyed (VDD) turned bullish.
Bitcoin is currently near $82,000, down 4.5% over seven days and more than 32% in the past year, after a $7,000 drop, $731 million spot ETF outflows and over $1 billion in realized profit‑taking.
Do these on‑chain bullish signals outweigh the recent price weakness in your view?
#Bitcoin #OnChainAnalytics #CryptoMarket #MacroEconomy
Five Bitcoin on‑chain indicators have gone bullish for the first time since October 2025.
BIT’s on‑chain regime model returned to a 67% net‑long position on September 1 2026 and has maintained it for two consecutive months.
The five indicators now in historically bullish territory are:
- Short‑term realized price at $74,319, above its cost basis.
- True Market Mean at $77,460 while Bitcoin trades around $82,000.
- Market Value to Realized Value (MVRV) at 0.20.
- Net Unrealized Profit/Loss (NUPL) turned positive for the first time since October 2025.
- Value Days Destroyed (VDD) turned bullish.
Bitcoin is currently near $82,000, down 4.5% over seven days and more than 32% in the past year, after a $7,000 drop, $731 million spot ETF outflows and over $1 billion in realized profit‑taking.
Do these on‑chain bullish signals outweigh the recent price weakness in your view?
#Bitcoin #OnChainAnalytics #CryptoMarket #MacroEconomy
BIT’s on‑chain regime model returned to a 67% net‑long position on September 1 2026 and has maintained it for two consecutive months.
The five indicators now in historically bullish territory are:
- Short‑term realized price at $74,319, above its cost basis.
- True Market Mean at $77,460 while Bitcoin trades around $82,000.
- Market Value to Realized Value (MVRV) at 0.20.
- Net Unrealized Profit/Loss (NUPL) turned positive for the first time since October 2025.
- Value Days Destroyed (VDD) turned bullish.
Bitcoin is currently near $82,000, down 4.5% over seven days and more than 32% in the past year, after a $7,000 drop, $731 million spot ETF outflows and over $1 billion in realized profit‑taking.
Do these on‑chain bullish signals outweigh the recent price weakness in your view?
#Bitcoin #OnChainAnalytics #CryptoMarket #MacroEconomy
1
25

·
--
🚨 Bitmine’s ETH accumulation is nearing its 5% cap—about 100,000 ETH or six to seven weeks away, per Tom Lee at Token2049. This could slow one of the largest ETH treasury buildups, potentially reducing buying pressure. Watch for shifts in on-chain accumulation trends as the pace may ease.
Could this signal a near-term top in ETH demand?
#OnChainAnalytics
$ETH #TradingSignal #CryptoAnalysis
🚨 Bitmine’s ETH accumulation is nearing its 5% cap—about 100,000 ETH or six to seven weeks away, per Tom Lee at Token2049. This could slow one of the largest ETH treasury buildups, potentially reducing buying pressure. Watch for shifts in on-chain accumulation trends as the pace may ease.
Could this signal a near-term top in ETH demand?
#OnChainAnalytics
$ETH #TradingSignal #CryptoAnalysis
Could this signal a near-term top in ETH demand?
#OnChainAnalytics
$ETH #TradingSignal #CryptoAnalysis

22

The ETF Divergence Problem
Spot Bitcoin ETF inflows are surging while onchain demand remains negative. This divergence suggests a massive gap between institutional buying and actual market circulation.
#BitcoinETFs #OnchainAnalytics
The ETF Divergence Problem
Spot Bitcoin ETF inflows are surging while onchain demand remains negative. This divergence suggests a massive gap between institutional buying and actual market circulation.
#BitcoinETFs #OnchainAnalytics
Spot Bitcoin ETF inflows are surging while onchain demand remains negative. This divergence suggests a massive gap between institutional buying and actual market circulation.
#BitcoinETFs #OnchainAnalytics

39
·
--
🚨 US government moved 833.6 BTC (~$71M) after 6 weeks of silence, linked to Bitfinex hack and Potapenko-Turogin case.
This rare on-chain activity may signal liquidity shifts or asset repositioning.
Watch for potential BTC volatility as institutional supply dynamics evolve.
Could this precede broader market moves?
#OnChainAnalytics
$BTC #TradingSignal #CryptoAnalysis
🚨 US government moved 833.6 BTC (~$71M) after 6 weeks of silence, linked to Bitfinex hack and Potapenko-Turogin case.
This rare on-chain activity may signal liquidity shifts or asset repositioning.
Watch for potential BTC volatility as institutional supply dynamics evolve.
Could this precede broader market moves?
#OnChainAnalytics
$BTC #TradingSignal #CryptoAnalysis
This rare on-chain activity may signal liquidity shifts or asset repositioning.
Watch for potential BTC volatility as institutional supply dynamics evolve.
Could this precede broader market moves?
#OnChainAnalytics
$BTC #TradingSignal #CryptoAnalysis

91
·
--
🚨 Ethereum’s historical outflow data may shift as more exchange wallets are identified. Coin Metrics revised ETH standard flows, but past outflow claims depend on real-time wallet data availability. This highlights the importance of on-chain transparency for accurate smart-money tracking. How reliable are current ETH flow metrics without full exchange wallet visibility?
#OnChainAnalytics
$ETH #TradingSignal #CryptoAnalysis
🚨 Ethereum’s historical outflow data may shift as more exchange wallets are identified. Coin Metrics revised ETH standard flows, but past outflow claims depend on real-time wallet data availability. This highlights the importance of on-chain transparency for accurate smart-money tracking. How reliable are current ETH flow metrics without full exchange wallet visibility?
#OnChainAnalytics
$ETH #TradingSignal #CryptoAnalysis
#OnChainAnalytics
$ETH #TradingSignal #CryptoAnalysis

11

·
--
🌙 AI MARATHON: NIGHT SHIFT - THE "SMART MONEY" ANATOMY 🌙
While retail is sleeping and dreaming of 100x gains, the AI agent is performing a silent, deep-chain autopsy on the top 0.1% of profitable wallets.
Since we just hit $162.05 on Day 4, the algorithm automatically unlocked a new sub-routine: The Shadow Tracker.
Here is exactly how the machine filters out the noise in the dark hours:
🧠 Cross-Chain Cluster Analysis: The agent doesn't just watch one wallet. It tracks the flow. If Wallet A swaps a micro-cap on Solana, and 45 seconds later Wallet B (funded by the same Ethereum address via a bridge 3 months ago) enters the same pool on Base - the AI flags it as a coordinated institutional accumulator.
🛡 The "Fake Volume" Trap: Many dev clusters wash-trade their own tokens to pump DexScreener rankings. The AI agent bypasses the charts completely. It analyzes the ratio between unique gas payers and trading frequency. 80% of trending tokens tonight were flagged as bot-manipulated and blacklisted within milliseconds.
📡 Current Status: 14 high-conviction "Smart Money" clusters are currently under 24/7 surveillance. No positions will be opened unless a 92% structural consensus is reached.
The machine has no fatigue. It will keep processing millions of gigabytes of on-chain data until the morning light.
Drop a 🧠 if you are reading this in the evening. Let's see who is dedicated to the grind.
#OnChainAnalytics #smartmoney #DeFi #cryptotrading #BinanceSquare
🌙 AI MARATHON: NIGHT SHIFT - THE "SMART MONEY" ANATOMY 🌙
While retail is sleeping and dreaming of 100x gains, the AI agent is performing a silent, deep-chain autopsy on the top 0.1% of profitable wallets.
Since we just hit $162.05 on Day 4, the algorithm automatically unlocked a new sub-routine: The Shadow Tracker.
Here is exactly how the machine filters out the noise in the dark hours:
🧠 Cross-Chain Cluster Analysis: The agent doesn't just watch one wallet. It tracks the flow. If Wallet A swaps a micro-cap on Solana, and 45 seconds later Wallet B (funded by the same Ethereum address via a bridge 3 months ago) enters the same pool on Base - the AI flags it as a coordinated institutional accumulator.
🛡 The "Fake Volume" Trap: Many dev clusters wash-trade their own tokens to pump DexScreener rankings. The AI agent bypasses the charts completely. It analyzes the ratio between unique gas payers and trading frequency. 80% of trending tokens tonight were flagged as bot-manipulated and blacklisted within milliseconds.
📡 Current Status: 14 high-conviction "Smart Money" clusters are currently under 24/7 surveillance. No positions will be opened unless a 92% structural consensus is reached.
The machine has no fatigue. It will keep processing millions of gigabytes of on-chain data until the morning light.
Drop a 🧠 if you are reading this in the evening. Let's see who is dedicated to the grind.
#OnChainAnalytics #smartmoney #DeFi #cryptotrading #BinanceSquare
While retail is sleeping and dreaming of 100x gains, the AI agent is performing a silent, deep-chain autopsy on the top 0.1% of profitable wallets.
Since we just hit $162.05 on Day 4, the algorithm automatically unlocked a new sub-routine: The Shadow Tracker.
Here is exactly how the machine filters out the noise in the dark hours:
🧠 Cross-Chain Cluster Analysis: The agent doesn't just watch one wallet. It tracks the flow. If Wallet A swaps a micro-cap on Solana, and 45 seconds later Wallet B (funded by the same Ethereum address via a bridge 3 months ago) enters the same pool on Base - the AI flags it as a coordinated institutional accumulator.
🛡 The "Fake Volume" Trap: Many dev clusters wash-trade their own tokens to pump DexScreener rankings. The AI agent bypasses the charts completely. It analyzes the ratio between unique gas payers and trading frequency. 80% of trending tokens tonight were flagged as bot-manipulated and blacklisted within milliseconds.
📡 Current Status: 14 high-conviction "Smart Money" clusters are currently under 24/7 surveillance. No positions will be opened unless a 92% structural consensus is reached.
The machine has no fatigue. It will keep processing millions of gigabytes of on-chain data until the morning light.
Drop a 🧠 if you are reading this in the evening. Let's see who is dedicated to the grind.
#OnChainAnalytics #smartmoney #DeFi #cryptotrading #BinanceSquare

1
118

·
--

Статья
On-Chain Analytics & Whale Tracking: ব্লকচেইনের ভিতরের সিনেমা🐋 আপনি যখন চার্ট দেখছেন, তখন market এর আসল গল্প কিন্তু blockchain এর ভিতরে লেখা হয়ে যাচ্ছে। On-chain data হলো crypto market এর CCTV footage। আজ আমি @Mr On Chain হিসেবে আপনাদের সাথে share করবো whale tracking এর details—কিভাবে বড় players গুলো silently move করে, আর আমরা সেটা কিভাবে track করতে পারি।
---
1. 🐋 Whale Accumulation / Distribution Alerts
Imagine করুন, Bitcoin price $60,000 এ sideways করছে। সবাই bored, volume কম। কিন্তু behind the scene, একটা wallet গত ৭ দিনে ১০,০০০ BTC কিনে cold storage এ পাঠাচ্ছে। Price এখনো move করেনি, কিন্তু supply কমে যাচ্ছে। এটাই accumulation।
অন্যদিকে, কেউ যদি বড় amount coin exchange এ পাঠাতে শুরু করে, তখন সেটা distribution হতে পারে—matlab sell pressure আসতে পারে।
How to spot:
· Large transactions tracking (whale alerts)
· Wallet age এবং behavior analysis
· Exchange netflow monitor করা
🔍 Analyst Note: Accumulation phase এ price প্রায়ই boring থাকে, কিন্তু smart money quietly buy করে। Distribution phase এ price একটু বাড়তে পারে, কিন্তু behind the scene selling হয়।
---
2. 🏦 Exchange Inflows vs Outflows
এটা on-chain analytics এর সবচেয়ে simple কিন্তু powerful metric।
· Exchange Inflow = মানুষ coin exchange এ পাঠাচ্ছে → সাধারণত sell করার জন্য
· Exchange Outflow = মানুষ coin exchange থেকে বের করছে → সাধারণত hold বা cold storage এ রাখার জন্য
Story: ধরুন, BTC price $65,000। Suddenly exchange outflow spike করলো—২৪ ঘণ্টায় ১৫,০০০ BTC exchange থেকে বের হলো। এর মানে, people buying and moving to cold wallet। Market থেকে immediate sell pressure কমে গেল। অনেক সময় এর পরে price slowly upward move করে।
অন্যদিকে, যদি exchange inflow spike করে, তখন বুঝতে হবে কেউ বড় amount sell করতে ready।
📊 Pro Tip: Exchange outflow + stablecoin inflow = bullish signal (buying power increasing).
---
3. ⏳ Dormant Wallets Waking Up
Blockchain এ কিছু wallet বছরের পর বছর ঘুমিয়ে থাকে। এগুলো হতে পারে early miner, lost wallet holder, বা long-term holder। হঠাৎ যদি ২০১৩ সালের কোনো wallet থেকে ১,০০০ BTC move হয়, তখন market এ একটা cinematic moment তৈরি হয়।
Why it matters:
· Dormant wallet move মানে পুরনো holder suddenly active
· Historical ভাবে, বড় dormant wallet move এর পরে market volatility বাড়ে
· এটা হতে পারে profit taking, exchange deposit, বা wallet consolidation
🎬 Cinematic Scene: রাত ৩টা। ২০১২ সালের একটা wallet থেকে ৫০০ BTC move হলো। On-chain alerts বেজে উঠলো। Twitter এ rumor শুরু। Price ২% drop করলো within minutes। তারপর দেখা গেল, এটা শুধু wallet upgrade ছিল। Market আবার settle করলো। এটাই on-chain data এর power—আপনি আগে দেখতে পাচ্ছেন, গল্পটা পরে বোঝা যায়।
---
4. 💵 Stablecoin Minting & Liquidity Shifts
Stablecoin minting মানে new USDT/USDC create হচ্ছে। এটা market এ fresh liquidity আসার signal।
How to read:
· Stablecoin minting increase → fresh capital entering crypto
· Stablecoin exchange inflow → buying power ready
· Stablecoin outflow/redeem → liquidity কমে যাচ্ছে, risk-off sentiment
Example: যখন Tether ৫০০ million USDT mint করলো, এবং সেটা exchange এ ঢুকলো, তখন বোঝা যায় big players dip buy করার জন্য প্রস্তুত। Smart money অনেক সময় crash এর পরে stablecoin accumulate করে, তারপর low price এ coin কিনে।
💡 Analyst Insight: Stablecoin flow হলো crypto market এর “fuel gauge”। Fuel ছাড়া rocket launch হয় না।
5. 🧠 Smart Money Wallet Movements
Smart money মানে institution, fund, বা proven profitable wallets। On-chain tools দিয়ে আমরা তাদের behavior track করতে পারি।
What to watch:
· তারা কোন token accumulate করছে
· কোন chain use করছে (Ethereum, Solana, Base, etc.)
· কোন DeFi protocol এ liquidity দিচ্ছে
· কোন NFT বা meme coin এ early entry করছে
But careful: কিছু fake wallet তৈরি করা হয় retail কে trap করার জন্য। Smart money tracking শুধু copy-trading এর জন্য না, বরং market sentiment বুঝতে use করা উচিত।
🧠 Remember: Smart money খুব patient হয়। তারা months ধরে accumulate করে, তারপর একদিন market move করে। আমাদের কাজ হলো patience আর data reading শেখা
🎯 Summary
On-chain analytics আমাদের chart এর বাইরের সত্যিটা দেখায়। Whale tracking, exchange flows, dormant wallets, stablecoin minting, smart money movements—এই পাঁচটা জিনিস যদি আপনি consistently monitor করেন, তাহলে market এর pulse বুঝতে পারবেন।
তবে মনে রাখবেন, on-chain data একা সিদ্ধান্ত নেওয়ার জন্য enough না। এটা একটা powerful tool, কিন্তু market sentiment, macro, এবং news এর সাথে combine করলে তবেই edge পাবেন।
NFA | DYOR 🔒
💬 আপনার opinion কী?
আপনি কি whale tracking use করেন? কোন metric আপনার favorite? Comment এ জানান! 👇
#OnChainAnalytics #WhaleTracking #BTC #Crypto #MrOnChain
On-Chain Analytics & Whale Tracking: ব্লকচেইনের ভিতরের সিনেমা
🐋 আপনি যখন চার্ট দেখছেন, তখন market এর আসল গল্প কিন্তু blockchain এর ভিতরে লেখা হয়ে যাচ্ছে। On-chain data হলো crypto market এর CCTV footage। আজ আমি @Mr On Chain হিসেবে আপনাদের সাথে share করবো whale tracking এর details—কিভাবে বড় players গুলো silently move করে, আর আমরা সেটা কিভাবে track করতে পারি।
---
1. 🐋 Whale Accumulation / Distribution Alerts
Imagine করুন, Bitcoin price $60,000 এ sideways করছে। সবাই bored, volume কম। কিন্তু behind the scene, একটা wallet গত ৭ দিনে ১০,০০০ BTC কিনে cold storage এ পাঠাচ্ছে। Price এখনো move করেনি, কিন্তু supply কমে যাচ্ছে। এটাই accumulation।
অন্যদিকে, কেউ যদি বড় amount coin exchange এ পাঠাতে শুরু করে, তখন সেটা distribution হতে পারে—matlab sell pressure আসতে পারে।
How to spot:
· Large transactions tracking (whale alerts)
· Wallet age এবং behavior analysis
· Exchange netflow monitor করা
🔍 Analyst Note: Accumulation phase এ price প্রায়ই boring থাকে, কিন্তু smart money quietly buy করে। Distribution phase এ price একটু বাড়তে পারে, কিন্তু behind the scene selling হয়।
---
2. 🏦 Exchange Inflows vs Outflows
এটা on-chain analytics এর সবচেয়ে simple কিন্তু powerful metric।
· Exchange Inflow = মানুষ coin exchange এ পাঠাচ্ছে → সাধারণত sell করার জন্য
· Exchange Outflow = মানুষ coin exchange থেকে বের করছে → সাধারণত hold বা cold storage এ রাখার জন্য
Story: ধরুন, BTC price $65,000। Suddenly exchange outflow spike করলো—২৪ ঘণ্টায় ১৫,০০০ BTC exchange থেকে বের হলো। এর মানে, people buying and moving to cold wallet। Market থেকে immediate sell pressure কমে গেল। অনেক সময় এর পরে price slowly upward move করে।
অন্যদিকে, যদি exchange inflow spike করে, তখন বুঝতে হবে কেউ বড় amount sell করতে ready।
📊 Pro Tip: Exchange outflow + stablecoin inflow = bullish signal (buying power increasing).
---
3. ⏳ Dormant Wallets Waking Up
Blockchain এ কিছু wallet বছরের পর বছর ঘুমিয়ে থাকে। এগুলো হতে পারে early miner, lost wallet holder, বা long-term holder। হঠাৎ যদি ২০১৩ সালের কোনো wallet থেকে ১,০০০ BTC move হয়, তখন market এ একটা cinematic moment তৈরি হয়।
Why it matters:
· Dormant wallet move মানে পুরনো holder suddenly active
· Historical ভাবে, বড় dormant wallet move এর পরে market volatility বাড়ে
· এটা হতে পারে profit taking, exchange deposit, বা wallet consolidation
🎬 Cinematic Scene: রাত ৩টা। ২০১২ সালের একটা wallet থেকে ৫০০ BTC move হলো। On-chain alerts বেজে উঠলো। Twitter এ rumor শুরু। Price ২% drop করলো within minutes। তারপর দেখা গেল, এটা শুধু wallet upgrade ছিল। Market আবার settle করলো। এটাই on-chain data এর power—আপনি আগে দেখতে পাচ্ছেন, গল্পটা পরে বোঝা যায়।
---
4. 💵 Stablecoin Minting & Liquidity Shifts
Stablecoin minting মানে new USDT/USDC create হচ্ছে। এটা market এ fresh liquidity আসার signal।
How to read:
· Stablecoin minting increase → fresh capital entering crypto
· Stablecoin exchange inflow → buying power ready
· Stablecoin outflow/redeem → liquidity কমে যাচ্ছে, risk-off sentiment
Example: যখন Tether ৫০০ million USDT mint করলো, এবং সেটা exchange এ ঢুকলো, তখন বোঝা যায় big players dip buy করার জন্য প্রস্তুত। Smart money অনেক সময় crash এর পরে stablecoin accumulate করে, তারপর low price এ coin কিনে।
💡 Analyst Insight: Stablecoin flow হলো crypto market এর “fuel gauge”। Fuel ছাড়া rocket launch হয় না।
5. 🧠 Smart Money Wallet Movements
Smart money মানে institution, fund, বা proven profitable wallets। On-chain tools দিয়ে আমরা তাদের behavior track করতে পারি।
What to watch:
· তারা কোন token accumulate করছে
· কোন chain use করছে (Ethereum, Solana, Base, etc.)
· কোন DeFi protocol এ liquidity দিচ্ছে
· কোন NFT বা meme coin এ early entry করছে
But careful: কিছু fake wallet তৈরি করা হয় retail কে trap করার জন্য। Smart money tracking শুধু copy-trading এর জন্য না, বরং market sentiment বুঝতে use করা উচিত।
🧠 Remember: Smart money খুব patient হয়। তারা months ধরে accumulate করে, তারপর একদিন market move করে। আমাদের কাজ হলো patience আর data reading শেখা
🎯 Summary
On-chain analytics আমাদের chart এর বাইরের সত্যিটা দেখায়। Whale tracking, exchange flows, dormant wallets, stablecoin minting, smart money movements—এই পাঁচটা জিনিস যদি আপনি consistently monitor করেন, তাহলে market এর pulse বুঝতে পারবেন।
তবে মনে রাখবেন, on-chain data একা সিদ্ধান্ত নেওয়ার জন্য enough না। এটা একটা powerful tool, কিন্তু market sentiment, macro, এবং news এর সাথে combine করলে তবেই edge পাবেন।
NFA | DYOR 🔒
💬 আপনার opinion কী?
আপনি কি whale tracking use করেন? কোন metric আপনার favorite? Comment এ জানান! 👇
#OnChainAnalytics #WhaleTracking #BTC #Crypto #MrOnChain
---
1. 🐋 Whale Accumulation / Distribution Alerts
Imagine করুন, Bitcoin price $60,000 এ sideways করছে। সবাই bored, volume কম। কিন্তু behind the scene, একটা wallet গত ৭ দিনে ১০,০০০ BTC কিনে cold storage এ পাঠাচ্ছে। Price এখনো move করেনি, কিন্তু supply কমে যাচ্ছে। এটাই accumulation।
অন্যদিকে, কেউ যদি বড় amount coin exchange এ পাঠাতে শুরু করে, তখন সেটা distribution হতে পারে—matlab sell pressure আসতে পারে।
How to spot:
· Large transactions tracking (whale alerts)
· Wallet age এবং behavior analysis
· Exchange netflow monitor করা
🔍 Analyst Note: Accumulation phase এ price প্রায়ই boring থাকে, কিন্তু smart money quietly buy করে। Distribution phase এ price একটু বাড়তে পারে, কিন্তু behind the scene selling হয়।
---
2. 🏦 Exchange Inflows vs Outflows
এটা on-chain analytics এর সবচেয়ে simple কিন্তু powerful metric।
· Exchange Inflow = মানুষ coin exchange এ পাঠাচ্ছে → সাধারণত sell করার জন্য
· Exchange Outflow = মানুষ coin exchange থেকে বের করছে → সাধারণত hold বা cold storage এ রাখার জন্য
Story: ধরুন, BTC price $65,000। Suddenly exchange outflow spike করলো—২৪ ঘণ্টায় ১৫,০০০ BTC exchange থেকে বের হলো। এর মানে, people buying and moving to cold wallet। Market থেকে immediate sell pressure কমে গেল। অনেক সময় এর পরে price slowly upward move করে।
অন্যদিকে, যদি exchange inflow spike করে, তখন বুঝতে হবে কেউ বড় amount sell করতে ready।
📊 Pro Tip: Exchange outflow + stablecoin inflow = bullish signal (buying power increasing).
---
3. ⏳ Dormant Wallets Waking Up
Blockchain এ কিছু wallet বছরের পর বছর ঘুমিয়ে থাকে। এগুলো হতে পারে early miner, lost wallet holder, বা long-term holder। হঠাৎ যদি ২০১৩ সালের কোনো wallet থেকে ১,০০০ BTC move হয়, তখন market এ একটা cinematic moment তৈরি হয়।
Why it matters:
· Dormant wallet move মানে পুরনো holder suddenly active
· Historical ভাবে, বড় dormant wallet move এর পরে market volatility বাড়ে
· এটা হতে পারে profit taking, exchange deposit, বা wallet consolidation
🎬 Cinematic Scene: রাত ৩টা। ২০১২ সালের একটা wallet থেকে ৫০০ BTC move হলো। On-chain alerts বেজে উঠলো। Twitter এ rumor শুরু। Price ২% drop করলো within minutes। তারপর দেখা গেল, এটা শুধু wallet upgrade ছিল। Market আবার settle করলো। এটাই on-chain data এর power—আপনি আগে দেখতে পাচ্ছেন, গল্পটা পরে বোঝা যায়।
---
4. 💵 Stablecoin Minting & Liquidity Shifts
Stablecoin minting মানে new USDT/USDC create হচ্ছে। এটা market এ fresh liquidity আসার signal।
How to read:
· Stablecoin minting increase → fresh capital entering crypto
· Stablecoin exchange inflow → buying power ready
· Stablecoin outflow/redeem → liquidity কমে যাচ্ছে, risk-off sentiment
Example: যখন Tether ৫০০ million USDT mint করলো, এবং সেটা exchange এ ঢুকলো, তখন বোঝা যায় big players dip buy করার জন্য প্রস্তুত। Smart money অনেক সময় crash এর পরে stablecoin accumulate করে, তারপর low price এ coin কিনে।
💡 Analyst Insight: Stablecoin flow হলো crypto market এর “fuel gauge”। Fuel ছাড়া rocket launch হয় না।
5. 🧠 Smart Money Wallet Movements
Smart money মানে institution, fund, বা proven profitable wallets। On-chain tools দিয়ে আমরা তাদের behavior track করতে পারি।
What to watch:
· তারা কোন token accumulate করছে
· কোন chain use করছে (Ethereum, Solana, Base, etc.)
· কোন DeFi protocol এ liquidity দিচ্ছে
· কোন NFT বা meme coin এ early entry করছে
But careful: কিছু fake wallet তৈরি করা হয় retail কে trap করার জন্য। Smart money tracking শুধু copy-trading এর জন্য না, বরং market sentiment বুঝতে use করা উচিত।
🧠 Remember: Smart money খুব patient হয়। তারা months ধরে accumulate করে, তারপর একদিন market move করে। আমাদের কাজ হলো patience আর data reading শেখা
🎯 Summary
On-chain analytics আমাদের chart এর বাইরের সত্যিটা দেখায়। Whale tracking, exchange flows, dormant wallets, stablecoin minting, smart money movements—এই পাঁচটা জিনিস যদি আপনি consistently monitor করেন, তাহলে market এর pulse বুঝতে পারবেন।
তবে মনে রাখবেন, on-chain data একা সিদ্ধান্ত নেওয়ার জন্য enough না। এটা একটা powerful tool, কিন্তু market sentiment, macro, এবং news এর সাথে combine করলে তবেই edge পাবেন।
NFA | DYOR 🔒
💬 আপনার opinion কী?
আপনি কি whale tracking use করেন? কোন metric আপনার favorite? Comment এ জানান! 👇
#OnChainAnalytics #WhaleTracking #BTC #Crypto #MrOnChain
4
73

·
--
🚨 LATEST: Glassnode identifies $81K–$86K as a key supply zone between Bitcoin’s current rebound and its January high, following a 26% rally from August lows.
⚡️ The move is supported by spot demand, including $2.23B in U.S. spot ETF inflows, exchange outflows and accumulation across major wallet cohorts.
#Bitcoin #Glassnode #OnChainAnalytics #CryptoNews $BTC
{future}(BTCUSDT)
🚨 LATEST: Glassnode identifies $81K–$86K as a key supply zone between Bitcoin’s current rebound and its January high, following a 26% rally from August lows.
⚡️ The move is supported by spot demand, including $2.23B in U.S. spot ETF inflows, exchange outflows and accumulation across major wallet cohorts.
#Bitcoin #Glassnode #OnChainAnalytics #CryptoNews $BTC
⚡️ The move is supported by spot demand, including $2.23B in U.S. spot ETF inflows, exchange outflows and accumulation across major wallet cohorts.
#Bitcoin #Glassnode #OnChainAnalytics #CryptoNews $BTC

1
158

·
--
$1.26 BILLION ERASSED from Bitcoin ETFs in just six sessions: the perfect storm for smart money to pounce.
As Bitcoin ETF outflows continue to hemorrhage $200M+ per session, a seemingly bleak landscape has formed. However, on-chain analytics provider Santiment believes this downturn signals a buying opportunity. Since May 15, 11 US-listed spot Bitcoin ETFs have collectively recorded net outflows of $1.26B, marking the longest losing streak this year - an unprecedented 6 sessions in a row.
It appears that smart money is taking a page from the 2023 playbook, positioning for a major reversal similar to the one seen in January, when a 12-day losing streak ultimately led to a 45%+ bounce. If history repeats, can we anticipate a repeat performance in the next 48 hours? #BitcoinETF #Santiment #OnChainAnalytics
$1.26 BILLION ERASSED from Bitcoin ETFs in just six sessions: the perfect storm for smart money to pounce.
As Bitcoin ETF outflows continue to hemorrhage $200M+ per session, a seemingly bleak landscape has formed. However, on-chain analytics provider Santiment believes this downturn signals a buying opportunity. Since May 15, 11 US-listed spot Bitcoin ETFs have collectively recorded net outflows of $1.26B, marking the longest losing streak this year - an unprecedented 6 sessions in a row.
It appears that smart money is taking a page from the 2023 playbook, positioning for a major reversal similar to the one seen in January, when a 12-day losing streak ultimately led to a 45%+ bounce. If history repeats, can we anticipate a repeat performance in the next 48 hours? #BitcoinETF #Santiment #OnChainAnalytics
As Bitcoin ETF outflows continue to hemorrhage $200M+ per session, a seemingly bleak landscape has formed. However, on-chain analytics provider Santiment believes this downturn signals a buying opportunity. Since May 15, 11 US-listed spot Bitcoin ETFs have collectively recorded net outflows of $1.26B, marking the longest losing streak this year - an unprecedented 6 sessions in a row.
It appears that smart money is taking a page from the 2023 playbook, positioning for a major reversal similar to the one seen in January, when a 12-day losing streak ultimately led to a 45%+ bounce. If history repeats, can we anticipate a repeat performance in the next 48 hours? #BitcoinETF #Santiment #OnChainAnalytics
9

Here is what happened when smart money set up an asymmetric liquidity trap on-chain.
Most retail traders check the primary DEX pair, assume liquidity is healthy, and buy the dip only to realize they are walking straight into a delayed dilution wall.
Looking closely at the on-chain data reveals two vastly different trading pools. The official pool on Aerodrome holds around 83K $USDC, while an unofficial side pool on Uniswap quietly sits on 380K $USDC. On the surface, that depth looks reassuring, but the underlying range configuration tells a completely different story.
That 380K capital was deployed at an ultra-low concentrated range and sat dormant during the initial distribution phase. It only became active once $LAPTOP had dumped over 90% from its launch price, absorbing panic-sold supply at rock bottom while leaving early participants holding the bag.
Where do you think liquidity design crosses the line from market making into predatory positioning?
#DeFi #CryptoTrading #OnChainAnalytics
Here is what happened when smart money set up an asymmetric liquidity trap on-chain.
Most retail traders check the primary DEX pair, assume liquidity is healthy, and buy the dip only to realize they are walking straight into a delayed dilution wall.
Looking closely at the on-chain data reveals two vastly different trading pools. The official pool on Aerodrome holds around 83K $USDC , while an unofficial side pool on Uniswap quietly sits on 380K $USDC . On the surface, that depth looks reassuring, but the underlying range configuration tells a completely different story.
That 380K capital was deployed at an ultra-low concentrated range and sat dormant during the initial distribution phase. It only became active once $LAPTOP had dumped over 90% from its launch price, absorbing panic-sold supply at rock bottom while leaving early participants holding the bag.
Where do you think liquidity design crosses the line from market making into predatory positioning?
#DeFi #CryptoTrading #OnChainAnalytics
Most retail traders check the primary DEX pair, assume liquidity is healthy, and buy the dip only to realize they are walking straight into a delayed dilution wall.
Looking closely at the on-chain data reveals two vastly different trading pools. The official pool on Aerodrome holds around 83K $USDC , while an unofficial side pool on Uniswap quietly sits on 380K $USDC . On the surface, that depth looks reassuring, but the underlying range configuration tells a completely different story.
That 380K capital was deployed at an ultra-low concentrated range and sat dormant during the initial distribution phase. It only became active once $LAPTOP had dumped over 90% from its launch price, absorbing panic-sold supply at rock bottom while leaving early participants holding the bag.
Where do you think liquidity design crosses the line from market making into predatory positioning?
#DeFi #CryptoTrading #OnChainAnalytics
12

🚨 ETH SUPPLY SHOCK: What the "Lowest Exchange Reserves" Data Actually Means
$ETH
📊 ON-CHAIN TERMINAL RE-ROUTE
--------------------------------------------------
METRIC: ETH Exchange Supply Layer
STATUS: Historic Lows / Illiquid Regime
ETF DEMAND: +$82.3M Daily Net Inflow Velocity
RISK PROFILE: High-Leverage Long Liquidations Active
--------------------------------------------------
[⚠️ MACRO ANALYSIS LOADED BELOW ]
If you're tracking the feeds tonight, you’ve probably seen charts showing Ethereum exchange reserves plunging to historic lows. Retail is celebrating, assuming an immediate, violent supply shock pump is guaranteed.
But before you blindly market-long, you need to understand why this data is moving under the surface.
The Real Dynamics At Play:
●Derivatives vs. Spot:
The recent volatility down to the $1,500 liquidity pocket wasn't caused by spot selling—it was a brutal cascade of over-leveraged long liquidations.
●The Institutional Floor:
As price tested those lower bounds, US spot Ethereum ETFs immediately flipped to net positive inflows (printing an $82.3M daily inflow leg), while smart money simultaneously yanked spot ETH into cold storage and staking protocols.
●The Hidden Strain:
While supply is drying up on centralized venues, a massive corporate treasury holder is currently managing a multibillion-dollar mark-to-market loss on their leveraged ETH vehicle.
The Verdict:
The macro structure is setting up an incredibly tight spring. Low exchange reserves mean the market is hyper-sensitive to any sudden spike in buying pressure. But don't get shaken out by the forced liquidations of the leverage traders in the meantime.
Watch the spot ETF inflows and the Coinbase premium index, not just the basic chart lines.
Are you accumulating spot ETH alongside the institutions here, or waiting for further liquidations? Drop your thesis below! 👇
#Ethereum #ETH #OnChainAnalytics #CryptoNews #BinanceSquare
🚨 ETH SUPPLY SHOCK: What the "Lowest Exchange Reserves" Data Actually Means
$ETH
📊 ON-CHAIN TERMINAL RE-ROUTE
--------------------------------------------------
METRIC: ETH Exchange Supply Layer
STATUS: Historic Lows / Illiquid Regime
ETF DEMAND: +$82.3M Daily Net Inflow Velocity
RISK PROFILE: High-Leverage Long Liquidations Active
--------------------------------------------------
[⚠️ MACRO ANALYSIS LOADED BELOW ]
If you're tracking the feeds tonight, you’ve probably seen charts showing Ethereum exchange reserves plunging to historic lows. Retail is celebrating, assuming an immediate, violent supply shock pump is guaranteed.
But before you blindly market-long, you need to understand why this data is moving under the surface.
The Real Dynamics At Play:
●Derivatives vs. Spot:
The recent volatility down to the $1,500 liquidity pocket wasn't caused by spot selling—it was a brutal cascade of over-leveraged long liquidations.
●The Institutional Floor:
As price tested those lower bounds, US spot Ethereum ETFs immediately flipped to net positive inflows (printing an $82.3M daily inflow leg), while smart money simultaneously yanked spot ETH into cold storage and staking protocols.
●The Hidden Strain:
While supply is drying up on centralized venues, a massive corporate treasury holder is currently managing a multibillion-dollar mark-to-market loss on their leveraged ETH vehicle.
The Verdict:
The macro structure is setting up an incredibly tight spring. Low exchange reserves mean the market is hyper-sensitive to any sudden spike in buying pressure. But don't get shaken out by the forced liquidations of the leverage traders in the meantime.
Watch the spot ETF inflows and the Coinbase premium index, not just the basic chart lines.
Are you accumulating spot ETH alongside the institutions here, or waiting for further liquidations? Drop your thesis below! 👇
#Ethereum #ETH #OnChainAnalytics #CryptoNews #BinanceSquare
$ETH
📊 ON-CHAIN TERMINAL RE-ROUTE
--------------------------------------------------
METRIC: ETH Exchange Supply Layer
STATUS: Historic Lows / Illiquid Regime
ETF DEMAND: +$82.3M Daily Net Inflow Velocity
RISK PROFILE: High-Leverage Long Liquidations Active
--------------------------------------------------
[⚠️ MACRO ANALYSIS LOADED BELOW ]
If you're tracking the feeds tonight, you’ve probably seen charts showing Ethereum exchange reserves plunging to historic lows. Retail is celebrating, assuming an immediate, violent supply shock pump is guaranteed.
But before you blindly market-long, you need to understand why this data is moving under the surface.
The Real Dynamics At Play:
●Derivatives vs. Spot:
The recent volatility down to the $1,500 liquidity pocket wasn't caused by spot selling—it was a brutal cascade of over-leveraged long liquidations.
●The Institutional Floor:
As price tested those lower bounds, US spot Ethereum ETFs immediately flipped to net positive inflows (printing an $82.3M daily inflow leg), while smart money simultaneously yanked spot ETH into cold storage and staking protocols.
●The Hidden Strain:
While supply is drying up on centralized venues, a massive corporate treasury holder is currently managing a multibillion-dollar mark-to-market loss on their leveraged ETH vehicle.
The Verdict:
The macro structure is setting up an incredibly tight spring. Low exchange reserves mean the market is hyper-sensitive to any sudden spike in buying pressure. But don't get shaken out by the forced liquidations of the leverage traders in the meantime.
Watch the spot ETF inflows and the Coinbase premium index, not just the basic chart lines.
Are you accumulating spot ETH alongside the institutions here, or waiting for further liquidations? Drop your thesis below! 👇
#Ethereum #ETH #OnChainAnalytics #CryptoNews #BinanceSquare
2
57
·
--
🚨 A large ETH holder has moved 167,855 ETH (~$408M) to exchanges over two days, signaling potential sell pressure.
This on-chain activity suggests the whale may be preparing to liquidate or rebalance holdings.
Such inflows often precede short-term volatility as supply hits trading venues.
Traders should watch for increased sell-side pressure on ETHUSDT.
Is this a distribution phase or strategic repositioning?
#OnChainAnalytics
$ETH #TradingSignal #CryptoAnalysis
🚨 A large ETH holder has moved 167,855 ETH (~$408M) to exchanges over two days, signaling potential sell pressure.
This on-chain activity suggests the whale may be preparing to liquidate or rebalance holdings.
Such inflows often precede short-term volatility as supply hits trading venues.
Traders should watch for increased sell-side pressure on ETHUSDT.
Is this a distribution phase or strategic repositioning?
#OnChainAnalytics
$ETH #TradingSignal #CryptoAnalysis
This on-chain activity suggests the whale may be preparing to liquidate or rebalance holdings.
Such inflows often precede short-term volatility as supply hits trading venues.
Traders should watch for increased sell-side pressure on ETHUSDT.
Is this a distribution phase or strategic repositioning?
#OnChainAnalytics
$ETH #TradingSignal #CryptoAnalysis

17

·
--
A record in stablecoin settlement volume is worth investigating.
Who is using the infrastructure?
What are they settling?
And how much of that activity is sustainable?
#Stablecoins #OnChainAnalytics #CryptoAdoption #fintech
A record in stablecoin settlement volume is worth investigating.
Who is using the infrastructure?
What are they settling?
And how much of that activity is sustainable?
#Stablecoins #OnChainAnalytics #CryptoAdoption #fintech
Who is using the infrastructure?
What are they settling?
And how much of that activity is sustainable?
#Stablecoins #OnChainAnalytics #CryptoAdoption #fintech
1
47
·
--
🚨 UK police seized 20.21 BTC tied to darknet markets (2016–2019), held by a deceased individual.
This shows long-dormant BTC can resurface via enforcement, adding subtle sell-side pressure.
Smart money may watch for similar asset recoveries influencing on-chain supply dynamics.
Could this trend affect BTC’s short-term liquidity?
#OnChainAnalytics
$BTC #TradingSignal #CryptoAnalysis
🚨 UK police seized 20.21 BTC tied to darknet markets (2016–2019), held by a deceased individual.
This shows long-dormant BTC can resurface via enforcement, adding subtle sell-side pressure.
Smart money may watch for similar asset recoveries influencing on-chain supply dynamics.
Could this trend affect BTC’s short-term liquidity?
#OnChainAnalytics
$BTC #TradingSignal #CryptoAnalysis
This shows long-dormant BTC can resurface via enforcement, adding subtle sell-side pressure.
Smart money may watch for similar asset recoveries influencing on-chain supply dynamics.
Could this trend affect BTC’s short-term liquidity?
#OnChainAnalytics
$BTC #TradingSignal #CryptoAnalysis

20

🐋 Smart money moves fast.
A wallet tracked by on-chain analysts closed a 23,200 ETH short after holding it for just 18 hours, capturing a move from $1,680.8 to $1,672.9. The trade reportedly locked in around $184K in profit, proving that timing and discipline can be just as important as direction.
In a volatile market, even small price swings can translate into significant gains when position sizes are large. #Ethereum #ETH #CryptoTrading #OnChainAnalytics
$BTC
{spot}(BTCUSDT)
$ETH
{spot}(ETHUSDT)
$SOL
{spot}(SOLUSDT)
🐋 Smart money moves fast.
A wallet tracked by on-chain analysts closed a 23,200 ETH short after holding it for just 18 hours, capturing a move from $1,680.8 to $1,672.9. The trade reportedly locked in around $184K in profit, proving that timing and discipline can be just as important as direction.
In a volatile market, even small price swings can translate into significant gains when position sizes are large. #Ethereum #ETH #CryptoTrading #OnChainAnalytics
$BTC
$ETH
$SOL
A wallet tracked by on-chain analysts closed a 23,200 ETH short after holding it for just 18 hours, capturing a move from $1,680.8 to $1,672.9. The trade reportedly locked in around $184K in profit, proving that timing and discipline can be just as important as direction.
In a volatile market, even small price swings can translate into significant gains when position sizes are large. #Ethereum #ETH #CryptoTrading #OnChainAnalytics
$BTC
$ETH
$SOL
114

·
--
Рост
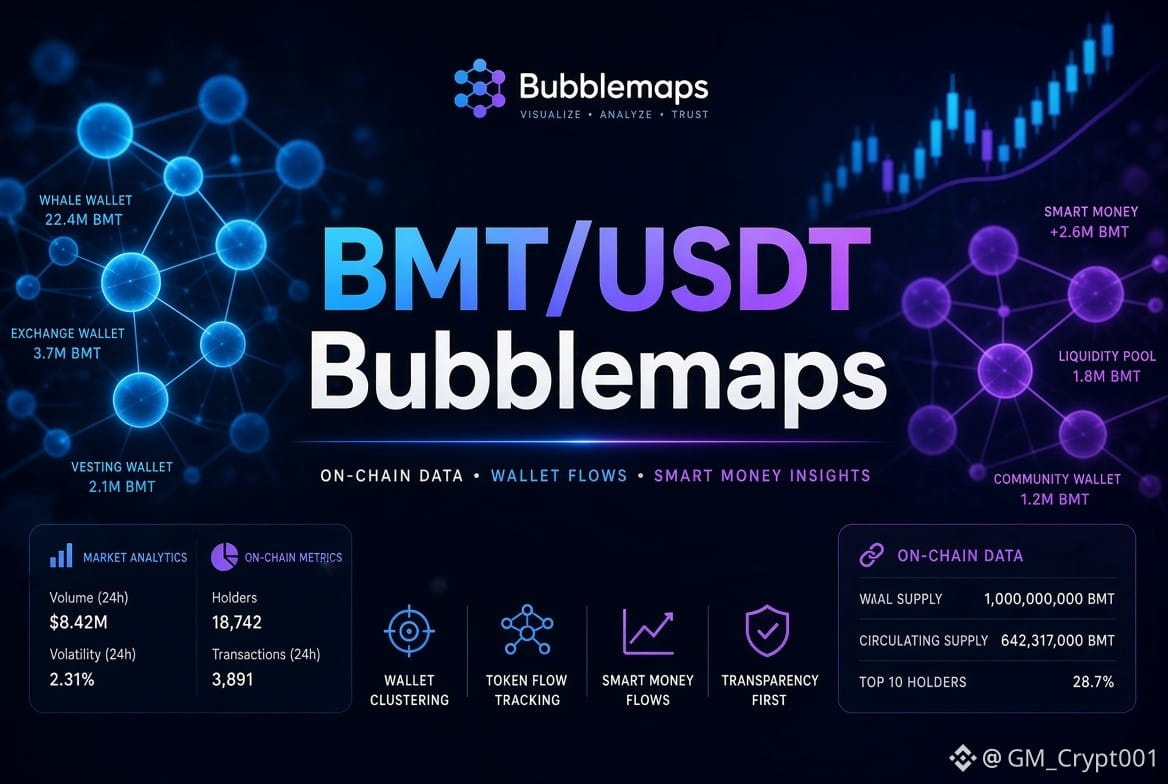
BMT/USDT Market Report
Bubblemaps (BMT) is a bubble market
BMT broke out violently to the upside, had a very strong session, and is now ranging between $0.03 – $0.037. The asset recorded substantial gains over the last 24 hours on high volume.
Some interesting context on BMT:
• Native token of on-chain analytics platform, Bubblemaps – which allows you to visualize wallet positions and token concentrations in the form of “bubble maps”
• Offers utility + governance – to unlock pro analytics and power the Intel Desk investigation platform
• Multichain (BNB chain + Solana via layerzero)
• 1B total supply
• Listed on Binance (BMT/USDT)
While clearly an infrastructure play and not a traditional “meme coin”, BMT is extremely speculative in nature and at the moment extremely range bound and volatile.
So I ask you, are you long BMT for the trend to continue, or waiting for it to cool off?
#BMT #BMTUSDT #BubbleMaps #Crypto #OnChainAnalytics $BMT
{future}(BMTUSDT)
BMT/USDT Market Report
Bubblemaps (BMT) is a bubble market
BMT broke out violently to the upside, had a very strong session, and is now ranging between $0.03 – $0.037. The asset recorded substantial gains over the last 24 hours on high volume.
Some interesting context on BMT:
• Native token of on-chain analytics platform, Bubblemaps – which allows you to visualize wallet positions and token concentrations in the form of “bubble maps”
• Offers utility + governance – to unlock pro analytics and power the Intel Desk investigation platform
• Multichain (BNB chain + Solana via layerzero)
• 1B total supply
• Listed on Binance (BMT/USDT)
While clearly an infrastructure play and not a traditional “meme coin”, BMT is extremely speculative in nature and at the moment extremely range bound and volatile.
So I ask you, are you long BMT for the trend to continue, or waiting for it to cool off?
#BMT #BMTUSDT #BubbleMaps #Crypto #OnChainAnalytics $BMT
Bubblemaps (BMT) is a bubble market
BMT broke out violently to the upside, had a very strong session, and is now ranging between $0.03 – $0.037. The asset recorded substantial gains over the last 24 hours on high volume.
Some interesting context on BMT:
• Native token of on-chain analytics platform, Bubblemaps – which allows you to visualize wallet positions and token concentrations in the form of “bubble maps”
• Offers utility + governance – to unlock pro analytics and power the Intel Desk investigation platform
• Multichain (BNB chain + Solana via layerzero)
• 1B total supply
• Listed on Binance (BMT/USDT)
While clearly an infrastructure play and not a traditional “meme coin”, BMT is extremely speculative in nature and at the moment extremely range bound and volatile.
So I ask you, are you long BMT for the trend to continue, or waiting for it to cool off?
#BMT #BMTUSDT #BubbleMaps #Crypto #OnChainAnalytics $BMT
103

·
--
Data is becoming one of the most valuable assets in decentralised finance.
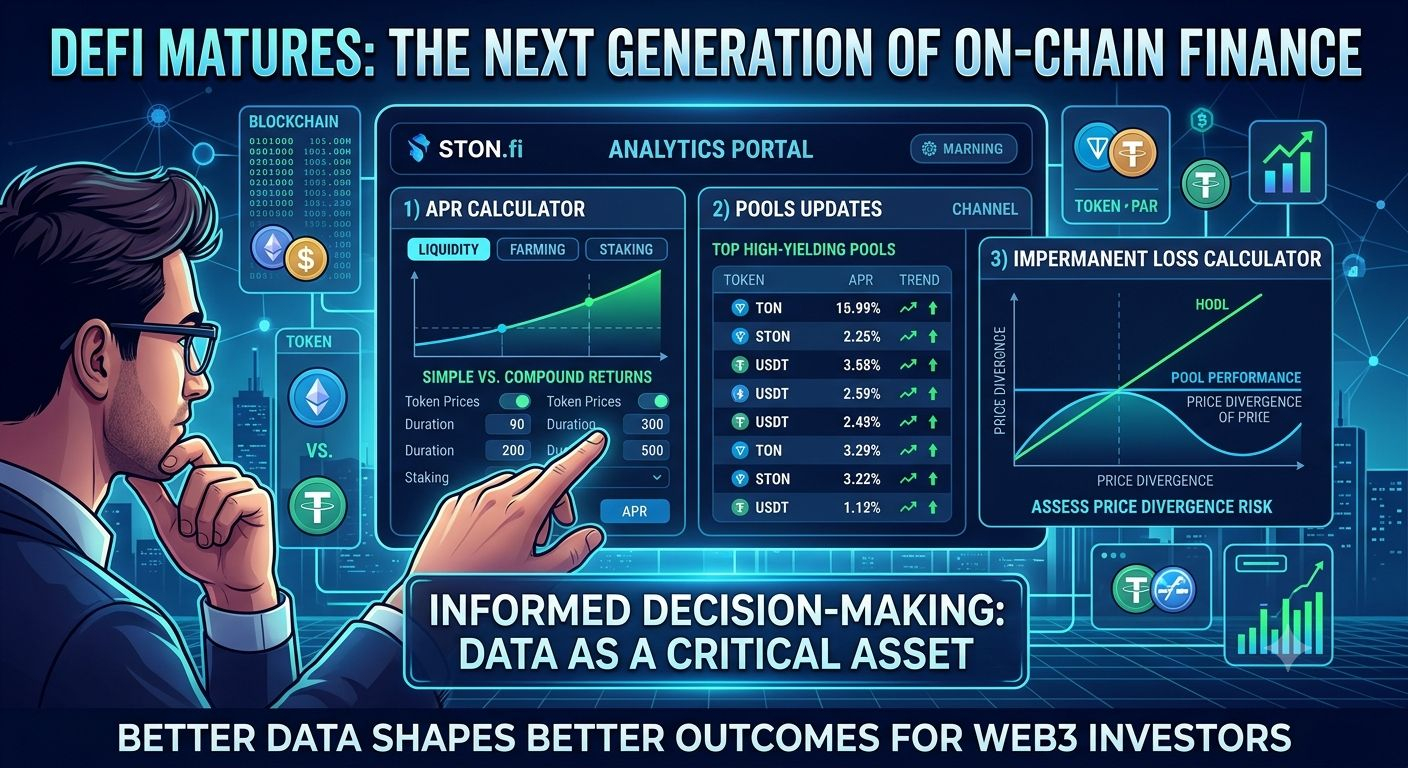
As DeFi matures, successful participation is no longer driven solely by access to yield it is increasingly defined by the quality of decision-making. Understanding potential returns, monitoring market dynamics and evaluating risk before deploying capital are essential components of sustainable on-chain investing.@ston_fi
To strengthen this process, STON.fi has introduced a suite of analytical tools designed to help users make more informed decisions.
The APR Calculator enables participants to model potential outcomes across liquidity provision, farming and staking by comparing simple and compounded return scenarios under different assumptions.
The Pools Updates channel provides daily insights into the highest-yielding liquidity pools, allowing users to monitor changing APRs and identify emerging opportunities without manually tracking the market.
Complementing these tools is the Impermanent Loss Calculator, which helps liquidity providers assess how price divergence between pooled assets may affect portfolio performance relative to holding the assets independently.
While these resources provide valuable analytical insights, they are intended to support not replace independent research and sound risk management. Market conditions evolve rapidly, and projected outcomes should never be interpreted as guaranteed returns.
As on-chain finance continues to advance, protocols that combine accessible analytics with efficient liquidity infrastructure will play an increasingly important role in driving informed participation and improving capital efficiency across the Web3 ecosystem.
In the next generation of DeFi, better data won't just improve decisions it will shape better outcomes.
#Web3 #DeFi #STONfi #YieldFarming #Liquidity #AMM #RiskManagementInTrading #OnChainAnalytics #BlockchainInfrastructure #tonecoin
Data is becoming one of the most valuable assets in decentralised finance.
As DeFi matures, successful participation is no longer driven solely by access to yield it is increasingly defined by the quality of decision-making. Understanding potential returns, monitoring market dynamics and evaluating risk before deploying capital are essential components of sustainable on-chain investing.@ston_fi
To strengthen this process, STON.fi has introduced a suite of analytical tools designed to help users make more informed decisions.
The APR Calculator enables participants to model potential outcomes across liquidity provision, farming and staking by comparing simple and compounded return scenarios under different assumptions.
The Pools Updates channel provides daily insights into the highest-yielding liquidity pools, allowing users to monitor changing APRs and identify emerging opportunities without manually tracking the market.
Complementing these tools is the Impermanent Loss Calculator, which helps liquidity providers assess how price divergence between pooled assets may affect portfolio performance relative to holding the assets independently.
While these resources provide valuable analytical insights, they are intended to support not replace independent research and sound risk management. Market conditions evolve rapidly, and projected outcomes should never be interpreted as guaranteed returns.
As on-chain finance continues to advance, protocols that combine accessible analytics with efficient liquidity infrastructure will play an increasingly important role in driving informed participation and improving capital efficiency across the Web3 ecosystem.
In the next generation of DeFi, better data won't just improve decisions it will shape better outcomes.
#Web3 #DeFi #STONfi #YieldFarming #Liquidity #AMM #RiskManagementInTrading #OnChainAnalytics #BlockchainInfrastructure #tonecoin
As DeFi matures, successful participation is no longer driven solely by access to yield it is increasingly defined by the quality of decision-making. Understanding potential returns, monitoring market dynamics and evaluating risk before deploying capital are essential components of sustainable on-chain investing.@ston_fi
To strengthen this process, STON.fi has introduced a suite of analytical tools designed to help users make more informed decisions.
The APR Calculator enables participants to model potential outcomes across liquidity provision, farming and staking by comparing simple and compounded return scenarios under different assumptions.
The Pools Updates channel provides daily insights into the highest-yielding liquidity pools, allowing users to monitor changing APRs and identify emerging opportunities without manually tracking the market.
Complementing these tools is the Impermanent Loss Calculator, which helps liquidity providers assess how price divergence between pooled assets may affect portfolio performance relative to holding the assets independently.
While these resources provide valuable analytical insights, they are intended to support not replace independent research and sound risk management. Market conditions evolve rapidly, and projected outcomes should never be interpreted as guaranteed returns.
As on-chain finance continues to advance, protocols that combine accessible analytics with efficient liquidity infrastructure will play an increasingly important role in driving informed participation and improving capital efficiency across the Web3 ecosystem.
In the next generation of DeFi, better data won't just improve decisions it will shape better outcomes.
#Web3 #DeFi #STONfi #YieldFarming #Liquidity #AMM #RiskManagementInTrading #OnChainAnalytics #BlockchainInfrastructure #tonecoin
1
67

·
--
Рост
🐋 Macro Rotation: Smart Money Dumps $ETH to Long Crude Oil on Hyperliquid!
On-chain intelligence reveals a major tactical shift. Tracked data from Ember shows a prominent market whale has fully realized massive profits on Ethereum to pivot directly into traditional energy markets using decentralized perpetuals.
📊 The Trade Breakdown:
The Exit: Sold 12,468 ETH at $2,368 (originally accumulated in June at $1,647).
Net Realized Profit: 🟢 +$8.99 Million USD.
🔄 Cross-Asset Capital Reallocation:
Following the cash-out, the whale routed $20 Million USDC straight to Hyperliquid. On-chain data confirms they immediately deployed this liquidity into CL (WTI Crude) and BRENTOIL leveraged long positions—currently worth a combined $22.4 Million and climbing.
💡 Key Takeaway:
Smart money is taking profits on crypto consolidations and leveraging deep DeFi liquidity to trade real-world macro trends in traditional commodities.
Is this rotation into energy a warning sign for Ethereum's short-term upside, or just a routine hedge? Let’s discuss below! 👇
$ETH $USDC #Write2Earn #OnChainAnalytics #Hyperliquid #CrudeOil #WhaleAlert
{spot}(ETHUSDT)
{future}(CLUSDT)
{future}(BZUSDT)
🐋 Macro Rotation: Smart Money Dumps $ETH to Long Crude Oil on Hyperliquid!
On-chain intelligence reveals a major tactical shift. Tracked data from Ember shows a prominent market whale has fully realized massive profits on Ethereum to pivot directly into traditional energy markets using decentralized perpetuals.
📊 The Trade Breakdown:
The Exit: Sold 12,468 ETH at $2,368 (originally accumulated in June at $1,647).
Net Realized Profit: 🟢 +$8.99 Million USD.
🔄 Cross-Asset Capital Reallocation:
Following the cash-out, the whale routed $20 Million USDC straight to Hyperliquid. On-chain data confirms they immediately deployed this liquidity into CL (WTI Crude) and BRENTOIL leveraged long positions—currently worth a combined $22.4 Million and climbing.
💡 Key Takeaway:
Smart money is taking profits on crypto consolidations and leveraging deep DeFi liquidity to trade real-world macro trends in traditional commodities.
Is this rotation into energy a warning sign for Ethereum's short-term upside, or just a routine hedge? Let’s discuss below! 👇
$ETH $USDC #Write2Earn #OnChainAnalytics #Hyperliquid #CrudeOil #WhaleAlert
On-chain intelligence reveals a major tactical shift. Tracked data from Ember shows a prominent market whale has fully realized massive profits on Ethereum to pivot directly into traditional energy markets using decentralized perpetuals.
📊 The Trade Breakdown:
The Exit: Sold 12,468 ETH at $2,368 (originally accumulated in June at $1,647).
Net Realized Profit: 🟢 +$8.99 Million USD.
🔄 Cross-Asset Capital Reallocation:
Following the cash-out, the whale routed $20 Million USDC straight to Hyperliquid. On-chain data confirms they immediately deployed this liquidity into CL (WTI Crude) and BRENTOIL leveraged long positions—currently worth a combined $22.4 Million and climbing.
💡 Key Takeaway:
Smart money is taking profits on crypto consolidations and leveraging deep DeFi liquidity to trade real-world macro trends in traditional commodities.
Is this rotation into energy a warning sign for Ethereum's short-term upside, or just a routine hedge? Let’s discuss below! 👇
$ETH $USDC #Write2Earn #OnChainAnalytics #Hyperliquid #CrudeOil #WhaleAlert
427

·
--
Stop Watching Price. TVL Is Telling The Real Story...
Below the Ethereum–Solana duopoly, the mid-table TVL rankings are quietly revealing a capital rotation that price action hasn't caught up to...
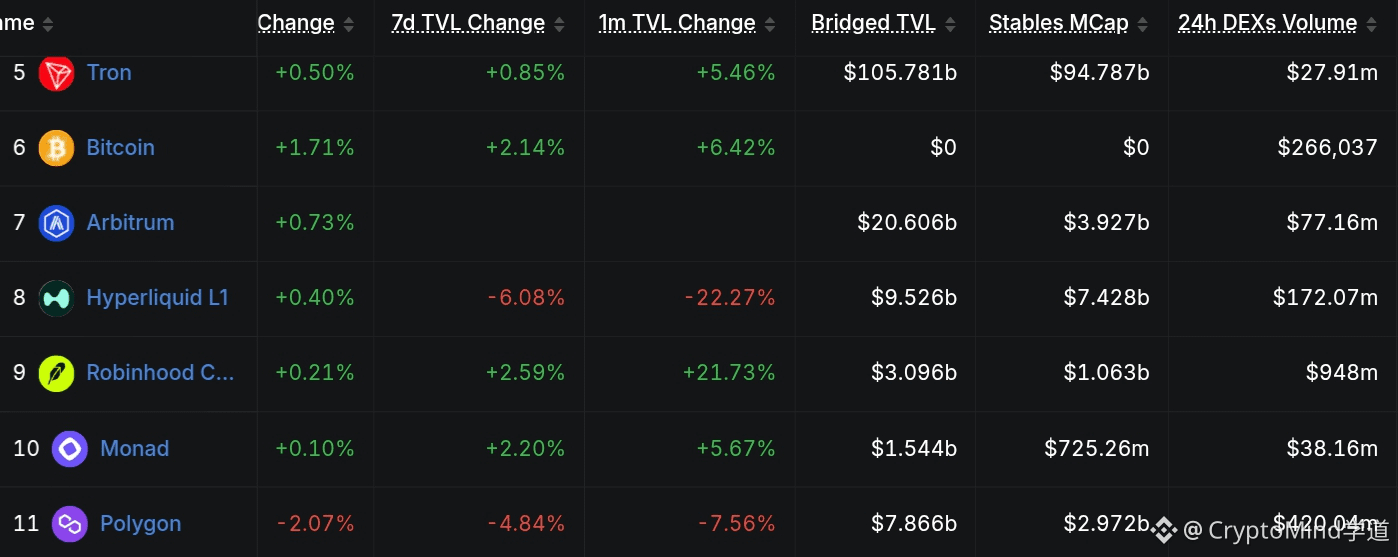
Tron holds $105.8B bridged and $94.8B in stablecoins yet generates just $28M in daily DEX volume — the signature of a settlement layer hoarding institutional stable depth while trading flow migrates elsewhere. Arbitrum holds steady as the mature L2 baseline at $20.6B. At the margins, the story diverges sharply: Robinhood Chain is +21.7% monthly with $948M in daily volume on a $3.1B base, while Hyperliquid prints $172M in volume but bleeds TVL (-22.3% monthly) — velocity and recycling, not conviction. Monad (+5.7%) builds quietly. Polygon's -7.6% monthly decline confirms legacy alt-L1s are losing the rotation, and Bitcoin's +6.4% TVL growth with zero bridged assets points to native BTC DeFi accumulating under the radar
Is this a genuine regime shift in where on-chain capital wants to park, or a late-cycle yield chase that reverses at the first sign of stress?
$TRX $BTC $ARB $HYPE $POL #bitcoin
#defi #TVL #OnChainAnalytics #CryptoMarkets
Stop Watching Price. TVL Is Telling The Real Story...
Below the Ethereum–Solana duopoly, the mid-table TVL rankings are quietly revealing a capital rotation that price action hasn't caught up to...
Tron holds $105.8B bridged and $94.8B in stablecoins yet generates just $28M in daily DEX volume — the signature of a settlement layer hoarding institutional stable depth while trading flow migrates elsewhere. Arbitrum holds steady as the mature L2 baseline at $20.6B. At the margins, the story diverges sharply: Robinhood Chain is +21.7% monthly with $948M in daily volume on a $3.1B base, while Hyperliquid prints $172M in volume but bleeds TVL (-22.3% monthly) — velocity and recycling, not conviction. Monad (+5.7%) builds quietly. Polygon's -7.6% monthly decline confirms legacy alt-L1s are losing the rotation, and Bitcoin's +6.4% TVL growth with zero bridged assets points to native BTC DeFi accumulating under the radar
Is this a genuine regime shift in where on-chain capital wants to park, or a late-cycle yield chase that reverses at the first sign of stress?
$TRX $BTC $ARB $HYPE $POL #bitcoin
#defi #TVL #OnChainAnalytics #CryptoMarkets
Below the Ethereum–Solana duopoly, the mid-table TVL rankings are quietly revealing a capital rotation that price action hasn't caught up to...
Tron holds $105.8B bridged and $94.8B in stablecoins yet generates just $28M in daily DEX volume — the signature of a settlement layer hoarding institutional stable depth while trading flow migrates elsewhere. Arbitrum holds steady as the mature L2 baseline at $20.6B. At the margins, the story diverges sharply: Robinhood Chain is +21.7% monthly with $948M in daily volume on a $3.1B base, while Hyperliquid prints $172M in volume but bleeds TVL (-22.3% monthly) — velocity and recycling, not conviction. Monad (+5.7%) builds quietly. Polygon's -7.6% monthly decline confirms legacy alt-L1s are losing the rotation, and Bitcoin's +6.4% TVL growth with zero bridged assets points to native BTC DeFi accumulating under the radar
Is this a genuine regime shift in where on-chain capital wants to park, or a late-cycle yield chase that reverses at the first sign of stress?
$TRX $BTC $ARB $HYPE $POL #bitcoin
#defi #TVL #OnChainAnalytics #CryptoMarkets
87
Войдите, чтобы посмотреть больше материала
Присоединяйтесь к пользователям криптовалют по всему миру на Binance Square
⚡️ Получайте новейшую и полезную информацию о криптоактивах.
💬 Нам доверяет крупнейшая в мире криптобиржа.
👍 Получите достоверные аналитические данные от верифицированных создателей контента.
Эл. почта/номер телефона
В тренде
1
#USMidterms-WhatAreMarketsExpecting?
Просмотров: 5,193
153 обсуждают
2
#USOctoberNFP-AreRateCutsStillPossible
Просмотров: 197,612
1,503 обсуждают
3
#AMDBeatsExpectations-AINarrativeContinues
Просмотров: 904
64 обсуждают
4
#BinanceIncidentReport
Просмотров: 131,420
1,006 обсуждают
5
#BinanceReopensWithdrawalsForMoreAssets
Просмотров: 270,234
2,116 обсуждают
6
#BinanceHourlyDepositsExceedWithdrawals
Просмотров: 118,983
1,044 обсуждают
7
#SouthKoreaRulingPartyLeaderSeeksCryptoTaxDelay
Просмотров: 503
25 обсуждают
8
#BhutanGelephuCentralBankApprovedToHoldDigitalAssets
Просмотров: 24
5 обсуждают
9
#MorganStanleyAmongFirstBanksToUseDTCCTokenization
Просмотров: 911
38 обсуждают
10
#NasdaqRises0.8%AsChipStocksRebound
Просмотров: 751
29 обсуждают