
Gabbbar
18 ໂພສ

Gabbbar
ລາຍງານ
ບລັອກຜູ້ໃຊ້
ຜູ້ຊື້ຂາຍປະຈໍາ
5.7 ປີ
38 ກໍາລັງຕິດຕາມ
13 ຜູ້ຕິດຕາມ
2 Liked
ໂພສ
·
--
ເບິ່ງການແປ
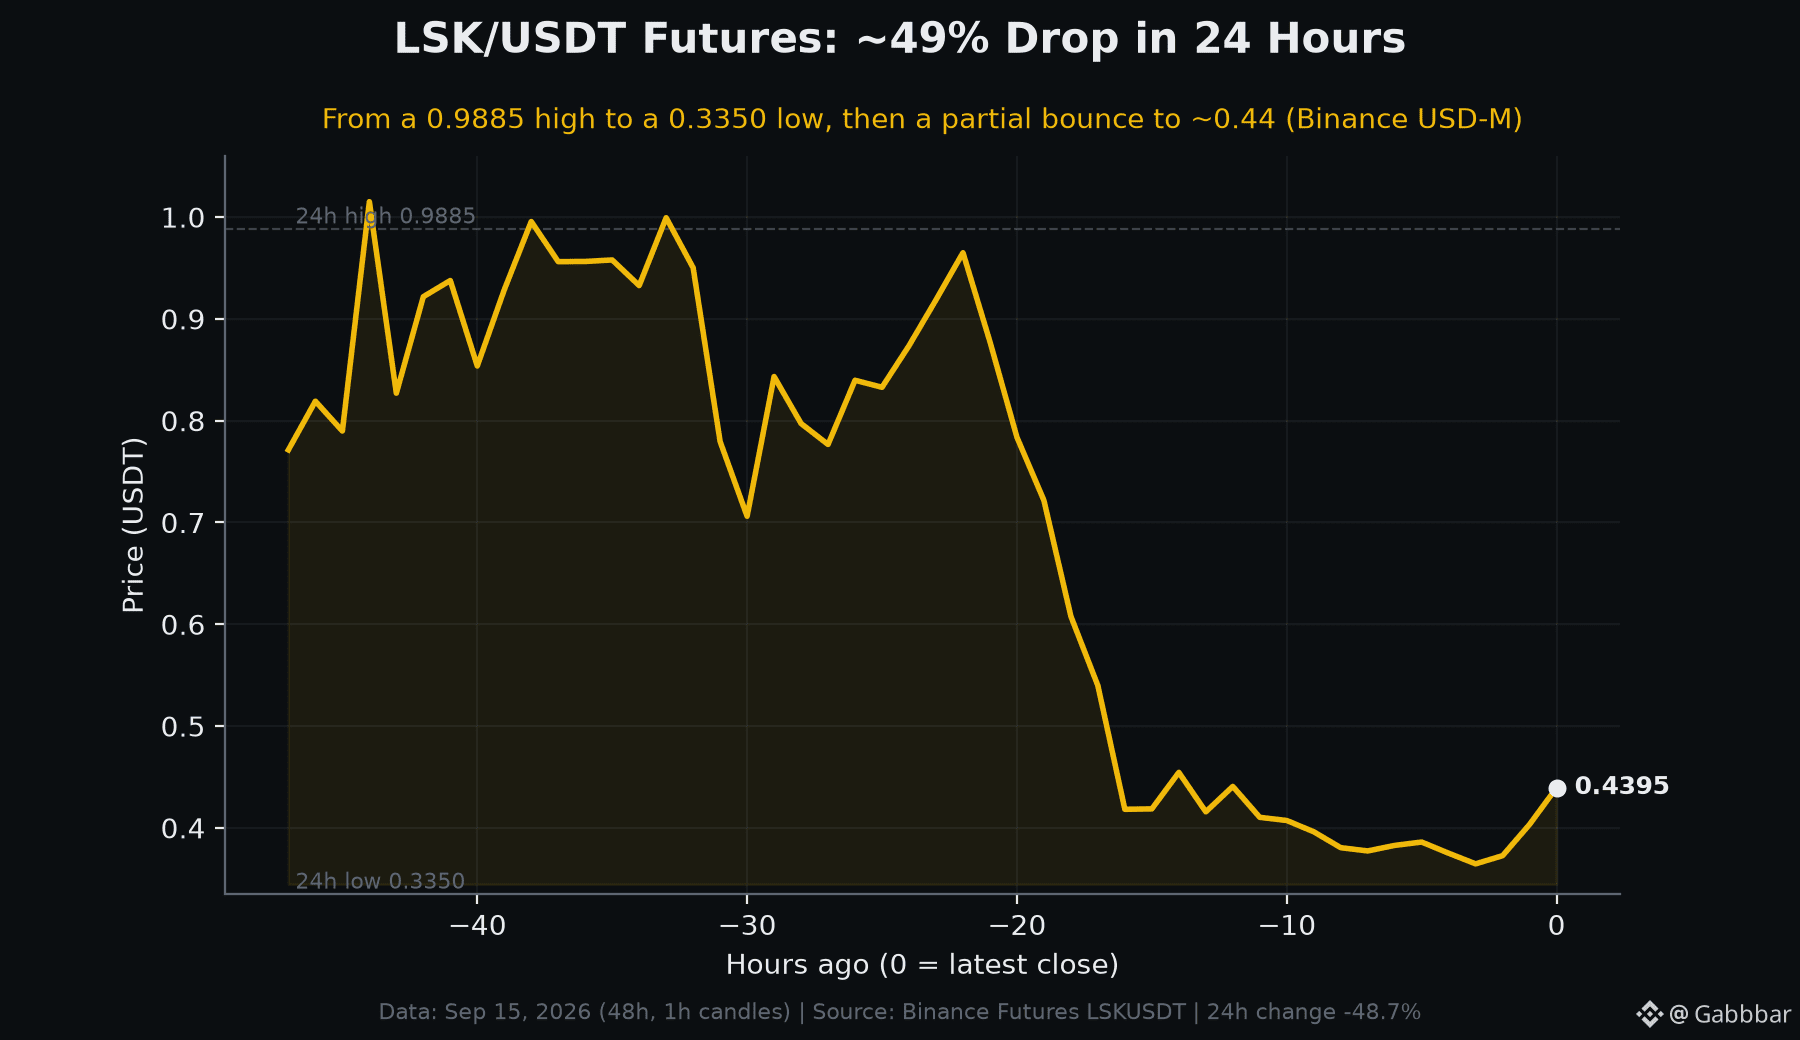
A token can trade below its own 24-hour average price and still be up on the hour. That was LSK/USDT perpetual futures on Binance on September 15, 2026: the pair changed hands around 0.4366, well under its 24h volume-weighted average of about 0.5115 -- yet was ticking higher off the lows as the session closed.
The 24h picture (Binance USD-M, LSKUSDT):
- Last price: ~0.4366
- 24h change: -48.7%
- 24h high: 0.9885
- 24h low: 0.3350
- 24h volume: ~2.67B LSK (~1.36B USDT notional)
The hourly candles tell the story of a two-stage move. LSK spent the first half of the window chopping between roughly 0.70 and 1.00, even printing a brief spike toward 1.15. Then, over a handful of hours, it broke down hard -- sliding from the high-0.70s to a 0.3350 low, a drop of more than 50% from the intraday top. Since that low it has bounced modestly back toward 0.44.
Two things worth flagging for anyone reading futures data. First, volume: ~1.36B USDT of turnover in a day on a mid-cap perp signals a genuine liquidation-and-repricing event, not a quiet drift. Second, the gap between last price and the 24h VWAP (~0.51) shows most of the day's trading happened at higher levels than where price sits now -- a reminder that "24h change" compresses a very uneven session into one number.
When a perp drops ~49% in a day then bounces, which data point tells you more about what's next: the size of the volume spike, or where price is relative to its VWAP?
#LSK #Futures #CryptoTrading
A token can trade below its own 24-hour average price and still be up on the hour. That was LSK/USDT perpetual futures on Binance on September 15, 2026: the pair changed hands around 0.4366, well under its 24h volume-weighted average of about 0.5115 -- yet was ticking higher off the lows as the session closed.
The 24h picture (Binance USD-M, LSKUSDT):
- Last price: ~0.4366
- 24h change: -48.7%
- 24h high: 0.9885
- 24h low: 0.3350
- 24h volume: ~2.67B LSK (~1.36B USDT notional)
The hourly candles tell the story of a two-stage move. LSK spent the first half of the window chopping between roughly 0.70 and 1.00, even printing a brief spike toward 1.15. Then, over a handful of hours, it broke down hard -- sliding from the high-0.70s to a 0.3350 low, a drop of more than 50% from the intraday top. Since that low it has bounced modestly back toward 0.44.
Two things worth flagging for anyone reading futures data. First, volume: ~1.36B USDT of turnover in a day on a mid-cap perp signals a genuine liquidation-and-repricing event, not a quiet drift. Second, the gap between last price and the 24h VWAP (~0.51) shows most of the day's trading happened at higher levels than where price sits now -- a reminder that "24h change" compresses a very uneven session into one number.
When a perp drops ~49% in a day then bounces, which data point tells you more about what's next: the size of the volume spike, or where price is relative to its VWAP?
#LSK #Futures #CryptoTrading
The 24h picture (Binance USD-M, LSKUSDT):
- Last price: ~0.4366
- 24h change: -48.7%
- 24h high: 0.9885
- 24h low: 0.3350
- 24h volume: ~2.67B LSK (~1.36B USDT notional)
The hourly candles tell the story of a two-stage move. LSK spent the first half of the window chopping between roughly 0.70 and 1.00, even printing a brief spike toward 1.15. Then, over a handful of hours, it broke down hard -- sliding from the high-0.70s to a 0.3350 low, a drop of more than 50% from the intraday top. Since that low it has bounced modestly back toward 0.44.
Two things worth flagging for anyone reading futures data. First, volume: ~1.36B USDT of turnover in a day on a mid-cap perp signals a genuine liquidation-and-repricing event, not a quiet drift. Second, the gap between last price and the 24h VWAP (~0.51) shows most of the day's trading happened at higher levels than where price sits now -- a reminder that "24h change" compresses a very uneven session into one number.
When a perp drops ~49% in a day then bounces, which data point tells you more about what's next: the size of the volume spike, or where price is relative to its VWAP?
#LSK #Futures #CryptoTrading
132
·
--
ເບິ່ງການແປ
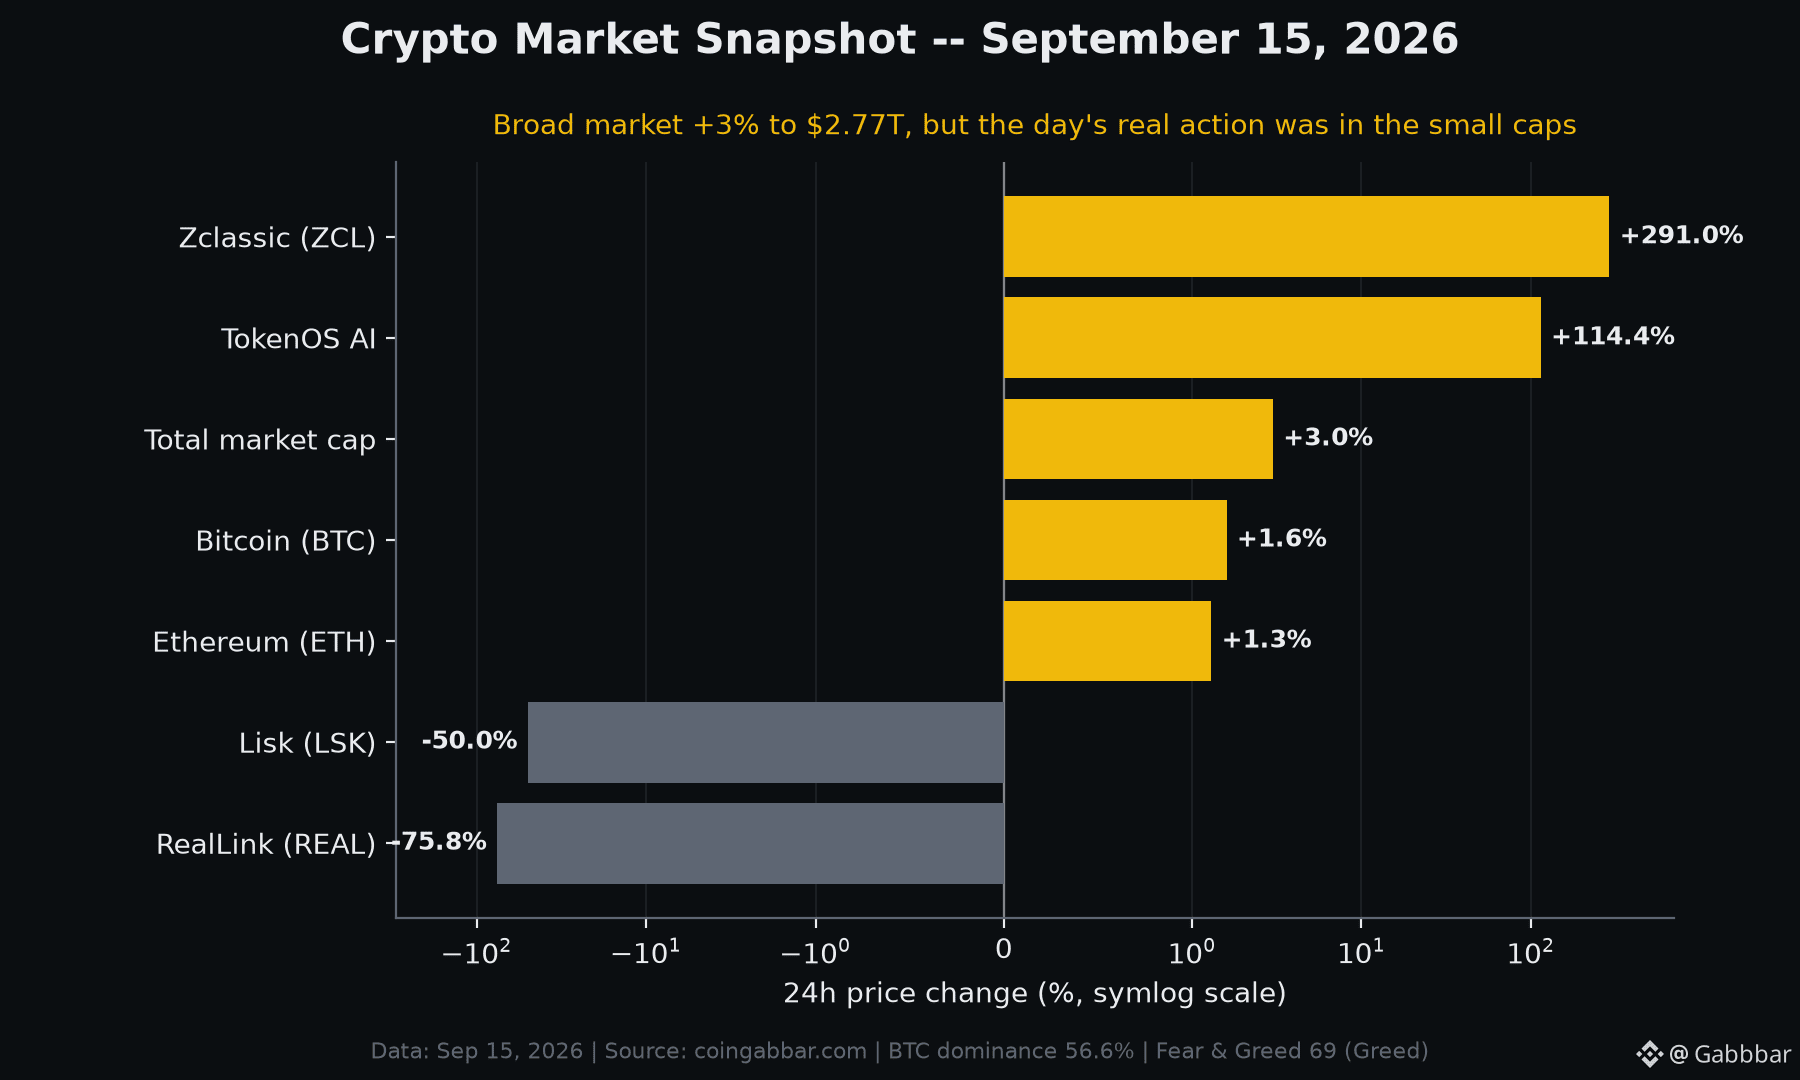
A green day at the index level can hide a 366-percentage-point spread underneath it. On September 15, 2026, the total crypto market cap rose about 3% to $2.77 trillion -- a calm, broadly positive session on the surface. But the day's real story was dispersion between the majors and the small caps.
The majors moved modestly:
- Total market cap: $2.77T (+3.0%)
- Bitcoin: $77,983.80 (+1.6%)
- Ethereum: $2,514.02 (+1.3%)
- 24h total volume: $91.8B
Structure of the market that day:
- BTC dominance: 56.6%
- ETH dominance: 11.1%
- Fear & Greed Index: 69 (Greed)
Now the tails. Among the notable movers on Sep 15, Zclassic (ZCL) reportedly jumped about +291% and TokenOS AI roughly +114%, while RealLink (REAL) fell about -75.8% and Lisk (LSK) around -50%. That is a spread of more than 366 percentage points between the biggest gainer and biggest loser in a single 24-hour window -- on a day the headline number was a quiet +3%.
This is a recurring pattern worth internalizing: a Greed reading and a rising total cap describe the average, not the distribution. Beneath a stable BTC-dominant market, low-liquidity small caps can still swing triple digits in either direction within hours.
When you read a market update, do you check the headline market-cap change, the Fear & Greed number, or the spread between the day's best and worst performers -- and which one actually tells you the most about risk?
#CryptoMarket #Bitcoin #Ethereum
A green day at the index level can hide a 366-percentage-point spread underneath it. On September 15, 2026, the total crypto market cap rose about 3% to $2.77 trillion -- a calm, broadly positive session on the surface. But the day's real story was dispersion between the majors and the small caps.
The majors moved modestly:
- Total market cap: $2.77T (+3.0%)
- Bitcoin: $77,983.80 (+1.6%)
- Ethereum: $2,514.02 (+1.3%)
- 24h total volume: $91.8B
Structure of the market that day:
- BTC dominance: 56.6%
- ETH dominance: 11.1%
- Fear & Greed Index: 69 (Greed)
Now the tails. Among the notable movers on Sep 15, Zclassic (ZCL) reportedly jumped about +291% and TokenOS AI roughly +114%, while RealLink (REAL) fell about -75.8% and Lisk (LSK) around -50%. That is a spread of more than 366 percentage points between the biggest gainer and biggest loser in a single 24-hour window -- on a day the headline number was a quiet +3%.
This is a recurring pattern worth internalizing: a Greed reading and a rising total cap describe the average, not the distribution. Beneath a stable BTC-dominant market, low-liquidity small caps can still swing triple digits in either direction within hours.
When you read a market update, do you check the headline market-cap change, the Fear & Greed number, or the spread between the day's best and worst performers -- and which one actually tells you the most about risk?
#CryptoMarket #Bitcoin #Ethereum
The majors moved modestly:
- Total market cap: $2.77T (+3.0%)
- Bitcoin: $77,983.80 (+1.6%)
- Ethereum: $2,514.02 (+1.3%)
- 24h total volume: $91.8B
Structure of the market that day:
- BTC dominance: 56.6%
- ETH dominance: 11.1%
- Fear & Greed Index: 69 (Greed)
Now the tails. Among the notable movers on Sep 15, Zclassic (ZCL) reportedly jumped about +291% and TokenOS AI roughly +114%, while RealLink (REAL) fell about -75.8% and Lisk (LSK) around -50%. That is a spread of more than 366 percentage points between the biggest gainer and biggest loser in a single 24-hour window -- on a day the headline number was a quiet +3%.
This is a recurring pattern worth internalizing: a Greed reading and a rising total cap describe the average, not the distribution. Beneath a stable BTC-dominant market, low-liquidity small caps can still swing triple digits in either direction within hours.
When you read a market update, do you check the headline market-cap change, the Fear & Greed number, or the spread between the day's best and worst performers -- and which one actually tells you the most about risk?
#CryptoMarket #Bitcoin #Ethereum
1
477
·
--
ເບິ່ງການແປ
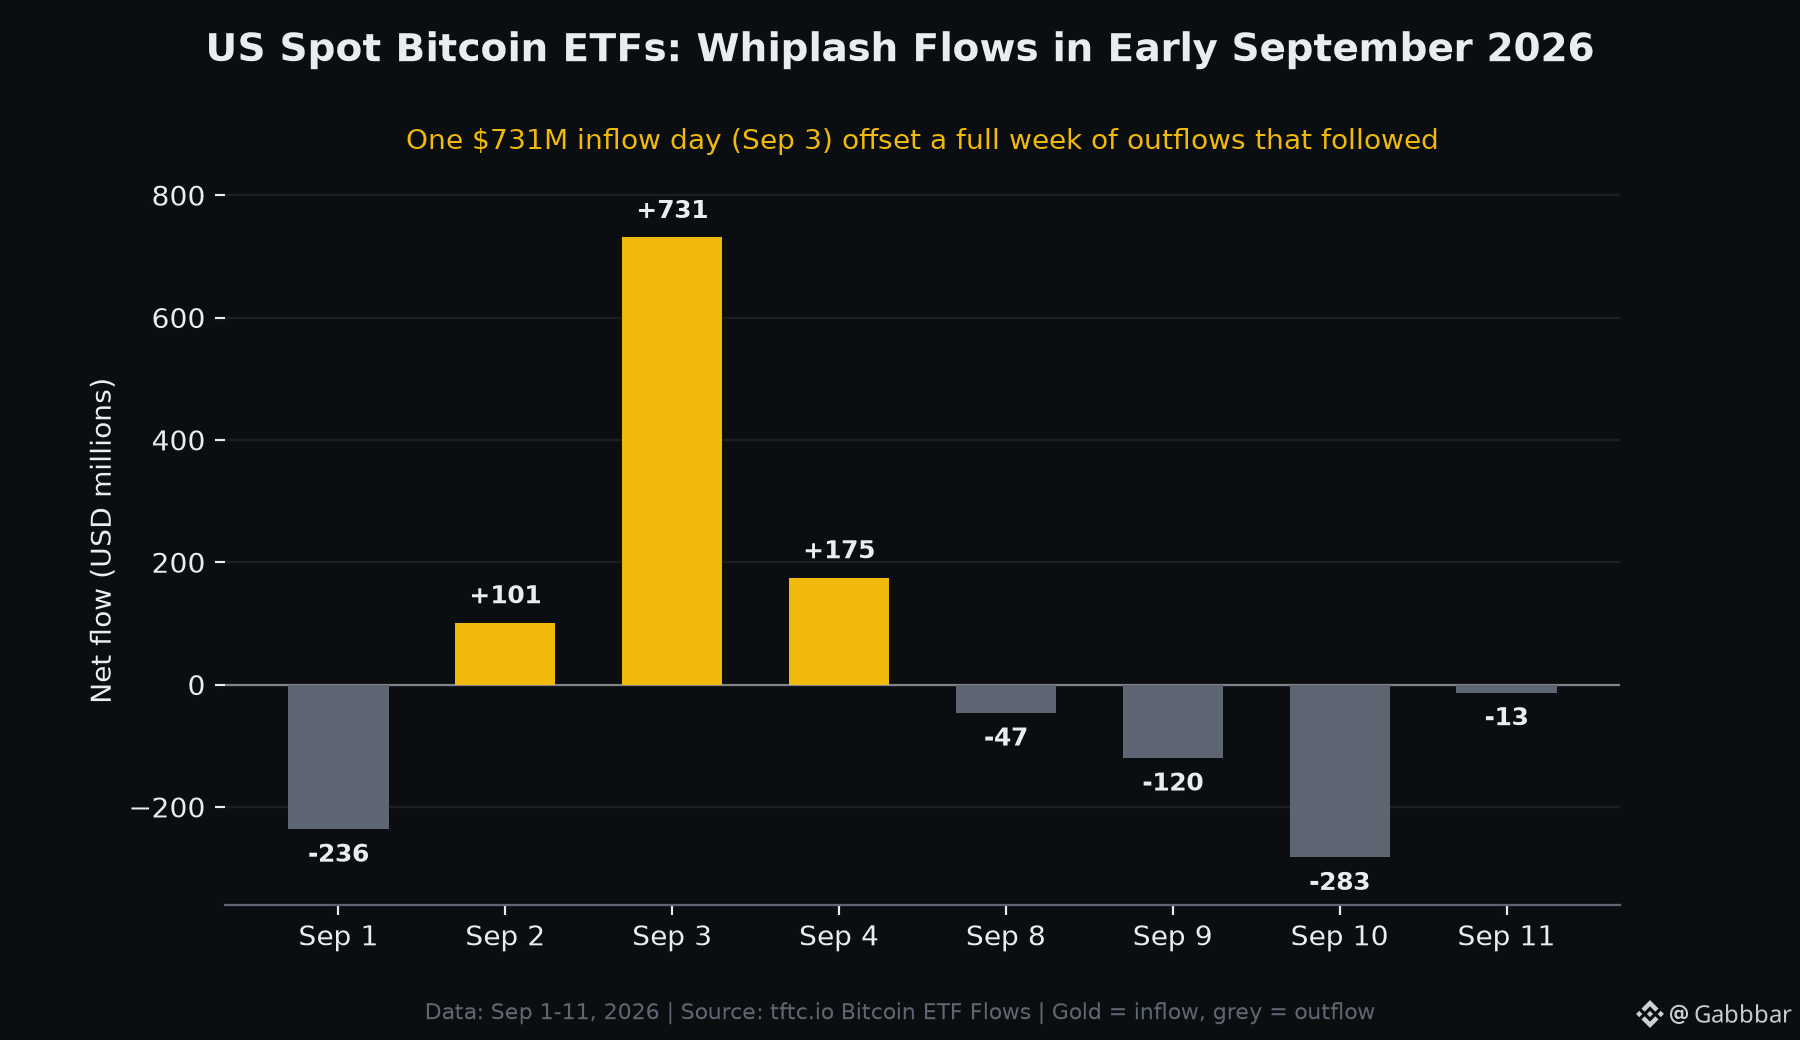
One record day did most of the work. On September 3, 2026, US spot Bitcoin ETFs pulled in $730.9 million in a single session -- their largest daily net inflow since January 2026. But zoom out to the eleven days around it and the picture is far messier than one green bar suggests.
Here is the full early-September sequence (net flows, USD):
- Sep 1: -$236.5M (outflow)
- Sep 2: +$101.1M
- Sep 3: +$730.9M
- Sep 4: +$174.6M
- Sep 8: -$46.6M
- Sep 9: -$120.2M
- Sep 10: -$282.6M
- Sep 11: -$13.3M
Add it up and the eight trading days net to roughly +$307M. In other words, the entire stretch was positive only because of that one Sep 3 spike -- every session that followed it saw money leave.
A concentration detail worth noting: on Sep 3, BlackRock's IBIT alone captured about $454M, more than 60% of all money entering the sector that day, with ARKB (~$138M) and FBTC (~$74M) taking most of the rest. Single-day totals are increasingly driven by one or two funds.
For context, combined US Bitcoin ETF net assets sat near $103.34 billion as of early September 2026 -- roughly 6.3% of Bitcoin's total market cap.
The takeaway isn't direction, it's dispersion: daily ETF flow headlines can swing from record inflow to week-long outflow within days. When you see a single-day flow number, what's the right window to judge institutional demand -- a day, a week, or a month?
#Bitcoin #BitcoinETF #CryptoNews
One record day did most of the work. On September 3, 2026, US spot Bitcoin ETFs pulled in $730.9 million in a single session -- their largest daily net inflow since January 2026. But zoom out to the eleven days around it and the picture is far messier than one green bar suggests.
Here is the full early-September sequence (net flows, USD):
- Sep 1: -$236.5M (outflow)
- Sep 2: +$101.1M
- Sep 3: +$730.9M
- Sep 4: +$174.6M
- Sep 8: -$46.6M
- Sep 9: -$120.2M
- Sep 10: -$282.6M
- Sep 11: -$13.3M
Add it up and the eight trading days net to roughly +$307M. In other words, the entire stretch was positive only because of that one Sep 3 spike -- every session that followed it saw money leave.
A concentration detail worth noting: on Sep 3, BlackRock's IBIT alone captured about $454M, more than 60% of all money entering the sector that day, with ARKB (~$138M) and FBTC (~$74M) taking most of the rest. Single-day totals are increasingly driven by one or two funds.
For context, combined US Bitcoin ETF net assets sat near $103.34 billion as of early September 2026 -- roughly 6.3% of Bitcoin's total market cap.
The takeaway isn't direction, it's dispersion: daily ETF flow headlines can swing from record inflow to week-long outflow within days. When you see a single-day flow number, what's the right window to judge institutional demand -- a day, a week, or a month?
#Bitcoin #BitcoinETF #CryptoNews
Here is the full early-September sequence (net flows, USD):
- Sep 1: -$236.5M (outflow)
- Sep 2: +$101.1M
- Sep 3: +$730.9M
- Sep 4: +$174.6M
- Sep 8: -$46.6M
- Sep 9: -$120.2M
- Sep 10: -$282.6M
- Sep 11: -$13.3M
Add it up and the eight trading days net to roughly +$307M. In other words, the entire stretch was positive only because of that one Sep 3 spike -- every session that followed it saw money leave.
A concentration detail worth noting: on Sep 3, BlackRock's IBIT alone captured about $454M, more than 60% of all money entering the sector that day, with ARKB (~$138M) and FBTC (~$74M) taking most of the rest. Single-day totals are increasingly driven by one or two funds.
For context, combined US Bitcoin ETF net assets sat near $103.34 billion as of early September 2026 -- roughly 6.3% of Bitcoin's total market cap.
The takeaway isn't direction, it's dispersion: daily ETF flow headlines can swing from record inflow to week-long outflow within days. When you see a single-day flow number, what's the right window to judge institutional demand -- a day, a week, or a month?
#Bitcoin #BitcoinETF #CryptoNews
65
·
--
ເບິ່ງການແປ
Bitcoin dominance is one of the most quoted numbers in crypto — and one of the least consistent.
Check three trackers right now and you might see 57%, 59%, and 60%. None of them is wrong. They're answering slightly different questions.
The formula is simple: BTC market cap ÷ total crypto market cap × 100.
The argument is over what goes in the denominator.
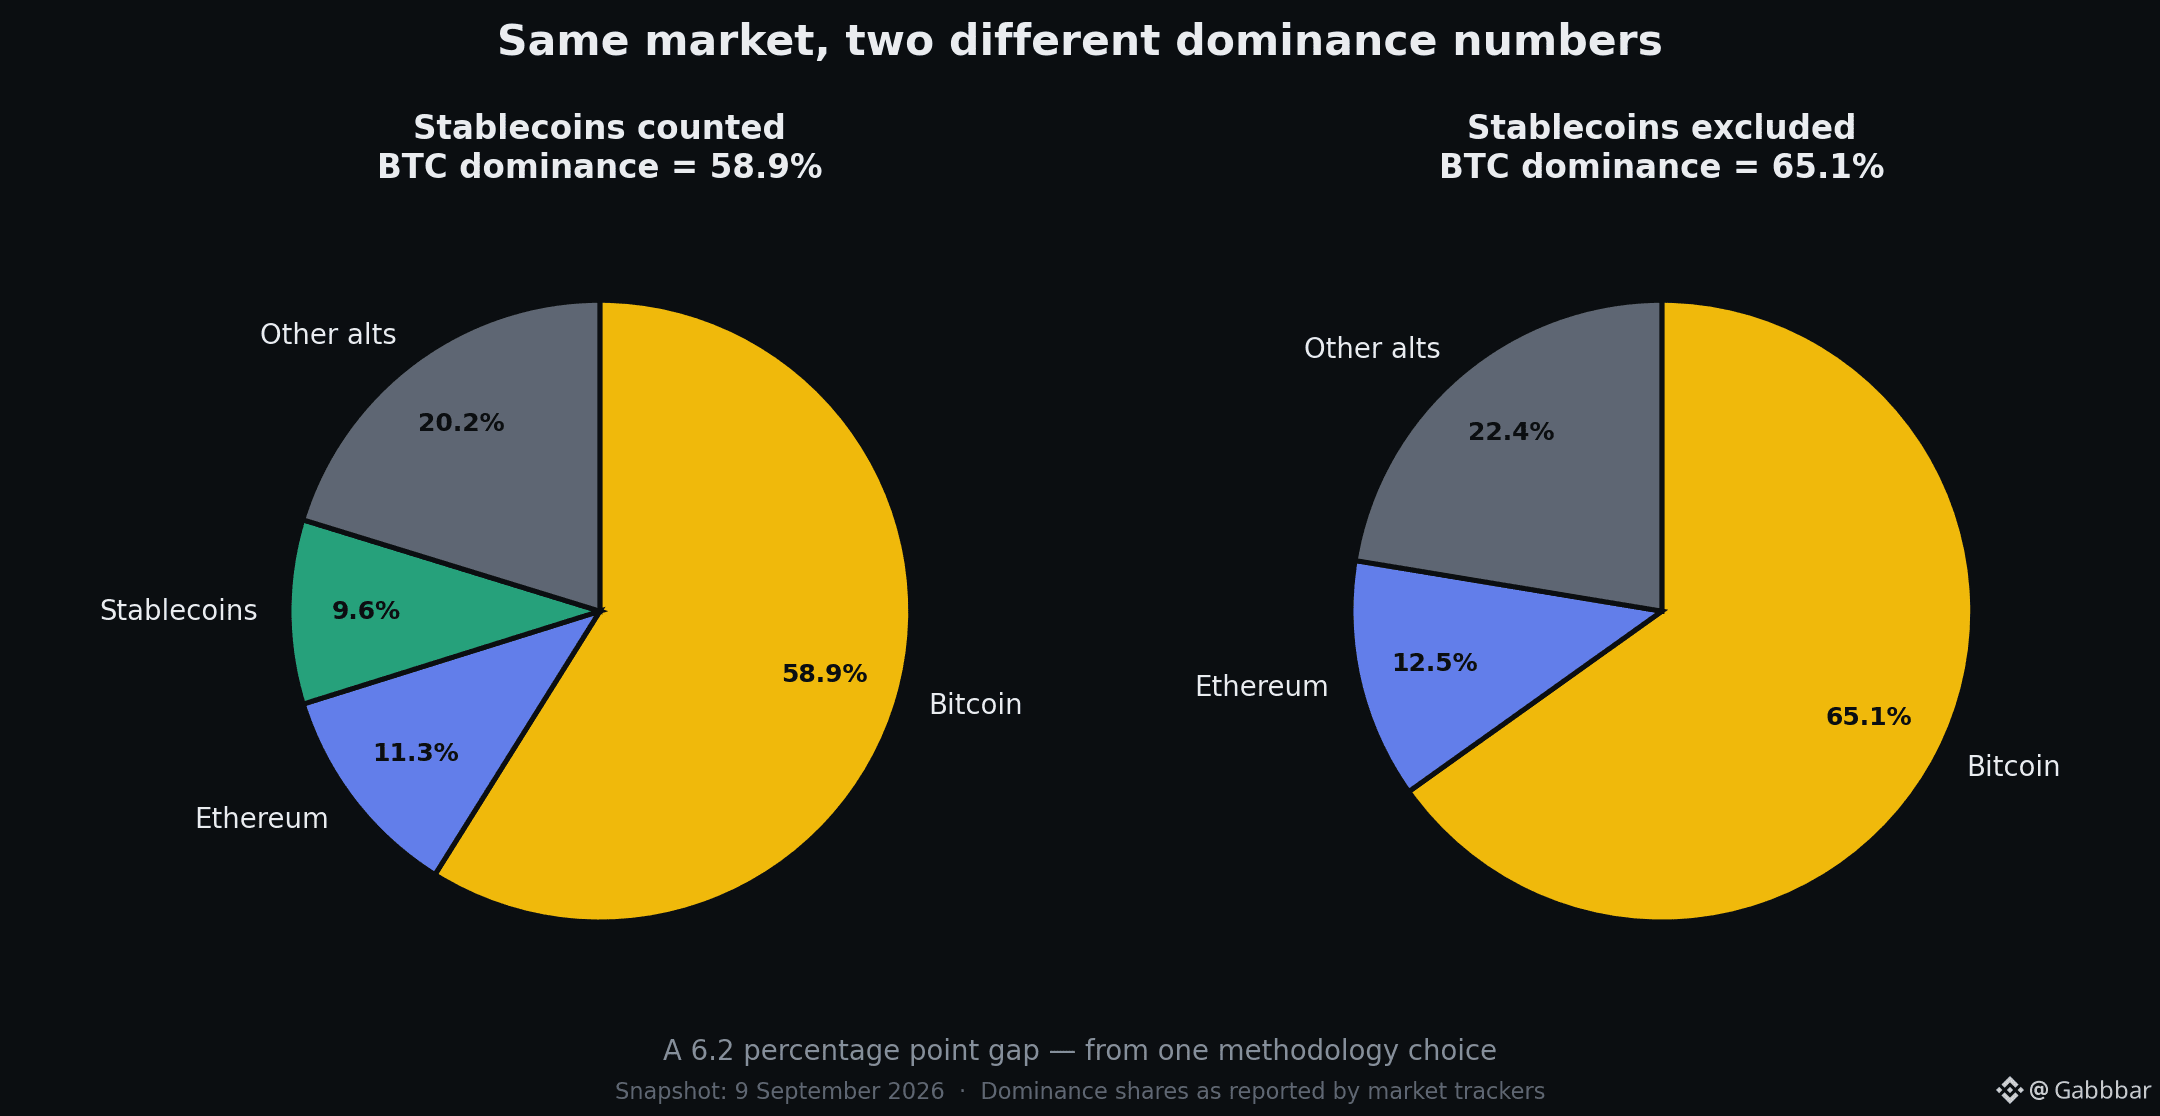
Stablecoins now sit near 10% of the total crypto market. Include them and BTC dominance reads ~58.9%. Exclude them and the same market reads ~65.1%.
Same day. Same market. A 6.2 point gap.
The case for excluding them: stablecoins aren't competing with Bitcoin for capital. They're parked cash — sideline money waiting to be deployed.
The case for including them: that parked cash is still capital sitting inside crypto, and where it sits tells you something about positioning.
One practical consequence worth knowing: BTC dominance can rise while Bitcoin falls, if altcoins are falling faster. Dominance measures share, not price.
So next time a dominance chart gets quoted at you, the useful question isn't "is this bullish" — it's "what's in the denominator?"
#Bitcoin #BTC #CryptoEducation
Bitcoin dominance is one of the most quoted numbers in crypto — and one of the least consistent.
Check three trackers right now and you might see 57%, 59%, and 60%. None of them is wrong. They're answering slightly different questions.
The formula is simple: BTC market cap ÷ total crypto market cap × 100.
The argument is over what goes in the denominator.
Stablecoins now sit near 10% of the total crypto market. Include them and BTC dominance reads ~58.9%. Exclude them and the same market reads ~65.1%.
Same day. Same market. A 6.2 point gap.
The case for excluding them: stablecoins aren't competing with Bitcoin for capital. They're parked cash — sideline money waiting to be deployed.
The case for including them: that parked cash is still capital sitting inside crypto, and where it sits tells you something about positioning.
One practical consequence worth knowing: BTC dominance can rise while Bitcoin falls, if altcoins are falling faster. Dominance measures share, not price.
So next time a dominance chart gets quoted at you, the useful question isn't "is this bullish" — it's "what's in the denominator?"
#Bitcoin #BTC #CryptoEducation
Check three trackers right now and you might see 57%, 59%, and 60%. None of them is wrong. They're answering slightly different questions.
The formula is simple: BTC market cap ÷ total crypto market cap × 100.
The argument is over what goes in the denominator.
Stablecoins now sit near 10% of the total crypto market. Include them and BTC dominance reads ~58.9%. Exclude them and the same market reads ~65.1%.
Same day. Same market. A 6.2 point gap.
The case for excluding them: stablecoins aren't competing with Bitcoin for capital. They're parked cash — sideline money waiting to be deployed.
The case for including them: that parked cash is still capital sitting inside crypto, and where it sits tells you something about positioning.
One practical consequence worth knowing: BTC dominance can rise while Bitcoin falls, if altcoins are falling faster. Dominance measures share, not price.
So next time a dominance chart gets quoted at you, the useful question isn't "is this bullish" — it's "what's in the denominator?"
#Bitcoin #BTC #CryptoEducation
160
ເຂົ້າສູ່ລະບົບເພື່ອສຳຫຼວດເນື້ອຫາເພີ່ມເຕີມ
ເຂົ້າຮ່ວມກຸ່ມຜູ້ໃຊ້ຄຣິບໂຕທົ່ວໂລກໃນ Binance Square.
⚡️ ໄດ້ຮັບຂໍ້ມູນຫຼ້າສຸດ ແລະ ທີ່ມີປະໂຫຍດກ່ຽວກັບຄຣິບໂຕ.
💬 ໄດ້ຮັບຄວາມໄວ້ວາງໃຈຈາກຕະຫຼາດແລກປ່ຽນຄຣິບໂຕທີ່ໃຫຍ່ທີ່ສຸດໃນໂລກ.
👍 ຄົ້ນຫາຂໍ້ມູນເຊີງເລິກທີ່ແທ້ຈາກນັກສ້າງທີ່ໄດ້ຮັບການຢືນຢັນ.
ອີເມວ / ເບີໂທລະສັບ
ຫົວຂໍ້ທີ່ກໍາລັງນິຍົມ
FedRateWatch
4,914 views
26 ກຳລັງສົນທະນາ
#FedWatch is បង្ហាញពីប្រហែល 93–94% នៃលទ្ធភាពនៃការឡើងអត្រា ខណៈពេលដែលទិន្នន័យអតិផរណាថ្មីៗ និងតម្លៃប្រេងកើនឡើងនៅតែបន្តដាក់សម្ពាធលើ Fed។
សម្រាប់គ្រីបតូ នេះជាពេលវេលាដ៏សំខាន់មួយ។ Bitcoin បានស្ថិតនៅក្រោមសម្ពាធហើយនៅជុំវិញតំបន់ $77K–$78K ខណៈដែលអ្នកជួញដូរកំពុងរៀបចំសម្រាប់សេចក្តីសម្រេចចិត្ត។
ការឡើងអត្រាខ្លួនវាអាចត្រូវបានរាប់បញ្ចូលក្នុងតម្លៃហើយ។ សម្រាប់ខ្ញុំ សំណួរធំគឺថា Powell នឹងនិយាយអំពីគោលនយោបាយរូបិយវត្ថុនាពេលអនាគតយ៉ាងដូចម្តេច។
បើ Fed ស្តាប់ទៅមានលក្ខណៈតឹងរ៉ឹង (hawkish) ជាងមុន $BTC និងទ្រព្យសកម្មដែលមានហានិភ័យផ្សេងៗអាចប្រឈមនឹងសម្ពាធលក់កាន់តែខ្លាំង។ តែបើការឡើងអត្រាមកជាមួយទស្សនវិស័យទន់ជាង នោះយើងអាចឃើញចលនាសម្រាក (relief move) ។
ទស្សនៈខ្ញុំ៖ សូមប្រុងប្រយ័ត្នក្នុងអំឡុងពេលប្រកាស។ កុំ FOMO ចូលទៅក្នុងការប្រែប្រួលឡើង (breakout) ឬ panic-sell លក់ទម្លាក់ (dip) ដោយគ្មានការបញ្ជាក់។
តើអ្នកគិតយ៉ាងណា — ប្រតិកម្មខ្លាំងឡើង (bullish) ឬ BTC ធ្លាក់ចុះទៀត?
#FedRateWatch #Bitcoin #Crypto
XOHEI_TRADERS
·1 ຖືກໃຈ
·37 views
BitcoinReboundsTo$79K
32,794 views
261 ກຳລັງສົນທະນາ
BessentEndorsesFinalClarityActDraft
610 views
65 ກຳລັງສົນທະນາ