
CHPY分红日记
96 Posts

CHPY分红日记
Report
Block User
CHPY/QLDY 高频分红实盘 📊美股复盘 · 加密观察 · 宏观解读,每周晒分红到账,只记真实盈亏,分红是现金流,回报才是关键
2 Following
4 Followers
7 Liked
Posts
·
--
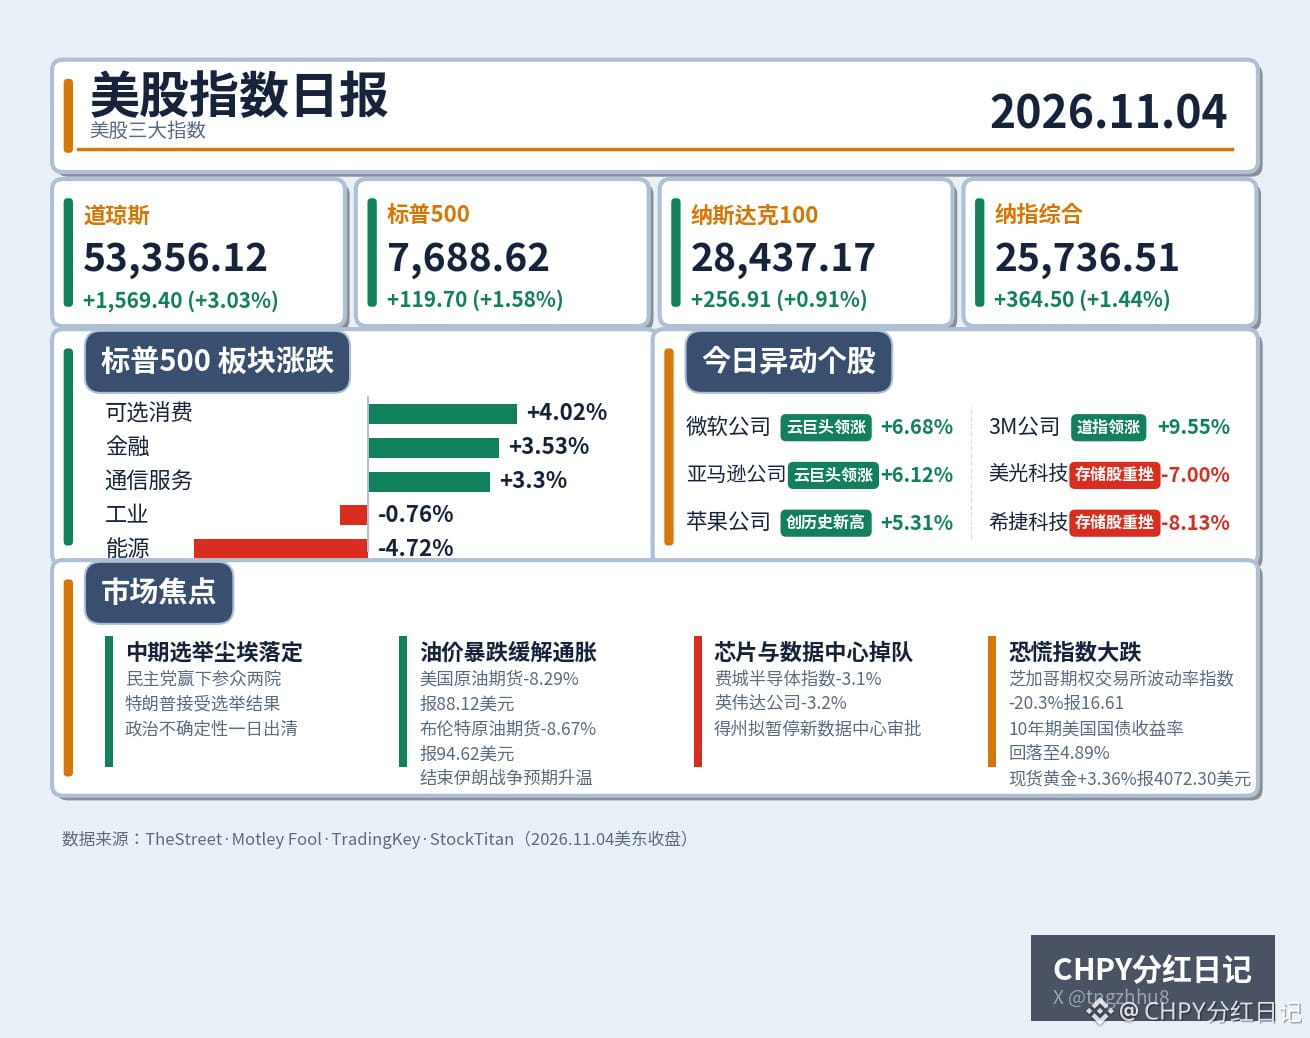
Last night, U.S. stocks staged a dramatic election-night reversal: the Dow Jones Industrial Average surged 3.03% to close at 53,356.12, its best single-day performance since April 9, 2025, and its strongest post-midterm-election rally in 44 years. The S&P 500 rose 1.58% to close at 7,688.62, the Nasdaq Composite gained 1.44% to 25,736.51, and the Nasdaq 100 climbed 0.91% to 28,437.17. Before the opening bell, things looked very different: election-night futures had fallen more than 2% at one point, and Nasdaq 100 futures hit an overnight low of 27,615.75. But once the results came in and Trump accepted them, investors bought stocks back throughout the day.
The chain of events was actually quite straightforward, driven by two forces. First, political uncertainty lifted: Democrats won both the House and Senate, and a divided government reassured markets, wiping out expectations of a sharp policy shift. Second, oil prices plunged: U.S. crude futures fell 8.29% to $88.12, while Brent crude futures dropped 8.67% to $94.62. Markets bet the election results would help bring the war with Iran to an end and stabilize crude supplies, easing inflationary pressure. As inflation expectations cooled, the 10-year U.S. Treasury yield fell to 4.89%, the U.S. Dollar Index slipped to around 101.5, and the Cboe Volatility Index (VIX, the fear gauge) plunged 20.3% to 16.61. Fear quickly drained away, and investors felt comfortable coming back. Even spot gold rose 3.36% to $4,072.30—a rare instance last night of safe-haven demand and risk appetite moving in the same direction.
But gains were highly uneven; this was not a broad-based rally. Consumer discretionary (+4.02%), financials (+3.53%), and communication services (+3.30%) led the way. Microsoft rose 6.68%, Amazon gained 6.12%, Apple climbed 5.31% to a record high, and 3M jumped 9.55%. Money flowed into traditional industries and cloud giants, but not chips: the Philadelphia Semiconductor Index fell 3.1%, Nvidia dropped 3.2%, and memory stocks were hit even harder. Micron Technology fell 7.00%, Sandisk dropped 7.91%, and Seagate Technology slid 8.13%. Texas's newly elected governor pledged to pause approvals for new data centers, and the data center sector was yesterday's hardest-hit area: Vestas Energy fell 13.8%, Vertiv dropped 12.9%, and CoreWeave declined 9.9%.
This is a reminder for CHPY holders: Micron Technology is one of CHPY's top five holdings, with a weighting of about 4.89%. The selloff in memory stocks, combined with the Philadelphia Semiconductor Index's monthly decline of more than 16%—which has already triggered the pause on reinvestment—means pressure on the semiconductor sector has not yet passed.
Put simply, this rally was a double boost from “uncertainty easing and oil prices falling,” not a fundamental reversal. With the election uncertainty gone and oil prices down, there is still room for a short-term recovery in sentiment. But weakness in chips and data centers shows investors are becoming more selective about the narrative of heavy AI investment: cloud giants are being rewarded, while the capital-intensive infrastructure supply chain is being punished. The real dividing line ahead is Friday's U.S. October nonfarm payrolls report, followed by the U.S. October Consumer Price Index data on November 10. These two releases will determine whether rates are cut in December. Qualcomm fell about 6% after hours, while Arm dropped 2%–3%, already sounding an early warning for chip stocks. For today, first watch the U.S. initial jobless claims due at 8:30 tonight. Those chasing chip stocks higher in the short term should be cautious; until semiconductors find their footing, the index rebound deserves a discount.
#美股 #Midterm elections
Last night, U.S. stocks staged a dramatic election-night reversal: the Dow Jones Industrial Average surged 3.03% to close at 53,356.12, its best single-day performance since April 9, 2025, and its strongest post-midterm-election rally in 44 years. The S&P 500 rose 1.58% to close at 7,688.62, the Nasdaq Composite gained 1.44% to 25,736.51, and the Nasdaq 100 climbed 0.91% to 28,437.17. Before the opening bell, things looked very different: election-night futures had fallen more than 2% at one point, and Nasdaq 100 futures hit an overnight low of 27,615.75. But once the results came in and Trump accepted them, investors bought stocks back throughout the day.
The chain of events was actually quite straightforward, driven by two forces. First, political uncertainty lifted: Democrats won both the House and Senate, and a divided government reassured markets, wiping out expectations of a sharp policy shift. Second, oil prices plunged: U.S. crude futures fell 8.29% to $88.12, while Brent crude futures dropped 8.67% to $94.62. Markets bet the election results would help bring the war with Iran to an end and stabilize crude supplies, easing inflationary pressure. As inflation expectations cooled, the 10-year U.S. Treasury yield fell to 4.89%, the U.S. Dollar Index slipped to around 101.5, and the Cboe Volatility Index (VIX, the fear gauge) plunged 20.3% to 16.61. Fear quickly drained away, and investors felt comfortable coming back. Even spot gold rose 3.36% to $4,072.30—a rare instance last night of safe-haven demand and risk appetite moving in the same direction.
But gains were highly uneven; this was not a broad-based rally. Consumer discretionary (+4.02%), financials (+3.53%), and communication services (+3.30%) led the way. Microsoft rose 6.68%, Amazon gained 6.12%, Apple climbed 5.31% to a record high, and 3M jumped 9.55%. Money flowed into traditional industries and cloud giants, but not chips: the Philadelphia Semiconductor Index fell 3.1%, Nvidia dropped 3.2%, and memory stocks were hit even harder. Micron Technology fell 7.00%, Sandisk dropped 7.91%, and Seagate Technology slid 8.13%. Texas's newly elected governor pledged to pause approvals for new data centers, and the data center sector was yesterday's hardest-hit area: Vestas Energy fell 13.8%, Vertiv dropped 12.9%, and CoreWeave declined 9.9%.
This is a reminder for CHPY holders: Micron Technology is one of CHPY's top five holdings, with a weighting of about 4.89%. The selloff in memory stocks, combined with the Philadelphia Semiconductor Index's monthly decline of more than 16%—which has already triggered the pause on reinvestment—means pressure on the semiconductor sector has not yet passed.
Put simply, this rally was a double boost from “uncertainty easing and oil prices falling,” not a fundamental reversal. With the election uncertainty gone and oil prices down, there is still room for a short-term recovery in sentiment. But weakness in chips and data centers shows investors are becoming more selective about the narrative of heavy AI investment: cloud giants are being rewarded, while the capital-intensive infrastructure supply chain is being punished. The real dividing line ahead is Friday's U.S. October nonfarm payrolls report, followed by the U.S. October Consumer Price Index data on November 10. These two releases will determine whether rates are cut in December. Qualcomm fell about 6% after hours, while Arm dropped 2%–3%, already sounding an early warning for chip stocks. For today, first watch the U.S. initial jobless claims due at 8:30 tonight. Those chasing chip stocks higher in the short term should be cautious; until semiconductors find their footing, the index rebound deserves a discount.
#美股 #Midterm elections
The chain of events was actually quite straightforward, driven by two forces. First, political uncertainty lifted: Democrats won both the House and Senate, and a divided government reassured markets, wiping out expectations of a sharp policy shift. Second, oil prices plunged: U.S. crude futures fell 8.29% to $88.12, while Brent crude futures dropped 8.67% to $94.62. Markets bet the election results would help bring the war with Iran to an end and stabilize crude supplies, easing inflationary pressure. As inflation expectations cooled, the 10-year U.S. Treasury yield fell to 4.89%, the U.S. Dollar Index slipped to around 101.5, and the Cboe Volatility Index (VIX, the fear gauge) plunged 20.3% to 16.61. Fear quickly drained away, and investors felt comfortable coming back. Even spot gold rose 3.36% to $4,072.30—a rare instance last night of safe-haven demand and risk appetite moving in the same direction.
But gains were highly uneven; this was not a broad-based rally. Consumer discretionary (+4.02%), financials (+3.53%), and communication services (+3.30%) led the way. Microsoft rose 6.68%, Amazon gained 6.12%, Apple climbed 5.31% to a record high, and 3M jumped 9.55%. Money flowed into traditional industries and cloud giants, but not chips: the Philadelphia Semiconductor Index fell 3.1%, Nvidia dropped 3.2%, and memory stocks were hit even harder. Micron Technology fell 7.00%, Sandisk dropped 7.91%, and Seagate Technology slid 8.13%. Texas's newly elected governor pledged to pause approvals for new data centers, and the data center sector was yesterday's hardest-hit area: Vestas Energy fell 13.8%, Vertiv dropped 12.9%, and CoreWeave declined 9.9%.
This is a reminder for CHPY holders: Micron Technology is one of CHPY's top five holdings, with a weighting of about 4.89%. The selloff in memory stocks, combined with the Philadelphia Semiconductor Index's monthly decline of more than 16%—which has already triggered the pause on reinvestment—means pressure on the semiconductor sector has not yet passed.
Put simply, this rally was a double boost from “uncertainty easing and oil prices falling,” not a fundamental reversal. With the election uncertainty gone and oil prices down, there is still room for a short-term recovery in sentiment. But weakness in chips and data centers shows investors are becoming more selective about the narrative of heavy AI investment: cloud giants are being rewarded, while the capital-intensive infrastructure supply chain is being punished. The real dividing line ahead is Friday's U.S. October nonfarm payrolls report, followed by the U.S. October Consumer Price Index data on November 10. These two releases will determine whether rates are cut in December. Qualcomm fell about 6% after hours, while Arm dropped 2%–3%, already sounding an early warning for chip stocks. For today, first watch the U.S. initial jobless claims due at 8:30 tonight. Those chasing chip stocks higher in the short term should be cautious; until semiconductors find their footing, the index rebound deserves a discount.
#美股 #Midterm elections
33
·
--
CHPY’s dividend this week is confirmed by the brokerage calendar: $0.4229 per share, ex-dividend on November 4, payable November 6.
479 shares comes to $202.57 before tax, or about $141.80 after the 30% withholding tax. After five consecutive weekly declines, it’s down 27.7%. The official annualized payout rate is 40.17%, leaving a buffer of just 0.17 percentage points. It hasn’t breached the 40% threshold, so stick to the plan and keep reinvesting—reinvest when it arrives on Friday.
#CHPY #USStockDividends
CHPY’s dividend this week is confirmed by the brokerage calendar: $0.4229 per share, ex-dividend on November 4, payable November 6.
479 shares comes to $202.57 before tax, or about $141.80 after the 30% withholding tax. After five consecutive weekly declines, it’s down 27.7%. The official annualized payout rate is 40.17%, leaving a buffer of just 0.17 percentage points. It hasn’t breached the 40% threshold, so stick to the plan and keep reinvesting—reinvest when it arrives on Friday.
#CHPY #USStockDividends
479 shares comes to $202.57 before tax, or about $141.80 after the 30% withholding tax. After five consecutive weekly declines, it’s down 27.7%. The official annualized payout rate is 40.17%, leaving a buffer of just 0.17 percentage points. It hasn’t breached the 40% threshold, so stick to the plan and keep reinvesting—reinvest when it arrives on Friday.
#CHPY #USStockDividends

·
--
On election night, crypto took two heavy blows in a single day—and survived both.
First, the initial blow. On November 3, Binance published its investigation into last week’s $6.34 billion theft: the hackers had been laying the groundwork since June. A wallet infrastructure engineer downloaded a tampered installation package, while another engineer fell for a fake job interview. On October 29, the attackers used stolen deployment credentials to transfer 233.46 million XRP from five hot wallets in just four minutes, then swept across multiple blockchains over the next four hours, stealing a total of $6.34 billion. The FBI has blamed North Korean hacking group TraderTraitor for the largest cryptocurrency theft in history. North Korea denies involvement.
A hot wallet is one that stays connected to the internet: convenient, but high-risk. The technology involved in Binance’s breach was designed to have multiple parties manage signing keys (multi-party computation). It was meant to spread risk, but instead slowed the emergency response.
The second blow was political. On US midterm election vote-counting night, the odds of Democrats winning both the House and the Senate surged for a time. Bitcoin plunged from nearly $78,000 to $75,690, its lowest in six weeks. More than 90,000 traders were liquidated in 24 hours, totaling $419 million: $290 million in long positions and about $130 million in shorts. In the panic, Ethereum, Solana, and Binance Coin all fell too.
But neither blow knocked the market down. Bitcoin then staged a V-shaped rebound, recovering to above $78,000 that day. It is now trading at around $78,300, up about 1.1% on the day. On the Binance front, the company covered 98% of the stolen assets out of its own pocket, and about $2.85 billion has been frozen. In the first 9.5 hours after withdrawals resumed on November 1, net outflows totaled $3.64 billion—just 2.1% of its $171 billion in assets. There was no bank run.
The chain of events is actually clear: what the market fears is never simply “something going wrong,” but “no one stepping in to cover the losses.” By reimbursing users in full with company funds, Binance turned a systemic crisis of confidence into an expensive PR problem. On the election front, uncertainty itself was scarier than the result. Once the prospect of a Democratic sweep was settled, the shoe that had been hanging over the market finally dropped, and funds quickly flowed back in. That’s why Bitcoin could plunge more than $2,000 overnight, then recover all of it.
Look deeper, and this market cycle is rewriting how crypto is priced. In the past, prices rose or fell based on whether there was “good news.” Now the question is “who pays when something goes wrong?” The Binance incident shows that a major exchange’s balance sheet is itself a moat. But the flip side is that a moat can also be a single point of failure: $6.3 billion can vanish just like that, and multi-party computation—a technology that had been hailed as a promising solution—failed its first major test. The whole industry will have to reassess whether exchanges are really safe.
The technical picture is sending signals too. Markus Thielen, founder of 10x Research, noted that Bitcoin’s momentum indicators have entered oversold territory, with $82,000 as the next target. The first hurdle lies at $79,500–$80,500, with support at $76,000–$76,600. The Fear and Greed Index has climbed from 26 to 34 but remains in fear territory, suggesting the rebound is driven by short covering and dip-buying, not a return of confidence.
Three risks cannot be ignored. First, about $3.5 billion in stolen funds remains unfrozen; if the hackers sell, that would leave selling pressure hanging over the market. Second, whether crypto regulation will tighten now that Democrats control Congress is the biggest policy wildcard over the coming months. Third, Friday’s US October jobs report: the probability of a December rate hike is still around 77%, and even a modest upside surprise could rattle risk assets again.
Bitcoin is still down about 12.8% year to date and 41% from its October 2025 all-time high of $122,000. The overnight V-shaped rebound is worth applauding, but don’t mistake it for the fanfare announcing a bull market’s return. This looks more like a stress test—one measuring whether the market can get back on its feet after taking a hit. Tonight’s answer: yes, but it’s still a little shaky.
After the close, Qualcomm and Arm earnings will also put demand for AI hardware to the test.
#比特币 #Binance
On election night, crypto took two heavy blows in a single day—and survived both.
First, the initial blow. On November 3, Binance published its investigation into last week’s $6.34 billion theft: the hackers had been laying the groundwork since June. A wallet infrastructure engineer downloaded a tampered installation package, while another engineer fell for a fake job interview. On October 29, the attackers used stolen deployment credentials to transfer 233.46 million XRP from five hot wallets in just four minutes, then swept across multiple blockchains over the next four hours, stealing a total of $6.34 billion. The FBI has blamed North Korean hacking group TraderTraitor for the largest cryptocurrency theft in history. North Korea denies involvement.
A hot wallet is one that stays connected to the internet: convenient, but high-risk. The technology involved in Binance’s breach was designed to have multiple parties manage signing keys (multi-party computation). It was meant to spread risk, but instead slowed the emergency response.
The second blow was political. On US midterm election vote-counting night, the odds of Democrats winning both the House and the Senate surged for a time. Bitcoin plunged from nearly $78,000 to $75,690, its lowest in six weeks. More than 90,000 traders were liquidated in 24 hours, totaling $419 million: $290 million in long positions and about $130 million in shorts. In the panic, Ethereum, Solana, and Binance Coin all fell too.
But neither blow knocked the market down. Bitcoin then staged a V-shaped rebound, recovering to above $78,000 that day. It is now trading at around $78,300, up about 1.1% on the day. On the Binance front, the company covered 98% of the stolen assets out of its own pocket, and about $2.85 billion has been frozen. In the first 9.5 hours after withdrawals resumed on November 1, net outflows totaled $3.64 billion—just 2.1% of its $171 billion in assets. There was no bank run.
The chain of events is actually clear: what the market fears is never simply “something going wrong,” but “no one stepping in to cover the losses.” By reimbursing users in full with company funds, Binance turned a systemic crisis of confidence into an expensive PR problem. On the election front, uncertainty itself was scarier than the result. Once the prospect of a Democratic sweep was settled, the shoe that had been hanging over the market finally dropped, and funds quickly flowed back in. That’s why Bitcoin could plunge more than $2,000 overnight, then recover all of it.
Look deeper, and this market cycle is rewriting how crypto is priced. In the past, prices rose or fell based on whether there was “good news.” Now the question is “who pays when something goes wrong?” The Binance incident shows that a major exchange’s balance sheet is itself a moat. But the flip side is that a moat can also be a single point of failure: $6.3 billion can vanish just like that, and multi-party computation—a technology that had been hailed as a promising solution—failed its first major test. The whole industry will have to reassess whether exchanges are really safe.
The technical picture is sending signals too. Markus Thielen, founder of 10x Research, noted that Bitcoin’s momentum indicators have entered oversold territory, with $82,000 as the next target. The first hurdle lies at $79,500–$80,500, with support at $76,000–$76,600. The Fear and Greed Index has climbed from 26 to 34 but remains in fear territory, suggesting the rebound is driven by short covering and dip-buying, not a return of confidence.
Three risks cannot be ignored. First, about $3.5 billion in stolen funds remains unfrozen; if the hackers sell, that would leave selling pressure hanging over the market. Second, whether crypto regulation will tighten now that Democrats control Congress is the biggest policy wildcard over the coming months. Third, Friday’s US October jobs report: the probability of a December rate hike is still around 77%, and even a modest upside surprise could rattle risk assets again.
Bitcoin is still down about 12.8% year to date and 41% from its October 2025 all-time high of $122,000. The overnight V-shaped rebound is worth applauding, but don’t mistake it for the fanfare announcing a bull market’s return. This looks more like a stress test—one measuring whether the market can get back on its feet after taking a hit. Tonight’s answer: yes, but it’s still a little shaky.
After the close, Qualcomm and Arm earnings will also put demand for AI hardware to the test.
#比特币 #Binance
First, the initial blow. On November 3, Binance published its investigation into last week’s $6.34 billion theft: the hackers had been laying the groundwork since June. A wallet infrastructure engineer downloaded a tampered installation package, while another engineer fell for a fake job interview. On October 29, the attackers used stolen deployment credentials to transfer 233.46 million XRP from five hot wallets in just four minutes, then swept across multiple blockchains over the next four hours, stealing a total of $6.34 billion. The FBI has blamed North Korean hacking group TraderTraitor for the largest cryptocurrency theft in history. North Korea denies involvement.
A hot wallet is one that stays connected to the internet: convenient, but high-risk. The technology involved in Binance’s breach was designed to have multiple parties manage signing keys (multi-party computation). It was meant to spread risk, but instead slowed the emergency response.
The second blow was political. On US midterm election vote-counting night, the odds of Democrats winning both the House and the Senate surged for a time. Bitcoin plunged from nearly $78,000 to $75,690, its lowest in six weeks. More than 90,000 traders were liquidated in 24 hours, totaling $419 million: $290 million in long positions and about $130 million in shorts. In the panic, Ethereum, Solana, and Binance Coin all fell too.
But neither blow knocked the market down. Bitcoin then staged a V-shaped rebound, recovering to above $78,000 that day. It is now trading at around $78,300, up about 1.1% on the day. On the Binance front, the company covered 98% of the stolen assets out of its own pocket, and about $2.85 billion has been frozen. In the first 9.5 hours after withdrawals resumed on November 1, net outflows totaled $3.64 billion—just 2.1% of its $171 billion in assets. There was no bank run.
The chain of events is actually clear: what the market fears is never simply “something going wrong,” but “no one stepping in to cover the losses.” By reimbursing users in full with company funds, Binance turned a systemic crisis of confidence into an expensive PR problem. On the election front, uncertainty itself was scarier than the result. Once the prospect of a Democratic sweep was settled, the shoe that had been hanging over the market finally dropped, and funds quickly flowed back in. That’s why Bitcoin could plunge more than $2,000 overnight, then recover all of it.
Look deeper, and this market cycle is rewriting how crypto is priced. In the past, prices rose or fell based on whether there was “good news.” Now the question is “who pays when something goes wrong?” The Binance incident shows that a major exchange’s balance sheet is itself a moat. But the flip side is that a moat can also be a single point of failure: $6.3 billion can vanish just like that, and multi-party computation—a technology that had been hailed as a promising solution—failed its first major test. The whole industry will have to reassess whether exchanges are really safe.
The technical picture is sending signals too. Markus Thielen, founder of 10x Research, noted that Bitcoin’s momentum indicators have entered oversold territory, with $82,000 as the next target. The first hurdle lies at $79,500–$80,500, with support at $76,000–$76,600. The Fear and Greed Index has climbed from 26 to 34 but remains in fear territory, suggesting the rebound is driven by short covering and dip-buying, not a return of confidence.
Three risks cannot be ignored. First, about $3.5 billion in stolen funds remains unfrozen; if the hackers sell, that would leave selling pressure hanging over the market. Second, whether crypto regulation will tighten now that Democrats control Congress is the biggest policy wildcard over the coming months. Third, Friday’s US October jobs report: the probability of a December rate hike is still around 77%, and even a modest upside surprise could rattle risk assets again.
Bitcoin is still down about 12.8% year to date and 41% from its October 2025 all-time high of $122,000. The overnight V-shaped rebound is worth applauding, but don’t mistake it for the fanfare announcing a bull market’s return. This looks more like a stress test—one measuring whether the market can get back on its feet after taking a hit. Tonight’s answer: yes, but it’s still a little shaky.
After the close, Qualcomm and Arm earnings will also put demand for AI hardware to the test.
#比特币 #Binance
358
·
--
On election night, U.S. stock futures plunged before turning higher, while gold reclaimed $4,000 overnight—the market acted out the full arc from “fear” to “coming around” in a single night.
First, the facts. In the early hours of Wednesday, U.S. Eastern Time, preliminary results showed Democrats sweeping Congress. Nasdaq 100 futures briefly fell more than 2%, S&P 500 futures dropped about 1.2%, and Dow Jones Industrial Average futures slipped about 0.8%. But by daylight, the mood had completely changed: after NBC News projected that Democrats had also won the House, futures turned higher across the board. S&P 500 futures rose about 0.9%, Nasdaq 100 futures gained about 0.8%, and Dow Jones Industrial Average futures climbed around 1.3%.
Safe-haven assets moved even more decisively. Spot gold rose 2.2% to $4,016.01, while December gold futures climbed to $4,026.90. Silver jumped about 4% to around $52. The U.S. Dollar Index fell 0.54% to 101.17, a five-week low; the 10-year U.S. Treasury yield retreated to around 4.90% from Tuesday’s close of 4.95%. Bitcoin hovered below $78,000.
Why the drop, then the rally? Put simply, futures are a “rehearsal” for the market before it opens, reflecting the first reaction of overnight money. That first reaction was fear: with Democrats winning both chambers of Congress, markets worried that the AI boom could hit headwinds, taxes could rise, and regulation could tighten. Tech stocks took the brunt, sending Nasdaq 100 futures down the most. But after investors took a breath and ran the numbers, they realized that a divided government—a Republican president and a Democratic Congress—means legislative gridlock, making it difficult to pass any radical policies. Add a weaker dollar and falling yields, and investors came back in to buy the dip, turning futures higher. What investors feared was uncertainty; what lifted markets was the idea that “gridlock is actually more predictable.”
Earnings are also giving the AI bulls something to cheer about. Arista Networks reported third-quarter revenue of $3.66 billion, up 58.5% year over year and its fastest growth since going public. That was nearly $360 million above its own $3.3 billion guidance. It forecast fourth-quarter revenue of $3.9 billion to $4.0 billion, and expects 2027 revenue to grow 38%–40% to about $18.5 billion, with AI networking revenue doubling to around $7 billion. Its shares rose about 9.5% after hours to around $186. Advanced Micro Devices also reported third-quarter revenue of $13.4 billion, up 45% year over year, with data center revenue nearly doubling. Orders for AI infrastructure haven’t dried up—the market is simply repricing valuations.
But don’t be fooled by the overnight turnaround. First, half the support behind this gold rally comes from a weaker dollar and falling yields, while the CME FedWatch Tool still shows the probability of a December rate hike near 80%. Rate-hike expectations haven’t budged, so gold’s rally still lacks the backing of monetary policy. Second, the real test comes Friday, November 6, when the U.S. October nonfarm payrolls report is released. Strong data could push the dollar and rate-hike expectations back up together. Third, remember the warning from Goldman Sachs traders: 60% of S&P 500 constituents have already entered bear-market territory. The index turning higher doesn’t mean every stock is back on its feet; in this rally, only a few are rising.
Keep an eye on three levels: if gold holds above $4,000, the next steps up are $4,050–$4,115; if it falls below $3,920, this election rally will have been a one-day wonder. Until Friday’s jobs report, treat every move in futures as noise. The divided-government script has only just begun—the real drama is yet to come.
#美股 #Gold
On election night, U.S. stock futures plunged before turning higher, while gold reclaimed $4,000 overnight—the market acted out the full arc from “fear” to “coming around” in a single night.
First, the facts. In the early hours of Wednesday, U.S. Eastern Time, preliminary results showed Democrats sweeping Congress. Nasdaq 100 futures briefly fell more than 2%, S&P 500 futures dropped about 1.2%, and Dow Jones Industrial Average futures slipped about 0.8%. But by daylight, the mood had completely changed: after NBC News projected that Democrats had also won the House, futures turned higher across the board. S&P 500 futures rose about 0.9%, Nasdaq 100 futures gained about 0.8%, and Dow Jones Industrial Average futures climbed around 1.3%.
Safe-haven assets moved even more decisively. Spot gold rose 2.2% to $4,016.01, while December gold futures climbed to $4,026.90. Silver jumped about 4% to around $52. The U.S. Dollar Index fell 0.54% to 101.17, a five-week low; the 10-year U.S. Treasury yield retreated to around 4.90% from Tuesday’s close of 4.95%. Bitcoin hovered below $78,000.
Why the drop, then the rally? Put simply, futures are a “rehearsal” for the market before it opens, reflecting the first reaction of overnight money. That first reaction was fear: with Democrats winning both chambers of Congress, markets worried that the AI boom could hit headwinds, taxes could rise, and regulation could tighten. Tech stocks took the brunt, sending Nasdaq 100 futures down the most. But after investors took a breath and ran the numbers, they realized that a divided government—a Republican president and a Democratic Congress—means legislative gridlock, making it difficult to pass any radical policies. Add a weaker dollar and falling yields, and investors came back in to buy the dip, turning futures higher. What investors feared was uncertainty; what lifted markets was the idea that “gridlock is actually more predictable.”
Earnings are also giving the AI bulls something to cheer about. Arista Networks reported third-quarter revenue of $3.66 billion, up 58.5% year over year and its fastest growth since going public. That was nearly $360 million above its own $3.3 billion guidance. It forecast fourth-quarter revenue of $3.9 billion to $4.0 billion, and expects 2027 revenue to grow 38%–40% to about $18.5 billion, with AI networking revenue doubling to around $7 billion. Its shares rose about 9.5% after hours to around $186. Advanced Micro Devices also reported third-quarter revenue of $13.4 billion, up 45% year over year, with data center revenue nearly doubling. Orders for AI infrastructure haven’t dried up—the market is simply repricing valuations.
But don’t be fooled by the overnight turnaround. First, half the support behind this gold rally comes from a weaker dollar and falling yields, while the CME FedWatch Tool still shows the probability of a December rate hike near 80%. Rate-hike expectations haven’t budged, so gold’s rally still lacks the backing of monetary policy. Second, the real test comes Friday, November 6, when the U.S. October nonfarm payrolls report is released. Strong data could push the dollar and rate-hike expectations back up together. Third, remember the warning from Goldman Sachs traders: 60% of S&P 500 constituents have already entered bear-market territory. The index turning higher doesn’t mean every stock is back on its feet; in this rally, only a few are rising.
Keep an eye on three levels: if gold holds above $4,000, the next steps up are $4,050–$4,115; if it falls below $3,920, this election rally will have been a one-day wonder. Until Friday’s jobs report, treat every move in futures as noise. The divided-government script has only just begun—the real drama is yet to come.
#美股 #Gold
First, the facts. In the early hours of Wednesday, U.S. Eastern Time, preliminary results showed Democrats sweeping Congress. Nasdaq 100 futures briefly fell more than 2%, S&P 500 futures dropped about 1.2%, and Dow Jones Industrial Average futures slipped about 0.8%. But by daylight, the mood had completely changed: after NBC News projected that Democrats had also won the House, futures turned higher across the board. S&P 500 futures rose about 0.9%, Nasdaq 100 futures gained about 0.8%, and Dow Jones Industrial Average futures climbed around 1.3%.
Safe-haven assets moved even more decisively. Spot gold rose 2.2% to $4,016.01, while December gold futures climbed to $4,026.90. Silver jumped about 4% to around $52. The U.S. Dollar Index fell 0.54% to 101.17, a five-week low; the 10-year U.S. Treasury yield retreated to around 4.90% from Tuesday’s close of 4.95%. Bitcoin hovered below $78,000.
Why the drop, then the rally? Put simply, futures are a “rehearsal” for the market before it opens, reflecting the first reaction of overnight money. That first reaction was fear: with Democrats winning both chambers of Congress, markets worried that the AI boom could hit headwinds, taxes could rise, and regulation could tighten. Tech stocks took the brunt, sending Nasdaq 100 futures down the most. But after investors took a breath and ran the numbers, they realized that a divided government—a Republican president and a Democratic Congress—means legislative gridlock, making it difficult to pass any radical policies. Add a weaker dollar and falling yields, and investors came back in to buy the dip, turning futures higher. What investors feared was uncertainty; what lifted markets was the idea that “gridlock is actually more predictable.”
Earnings are also giving the AI bulls something to cheer about. Arista Networks reported third-quarter revenue of $3.66 billion, up 58.5% year over year and its fastest growth since going public. That was nearly $360 million above its own $3.3 billion guidance. It forecast fourth-quarter revenue of $3.9 billion to $4.0 billion, and expects 2027 revenue to grow 38%–40% to about $18.5 billion, with AI networking revenue doubling to around $7 billion. Its shares rose about 9.5% after hours to around $186. Advanced Micro Devices also reported third-quarter revenue of $13.4 billion, up 45% year over year, with data center revenue nearly doubling. Orders for AI infrastructure haven’t dried up—the market is simply repricing valuations.
But don’t be fooled by the overnight turnaround. First, half the support behind this gold rally comes from a weaker dollar and falling yields, while the CME FedWatch Tool still shows the probability of a December rate hike near 80%. Rate-hike expectations haven’t budged, so gold’s rally still lacks the backing of monetary policy. Second, the real test comes Friday, November 6, when the U.S. October nonfarm payrolls report is released. Strong data could push the dollar and rate-hike expectations back up together. Third, remember the warning from Goldman Sachs traders: 60% of S&P 500 constituents have already entered bear-market territory. The index turning higher doesn’t mean every stock is back on its feet; in this rally, only a few are rising.
Keep an eye on three levels: if gold holds above $4,000, the next steps up are $4,050–$4,115; if it falls below $3,920, this election rally will have been a one-day wonder. Until Friday’s jobs report, treat every move in futures as noise. The divided-government script has only just begun—the real drama is yet to come.
#美股 #Gold
·
--
The better the earnings, the further the stock falls: AI’s valuation reckoning is here. Palantir Technologies’ third-quarter report showed revenue breaking through $2 billion for the first time, yet the stock kept dropping anyway.
First, the hard numbers. After the market closed on November 2, Palantir Technologies reported third-quarter 2026 results: revenue of $2.31 billion, up 96% year over year and above Wall Street’s estimate of $2.18 billion, putting quarterly revenue above $2 billion for the first time; adjusted earnings per share of $0.44, ahead of expectations of $0.41 and more than double year over year; U.S. commercial revenue of $984 million, up 148% year over year and exceeding U.S. government revenue of $953 million for the first time; adjusted free cash flow of $1.22 billion, a 53% margin; GAAP operating income of $1.08 billion, topping $1 billion for the first time; and a net dollar retention rate of 165%, meaning existing customers spent an average of 65% more this year than last.
The guidance was just as aggressive: full-year revenue guidance was raised to $8.530–$8.534 billion, about 91% growth year over year, from $8.150–$8.158 billion previously; fourth-quarter revenue guidance was $2.649–$2.653 billion, above the market estimate of $2.456 billion; and full-year U.S. commercial revenue is expected to reach at least $3.559 billion, growth of at least 143%. Its Rule of 40 score—revenue growth plus profit margin—was 158. With 40 considered the healthy threshold, these results are almost impossible to fault on the numbers alone.
But the stock’s reaction was another matter. It initially fell about 3% after the results came out. On November 3, it closed at $175.40, down 1.65%, and was already about 16% off its all-time high. One intraday detail is worth noting: after hitting a low early in the session, the stock rebounded about 4%. There was clear buying support around $165–$170, suggesting this wasn’t a one-sided sell-off but an intense battle between bulls and bears over valuation.
Where’s the snag? There’s just one, but it hits right at the heart of the matter: total contract value. Total contract value is the full value of contracts newly signed during the quarter, essentially a reservoir of future revenue. In the third quarter, the company signed only $2.92 billion worth, up just 6% year over year, compared with 49% growth in the prior quarter. On the earnings call, the CFO explained that several large contracts were shorter than usual because customers were beginning to adopt new sovereign AI capabilities. That’s both good news and a question mark: eager adoption of new products is positive, but shorter contracts trade future certainty for flexibility in the present.
The chain of cause and effect is clear. Revenue growth of 96% reflects the past three months; 6% growth in total contract value is a leading indicator for the coming quarters. The market isn’t paying for the past now—it’s pricing the future. The trouble is that Palantir Technologies’ valuation is already so expensive that there’s no room for mistakes: its forward P/E is 108, and its non-GAAP P/E over the past 12 months is 153, while the industry median is just 23. Forward P/E means the share price divided by expected earnings per share over the next 12 months. A multiple of 108 means the market has already priced three or four years of high growth into today’s stock price. The average price target among 25 Wall Street analysts is $221.27, implying about 20% upside; 19 rate it a Buy, four a Hold, and two a Sell. The disagreement is out in the open.
This isn’t an isolated event. In 48 hours, three AI bellwethers reported results: Apple beat expectations across the board, yet its stock still fell; AMD reported 97% growth in data center revenue and rose more than 7% after hours; Palantir Technologies grew 96% and fell. One test, three different grades. It shows the market has moved past the “growth is all you need” phase and is now auditing the quality of growth line by line—contract duration, cash flow, and valuation. If any one of the three is unclear, the stock gets punished first.
Two broader factors add to the pressure. First, the Nasdaq 100 had already fallen more than 10% from its October 6 all-time high by Monday, officially entering a technical correction as the AI trade starts to deflate. Second, with Democrats winning both chambers of Congress in the U.S. midterm elections, whether policy on AI data center construction will change has become a new question mark hanging over tech stocks. Goldman Sachs traders’ data makes for even starker reading: the S&P 500 is less than 3% below its all-time high, yet 60% of its constituents are already in bear-market territory. A handful of giants are propping up the index while most stocks have been falling for some time.
Ultimately, Palantir Technologies’ report is proof that demand for AI hasn’t collapsed: U.S. commercial revenue grew 148% and surpassed government business for the first time, showing that corporate customers are paying real money, not just buying into a story. What’s collapsing is the valuation logic: a stock trading at more than 100 times earnings can’t tolerate the words “slower future order growth.” In the short term, $165–$170 is the first line of defense. If it holds, the stock could trade sideways in a range while investors wait for fourth-quarter total contract value to confirm the trend. The real turning point is the next earnings report: if total contract value growth returns to above 20%, today’s drop will look like a chance to get in; if it stays in the single digits, valuation compression has further to go.
Watch three signals: whether fourth-quarter total contract value growth rebounds; whether U.S. commercial revenue can maintain triple-digit growth; and whether Friday’s October nonfarm payrolls report changes expectations for rate cuts. The risks are clear, too: the valuation remains among the most expensive in the market; shorter contracts reduce visibility; government business still makes up a significant share, and policy could shift after the midterm elections; and the Nasdaq 100 remains in a technical correction, so systemic risks haven’t passed.
The growth is real, and so is the expense. The turning point in this AI rally is here: the contest isn’t about who grows fastest, but who can keep growing the longest.
#Palantir #ArtificialIntelligence
The better the earnings, the further the stock falls: AI’s valuation reckoning is here. Palantir Technologies’ third-quarter report showed revenue breaking through $2 billion for the first time, yet the stock kept dropping anyway.
First, the hard numbers. After the market closed on November 2, Palantir Technologies reported third-quarter 2026 results: revenue of $2.31 billion, up 96% year over year and above Wall Street’s estimate of $2.18 billion, putting quarterly revenue above $2 billion for the first time; adjusted earnings per share of $0.44, ahead of expectations of $0.41 and more than double year over year; U.S. commercial revenue of $984 million, up 148% year over year and exceeding U.S. government revenue of $953 million for the first time; adjusted free cash flow of $1.22 billion, a 53% margin; GAAP operating income of $1.08 billion, topping $1 billion for the first time; and a net dollar retention rate of 165%, meaning existing customers spent an average of 65% more this year than last.
The guidance was just as aggressive: full-year revenue guidance was raised to $8.530–$8.534 billion, about 91% growth year over year, from $8.150–$8.158 billion previously; fourth-quarter revenue guidance was $2.649–$2.653 billion, above the market estimate of $2.456 billion; and full-year U.S. commercial revenue is expected to reach at least $3.559 billion, growth of at least 143%. Its Rule of 40 score—revenue growth plus profit margin—was 158. With 40 considered the healthy threshold, these results are almost impossible to fault on the numbers alone.
But the stock’s reaction was another matter. It initially fell about 3% after the results came out. On November 3, it closed at $175.40, down 1.65%, and was already about 16% off its all-time high. One intraday detail is worth noting: after hitting a low early in the session, the stock rebounded about 4%. There was clear buying support around $165–$170, suggesting this wasn’t a one-sided sell-off but an intense battle between bulls and bears over valuation.
Where’s the snag? There’s just one, but it hits right at the heart of the matter: total contract value. Total contract value is the full value of contracts newly signed during the quarter, essentially a reservoir of future revenue. In the third quarter, the company signed only $2.92 billion worth, up just 6% year over year, compared with 49% growth in the prior quarter. On the earnings call, the CFO explained that several large contracts were shorter than usual because customers were beginning to adopt new sovereign AI capabilities. That’s both good news and a question mark: eager adoption of new products is positive, but shorter contracts trade future certainty for flexibility in the present.
The chain of cause and effect is clear. Revenue growth of 96% reflects the past three months; 6% growth in total contract value is a leading indicator for the coming quarters. The market isn’t paying for the past now—it’s pricing the future. The trouble is that Palantir Technologies’ valuation is already so expensive that there’s no room for mistakes: its forward P/E is 108, and its non-GAAP P/E over the past 12 months is 153, while the industry median is just 23. Forward P/E means the share price divided by expected earnings per share over the next 12 months. A multiple of 108 means the market has already priced three or four years of high growth into today’s stock price. The average price target among 25 Wall Street analysts is $221.27, implying about 20% upside; 19 rate it a Buy, four a Hold, and two a Sell. The disagreement is out in the open.
This isn’t an isolated event. In 48 hours, three AI bellwethers reported results: Apple beat expectations across the board, yet its stock still fell; AMD reported 97% growth in data center revenue and rose more than 7% after hours; Palantir Technologies grew 96% and fell. One test, three different grades. It shows the market has moved past the “growth is all you need” phase and is now auditing the quality of growth line by line—contract duration, cash flow, and valuation. If any one of the three is unclear, the stock gets punished first.
Two broader factors add to the pressure. First, the Nasdaq 100 had already fallen more than 10% from its October 6 all-time high by Monday, officially entering a technical correction as the AI trade starts to deflate. Second, with Democrats winning both chambers of Congress in the U.S. midterm elections, whether policy on AI data center construction will change has become a new question mark hanging over tech stocks. Goldman Sachs traders’ data makes for even starker reading: the S&P 500 is less than 3% below its all-time high, yet 60% of its constituents are already in bear-market territory. A handful of giants are propping up the index while most stocks have been falling for some time.
Ultimately, Palantir Technologies’ report is proof that demand for AI hasn’t collapsed: U.S. commercial revenue grew 148% and surpassed government business for the first time, showing that corporate customers are paying real money, not just buying into a story. What’s collapsing is the valuation logic: a stock trading at more than 100 times earnings can’t tolerate the words “slower future order growth.” In the short term, $165–$170 is the first line of defense. If it holds, the stock could trade sideways in a range while investors wait for fourth-quarter total contract value to confirm the trend. The real turning point is the next earnings report: if total contract value growth returns to above 20%, today’s drop will look like a chance to get in; if it stays in the single digits, valuation compression has further to go.
Watch three signals: whether fourth-quarter total contract value growth rebounds; whether U.S. commercial revenue can maintain triple-digit growth; and whether Friday’s October nonfarm payrolls report changes expectations for rate cuts. The risks are clear, too: the valuation remains among the most expensive in the market; shorter contracts reduce visibility; government business still makes up a significant share, and policy could shift after the midterm elections; and the Nasdaq 100 remains in a technical correction, so systemic risks haven’t passed.
The growth is real, and so is the expense. The turning point in this AI rally is here: the contest isn’t about who grows fastest, but who can keep growing the longest.
#Palantir #ArtificialIntelligence
First, the hard numbers. After the market closed on November 2, Palantir Technologies reported third-quarter 2026 results: revenue of $2.31 billion, up 96% year over year and above Wall Street’s estimate of $2.18 billion, putting quarterly revenue above $2 billion for the first time; adjusted earnings per share of $0.44, ahead of expectations of $0.41 and more than double year over year; U.S. commercial revenue of $984 million, up 148% year over year and exceeding U.S. government revenue of $953 million for the first time; adjusted free cash flow of $1.22 billion, a 53% margin; GAAP operating income of $1.08 billion, topping $1 billion for the first time; and a net dollar retention rate of 165%, meaning existing customers spent an average of 65% more this year than last.
The guidance was just as aggressive: full-year revenue guidance was raised to $8.530–$8.534 billion, about 91% growth year over year, from $8.150–$8.158 billion previously; fourth-quarter revenue guidance was $2.649–$2.653 billion, above the market estimate of $2.456 billion; and full-year U.S. commercial revenue is expected to reach at least $3.559 billion, growth of at least 143%. Its Rule of 40 score—revenue growth plus profit margin—was 158. With 40 considered the healthy threshold, these results are almost impossible to fault on the numbers alone.
But the stock’s reaction was another matter. It initially fell about 3% after the results came out. On November 3, it closed at $175.40, down 1.65%, and was already about 16% off its all-time high. One intraday detail is worth noting: after hitting a low early in the session, the stock rebounded about 4%. There was clear buying support around $165–$170, suggesting this wasn’t a one-sided sell-off but an intense battle between bulls and bears over valuation.
Where’s the snag? There’s just one, but it hits right at the heart of the matter: total contract value. Total contract value is the full value of contracts newly signed during the quarter, essentially a reservoir of future revenue. In the third quarter, the company signed only $2.92 billion worth, up just 6% year over year, compared with 49% growth in the prior quarter. On the earnings call, the CFO explained that several large contracts were shorter than usual because customers were beginning to adopt new sovereign AI capabilities. That’s both good news and a question mark: eager adoption of new products is positive, but shorter contracts trade future certainty for flexibility in the present.
The chain of cause and effect is clear. Revenue growth of 96% reflects the past three months; 6% growth in total contract value is a leading indicator for the coming quarters. The market isn’t paying for the past now—it’s pricing the future. The trouble is that Palantir Technologies’ valuation is already so expensive that there’s no room for mistakes: its forward P/E is 108, and its non-GAAP P/E over the past 12 months is 153, while the industry median is just 23. Forward P/E means the share price divided by expected earnings per share over the next 12 months. A multiple of 108 means the market has already priced three or four years of high growth into today’s stock price. The average price target among 25 Wall Street analysts is $221.27, implying about 20% upside; 19 rate it a Buy, four a Hold, and two a Sell. The disagreement is out in the open.
This isn’t an isolated event. In 48 hours, three AI bellwethers reported results: Apple beat expectations across the board, yet its stock still fell; AMD reported 97% growth in data center revenue and rose more than 7% after hours; Palantir Technologies grew 96% and fell. One test, three different grades. It shows the market has moved past the “growth is all you need” phase and is now auditing the quality of growth line by line—contract duration, cash flow, and valuation. If any one of the three is unclear, the stock gets punished first.
Two broader factors add to the pressure. First, the Nasdaq 100 had already fallen more than 10% from its October 6 all-time high by Monday, officially entering a technical correction as the AI trade starts to deflate. Second, with Democrats winning both chambers of Congress in the U.S. midterm elections, whether policy on AI data center construction will change has become a new question mark hanging over tech stocks. Goldman Sachs traders’ data makes for even starker reading: the S&P 500 is less than 3% below its all-time high, yet 60% of its constituents are already in bear-market territory. A handful of giants are propping up the index while most stocks have been falling for some time.
Ultimately, Palantir Technologies’ report is proof that demand for AI hasn’t collapsed: U.S. commercial revenue grew 148% and surpassed government business for the first time, showing that corporate customers are paying real money, not just buying into a story. What’s collapsing is the valuation logic: a stock trading at more than 100 times earnings can’t tolerate the words “slower future order growth.” In the short term, $165–$170 is the first line of defense. If it holds, the stock could trade sideways in a range while investors wait for fourth-quarter total contract value to confirm the trend. The real turning point is the next earnings report: if total contract value growth returns to above 20%, today’s drop will look like a chance to get in; if it stays in the single digits, valuation compression has further to go.
Watch three signals: whether fourth-quarter total contract value growth rebounds; whether U.S. commercial revenue can maintain triple-digit growth; and whether Friday’s October nonfarm payrolls report changes expectations for rate cuts. The risks are clear, too: the valuation remains among the most expensive in the market; shorter contracts reduce visibility; government business still makes up a significant share, and policy could shift after the midterm elections; and the Nasdaq 100 remains in a technical correction, so systemic risks haven’t passed.
The growth is real, and so is the expense. The turning point in this AI rally is here: the contest isn’t about who grows fastest, but who can keep growing the longest.
#Palantir #ArtificialIntelligence
83
·
--
Today is CHPY’s ex-dividend date. This week’s distribution is $0.4229 per share, payable tomorrow, November 5. If you hold 479 shares, that’s $202.57 before taxes, or about $141.80 after the 30% withholding tax.
Let’s start with the numbers: YieldMax Semiconductor Portfolio Option Income Strategy ETF (CHPY) is distributing $0.4229 per share this week, down another 8.0% from last week’s $0.4598. Five weeks ago, it was $0.5847; now it’s $0.4229, a cumulative decline of 27.7%—from $0.5140 to $0.4702 to $0.4598, stepping down all the way. The official annualized distribution rate is 40.17%, still above the 40% floor, but with just 0.17 percentage points of cushion left. CHPY closed at $55.90 on November 3, up 2.23%, but still 37.8% below its 52-week high of $89.86. Distributions over the past 12 months total $27.65 per share; the estimated return-of-capital portion of the latest distribution is 0.9%; and assets under management are about $1.22 billion.
First, let’s clarify what these figures mean so they don’t cause undue alarm. First, the distribution amount isn’t determined by the share price. It comes from the money the fund actually received last week—premiums from selling call options plus dividends from the stocks it holds, minus management fees. In plain English, a call option gives someone else the right to benefit from some of the future upside in the fund’s holdings; the fund collects a premium and pays it out as a distribution. Second, the annualized distribution rate is this week’s distribution multiplied by 52 and divided by the latest NAV. The official figure is 40.17%; under the rules, investing stops if it falls below 40%. Third, the estimated return-of-capital portion is 0.9%, meaning only about 0.9% of this $0.4229 distribution may have come from the fund’s principal. That’s nowhere near the danger threshold of 70%, so the fund isn’t propping up its distribution by dipping heavily into principal.
Why has the distribution fallen for five straight weeks while the share price rose 2.23% on Tuesday? Here’s how it works: Semiconductor stocks fell and then stabilized in October, reducing share-price volatility. That lowered the premiums the fund could collect from selling options, so it received less income last week and the distribution fell this week. Distributions reflect last week’s income, not today’s share price. On Tuesday, the Philadelphia Semiconductor Index rose 2.63%, and Advanced Micro Devices reported a 97% surge in data-center revenue in its third-quarter results. The share-price rebound came first; it will take at least another week or two for a recovery in distributions to show up in the figures. That lag is where it’s easiest to misread the situation.
Looking ahead, there’s very little room above 40.17%. Next Wednesday’s announcement is the key checkpoint: if the distribution falls by another roughly 8%, the annualized rate will likely drop below 40%. Under the rules, the fund would then hold the cash rather than reinvest it. If the distribution stabilizes or even edges up, this five-week slide will have bottomed out. One other point worth noting: the return-of-capital portion is just 0.9%, so the distribution quality hasn’t deteriorated; the issue is on the income side, not the principal side. Friday’s reinvestment will proceed as usual—as long as the annualized distribution rate hasn’t fallen below 40%, the rule is to keep reinvesting. The 479 shares should receive about $141.80 after withholding tax. See you Friday for the reinvestment update.
Keep an eye on three risks: first, another distribution cut next week could push the annualized rate below 40% and trigger a halt to reinvestment; second, if NAV, after accounting for distributions, underperforms the Philadelphia Semiconductor Index, the erosion will be confirmed; third, further declines in semiconductor volatility would shrink option-premium income. Five straight distribution cuts aren’t what’s most concerning; what’s concerning is pretending not to notice when there’s only 0.17 percentage points of cushion left.
#CHPY #USStockDividends
Today is CHPY’s ex-dividend date. This week’s distribution is $0.4229 per share, payable tomorrow, November 5. If you hold 479 shares, that’s $202.57 before taxes, or about $141.80 after the 30% withholding tax.
Let’s start with the numbers: YieldMax Semiconductor Portfolio Option Income Strategy ETF (CHPY) is distributing $0.4229 per share this week, down another 8.0% from last week’s $0.4598. Five weeks ago, it was $0.5847; now it’s $0.4229, a cumulative decline of 27.7%—from $0.5140 to $0.4702 to $0.4598, stepping down all the way. The official annualized distribution rate is 40.17%, still above the 40% floor, but with just 0.17 percentage points of cushion left. CHPY closed at $55.90 on November 3, up 2.23%, but still 37.8% below its 52-week high of $89.86. Distributions over the past 12 months total $27.65 per share; the estimated return-of-capital portion of the latest distribution is 0.9%; and assets under management are about $1.22 billion.
First, let’s clarify what these figures mean so they don’t cause undue alarm. First, the distribution amount isn’t determined by the share price. It comes from the money the fund actually received last week—premiums from selling call options plus dividends from the stocks it holds, minus management fees. In plain English, a call option gives someone else the right to benefit from some of the future upside in the fund’s holdings; the fund collects a premium and pays it out as a distribution. Second, the annualized distribution rate is this week’s distribution multiplied by 52 and divided by the latest NAV. The official figure is 40.17%; under the rules, investing stops if it falls below 40%. Third, the estimated return-of-capital portion is 0.9%, meaning only about 0.9% of this $0.4229 distribution may have come from the fund’s principal. That’s nowhere near the danger threshold of 70%, so the fund isn’t propping up its distribution by dipping heavily into principal.
Why has the distribution fallen for five straight weeks while the share price rose 2.23% on Tuesday? Here’s how it works: Semiconductor stocks fell and then stabilized in October, reducing share-price volatility. That lowered the premiums the fund could collect from selling options, so it received less income last week and the distribution fell this week. Distributions reflect last week’s income, not today’s share price. On Tuesday, the Philadelphia Semiconductor Index rose 2.63%, and Advanced Micro Devices reported a 97% surge in data-center revenue in its third-quarter results. The share-price rebound came first; it will take at least another week or two for a recovery in distributions to show up in the figures. That lag is where it’s easiest to misread the situation.
Looking ahead, there’s very little room above 40.17%. Next Wednesday’s announcement is the key checkpoint: if the distribution falls by another roughly 8%, the annualized rate will likely drop below 40%. Under the rules, the fund would then hold the cash rather than reinvest it. If the distribution stabilizes or even edges up, this five-week slide will have bottomed out. One other point worth noting: the return-of-capital portion is just 0.9%, so the distribution quality hasn’t deteriorated; the issue is on the income side, not the principal side. Friday’s reinvestment will proceed as usual—as long as the annualized distribution rate hasn’t fallen below 40%, the rule is to keep reinvesting. The 479 shares should receive about $141.80 after withholding tax. See you Friday for the reinvestment update.
Keep an eye on three risks: first, another distribution cut next week could push the annualized rate below 40% and trigger a halt to reinvestment; second, if NAV, after accounting for distributions, underperforms the Philadelphia Semiconductor Index, the erosion will be confirmed; third, further declines in semiconductor volatility would shrink option-premium income. Five straight distribution cuts aren’t what’s most concerning; what’s concerning is pretending not to notice when there’s only 0.17 percentage points of cushion left.
#CHPY #USStockDividends
Let’s start with the numbers: YieldMax Semiconductor Portfolio Option Income Strategy ETF (CHPY) is distributing $0.4229 per share this week, down another 8.0% from last week’s $0.4598. Five weeks ago, it was $0.5847; now it’s $0.4229, a cumulative decline of 27.7%—from $0.5140 to $0.4702 to $0.4598, stepping down all the way. The official annualized distribution rate is 40.17%, still above the 40% floor, but with just 0.17 percentage points of cushion left. CHPY closed at $55.90 on November 3, up 2.23%, but still 37.8% below its 52-week high of $89.86. Distributions over the past 12 months total $27.65 per share; the estimated return-of-capital portion of the latest distribution is 0.9%; and assets under management are about $1.22 billion.
First, let’s clarify what these figures mean so they don’t cause undue alarm. First, the distribution amount isn’t determined by the share price. It comes from the money the fund actually received last week—premiums from selling call options plus dividends from the stocks it holds, minus management fees. In plain English, a call option gives someone else the right to benefit from some of the future upside in the fund’s holdings; the fund collects a premium and pays it out as a distribution. Second, the annualized distribution rate is this week’s distribution multiplied by 52 and divided by the latest NAV. The official figure is 40.17%; under the rules, investing stops if it falls below 40%. Third, the estimated return-of-capital portion is 0.9%, meaning only about 0.9% of this $0.4229 distribution may have come from the fund’s principal. That’s nowhere near the danger threshold of 70%, so the fund isn’t propping up its distribution by dipping heavily into principal.
Why has the distribution fallen for five straight weeks while the share price rose 2.23% on Tuesday? Here’s how it works: Semiconductor stocks fell and then stabilized in October, reducing share-price volatility. That lowered the premiums the fund could collect from selling options, so it received less income last week and the distribution fell this week. Distributions reflect last week’s income, not today’s share price. On Tuesday, the Philadelphia Semiconductor Index rose 2.63%, and Advanced Micro Devices reported a 97% surge in data-center revenue in its third-quarter results. The share-price rebound came first; it will take at least another week or two for a recovery in distributions to show up in the figures. That lag is where it’s easiest to misread the situation.
Looking ahead, there’s very little room above 40.17%. Next Wednesday’s announcement is the key checkpoint: if the distribution falls by another roughly 8%, the annualized rate will likely drop below 40%. Under the rules, the fund would then hold the cash rather than reinvest it. If the distribution stabilizes or even edges up, this five-week slide will have bottomed out. One other point worth noting: the return-of-capital portion is just 0.9%, so the distribution quality hasn’t deteriorated; the issue is on the income side, not the principal side. Friday’s reinvestment will proceed as usual—as long as the annualized distribution rate hasn’t fallen below 40%, the rule is to keep reinvesting. The 479 shares should receive about $141.80 after withholding tax. See you Friday for the reinvestment update.
Keep an eye on three risks: first, another distribution cut next week could push the annualized rate below 40% and trigger a halt to reinvestment; second, if NAV, after accounting for distributions, underperforms the Philadelphia Semiconductor Index, the erosion will be confirmed; third, further declines in semiconductor volatility would shrink option-premium income. Five straight distribution cuts aren’t what’s most concerning; what’s concerning is pretending not to notice when there’s only 0.17 percentage points of cushion left.
#CHPY #USStockDividends
AMD-4.58%
CHPYETF-0.87%
32
·
--
Apple delivered an earnings report that “beat the numbers but lost on the stock price.”
After the market closed on November 2, U.S. Eastern Time, Apple released its fourth-quarter results for fiscal 2026 (the three months ended September 26): revenue of $114.48 billion, up 12% year over year and above market expectations of about $113.4 billion, marking the best September quarter in Apple’s history; diluted earnings per share of $2.10, topping expectations of $1.99; and net income of $30.71 billion. By business segment, iPhone revenue was $57.58 billion, up 17.5% year over year and a September-quarter record—even though the new iPhone 18 Pro had been on sale for only about nine days during the quarter. Services revenue reached a record $31.57 billion, while Mac revenue came in at $10.79 billion, also ahead of expectations. Full-year fiscal 2026 revenue totaled $479 billion, another record.
But the market wasn’t impressed. Before the results were released, Apple shares had already fallen 1.8% that day, closing at $338.32. They dropped another roughly 2.8% after hours, to around $329, then fell 1.90% on November 3 to close at $331.90. The stock became the biggest drag on the Dow Jones Industrial Average, which was down 0.38% on the day while other major indexes rose.
The problem lies in two areas. First, Greater China revenue was $17.54 billion, about $1.2 billion below the market’s expectation of $18.75 billion—the largest shortfall in the report. Second, and more critically, Apple’s gross margin guidance for the next quarter—its biggest holiday shopping season of the year—was just 45% to 46%, below the market’s expectation of 46.3% and down from 47.9% this quarter. Gross margin is the share of revenue left as profit after selling a device. A guidance range roughly two percentage points lower effectively tells the market that Apple will make less on every iPhone it sells going forward.
Memory is the main culprit behind the margin squeeze. The global buildout of AI data centers is driving a scramble for memory chips. Supplies of dynamic random-access memory (the working memory in phones and computers) and flash memory (the storage chips used for photos and files) are tight, and prices are rising. As one of the world’s largest memory buyers, Apple is among the first to feel the cost impact. Chief Financial Officer Kevin Parekh said on the earnings call that rising memory prices were the main reason for the margin decline, along with investment in the Siri AI upgrade. In his first earnings report since becoming CEO, John Ternus called the memory price increases “unprecedented” and said costs would continue to rise beyond December. Apple has already been stockpiling in advance: inventory jumped 31% in a single quarter to $14.54 billion. But stockpiling can only provide a temporary cushion; it cannot stop prices from rising.
Interestingly, this is the flip side of the same coin that saw the Philadelphia Semiconductor Index surge 2.63% and the Nasdaq Composite rise 0.83% that day. The AI boom is pushing up memory prices, bringing windfall profits and soaring share prices to memory sellers such as Micron Technology and SK Hynix. But for major memory buyers like Apple, the same price increases are eating into profits. The money from higher prices hasn’t disappeared; it has simply flowed from buyers’ pockets into sellers’ pockets.
Looking ahead, Apple’s story has two sides. In the short term, memory costs are a sword hanging over the company’s head. Revenue guidance for the December quarter calls for growth of 7% to 10%, which would still make it the highest-revenue quarter in Apple’s history. But if gross margin really falls to 45%–46%, and one-off benefits such as tariff refunds fade (this quarter’s earnings per share included $0.05 from $731 million in tariff refunds), profit growth will slow significantly relative to revenue growth. Guidance for Services growth has also slowed to 8%–9%. In the longer term, the first full quarter of iPhone 18 Pro sales is only just beginning, and Services continues to set records. There is no problem on the demand side: this sell-off reflects lower expectations for margins, not weaker demand.
Watch three signals: first, when memory prices peak and begin to fall—that is an early indicator of whether Apple’s gross margin can stop declining; second, whether actual gross margin in the December quarter can hold at the lower end of the 45% range; and third, whether Greater China can make up the shortfall during a full quarter of sales for the new devices. There are also plenty of risks. If memory prices keep rising into next year, Apple will have to either accept thinner margins or raise prices, as it has previously done with the iPad and Mac, passing costs on to consumers. Either path could keep pressure on the stock. And with market volatility rising after the U.S. midterm election results, anyone looking to buy the dip in the short term should leave a sufficient margin of safety.
The bill for the AI boom is moving from chipmakers’ earnings reports onto hardware makers’ cost sheets.
#苹果公司 #USStocks
Apple delivered an earnings report that “beat the numbers but lost on the stock price.”
After the market closed on November 2, U.S. Eastern Time, Apple released its fourth-quarter results for fiscal 2026 (the three months ended September 26): revenue of $114.48 billion, up 12% year over year and above market expectations of about $113.4 billion, marking the best September quarter in Apple’s history; diluted earnings per share of $2.10, topping expectations of $1.99; and net income of $30.71 billion. By business segment, iPhone revenue was $57.58 billion, up 17.5% year over year and a September-quarter record—even though the new iPhone 18 Pro had been on sale for only about nine days during the quarter. Services revenue reached a record $31.57 billion, while Mac revenue came in at $10.79 billion, also ahead of expectations. Full-year fiscal 2026 revenue totaled $479 billion, another record.
But the market wasn’t impressed. Before the results were released, Apple shares had already fallen 1.8% that day, closing at $338.32. They dropped another roughly 2.8% after hours, to around $329, then fell 1.90% on November 3 to close at $331.90. The stock became the biggest drag on the Dow Jones Industrial Average, which was down 0.38% on the day while other major indexes rose.
The problem lies in two areas. First, Greater China revenue was $17.54 billion, about $1.2 billion below the market’s expectation of $18.75 billion—the largest shortfall in the report. Second, and more critically, Apple’s gross margin guidance for the next quarter—its biggest holiday shopping season of the year—was just 45% to 46%, below the market’s expectation of 46.3% and down from 47.9% this quarter. Gross margin is the share of revenue left as profit after selling a device. A guidance range roughly two percentage points lower effectively tells the market that Apple will make less on every iPhone it sells going forward.
Memory is the main culprit behind the margin squeeze. The global buildout of AI data centers is driving a scramble for memory chips. Supplies of dynamic random-access memory (the working memory in phones and computers) and flash memory (the storage chips used for photos and files) are tight, and prices are rising. As one of the world’s largest memory buyers, Apple is among the first to feel the cost impact. Chief Financial Officer Kevin Parekh said on the earnings call that rising memory prices were the main reason for the margin decline, along with investment in the Siri AI upgrade. In his first earnings report since becoming CEO, John Ternus called the memory price increases “unprecedented” and said costs would continue to rise beyond December. Apple has already been stockpiling in advance: inventory jumped 31% in a single quarter to $14.54 billion. But stockpiling can only provide a temporary cushion; it cannot stop prices from rising.
Interestingly, this is the flip side of the same coin that saw the Philadelphia Semiconductor Index surge 2.63% and the Nasdaq Composite rise 0.83% that day. The AI boom is pushing up memory prices, bringing windfall profits and soaring share prices to memory sellers such as Micron Technology and SK Hynix. But for major memory buyers like Apple, the same price increases are eating into profits. The money from higher prices hasn’t disappeared; it has simply flowed from buyers’ pockets into sellers’ pockets.
Looking ahead, Apple’s story has two sides. In the short term, memory costs are a sword hanging over the company’s head. Revenue guidance for the December quarter calls for growth of 7% to 10%, which would still make it the highest-revenue quarter in Apple’s history. But if gross margin really falls to 45%–46%, and one-off benefits such as tariff refunds fade (this quarter’s earnings per share included $0.05 from $731 million in tariff refunds), profit growth will slow significantly relative to revenue growth. Guidance for Services growth has also slowed to 8%–9%. In the longer term, the first full quarter of iPhone 18 Pro sales is only just beginning, and Services continues to set records. There is no problem on the demand side: this sell-off reflects lower expectations for margins, not weaker demand.
Watch three signals: first, when memory prices peak and begin to fall—that is an early indicator of whether Apple’s gross margin can stop declining; second, whether actual gross margin in the December quarter can hold at the lower end of the 45% range; and third, whether Greater China can make up the shortfall during a full quarter of sales for the new devices. There are also plenty of risks. If memory prices keep rising into next year, Apple will have to either accept thinner margins or raise prices, as it has previously done with the iPad and Mac, passing costs on to consumers. Either path could keep pressure on the stock. And with market volatility rising after the U.S. midterm election results, anyone looking to buy the dip in the short term should leave a sufficient margin of safety.
The bill for the AI boom is moving from chipmakers’ earnings reports onto hardware makers’ cost sheets.
#苹果公司 #USStocks
After the market closed on November 2, U.S. Eastern Time, Apple released its fourth-quarter results for fiscal 2026 (the three months ended September 26): revenue of $114.48 billion, up 12% year over year and above market expectations of about $113.4 billion, marking the best September quarter in Apple’s history; diluted earnings per share of $2.10, topping expectations of $1.99; and net income of $30.71 billion. By business segment, iPhone revenue was $57.58 billion, up 17.5% year over year and a September-quarter record—even though the new iPhone 18 Pro had been on sale for only about nine days during the quarter. Services revenue reached a record $31.57 billion, while Mac revenue came in at $10.79 billion, also ahead of expectations. Full-year fiscal 2026 revenue totaled $479 billion, another record.
But the market wasn’t impressed. Before the results were released, Apple shares had already fallen 1.8% that day, closing at $338.32. They dropped another roughly 2.8% after hours, to around $329, then fell 1.90% on November 3 to close at $331.90. The stock became the biggest drag on the Dow Jones Industrial Average, which was down 0.38% on the day while other major indexes rose.
The problem lies in two areas. First, Greater China revenue was $17.54 billion, about $1.2 billion below the market’s expectation of $18.75 billion—the largest shortfall in the report. Second, and more critically, Apple’s gross margin guidance for the next quarter—its biggest holiday shopping season of the year—was just 45% to 46%, below the market’s expectation of 46.3% and down from 47.9% this quarter. Gross margin is the share of revenue left as profit after selling a device. A guidance range roughly two percentage points lower effectively tells the market that Apple will make less on every iPhone it sells going forward.
Memory is the main culprit behind the margin squeeze. The global buildout of AI data centers is driving a scramble for memory chips. Supplies of dynamic random-access memory (the working memory in phones and computers) and flash memory (the storage chips used for photos and files) are tight, and prices are rising. As one of the world’s largest memory buyers, Apple is among the first to feel the cost impact. Chief Financial Officer Kevin Parekh said on the earnings call that rising memory prices were the main reason for the margin decline, along with investment in the Siri AI upgrade. In his first earnings report since becoming CEO, John Ternus called the memory price increases “unprecedented” and said costs would continue to rise beyond December. Apple has already been stockpiling in advance: inventory jumped 31% in a single quarter to $14.54 billion. But stockpiling can only provide a temporary cushion; it cannot stop prices from rising.
Interestingly, this is the flip side of the same coin that saw the Philadelphia Semiconductor Index surge 2.63% and the Nasdaq Composite rise 0.83% that day. The AI boom is pushing up memory prices, bringing windfall profits and soaring share prices to memory sellers such as Micron Technology and SK Hynix. But for major memory buyers like Apple, the same price increases are eating into profits. The money from higher prices hasn’t disappeared; it has simply flowed from buyers’ pockets into sellers’ pockets.
Looking ahead, Apple’s story has two sides. In the short term, memory costs are a sword hanging over the company’s head. Revenue guidance for the December quarter calls for growth of 7% to 10%, which would still make it the highest-revenue quarter in Apple’s history. But if gross margin really falls to 45%–46%, and one-off benefits such as tariff refunds fade (this quarter’s earnings per share included $0.05 from $731 million in tariff refunds), profit growth will slow significantly relative to revenue growth. Guidance for Services growth has also slowed to 8%–9%. In the longer term, the first full quarter of iPhone 18 Pro sales is only just beginning, and Services continues to set records. There is no problem on the demand side: this sell-off reflects lower expectations for margins, not weaker demand.
Watch three signals: first, when memory prices peak and begin to fall—that is an early indicator of whether Apple’s gross margin can stop declining; second, whether actual gross margin in the December quarter can hold at the lower end of the 45% range; and third, whether Greater China can make up the shortfall during a full quarter of sales for the new devices. There are also plenty of risks. If memory prices keep rising into next year, Apple will have to either accept thinner margins or raise prices, as it has previously done with the iPad and Mac, passing costs on to consumers. Either path could keep pressure on the stock. And with market volatility rising after the U.S. midterm election results, anyone looking to buy the dip in the short term should leave a sufficient margin of safety.
The bill for the AI boom is moving from chipmakers’ earnings reports onto hardware makers’ cost sheets.
#苹果公司 #USStocks
2
·
--
The results of the U.S. midterm elections are largely in. Democrats have won the Senate and are also clearly ahead in the House. The market was briefly spooked, then quickly steadied: Nasdaq 100 futures fell more than 2.2% overnight at one point, or 622 points, but by this morning the decline had narrowed to around 0.3%. S&P 500 futures also trimmed their losses from 1.3% to 0.35%, while Dow Jones Industrial Average futures were down just 0.18%.
Why did futures fall at first? The market feared that a Democratic sweep would bring tighter regulation of data center construction. Data centers are the “power plants” that supply computing capacity for artificial intelligence; put the brakes on them, and you effectively put the brakes on this AI rally. That’s why the Nasdaq 100 fell the hardest: tech stocks took the brunt of the sell-off, and chip stocks—which had just recovered their losses yesterday—were pushed back down.
But the rapid narrowing of losses shows that the market is recalculating. First, the midterms change Congress, not the profits listed companies have already earned. Advanced Micro Devices just reported a 97% surge in data center revenue in its third-quarter results, with record total revenue of $13.4 billion. The real-money demand for AI is still there. Second, the dollar has weakened to a more-than-one-month low, while the 10-year U.S. Treasury yield has fallen back to around 4.9%. Money is moving into safe-haven assets, and sentiment hasn’t spiraled out of control. Third, at yesterday’s close, the Nasdaq Composite was still up 0.83% at 25,372.01, and the S&P 500 was up 0.36% at 7,568.92. The dip buyers hadn’t left in the first place.
What’s really worth watching is another set of numbers: Goldman Sachs traders warn that the S&P 500 is less than 3% off its record high, but 60% of its constituents have already fallen into a bear market—a drop of more than 20% from a peak. The index looks respectable only because a handful of big names are holding it up; most stocks underneath have already been battered. This is what’s called a “stealth bear market.”
There are two things to watch next: first, whether Democrats will actually take action against data centers, and whether they mean it or are just talking; second, Friday’s October nonfarm payrolls report, whose results will determine rate-cut expectations. This sharp drop and quick recovery in short-term futures show that the market has shifted from “fear” to “wait and see.” But until the divergence between the index and individual stocks is resolved, chasing tech stocks is like licking a knife’s edge—the index may be rising, but the stock you own could be losing value.
Risks: If Democrats really do push ahead with a bill restricting data centers, the AI sector could face another round of valuation cuts. If nonfarm payrolls come in much stronger than expected, rate-cut expectations could cool, putting growth stocks under pressure as well.
#美股 #MidtermElections
The results of the U.S. midterm elections are largely in. Democrats have won the Senate and are also clearly ahead in the House. The market was briefly spooked, then quickly steadied: Nasdaq 100 futures fell more than 2.2% overnight at one point, or 622 points, but by this morning the decline had narrowed to around 0.3%. S&P 500 futures also trimmed their losses from 1.3% to 0.35%, while Dow Jones Industrial Average futures were down just 0.18%.
Why did futures fall at first? The market feared that a Democratic sweep would bring tighter regulation of data center construction. Data centers are the “power plants” that supply computing capacity for artificial intelligence; put the brakes on them, and you effectively put the brakes on this AI rally. That’s why the Nasdaq 100 fell the hardest: tech stocks took the brunt of the sell-off, and chip stocks—which had just recovered their losses yesterday—were pushed back down.
But the rapid narrowing of losses shows that the market is recalculating. First, the midterms change Congress, not the profits listed companies have already earned. Advanced Micro Devices just reported a 97% surge in data center revenue in its third-quarter results, with record total revenue of $13.4 billion. The real-money demand for AI is still there. Second, the dollar has weakened to a more-than-one-month low, while the 10-year U.S. Treasury yield has fallen back to around 4.9%. Money is moving into safe-haven assets, and sentiment hasn’t spiraled out of control. Third, at yesterday’s close, the Nasdaq Composite was still up 0.83% at 25,372.01, and the S&P 500 was up 0.36% at 7,568.92. The dip buyers hadn’t left in the first place.
What’s really worth watching is another set of numbers: Goldman Sachs traders warn that the S&P 500 is less than 3% off its record high, but 60% of its constituents have already fallen into a bear market—a drop of more than 20% from a peak. The index looks respectable only because a handful of big names are holding it up; most stocks underneath have already been battered. This is what’s called a “stealth bear market.”
There are two things to watch next: first, whether Democrats will actually take action against data centers, and whether they mean it or are just talking; second, Friday’s October nonfarm payrolls report, whose results will determine rate-cut expectations. This sharp drop and quick recovery in short-term futures show that the market has shifted from “fear” to “wait and see.” But until the divergence between the index and individual stocks is resolved, chasing tech stocks is like licking a knife’s edge—the index may be rising, but the stock you own could be losing value.
Risks: If Democrats really do push ahead with a bill restricting data centers, the AI sector could face another round of valuation cuts. If nonfarm payrolls come in much stronger than expected, rate-cut expectations could cool, putting growth stocks under pressure as well.
#美股 #MidtermElections
Why did futures fall at first? The market feared that a Democratic sweep would bring tighter regulation of data center construction. Data centers are the “power plants” that supply computing capacity for artificial intelligence; put the brakes on them, and you effectively put the brakes on this AI rally. That’s why the Nasdaq 100 fell the hardest: tech stocks took the brunt of the sell-off, and chip stocks—which had just recovered their losses yesterday—were pushed back down.
But the rapid narrowing of losses shows that the market is recalculating. First, the midterms change Congress, not the profits listed companies have already earned. Advanced Micro Devices just reported a 97% surge in data center revenue in its third-quarter results, with record total revenue of $13.4 billion. The real-money demand for AI is still there. Second, the dollar has weakened to a more-than-one-month low, while the 10-year U.S. Treasury yield has fallen back to around 4.9%. Money is moving into safe-haven assets, and sentiment hasn’t spiraled out of control. Third, at yesterday’s close, the Nasdaq Composite was still up 0.83% at 25,372.01, and the S&P 500 was up 0.36% at 7,568.92. The dip buyers hadn’t left in the first place.
What’s really worth watching is another set of numbers: Goldman Sachs traders warn that the S&P 500 is less than 3% off its record high, but 60% of its constituents have already fallen into a bear market—a drop of more than 20% from a peak. The index looks respectable only because a handful of big names are holding it up; most stocks underneath have already been battered. This is what’s called a “stealth bear market.”
There are two things to watch next: first, whether Democrats will actually take action against data centers, and whether they mean it or are just talking; second, Friday’s October nonfarm payrolls report, whose results will determine rate-cut expectations. This sharp drop and quick recovery in short-term futures show that the market has shifted from “fear” to “wait and see.” But until the divergence between the index and individual stocks is resolved, chasing tech stocks is like licking a knife’s edge—the index may be rising, but the stock you own could be losing value.
Risks: If Democrats really do push ahead with a bill restricting data centers, the AI sector could face another round of valuation cuts. If nonfarm payrolls come in much stronger than expected, rate-cut expectations could cool, putting growth stocks under pressure as well.
#美股 #MidtermElections
33
·
--
Bitcoin is stuck in a $76,000–$80,000 range, sitting right on its 100-day exponential moving average—a step up from here could stop the bleeding, while a step down could bring a high-volume breakdown.
First, the numbers. As of publication, Bitcoin was around $77,817, up about 1.5% from the November 2 close of $76,677, but still down about 4.2% over the past 7 days and 9.3% over the past 30 days. It is 38.3% below its all-time high of $126,080 on October 6, 2025, and 27.6% below its 52-week high of $107,428. Moving averages are the average cost line based on closing prices over a given period: the current price is about 3.1% below the 20-day moving average of $80,314 and 5.0% below the 50-day moving average of $81,906, but 6.4% above the 200-day moving average of $73,160. It is sitting right on the 100-day exponential moving average at $77,729. An exponential moving average is an average cost line that gives more weight to recent prices; the 100-day line is now the price level where bulls and bears are battling it out.
Momentum indicators also look poor. The Relative Strength Index is 40.4. Known as the RSI, it measures the strength of short-term buying and selling pressure. Below 30 is considered oversold and above 70 overbought. At 40.4, it shows bears still have the upper hand, although the index has edged up from 35.0 on November 2. The oversold bounce has not yet turned bullish. The MACD is -1,277, the signal line is -885, and the histogram is -392. MACD, or Moving Average Convergence Divergence, is a momentum indicator that measures the gap between short- and long-term moving averages. With the MACD below the signal line and the histogram negative, momentum is still heading down.
But there are two details worth watching amid the weakness. First, the two big bullish candles on September 18 and 21: on September 18, Bitcoin closed up 5.9% at $80,901; on September 21, it gained another 6.7% to $86,603, after reaching an intraday high of $87,364. In two days, the price was hauled back from around $76,000, and volume surged to $57.7 billion on September 21, the highest in nearly 60 days. Second, the $76,000 area has repeatedly held: Bitcoin closed at $76,677 on November 2, hit an intraday low of $75,710 today, then closed back at $77,817. The support zone is still holding, but the margin by which it holds is getting smaller each time.
The catalysts are in the news. Voting in the U.S. midterm elections took place on November 3, and counting is still underway; what markets fear most is uncertainty itself. Spot Bitcoin exchange-traded funds have seen consecutive net outflows: $643 million on October 30, followed by another $399 million on November 2. That is more than $1 billion over two trading days, with institutional money flowing out. The Crypto Fear & Greed Index is at 34, still in fear territory, though up 8 points from yesterday's 26.
There are just two key levels: first, support at $76,000. A close below $76,000 would put the next technical level around $75,000, followed by $74,750. Resistance comes first at the round-number level of $80,000. Only a move back above that level and the 20-day moving average at $80,314 would count as a short-term halt to the bleeding. The first rebound targets are the 50-day moving average at $81,906 and the September 21 intraday high of $87,364.
Looking ahead, the real tests are the final results of the U.S. midterm elections and Friday's October nonfarm payrolls report. Until then, Bitcoin will likely continue grinding within the $76,000–$80,000 range: if $76,000 holds, an oversold bounce could come at any time, with the first target above $80,000. On the other hand, if $76,000 gives way and spot Bitcoin ETFs continue to see large outflows, stop-loss selling could accelerate, and $75,000 will be no idle threat. Range-bound trading means prices move back and forth within a set range without going anywhere; it's a test of patience.
The risks are plain to see: an oversold RSI does not mean a rebound is imminent—an asset can become even more oversold. Bitcoin trades 24 hours a day, and overnight volatility is high; a level that looks promising during the day can be broken by a single bearish candle at night. More importantly, flows into and out of spot Bitcoin ETFs are the market's lifeline this time around. As long as outflows continue, any rebound should be treated first as an oversold bounce. Watching Bitcoin near $76,000 is a bet that demand hasn't completely broken down; get it wrong, and the cost could be another steep bearish candle.
Technical analysis is for reference only and does not constitute investment advice.
#比特币 #BTC
Bitcoin is stuck in a $76,000–$80,000 range, sitting right on its 100-day exponential moving average—a step up from here could stop the bleeding, while a step down could bring a high-volume breakdown.
First, the numbers. As of publication, Bitcoin was around $77,817, up about 1.5% from the November 2 close of $76,677, but still down about 4.2% over the past 7 days and 9.3% over the past 30 days. It is 38.3% below its all-time high of $126,080 on October 6, 2025, and 27.6% below its 52-week high of $107,428. Moving averages are the average cost line based on closing prices over a given period: the current price is about 3.1% below the 20-day moving average of $80,314 and 5.0% below the 50-day moving average of $81,906, but 6.4% above the 200-day moving average of $73,160. It is sitting right on the 100-day exponential moving average at $77,729. An exponential moving average is an average cost line that gives more weight to recent prices; the 100-day line is now the price level where bulls and bears are battling it out.
Momentum indicators also look poor. The Relative Strength Index is 40.4. Known as the RSI, it measures the strength of short-term buying and selling pressure. Below 30 is considered oversold and above 70 overbought. At 40.4, it shows bears still have the upper hand, although the index has edged up from 35.0 on November 2. The oversold bounce has not yet turned bullish. The MACD is -1,277, the signal line is -885, and the histogram is -392. MACD, or Moving Average Convergence Divergence, is a momentum indicator that measures the gap between short- and long-term moving averages. With the MACD below the signal line and the histogram negative, momentum is still heading down.
But there are two details worth watching amid the weakness. First, the two big bullish candles on September 18 and 21: on September 18, Bitcoin closed up 5.9% at $80,901; on September 21, it gained another 6.7% to $86,603, after reaching an intraday high of $87,364. In two days, the price was hauled back from around $76,000, and volume surged to $57.7 billion on September 21, the highest in nearly 60 days. Second, the $76,000 area has repeatedly held: Bitcoin closed at $76,677 on November 2, hit an intraday low of $75,710 today, then closed back at $77,817. The support zone is still holding, but the margin by which it holds is getting smaller each time.
The catalysts are in the news. Voting in the U.S. midterm elections took place on November 3, and counting is still underway; what markets fear most is uncertainty itself. Spot Bitcoin exchange-traded funds have seen consecutive net outflows: $643 million on October 30, followed by another $399 million on November 2. That is more than $1 billion over two trading days, with institutional money flowing out. The Crypto Fear & Greed Index is at 34, still in fear territory, though up 8 points from yesterday's 26.
There are just two key levels: first, support at $76,000. A close below $76,000 would put the next technical level around $75,000, followed by $74,750. Resistance comes first at the round-number level of $80,000. Only a move back above that level and the 20-day moving average at $80,314 would count as a short-term halt to the bleeding. The first rebound targets are the 50-day moving average at $81,906 and the September 21 intraday high of $87,364.
Looking ahead, the real tests are the final results of the U.S. midterm elections and Friday's October nonfarm payrolls report. Until then, Bitcoin will likely continue grinding within the $76,000–$80,000 range: if $76,000 holds, an oversold bounce could come at any time, with the first target above $80,000. On the other hand, if $76,000 gives way and spot Bitcoin ETFs continue to see large outflows, stop-loss selling could accelerate, and $75,000 will be no idle threat. Range-bound trading means prices move back and forth within a set range without going anywhere; it's a test of patience.
The risks are plain to see: an oversold RSI does not mean a rebound is imminent—an asset can become even more oversold. Bitcoin trades 24 hours a day, and overnight volatility is high; a level that looks promising during the day can be broken by a single bearish candle at night. More importantly, flows into and out of spot Bitcoin ETFs are the market's lifeline this time around. As long as outflows continue, any rebound should be treated first as an oversold bounce. Watching Bitcoin near $76,000 is a bet that demand hasn't completely broken down; get it wrong, and the cost could be another steep bearish candle.
Technical analysis is for reference only and does not constitute investment advice.
#比特币 #BTC
First, the numbers. As of publication, Bitcoin was around $77,817, up about 1.5% from the November 2 close of $76,677, but still down about 4.2% over the past 7 days and 9.3% over the past 30 days. It is 38.3% below its all-time high of $126,080 on October 6, 2025, and 27.6% below its 52-week high of $107,428. Moving averages are the average cost line based on closing prices over a given period: the current price is about 3.1% below the 20-day moving average of $80,314 and 5.0% below the 50-day moving average of $81,906, but 6.4% above the 200-day moving average of $73,160. It is sitting right on the 100-day exponential moving average at $77,729. An exponential moving average is an average cost line that gives more weight to recent prices; the 100-day line is now the price level where bulls and bears are battling it out.
Momentum indicators also look poor. The Relative Strength Index is 40.4. Known as the RSI, it measures the strength of short-term buying and selling pressure. Below 30 is considered oversold and above 70 overbought. At 40.4, it shows bears still have the upper hand, although the index has edged up from 35.0 on November 2. The oversold bounce has not yet turned bullish. The MACD is -1,277, the signal line is -885, and the histogram is -392. MACD, or Moving Average Convergence Divergence, is a momentum indicator that measures the gap between short- and long-term moving averages. With the MACD below the signal line and the histogram negative, momentum is still heading down.
But there are two details worth watching amid the weakness. First, the two big bullish candles on September 18 and 21: on September 18, Bitcoin closed up 5.9% at $80,901; on September 21, it gained another 6.7% to $86,603, after reaching an intraday high of $87,364. In two days, the price was hauled back from around $76,000, and volume surged to $57.7 billion on September 21, the highest in nearly 60 days. Second, the $76,000 area has repeatedly held: Bitcoin closed at $76,677 on November 2, hit an intraday low of $75,710 today, then closed back at $77,817. The support zone is still holding, but the margin by which it holds is getting smaller each time.
The catalysts are in the news. Voting in the U.S. midterm elections took place on November 3, and counting is still underway; what markets fear most is uncertainty itself. Spot Bitcoin exchange-traded funds have seen consecutive net outflows: $643 million on October 30, followed by another $399 million on November 2. That is more than $1 billion over two trading days, with institutional money flowing out. The Crypto Fear & Greed Index is at 34, still in fear territory, though up 8 points from yesterday's 26.
There are just two key levels: first, support at $76,000. A close below $76,000 would put the next technical level around $75,000, followed by $74,750. Resistance comes first at the round-number level of $80,000. Only a move back above that level and the 20-day moving average at $80,314 would count as a short-term halt to the bleeding. The first rebound targets are the 50-day moving average at $81,906 and the September 21 intraday high of $87,364.
Looking ahead, the real tests are the final results of the U.S. midterm elections and Friday's October nonfarm payrolls report. Until then, Bitcoin will likely continue grinding within the $76,000–$80,000 range: if $76,000 holds, an oversold bounce could come at any time, with the first target above $80,000. On the other hand, if $76,000 gives way and spot Bitcoin ETFs continue to see large outflows, stop-loss selling could accelerate, and $75,000 will be no idle threat. Range-bound trading means prices move back and forth within a set range without going anywhere; it's a test of patience.
The risks are plain to see: an oversold RSI does not mean a rebound is imminent—an asset can become even more oversold. Bitcoin trades 24 hours a day, and overnight volatility is high; a level that looks promising during the day can be broken by a single bearish candle at night. More importantly, flows into and out of spot Bitcoin ETFs are the market's lifeline this time around. As long as outflows continue, any rebound should be treated first as an oversold bounce. Watching Bitcoin near $76,000 is a bet that demand hasn't completely broken down; get it wrong, and the cost could be another steep bearish candle.
Technical analysis is for reference only and does not constitute investment advice.
#比特币 #BTC
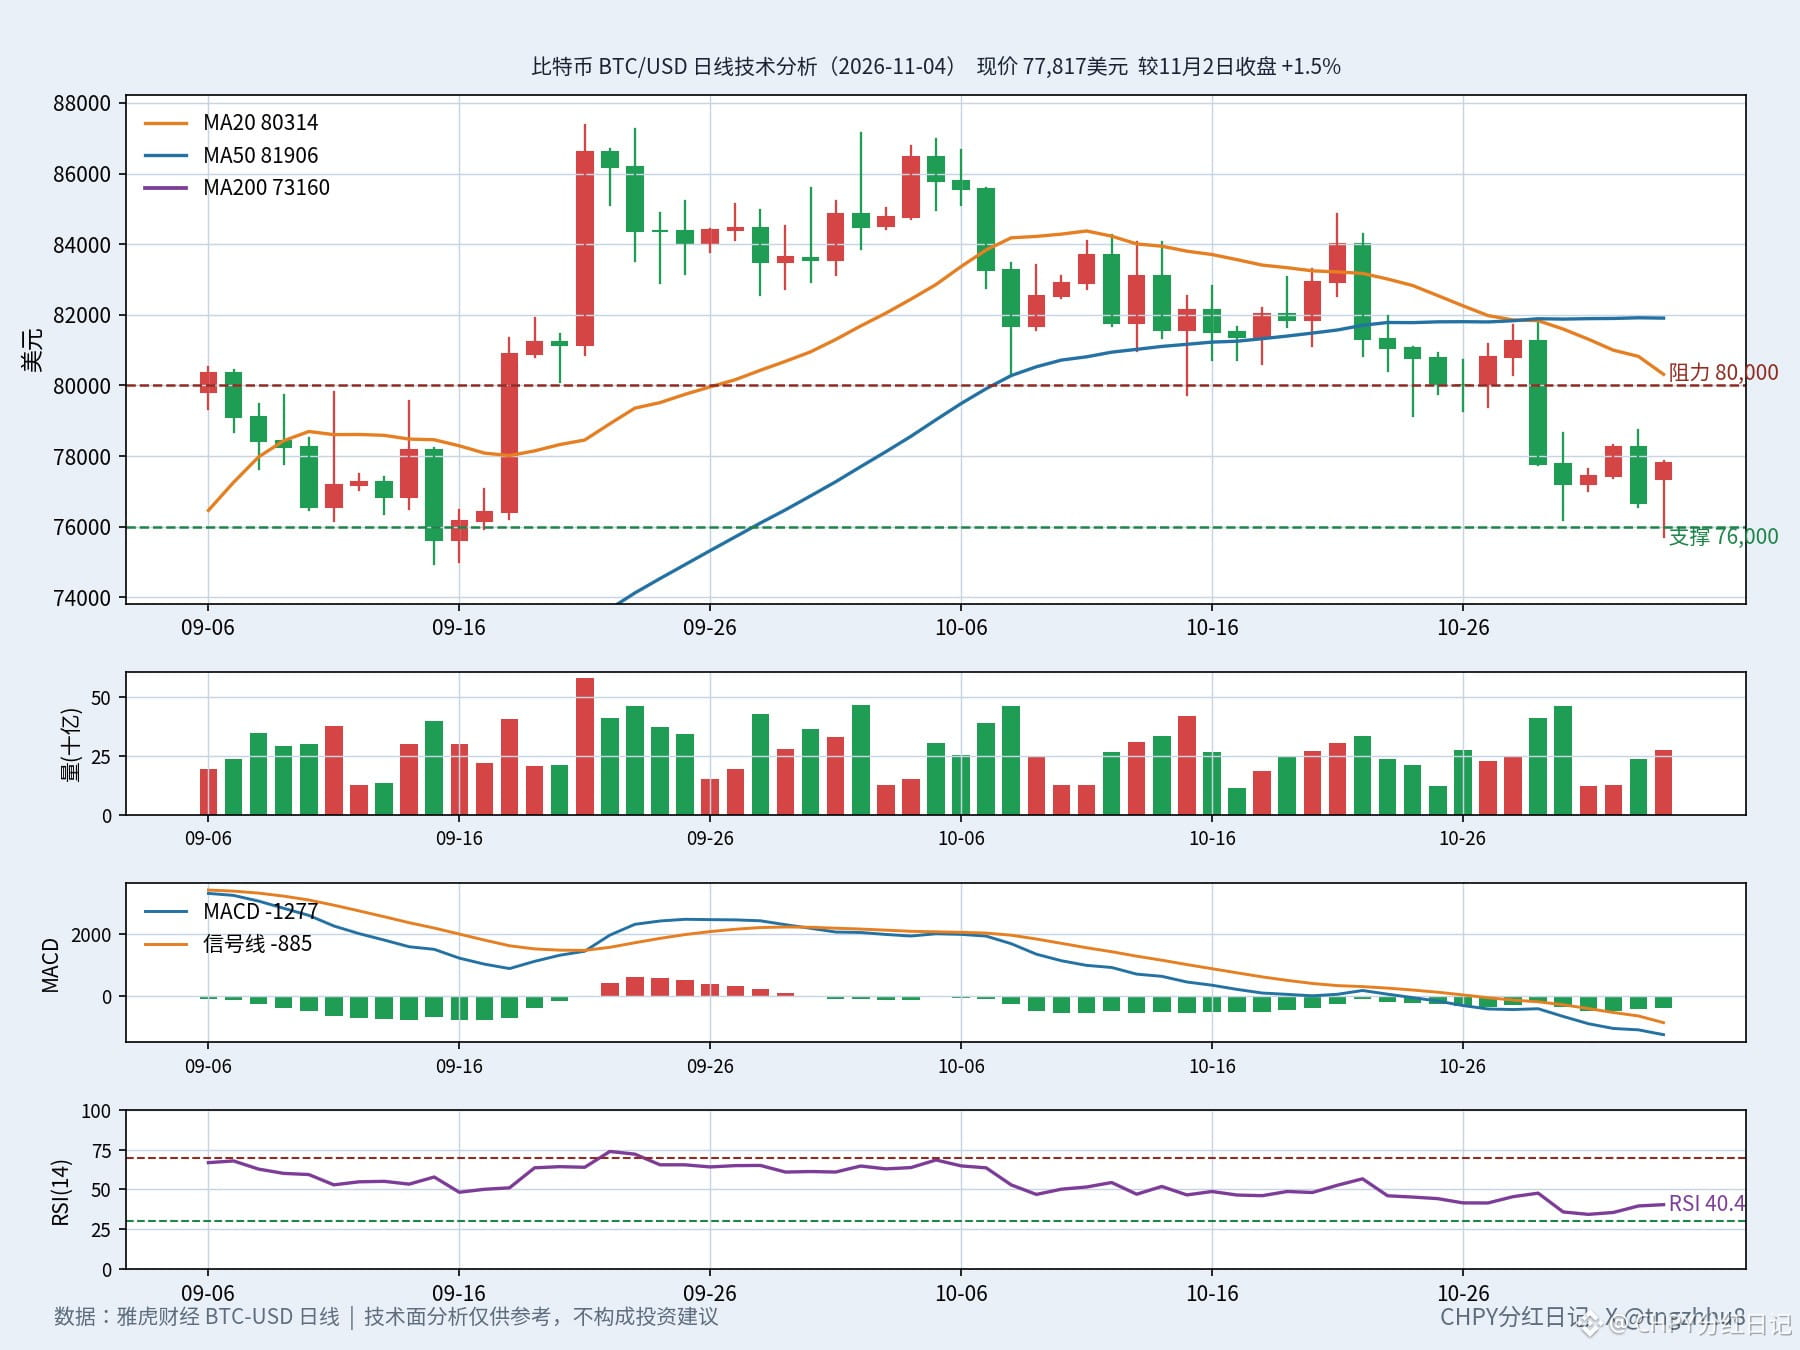
26
·
--
From last night through this morning, the vote count in the U.S. midterm elections became the biggest variable for global markets, and stock-index futures were first to take a hit.
First, the facts. The U.S. midterm elections were held on November 3, with all 435 seats in the House up for election and 35 Senate seats being contested. To win control of both chambers, Democrats needed a net gain of four seats in the Senate and three in the House. The count started breaking decisively in one direction: in North Carolina, Democrat Roy Cooper defeated Republican Michael Whatley, flipping a Republican Senate seat—the first Senate seat Democrats had taken from Republicans that night. After the win, Democrats were just three seats short of control of the Senate. In Georgia, Democrat Jon Ossoff defeated Trump-backed Mike Collins to win re-election. In Virginia, Democratic Senator Mark Warner also won re-election.
Prediction markets had already priced in the outcome. On Kalshi, the prediction market, the probability of Democrats taking control of the Senate rose to around 90%, and the probability of their taking the House reached about 97%. Put simply, traders are now betting on a “blue wave”—a Democratic landslide.
The market reaction was swift and direct. Stock-index futures are contracts that can be traded overnight, effectively a “dress rehearsal” for the opening bell, and they best reflect investors’ initial reaction. During the count, Nasdaq 100 futures fell about 2% at one point, with E-mini futures hitting a low of 27,815, down about 2.1%, wiping out all of their earlier gains. S&P 500 futures fell between about 0.6% and 1.1%, while Dow Jones Industrial Average futures dropped about 367 points, or roughly 0.7%. At around 10 a.m. Beijing time this morning, S&P 500 futures were down 0.53%, Dow Jones Industrial Average futures were down 0.88%, and Nasdaq 100 futures were down 1.63%.
Currency and bond markets moved in the same direction. The U.S. Dollar Index fell below 101.50 in early Asian trading, reaching around 101.25. The 10-year U.S. Treasury yield fell 6 basis points to 4.90%, while the 2-year yield fell 5 basis points to 4.566%. One basis point equals 0.01%, so a 6-basis-point drop in yield is a decline of 0.06%. A rates strategist at Nomura Holdings put it plainly: a blue-wave scenario is generally seen as bearish for the dollar and bullish for U.S. Treasuries, and early Asian trading was consistent with that view.
The chain of events is actually quite clear. The market isn’t afraid of who wins, but of what might happen if “Democrats sweep both chambers”: the Trump administration’s push to build AI data centers could be stymied, and regulation of the AI industry could tighten. JPMorgan had previously warned that a Democratic sweep of both chambers could weigh on the broader market on Wednesday, with AI stocks particularly vulnerable. Conversely, if Republicans hold on to the Senate or both chambers, that could prompt a short-term rally. That’s why Nasdaq 100 futures—where technology and AI stocks are concentrated—fell the hardest. Meanwhile, solar exchange-traded funds continued to rise after hours, as clean energy is seen as a relative beneficiary of a blue wave.
But there are three reasons to view this sell-off calmly. First, overnight futures liquidity is thin, so early moves can easily be amplified. The count has only just begun, and control of both chambers is still undecided; it’s too early to treat the overnight losses as the final verdict. Second, during the regular session on November 3, the S&P 500 rose just 0.36% to close at 7,568.92, while the Nasdaq Composite gained 0.83% to close at 25,372.01. Both ended a three-session losing streak, and the market was already on the road to recovering from oversold conditions. If Democrats ultimately win the House but fail to take the Senate, tonight’s losses could well be absorbed as a buying opportunity. Third, the real suspense lies with the remaining key seats: Senate seats in Michigan, Maine, Ohio, Kansas, Texas, Iowa and Alaska, as well as in slow-counting states such as California, Pennsylvania and Wisconsin. Results in closely contested races could take until Wednesday or even longer.
There are three things to watch tonight: first, which party controls each chamber, with the Senate the decisive battleground; second, the U.S. Treasury’s refunding announcement, as the market faces $618 billion in Treasury issuance in the fourth quarter; and third, Friday’s October nonfarm payrolls report. Elections are about sentiment; earnings and economic data are the real scales.
There are risks to keep in mind, too. The longer the count drags on, the higher the uncertainty premium and the harder it will be for volatility to subside. If Democrats do sweep both chambers, the valuation logic for AI stocks will need to be reassessed, and data-center capital spending—the year’s strongest investment theme—will be the first thing to be repriced. Conversely, if Republicans hold the Senate, tonight’s drop in futures could quickly narrow after the opening bell, leaving those who chased the sell-off caught on the wrong foot.
In a word: on election night, markets are betting on probabilities, not outcomes. Let the dust settle.
#美国中期选举 #USStocks
From last night through this morning, the vote count in the U.S. midterm elections became the biggest variable for global markets, and stock-index futures were first to take a hit.
First, the facts. The U.S. midterm elections were held on November 3, with all 435 seats in the House up for election and 35 Senate seats being contested. To win control of both chambers, Democrats needed a net gain of four seats in the Senate and three in the House. The count started breaking decisively in one direction: in North Carolina, Democrat Roy Cooper defeated Republican Michael Whatley, flipping a Republican Senate seat—the first Senate seat Democrats had taken from Republicans that night. After the win, Democrats were just three seats short of control of the Senate. In Georgia, Democrat Jon Ossoff defeated Trump-backed Mike Collins to win re-election. In Virginia, Democratic Senator Mark Warner also won re-election.
Prediction markets had already priced in the outcome. On Kalshi, the prediction market, the probability of Democrats taking control of the Senate rose to around 90%, and the probability of their taking the House reached about 97%. Put simply, traders are now betting on a “blue wave”—a Democratic landslide.
The market reaction was swift and direct. Stock-index futures are contracts that can be traded overnight, effectively a “dress rehearsal” for the opening bell, and they best reflect investors’ initial reaction. During the count, Nasdaq 100 futures fell about 2% at one point, with E-mini futures hitting a low of 27,815, down about 2.1%, wiping out all of their earlier gains. S&P 500 futures fell between about 0.6% and 1.1%, while Dow Jones Industrial Average futures dropped about 367 points, or roughly 0.7%. At around 10 a.m. Beijing time this morning, S&P 500 futures were down 0.53%, Dow Jones Industrial Average futures were down 0.88%, and Nasdaq 100 futures were down 1.63%.
Currency and bond markets moved in the same direction. The U.S. Dollar Index fell below 101.50 in early Asian trading, reaching around 101.25. The 10-year U.S. Treasury yield fell 6 basis points to 4.90%, while the 2-year yield fell 5 basis points to 4.566%. One basis point equals 0.01%, so a 6-basis-point drop in yield is a decline of 0.06%. A rates strategist at Nomura Holdings put it plainly: a blue-wave scenario is generally seen as bearish for the dollar and bullish for U.S. Treasuries, and early Asian trading was consistent with that view.
The chain of events is actually quite clear. The market isn’t afraid of who wins, but of what might happen if “Democrats sweep both chambers”: the Trump administration’s push to build AI data centers could be stymied, and regulation of the AI industry could tighten. JPMorgan had previously warned that a Democratic sweep of both chambers could weigh on the broader market on Wednesday, with AI stocks particularly vulnerable. Conversely, if Republicans hold on to the Senate or both chambers, that could prompt a short-term rally. That’s why Nasdaq 100 futures—where technology and AI stocks are concentrated—fell the hardest. Meanwhile, solar exchange-traded funds continued to rise after hours, as clean energy is seen as a relative beneficiary of a blue wave.
But there are three reasons to view this sell-off calmly. First, overnight futures liquidity is thin, so early moves can easily be amplified. The count has only just begun, and control of both chambers is still undecided; it’s too early to treat the overnight losses as the final verdict. Second, during the regular session on November 3, the S&P 500 rose just 0.36% to close at 7,568.92, while the Nasdaq Composite gained 0.83% to close at 25,372.01. Both ended a three-session losing streak, and the market was already on the road to recovering from oversold conditions. If Democrats ultimately win the House but fail to take the Senate, tonight’s losses could well be absorbed as a buying opportunity. Third, the real suspense lies with the remaining key seats: Senate seats in Michigan, Maine, Ohio, Kansas, Texas, Iowa and Alaska, as well as in slow-counting states such as California, Pennsylvania and Wisconsin. Results in closely contested races could take until Wednesday or even longer.
There are three things to watch tonight: first, which party controls each chamber, with the Senate the decisive battleground; second, the U.S. Treasury’s refunding announcement, as the market faces $618 billion in Treasury issuance in the fourth quarter; and third, Friday’s October nonfarm payrolls report. Elections are about sentiment; earnings and economic data are the real scales.
There are risks to keep in mind, too. The longer the count drags on, the higher the uncertainty premium and the harder it will be for volatility to subside. If Democrats do sweep both chambers, the valuation logic for AI stocks will need to be reassessed, and data-center capital spending—the year’s strongest investment theme—will be the first thing to be repriced. Conversely, if Republicans hold the Senate, tonight’s drop in futures could quickly narrow after the opening bell, leaving those who chased the sell-off caught on the wrong foot.
In a word: on election night, markets are betting on probabilities, not outcomes. Let the dust settle.
#美国中期选举 #USStocks
First, the facts. The U.S. midterm elections were held on November 3, with all 435 seats in the House up for election and 35 Senate seats being contested. To win control of both chambers, Democrats needed a net gain of four seats in the Senate and three in the House. The count started breaking decisively in one direction: in North Carolina, Democrat Roy Cooper defeated Republican Michael Whatley, flipping a Republican Senate seat—the first Senate seat Democrats had taken from Republicans that night. After the win, Democrats were just three seats short of control of the Senate. In Georgia, Democrat Jon Ossoff defeated Trump-backed Mike Collins to win re-election. In Virginia, Democratic Senator Mark Warner also won re-election.
Prediction markets had already priced in the outcome. On Kalshi, the prediction market, the probability of Democrats taking control of the Senate rose to around 90%, and the probability of their taking the House reached about 97%. Put simply, traders are now betting on a “blue wave”—a Democratic landslide.
The market reaction was swift and direct. Stock-index futures are contracts that can be traded overnight, effectively a “dress rehearsal” for the opening bell, and they best reflect investors’ initial reaction. During the count, Nasdaq 100 futures fell about 2% at one point, with E-mini futures hitting a low of 27,815, down about 2.1%, wiping out all of their earlier gains. S&P 500 futures fell between about 0.6% and 1.1%, while Dow Jones Industrial Average futures dropped about 367 points, or roughly 0.7%. At around 10 a.m. Beijing time this morning, S&P 500 futures were down 0.53%, Dow Jones Industrial Average futures were down 0.88%, and Nasdaq 100 futures were down 1.63%.
Currency and bond markets moved in the same direction. The U.S. Dollar Index fell below 101.50 in early Asian trading, reaching around 101.25. The 10-year U.S. Treasury yield fell 6 basis points to 4.90%, while the 2-year yield fell 5 basis points to 4.566%. One basis point equals 0.01%, so a 6-basis-point drop in yield is a decline of 0.06%. A rates strategist at Nomura Holdings put it plainly: a blue-wave scenario is generally seen as bearish for the dollar and bullish for U.S. Treasuries, and early Asian trading was consistent with that view.
The chain of events is actually quite clear. The market isn’t afraid of who wins, but of what might happen if “Democrats sweep both chambers”: the Trump administration’s push to build AI data centers could be stymied, and regulation of the AI industry could tighten. JPMorgan had previously warned that a Democratic sweep of both chambers could weigh on the broader market on Wednesday, with AI stocks particularly vulnerable. Conversely, if Republicans hold on to the Senate or both chambers, that could prompt a short-term rally. That’s why Nasdaq 100 futures—where technology and AI stocks are concentrated—fell the hardest. Meanwhile, solar exchange-traded funds continued to rise after hours, as clean energy is seen as a relative beneficiary of a blue wave.
But there are three reasons to view this sell-off calmly. First, overnight futures liquidity is thin, so early moves can easily be amplified. The count has only just begun, and control of both chambers is still undecided; it’s too early to treat the overnight losses as the final verdict. Second, during the regular session on November 3, the S&P 500 rose just 0.36% to close at 7,568.92, while the Nasdaq Composite gained 0.83% to close at 25,372.01. Both ended a three-session losing streak, and the market was already on the road to recovering from oversold conditions. If Democrats ultimately win the House but fail to take the Senate, tonight’s losses could well be absorbed as a buying opportunity. Third, the real suspense lies with the remaining key seats: Senate seats in Michigan, Maine, Ohio, Kansas, Texas, Iowa and Alaska, as well as in slow-counting states such as California, Pennsylvania and Wisconsin. Results in closely contested races could take until Wednesday or even longer.
There are three things to watch tonight: first, which party controls each chamber, with the Senate the decisive battleground; second, the U.S. Treasury’s refunding announcement, as the market faces $618 billion in Treasury issuance in the fourth quarter; and third, Friday’s October nonfarm payrolls report. Elections are about sentiment; earnings and economic data are the real scales.
There are risks to keep in mind, too. The longer the count drags on, the higher the uncertainty premium and the harder it will be for volatility to subside. If Democrats do sweep both chambers, the valuation logic for AI stocks will need to be reassessed, and data-center capital spending—the year’s strongest investment theme—will be the first thing to be repriced. Conversely, if Republicans hold the Senate, tonight’s drop in futures could quickly narrow after the opening bell, leaving those who chased the sell-off caught on the wrong foot.
In a word: on election night, markets are betting on probabilities, not outcomes. Let the dust settle.
#美国中期选举 #USStocks
120
·
--
The strongest earnings report on the U.S. stock market last night came from AMD.
AMD reported third-quarter revenue of $13.4 billion, up 45% year over year and a record high. Adjusted earnings per share came in at $2.09, up 74% year over year. Both revenue and profit beat market expectations. The real heavyweight was its data center business: revenue reached $8.5 billion, up 97% year over year and accounting for nearly two-thirds of total company revenue. Put simply, the most profitable business right now is making chips for AI servers.
The guidance was even more impressive: AMD forecast fourth-quarter revenue of about $17 billion, up 66% year over year and above market expectations. Management expects total revenue to grow by more than 80% in 2027, with server revenue doubling. After the results were released, AMD shares rose more than 7% at one point in after-hours trading.
The report punctured a popular narrative: that demand for AI is a bubble. Last week, Intel's weak guidance dragged down the entire chip sector. AMD fell nearly 11% on October 30 alone, and the Nasdaq 100 also entered correction territory. But AMD's numbers show that demand hasn't disappeared; it's just shifted from one company to another. Customers named for the first rack-scale systems include Anthropic, Meta, Microsoft, OpenAI, and Oracle—all deep-pocketed companies investing real money in data centers. These orders are no pie in the sky.
Still, there's a reality check. Third-quarter non-GAAP gross margin was 55.94%, missing the company's own target of around 56%. Fourth-quarter gross margin guidance is 55%, continuing to decline. The more it sells, the thinner its margins get, as lower-margin complete rack systems make up a growing share of sales. Free cash flow was just $554 million, far below the market's $1.05 billion estimate. The company also borrowed another $4.7 billion to fund capacity expansion. At 42 times forward earnings, the stock is already expensive, leaving little room for error.
The ripple effects are clear: AMD's strength helped the Philadelphia Semiconductor Index rebound nearly 3%, while the Nasdaq Composite rose 0.83% and the S&P 500 gained 0.36%, ending a three-day losing streak. But votes are still being counted in the U.S. midterm elections, and stock-index futures have already turned from gains to losses. Tonight's uncertainties have yet to play out.
Money is genuinely flowing into AI, but it will only go to companies that can deliver. Nvidia's earnings report on November 17 will be the ultimate test.
#美股 #AI
The strongest earnings report on the U.S. stock market last night came from AMD.
AMD reported third-quarter revenue of $13.4 billion, up 45% year over year and a record high. Adjusted earnings per share came in at $2.09, up 74% year over year. Both revenue and profit beat market expectations. The real heavyweight was its data center business: revenue reached $8.5 billion, up 97% year over year and accounting for nearly two-thirds of total company revenue. Put simply, the most profitable business right now is making chips for AI servers.
The guidance was even more impressive: AMD forecast fourth-quarter revenue of about $17 billion, up 66% year over year and above market expectations. Management expects total revenue to grow by more than 80% in 2027, with server revenue doubling. After the results were released, AMD shares rose more than 7% at one point in after-hours trading.
The report punctured a popular narrative: that demand for AI is a bubble. Last week, Intel's weak guidance dragged down the entire chip sector. AMD fell nearly 11% on October 30 alone, and the Nasdaq 100 also entered correction territory. But AMD's numbers show that demand hasn't disappeared; it's just shifted from one company to another. Customers named for the first rack-scale systems include Anthropic, Meta, Microsoft, OpenAI, and Oracle—all deep-pocketed companies investing real money in data centers. These orders are no pie in the sky.
Still, there's a reality check. Third-quarter non-GAAP gross margin was 55.94%, missing the company's own target of around 56%. Fourth-quarter gross margin guidance is 55%, continuing to decline. The more it sells, the thinner its margins get, as lower-margin complete rack systems make up a growing share of sales. Free cash flow was just $554 million, far below the market's $1.05 billion estimate. The company also borrowed another $4.7 billion to fund capacity expansion. At 42 times forward earnings, the stock is already expensive, leaving little room for error.
The ripple effects are clear: AMD's strength helped the Philadelphia Semiconductor Index rebound nearly 3%, while the Nasdaq Composite rose 0.83% and the S&P 500 gained 0.36%, ending a three-day losing streak. But votes are still being counted in the U.S. midterm elections, and stock-index futures have already turned from gains to losses. Tonight's uncertainties have yet to play out.
Money is genuinely flowing into AI, but it will only go to companies that can deliver. Nvidia's earnings report on November 17 will be the ultimate test.
#美股 #AI
AMD reported third-quarter revenue of $13.4 billion, up 45% year over year and a record high. Adjusted earnings per share came in at $2.09, up 74% year over year. Both revenue and profit beat market expectations. The real heavyweight was its data center business: revenue reached $8.5 billion, up 97% year over year and accounting for nearly two-thirds of total company revenue. Put simply, the most profitable business right now is making chips for AI servers.
The guidance was even more impressive: AMD forecast fourth-quarter revenue of about $17 billion, up 66% year over year and above market expectations. Management expects total revenue to grow by more than 80% in 2027, with server revenue doubling. After the results were released, AMD shares rose more than 7% at one point in after-hours trading.
The report punctured a popular narrative: that demand for AI is a bubble. Last week, Intel's weak guidance dragged down the entire chip sector. AMD fell nearly 11% on October 30 alone, and the Nasdaq 100 also entered correction territory. But AMD's numbers show that demand hasn't disappeared; it's just shifted from one company to another. Customers named for the first rack-scale systems include Anthropic, Meta, Microsoft, OpenAI, and Oracle—all deep-pocketed companies investing real money in data centers. These orders are no pie in the sky.
Still, there's a reality check. Third-quarter non-GAAP gross margin was 55.94%, missing the company's own target of around 56%. Fourth-quarter gross margin guidance is 55%, continuing to decline. The more it sells, the thinner its margins get, as lower-margin complete rack systems make up a growing share of sales. Free cash flow was just $554 million, far below the market's $1.05 billion estimate. The company also borrowed another $4.7 billion to fund capacity expansion. At 42 times forward earnings, the stock is already expensive, leaving little room for error.
The ripple effects are clear: AMD's strength helped the Philadelphia Semiconductor Index rebound nearly 3%, while the Nasdaq Composite rose 0.83% and the S&P 500 gained 0.36%, ending a three-day losing streak. But votes are still being counted in the U.S. midterm elections, and stock-index futures have already turned from gains to losses. Tonight's uncertainties have yet to play out.
Money is genuinely flowing into AI, but it will only go to companies that can deliver. Nvidia's earnings report on November 17 will be the ultimate test.
#美股 #AI
111
·
--
The three indicators diverged today: stocks rose, but sentiment didn’t follow. The CNN Fear & Greed Index fell from 23 to 19, matching its low on October 23, the day tech stocks plunged. The Cboe Volatility Index (VIX) slipped from 21.15 to 20.83, while the Crypto Fear & Greed Index rebounded from 26 to 34. One grew more fearful, one breathed a sigh of relief, and one recovered—these three gauges aren’t telling the same story.
First, the most striking one. The CNN Fear & Greed Index is at 19, still in extreme fear territory. It has fallen for three consecutive trading days, from 26 to 23 to 19; a month ago, it was still at 30. Yet the S&P 500 rose 0.36% and the Nasdaq 100 rose 0.68%, both ending three-day losing streaks. Prices bounced, but sentiment didn’t. That suggests last night’s rally was mostly an oversold rebound, not a return of confidence. If you’re ready to call a bottom after one day of gains, take another look at that reading of 19.
The Cboe Volatility Index fell 1.51% to 20.83, ending a three-day winning streak. The options market breathed a sigh of relief first: the VIX retreating from above 21.15 suggests traders are no longer paying such a high premium for protection against election uncertainty. But at 20.83, it’s still above 20, and the market is still a breath away from genuine calm. At this level, the message is that the storm may have passed, but the umbrella is still open.
Crypto was the only market to show a clear recovery today. The Crypto Fear & Greed Index rose 8 points in a day, from 26 to 34, finally moving away from the edge of extreme fear (below 25 is extreme fear; yesterday’s reading was just 1 point above that threshold). Bitcoin is around $77,800, up about 1.0% from roughly $77,000 yesterday morning, and holding near its 100-day exponential moving average of $77,750. The 100-day exponential moving average is the weighted average of closing prices over the past 100 trading days; holding above it would mean the short-term trend has stabilized. The $80,000 level is psychological resistance, while the $76,000 area remains a key short-term dividing line. An 8-point recovery in sentiment is no small move, but 34 is still in fear territory. Crypto investors are saying “we’re not as scared,” not “we’re ready to chase.”
Looking ahead, the turning point isn’t today—it’s tonight and Friday. Voting in the U.S. midterm elections has ended, and results will start coming in tonight. Prediction markets put the odds of Democrats taking the House above 90% and the Senate above 70%, making a divided Congress the likely outcome. What the market really needs to digest is whether that result will fuel expectations of higher taxes and tighter regulation. Wednesday also brings the U.S. Treasury’s refinancing announcement and the Institute for Supply Management’s services report; Friday brings the October jobs report. Each could push sentiment back to an extreme.
There are two short-term scenarios. If the election results match expectations and a divided Congress becomes reality, the VIX could continue moving below 20, and the S&P 500’s oversold rebound could continue. But if the results spring a surprise, or Friday’s jobs report comes in much hotter than expected and pushes rate-cut expectations further out, the CNN Fear & Greed Index could head straight toward 15, and Bitcoin’s $76,000 support will face a serious test. Sentiment indicators are sending an honest message right now: a rebound is possible, but trust hasn’t returned.
#市场情绪 #U.S. stocks
The three indicators diverged today: stocks rose, but sentiment didn’t follow. The CNN Fear & Greed Index fell from 23 to 19, matching its low on October 23, the day tech stocks plunged. The Cboe Volatility Index (VIX) slipped from 21.15 to 20.83, while the Crypto Fear & Greed Index rebounded from 26 to 34. One grew more fearful, one breathed a sigh of relief, and one recovered—these three gauges aren’t telling the same story.
First, the most striking one. The CNN Fear & Greed Index is at 19, still in extreme fear territory. It has fallen for three consecutive trading days, from 26 to 23 to 19; a month ago, it was still at 30. Yet the S&P 500 rose 0.36% and the Nasdaq 100 rose 0.68%, both ending three-day losing streaks. Prices bounced, but sentiment didn’t. That suggests last night’s rally was mostly an oversold rebound, not a return of confidence. If you’re ready to call a bottom after one day of gains, take another look at that reading of 19.
The Cboe Volatility Index fell 1.51% to 20.83, ending a three-day winning streak. The options market breathed a sigh of relief first: the VIX retreating from above 21.15 suggests traders are no longer paying such a high premium for protection against election uncertainty. But at 20.83, it’s still above 20, and the market is still a breath away from genuine calm. At this level, the message is that the storm may have passed, but the umbrella is still open.
Crypto was the only market to show a clear recovery today. The Crypto Fear & Greed Index rose 8 points in a day, from 26 to 34, finally moving away from the edge of extreme fear (below 25 is extreme fear; yesterday’s reading was just 1 point above that threshold). Bitcoin is around $77,800, up about 1.0% from roughly $77,000 yesterday morning, and holding near its 100-day exponential moving average of $77,750. The 100-day exponential moving average is the weighted average of closing prices over the past 100 trading days; holding above it would mean the short-term trend has stabilized. The $80,000 level is psychological resistance, while the $76,000 area remains a key short-term dividing line. An 8-point recovery in sentiment is no small move, but 34 is still in fear territory. Crypto investors are saying “we’re not as scared,” not “we’re ready to chase.”
Looking ahead, the turning point isn’t today—it’s tonight and Friday. Voting in the U.S. midterm elections has ended, and results will start coming in tonight. Prediction markets put the odds of Democrats taking the House above 90% and the Senate above 70%, making a divided Congress the likely outcome. What the market really needs to digest is whether that result will fuel expectations of higher taxes and tighter regulation. Wednesday also brings the U.S. Treasury’s refinancing announcement and the Institute for Supply Management’s services report; Friday brings the October jobs report. Each could push sentiment back to an extreme.
There are two short-term scenarios. If the election results match expectations and a divided Congress becomes reality, the VIX could continue moving below 20, and the S&P 500’s oversold rebound could continue. But if the results spring a surprise, or Friday’s jobs report comes in much hotter than expected and pushes rate-cut expectations further out, the CNN Fear & Greed Index could head straight toward 15, and Bitcoin’s $76,000 support will face a serious test. Sentiment indicators are sending an honest message right now: a rebound is possible, but trust hasn’t returned.
#市场情绪 #U.S. stocks
First, the most striking one. The CNN Fear & Greed Index is at 19, still in extreme fear territory. It has fallen for three consecutive trading days, from 26 to 23 to 19; a month ago, it was still at 30. Yet the S&P 500 rose 0.36% and the Nasdaq 100 rose 0.68%, both ending three-day losing streaks. Prices bounced, but sentiment didn’t. That suggests last night’s rally was mostly an oversold rebound, not a return of confidence. If you’re ready to call a bottom after one day of gains, take another look at that reading of 19.
The Cboe Volatility Index fell 1.51% to 20.83, ending a three-day winning streak. The options market breathed a sigh of relief first: the VIX retreating from above 21.15 suggests traders are no longer paying such a high premium for protection against election uncertainty. But at 20.83, it’s still above 20, and the market is still a breath away from genuine calm. At this level, the message is that the storm may have passed, but the umbrella is still open.
Crypto was the only market to show a clear recovery today. The Crypto Fear & Greed Index rose 8 points in a day, from 26 to 34, finally moving away from the edge of extreme fear (below 25 is extreme fear; yesterday’s reading was just 1 point above that threshold). Bitcoin is around $77,800, up about 1.0% from roughly $77,000 yesterday morning, and holding near its 100-day exponential moving average of $77,750. The 100-day exponential moving average is the weighted average of closing prices over the past 100 trading days; holding above it would mean the short-term trend has stabilized. The $80,000 level is psychological resistance, while the $76,000 area remains a key short-term dividing line. An 8-point recovery in sentiment is no small move, but 34 is still in fear territory. Crypto investors are saying “we’re not as scared,” not “we’re ready to chase.”
Looking ahead, the turning point isn’t today—it’s tonight and Friday. Voting in the U.S. midterm elections has ended, and results will start coming in tonight. Prediction markets put the odds of Democrats taking the House above 90% and the Senate above 70%, making a divided Congress the likely outcome. What the market really needs to digest is whether that result will fuel expectations of higher taxes and tighter regulation. Wednesday also brings the U.S. Treasury’s refinancing announcement and the Institute for Supply Management’s services report; Friday brings the October jobs report. Each could push sentiment back to an extreme.
There are two short-term scenarios. If the election results match expectations and a divided Congress becomes reality, the VIX could continue moving below 20, and the S&P 500’s oversold rebound could continue. But if the results spring a surprise, or Friday’s jobs report comes in much hotter than expected and pushes rate-cut expectations further out, the CNN Fear & Greed Index could head straight toward 15, and Bitcoin’s $76,000 support will face a serious test. Sentiment indicators are sending an honest message right now: a rebound is possible, but trust hasn’t returned.
#市场情绪 #U.S. stocks
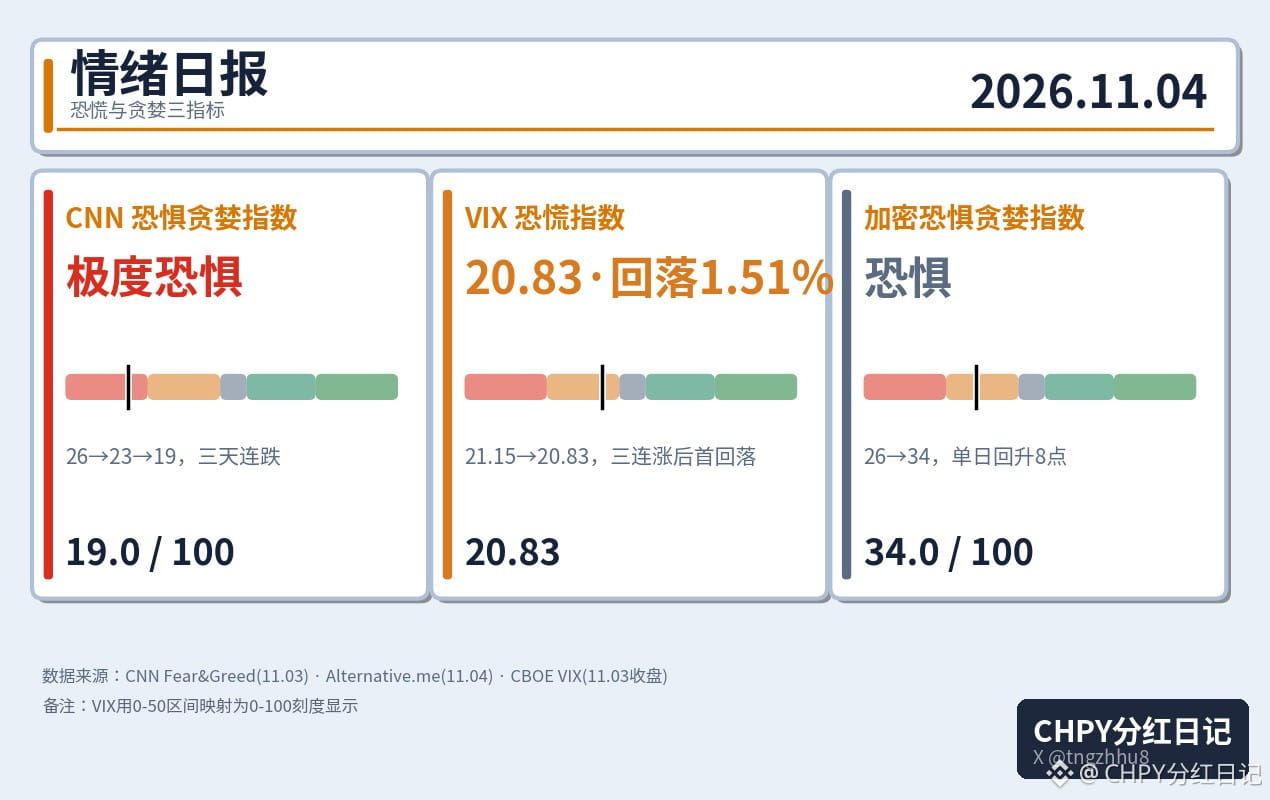
58
·
--
On midterm election day, the Nasdaq Composite ended its three-day losing streak, while the Dow Jones Industrial Average was the only major index to fall.
The S&P 500 rose 0.36% to 7,568.92, the Nasdaq Composite gained 0.83% to 25,372.01, and the Nasdaq 100 climbed 0.68% to 28,180.26, with all three ending their three-day losing streaks. The Dow Jones Industrial Average fell 0.38% to 51,786.72, making it the only major index to close lower. The Russell 2000 rose 0.23% to 2,812.45.
Sector performance was sharply divided: information technology led the gains, up 1.31%, followed by industrials at 0.96% and communication services at 0.90%. On the other hand, materials fell 1.93%, consumer staples dropped 1.76%, and energy lost 0.84%. Defensive sectors, which led on Monday, gave back gains across the board on Tuesday, while tech stocks—which had fallen for three straight days—rebounded. Monday’s sector rotation partially reversed course on Tuesday.
Chip stocks powered the rebound. The Philadelphia Semiconductor Index rose 2.50%; NVIDIA gained 2.29% to $206.69, Broadcom rose 3.07%, Micron Technology gained 2.5%, Intel rose 0.8%, and Advanced Micro Devices climbed 3.70%. Coinbase rebounded 8% after falling 15% over the previous three trading sessions. After the close, AMD reported earnings that beat expectations: third-quarter revenue was $13.38 billion, above the $13.10 billion forecast, and earnings per share came in at $2.09, above expectations of $1.95. The company forecast fourth-quarter revenue of $17 billion. Its shares rose 8% after hours, and Nasdaq 100 futures followed, gaining about 200 points.
But why was the Dow Jones Industrial Average the only index to fall? The answer is one stock: Apple, down 1.90% to $331.90. After reporting earnings the previous evening, Apple forecast a gross margin of 45% to 46%, below this quarter’s 47.9%, citing rising memory-chip prices that are eating into profits. The Dow is a price-weighted index, so a decline in a high-priced stock like Apple carries extra weight. The same development is a positive for memory makers like Micron, which directly benefit from higher prices: rising costs squeeze device manufacturers while boosting upstream memory suppliers. This theme is likely to continue playing out.
There was also a new macroeconomic factor: job openings data released by the U.S. Department of Labor (JOLTS, the Job Openings and Labor Turnover Survey) came in unexpectedly hot. The 10-year U.S. Treasury yield rose 4 basis points to 4.95%, putting pressure on rate-sensitive blue-chip stocks—and giving the Dow another reason to fall. The Cboe Volatility Index retreated 1.51% to 20.83, indicating a slight easing in investor anxiety. Brent crude fell 1.12% to $103.60, with expectations of U.S.-Iran peace talks continuing to weigh on the geopolitical premium in oil prices. Spot gold fell 0.91% to $3,933.50, while Bitcoin rose 1.35% to $77,825.40.
In my view, this rebound looks more like an oversold bounce than a trend reversal. The exchange-traded fund tracking the Nasdaq 100 remains below its 20-day and 50-day moving averages and only slightly above its 200-day moving average. Technically, this is still a weak rebound after a breakdown, not a sustained recovery. AMD’s better-than-expected earnings may give chip stocks a brief boost, but whether they can bring the Philadelphia Semiconductor Index back into an uptrend will depend on whether investors buy in after tonight. The direction will really hinge on two things Wednesday: the U.S. Treasury’s refunding announcement—$618 billion in bond issuance for the fourth quarter and plans to issue $800 billion in the first quarter of 2027—which will put the 4.95% Treasury yield to a direct test; and the Institute for Supply Management’s services report, which will show just how hot the economy is. Volatility is likely to flare up again once the midterm election results are in. Rather than chase the rally, it’s better to wait for a pullback to confirm support. There’s no shame in staying on the sidelines; rushing in is the easiest way to get caught on both sides.
#美股 #Chips
On midterm election day, the Nasdaq Composite ended its three-day losing streak, while the Dow Jones Industrial Average was the only major index to fall.
The S&P 500 rose 0.36% to 7,568.92, the Nasdaq Composite gained 0.83% to 25,372.01, and the Nasdaq 100 climbed 0.68% to 28,180.26, with all three ending their three-day losing streaks. The Dow Jones Industrial Average fell 0.38% to 51,786.72, making it the only major index to close lower. The Russell 2000 rose 0.23% to 2,812.45.
Sector performance was sharply divided: information technology led the gains, up 1.31%, followed by industrials at 0.96% and communication services at 0.90%. On the other hand, materials fell 1.93%, consumer staples dropped 1.76%, and energy lost 0.84%. Defensive sectors, which led on Monday, gave back gains across the board on Tuesday, while tech stocks—which had fallen for three straight days—rebounded. Monday’s sector rotation partially reversed course on Tuesday.
Chip stocks powered the rebound. The Philadelphia Semiconductor Index rose 2.50%; NVIDIA gained 2.29% to $206.69, Broadcom rose 3.07%, Micron Technology gained 2.5%, Intel rose 0.8%, and Advanced Micro Devices climbed 3.70%. Coinbase rebounded 8% after falling 15% over the previous three trading sessions. After the close, AMD reported earnings that beat expectations: third-quarter revenue was $13.38 billion, above the $13.10 billion forecast, and earnings per share came in at $2.09, above expectations of $1.95. The company forecast fourth-quarter revenue of $17 billion. Its shares rose 8% after hours, and Nasdaq 100 futures followed, gaining about 200 points.
But why was the Dow Jones Industrial Average the only index to fall? The answer is one stock: Apple, down 1.90% to $331.90. After reporting earnings the previous evening, Apple forecast a gross margin of 45% to 46%, below this quarter’s 47.9%, citing rising memory-chip prices that are eating into profits. The Dow is a price-weighted index, so a decline in a high-priced stock like Apple carries extra weight. The same development is a positive for memory makers like Micron, which directly benefit from higher prices: rising costs squeeze device manufacturers while boosting upstream memory suppliers. This theme is likely to continue playing out.
There was also a new macroeconomic factor: job openings data released by the U.S. Department of Labor (JOLTS, the Job Openings and Labor Turnover Survey) came in unexpectedly hot. The 10-year U.S. Treasury yield rose 4 basis points to 4.95%, putting pressure on rate-sensitive blue-chip stocks—and giving the Dow another reason to fall. The Cboe Volatility Index retreated 1.51% to 20.83, indicating a slight easing in investor anxiety. Brent crude fell 1.12% to $103.60, with expectations of U.S.-Iran peace talks continuing to weigh on the geopolitical premium in oil prices. Spot gold fell 0.91% to $3,933.50, while Bitcoin rose 1.35% to $77,825.40.
In my view, this rebound looks more like an oversold bounce than a trend reversal. The exchange-traded fund tracking the Nasdaq 100 remains below its 20-day and 50-day moving averages and only slightly above its 200-day moving average. Technically, this is still a weak rebound after a breakdown, not a sustained recovery. AMD’s better-than-expected earnings may give chip stocks a brief boost, but whether they can bring the Philadelphia Semiconductor Index back into an uptrend will depend on whether investors buy in after tonight. The direction will really hinge on two things Wednesday: the U.S. Treasury’s refunding announcement—$618 billion in bond issuance for the fourth quarter and plans to issue $800 billion in the first quarter of 2027—which will put the 4.95% Treasury yield to a direct test; and the Institute for Supply Management’s services report, which will show just how hot the economy is. Volatility is likely to flare up again once the midterm election results are in. Rather than chase the rally, it’s better to wait for a pullback to confirm support. There’s no shame in staying on the sidelines; rushing in is the easiest way to get caught on both sides.
#美股 #Chips
The S&P 500 rose 0.36% to 7,568.92, the Nasdaq Composite gained 0.83% to 25,372.01, and the Nasdaq 100 climbed 0.68% to 28,180.26, with all three ending their three-day losing streaks. The Dow Jones Industrial Average fell 0.38% to 51,786.72, making it the only major index to close lower. The Russell 2000 rose 0.23% to 2,812.45.
Sector performance was sharply divided: information technology led the gains, up 1.31%, followed by industrials at 0.96% and communication services at 0.90%. On the other hand, materials fell 1.93%, consumer staples dropped 1.76%, and energy lost 0.84%. Defensive sectors, which led on Monday, gave back gains across the board on Tuesday, while tech stocks—which had fallen for three straight days—rebounded. Monday’s sector rotation partially reversed course on Tuesday.
Chip stocks powered the rebound. The Philadelphia Semiconductor Index rose 2.50%; NVIDIA gained 2.29% to $206.69, Broadcom rose 3.07%, Micron Technology gained 2.5%, Intel rose 0.8%, and Advanced Micro Devices climbed 3.70%. Coinbase rebounded 8% after falling 15% over the previous three trading sessions. After the close, AMD reported earnings that beat expectations: third-quarter revenue was $13.38 billion, above the $13.10 billion forecast, and earnings per share came in at $2.09, above expectations of $1.95. The company forecast fourth-quarter revenue of $17 billion. Its shares rose 8% after hours, and Nasdaq 100 futures followed, gaining about 200 points.
But why was the Dow Jones Industrial Average the only index to fall? The answer is one stock: Apple, down 1.90% to $331.90. After reporting earnings the previous evening, Apple forecast a gross margin of 45% to 46%, below this quarter’s 47.9%, citing rising memory-chip prices that are eating into profits. The Dow is a price-weighted index, so a decline in a high-priced stock like Apple carries extra weight. The same development is a positive for memory makers like Micron, which directly benefit from higher prices: rising costs squeeze device manufacturers while boosting upstream memory suppliers. This theme is likely to continue playing out.
There was also a new macroeconomic factor: job openings data released by the U.S. Department of Labor (JOLTS, the Job Openings and Labor Turnover Survey) came in unexpectedly hot. The 10-year U.S. Treasury yield rose 4 basis points to 4.95%, putting pressure on rate-sensitive blue-chip stocks—and giving the Dow another reason to fall. The Cboe Volatility Index retreated 1.51% to 20.83, indicating a slight easing in investor anxiety. Brent crude fell 1.12% to $103.60, with expectations of U.S.-Iran peace talks continuing to weigh on the geopolitical premium in oil prices. Spot gold fell 0.91% to $3,933.50, while Bitcoin rose 1.35% to $77,825.40.
In my view, this rebound looks more like an oversold bounce than a trend reversal. The exchange-traded fund tracking the Nasdaq 100 remains below its 20-day and 50-day moving averages and only slightly above its 200-day moving average. Technically, this is still a weak rebound after a breakdown, not a sustained recovery. AMD’s better-than-expected earnings may give chip stocks a brief boost, but whether they can bring the Philadelphia Semiconductor Index back into an uptrend will depend on whether investors buy in after tonight. The direction will really hinge on two things Wednesday: the U.S. Treasury’s refunding announcement—$618 billion in bond issuance for the fourth quarter and plans to issue $800 billion in the first quarter of 2027—which will put the 4.95% Treasury yield to a direct test; and the Institute for Supply Management’s services report, which will show just how hot the economy is. Volatility is likely to flare up again once the midterm election results are in. Rather than chase the rally, it’s better to wait for a pullback to confirm support. There’s no shame in staying on the sidelines; rushing in is the easiest way to get caught on both sides.
#美股 #Chips
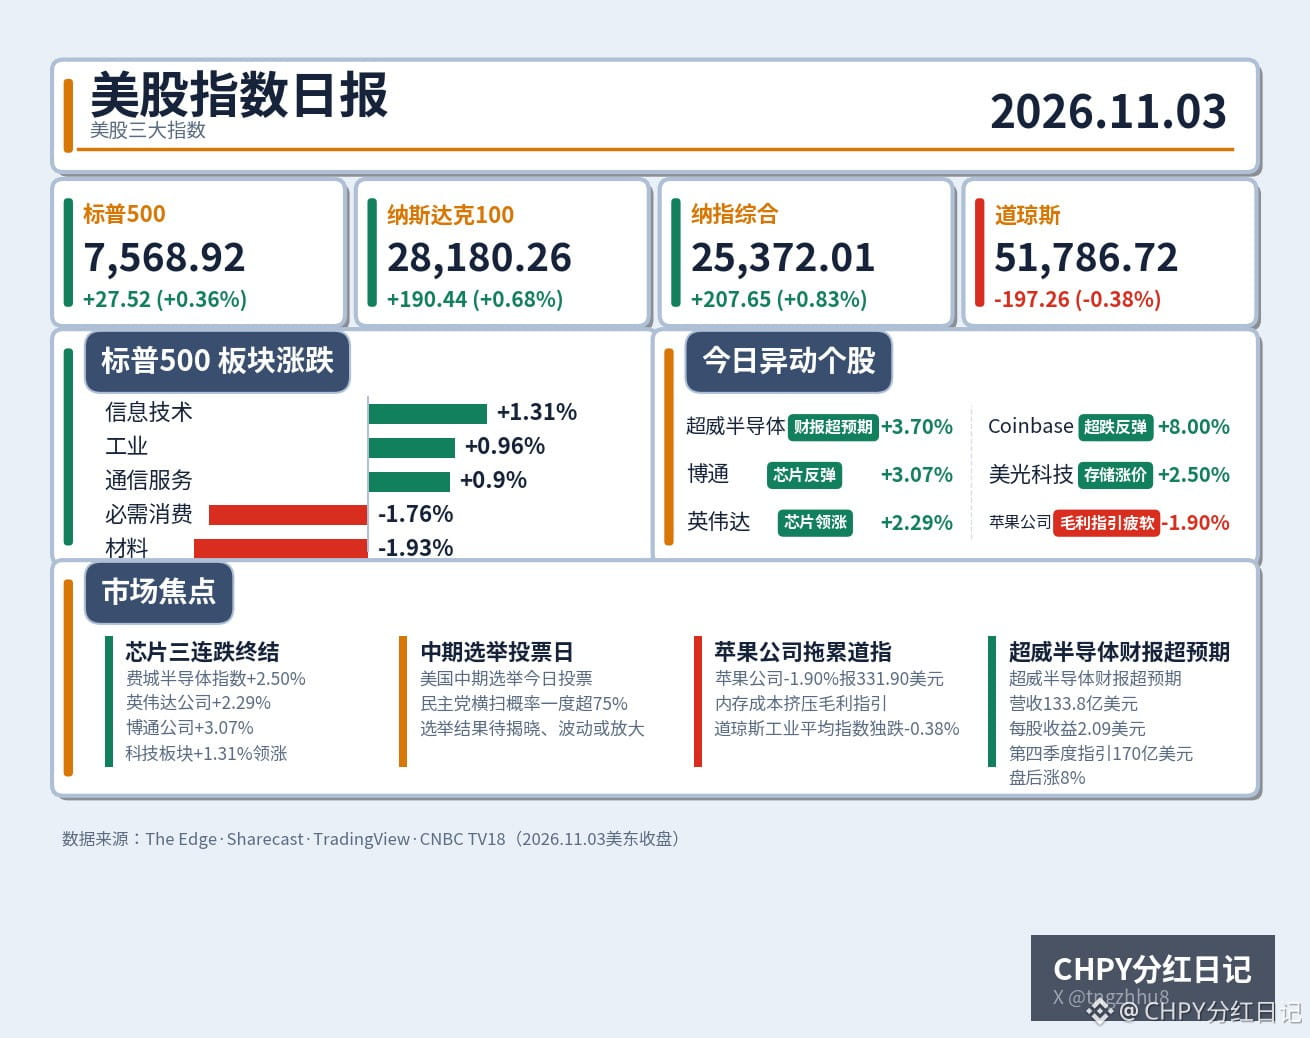
656
·
--
In a single day, gold and crude oil swapped roles. Yesterday, hopes for peace talks were in the driver’s seat: Brent crude plunged 7.63% in a day, West Texas Intermediate fell 7.36%, and gold climbed 1.9% on the back of it. Today, the mood shifted. The U.S. military carried out a limited, so-called “defensive strike” on Iran’s Qeshm Island in the Strait of Hormuz, sending oil prices bouncing back while gold and silver plunged across the board. Spot gold fell below $3,950 to $3,916.55, down 0.76%. Spot silver slid more than 3%, falling below $50 to $49.12. Brent crude neared $105 and WTI returned to around $97.50, both up about 1%.
The chain of events is straightforward: geopolitical risk premium moved between oil and gold. When hopes for peace talks emerged, the “war premium” in oil was stripped away first, sending prices tumbling. Meanwhile, safe-haven buying picked up in gold, pushing prices higher. Once the limited strike took place, that premium flowed back into oil, and safe-haven buyers in gold immediately pulled their orders. The same geopolitical risk lifted gold yesterday and oil today. Which one rises depends on what the market fears more at the time: fears of supply disruptions lift oil; fears of escalation lift gold.
But more important to watch than one day’s gains and losses is the shift in what’s driving gold prices this year. At the start of the year, gold surged to a record high of more than $5,500 an ounce. It has since fallen more than 8% this year, dropping below $4,000. It fell 6.8% in October alone, and briefly dropped below $3,900 on October 30, hitting a new low for the year. The Relative Strength Index (RSI, a measure of the strength of price moves, with lower readings indicating heavier selling) had already entered oversold territory last week. The sharp drop on October 30 is even more telling: it wasn’t that nobody wanted gold. When liquidity is tight, investors sell the easiest assets to convert into cash first—turning a safe-haven asset into an ATM.
Put simply, gold hasn’t stopped being a safe haven this year; what’s changed is the weighting of the factors that determine its price. “Safe-haven demand” has taken a back seat to “liquidity” and “interest rates.” The 10-year U.S. Treasury yield is still elevated at around 4.9%, so the opportunity cost of holding non-yielding gold hasn’t come down. In the short term, the RSI’s oversold reading could trigger a technical rebound at any time. But for a reversal, at least one of two signals is needed: either the U.S. and Iran reach a deal and oil prices fall further, thoroughly dampening inflation expectations; or the U.S. midterm election results come in and risk appetite is repriced.
There’s another divergence that’s easy to overlook: gold on the Shanghai Gold Exchange’s T+D contract closed up 0.19% today at 840.16 yuan per gram, while silver T+D fell 1.33%. Domestic gold prices didn’t fall alongside international prices. This divergence between domestic and overseas markets suggests local buying remains resilient, and that the latest sell-off in international gold prices is driven more by deleveraging among overseas investors.
There are three risks to watch. First, voting in the U.S. midterm elections takes place today, with a record 50 million people having already voted early. The results won’t become clear until Wednesday’s Asian trading session, so gold prices tonight will still sway with election expectations. Second, the U.S. Department of Labor will release September job openings data tonight. If the labor market is overheated and rate-hike expectations return, gold could take another hit. Third, the strike on Qeshm Island was only “limited.” If the conflict escalates, oil and gold could rise together, and today’s “oil up, gold down” dynamic could reverse at any moment.
With gold below $4,000, both bargain hunters and bears think they’re right—and when disagreement is greatest, a market reversal is often closest.
#黄金 #U.S. stocks
In a single day, gold and crude oil swapped roles. Yesterday, hopes for peace talks were in the driver’s seat: Brent crude plunged 7.63% in a day, West Texas Intermediate fell 7.36%, and gold climbed 1.9% on the back of it. Today, the mood shifted. The U.S. military carried out a limited, so-called “defensive strike” on Iran’s Qeshm Island in the Strait of Hormuz, sending oil prices bouncing back while gold and silver plunged across the board. Spot gold fell below $3,950 to $3,916.55, down 0.76%. Spot silver slid more than 3%, falling below $50 to $49.12. Brent crude neared $105 and WTI returned to around $97.50, both up about 1%.
The chain of events is straightforward: geopolitical risk premium moved between oil and gold. When hopes for peace talks emerged, the “war premium” in oil was stripped away first, sending prices tumbling. Meanwhile, safe-haven buying picked up in gold, pushing prices higher. Once the limited strike took place, that premium flowed back into oil, and safe-haven buyers in gold immediately pulled their orders. The same geopolitical risk lifted gold yesterday and oil today. Which one rises depends on what the market fears more at the time: fears of supply disruptions lift oil; fears of escalation lift gold.
But more important to watch than one day’s gains and losses is the shift in what’s driving gold prices this year. At the start of the year, gold surged to a record high of more than $5,500 an ounce. It has since fallen more than 8% this year, dropping below $4,000. It fell 6.8% in October alone, and briefly dropped below $3,900 on October 30, hitting a new low for the year. The Relative Strength Index (RSI, a measure of the strength of price moves, with lower readings indicating heavier selling) had already entered oversold territory last week. The sharp drop on October 30 is even more telling: it wasn’t that nobody wanted gold. When liquidity is tight, investors sell the easiest assets to convert into cash first—turning a safe-haven asset into an ATM.
Put simply, gold hasn’t stopped being a safe haven this year; what’s changed is the weighting of the factors that determine its price. “Safe-haven demand” has taken a back seat to “liquidity” and “interest rates.” The 10-year U.S. Treasury yield is still elevated at around 4.9%, so the opportunity cost of holding non-yielding gold hasn’t come down. In the short term, the RSI’s oversold reading could trigger a technical rebound at any time. But for a reversal, at least one of two signals is needed: either the U.S. and Iran reach a deal and oil prices fall further, thoroughly dampening inflation expectations; or the U.S. midterm election results come in and risk appetite is repriced.
There’s another divergence that’s easy to overlook: gold on the Shanghai Gold Exchange’s T+D contract closed up 0.19% today at 840.16 yuan per gram, while silver T+D fell 1.33%. Domestic gold prices didn’t fall alongside international prices. This divergence between domestic and overseas markets suggests local buying remains resilient, and that the latest sell-off in international gold prices is driven more by deleveraging among overseas investors.
There are three risks to watch. First, voting in the U.S. midterm elections takes place today, with a record 50 million people having already voted early. The results won’t become clear until Wednesday’s Asian trading session, so gold prices tonight will still sway with election expectations. Second, the U.S. Department of Labor will release September job openings data tonight. If the labor market is overheated and rate-hike expectations return, gold could take another hit. Third, the strike on Qeshm Island was only “limited.” If the conflict escalates, oil and gold could rise together, and today’s “oil up, gold down” dynamic could reverse at any moment.
With gold below $4,000, both bargain hunters and bears think they’re right—and when disagreement is greatest, a market reversal is often closest.
#黄金 #U.S. stocks
The chain of events is straightforward: geopolitical risk premium moved between oil and gold. When hopes for peace talks emerged, the “war premium” in oil was stripped away first, sending prices tumbling. Meanwhile, safe-haven buying picked up in gold, pushing prices higher. Once the limited strike took place, that premium flowed back into oil, and safe-haven buyers in gold immediately pulled their orders. The same geopolitical risk lifted gold yesterday and oil today. Which one rises depends on what the market fears more at the time: fears of supply disruptions lift oil; fears of escalation lift gold.
But more important to watch than one day’s gains and losses is the shift in what’s driving gold prices this year. At the start of the year, gold surged to a record high of more than $5,500 an ounce. It has since fallen more than 8% this year, dropping below $4,000. It fell 6.8% in October alone, and briefly dropped below $3,900 on October 30, hitting a new low for the year. The Relative Strength Index (RSI, a measure of the strength of price moves, with lower readings indicating heavier selling) had already entered oversold territory last week. The sharp drop on October 30 is even more telling: it wasn’t that nobody wanted gold. When liquidity is tight, investors sell the easiest assets to convert into cash first—turning a safe-haven asset into an ATM.
Put simply, gold hasn’t stopped being a safe haven this year; what’s changed is the weighting of the factors that determine its price. “Safe-haven demand” has taken a back seat to “liquidity” and “interest rates.” The 10-year U.S. Treasury yield is still elevated at around 4.9%, so the opportunity cost of holding non-yielding gold hasn’t come down. In the short term, the RSI’s oversold reading could trigger a technical rebound at any time. But for a reversal, at least one of two signals is needed: either the U.S. and Iran reach a deal and oil prices fall further, thoroughly dampening inflation expectations; or the U.S. midterm election results come in and risk appetite is repriced.
There’s another divergence that’s easy to overlook: gold on the Shanghai Gold Exchange’s T+D contract closed up 0.19% today at 840.16 yuan per gram, while silver T+D fell 1.33%. Domestic gold prices didn’t fall alongside international prices. This divergence between domestic and overseas markets suggests local buying remains resilient, and that the latest sell-off in international gold prices is driven more by deleveraging among overseas investors.
There are three risks to watch. First, voting in the U.S. midterm elections takes place today, with a record 50 million people having already voted early. The results won’t become clear until Wednesday’s Asian trading session, so gold prices tonight will still sway with election expectations. Second, the U.S. Department of Labor will release September job openings data tonight. If the labor market is overheated and rate-hike expectations return, gold could take another hit. Third, the strike on Qeshm Island was only “limited.” If the conflict escalates, oil and gold could rise together, and today’s “oil up, gold down” dynamic could reverse at any moment.
With gold below $4,000, both bargain hunters and bears think they’re right—and when disagreement is greatest, a market reversal is often closest.
#黄金 #U.S. stocks
·
--
Money is moving out of tech stocks. The split between a rising Dow and a falling Nasdaq is no one-day blip.
At the November 2 close, the Dow Jones Industrial Average rose 0.41% to 51,983.98, the S&P 500 fell 0.51% to 7,541.40, and the Nasdaq Composite dropped 1.07% to 25,164.32. The opening scene looked quite different: the Nasdaq Composite was up as much as 1.4%, and the S&P 500 as much as 1.1%. Then waves of selling in tech stocks erased all those gains in the afternoon. The Cboe Volatility Index (VIX, the “fear gauge”—the higher it is, the more worried the market is) rose 8.91% on the day to 21.15, moving above the key 20 threshold. The Nasdaq 100 fell 1.39%, officially entering correction territory—in plain English, down more than 10% from its high. The Nasdaq Composite also posted its worst monthly performance since March 2025 in October.
Apple is the clearest example. Its earnings clearly beat expectations: revenue was $114.48 billion, above the market estimate of $113.39 billion; earnings per share (EPS, or how much profit the company made per share) were $2.10, above the expected $1.99; and iPhone revenue was $57.58 billion, up 17.5% year over year. Yet the stock fell as much as 4.5% after hours. Why? Its gross margin forecast for the next quarter was just 45% to 46%, below this quarter’s 47.9% and the market’s 46.3% estimate. On the earnings call, the CFO pointed to the main reason: memory prices are rising. The company is nearly out of the cheaper memory it had stockpiled, so it will have to buy at higher prices—and prices will only get higher over time. Services revenue hit a quarterly record of $31.57 billion, but growth slipped below 10%, its lowest level in more than three years. Greater China revenue was $17.5 billion, up 21% year over year, but about $1 billion below expectations. More painful still is the valuation: Apple’s forward price-to-earnings ratio (how many times the stock price represents its earnings per share over the next year; the higher the multiple, the more expensive the stock) is about 35, nearly twice that of the S&P 500. Analysts have bluntly said that with profit growth forecast at just 1% next year, that growth cannot justify this price.
The chain of events is clear: the market is starting to price in the bill for AI. The pace of spending needs to match the pace of making money. Apple’s gross margin forecast is that bill: higher memory costs and investment in Siri AI are eating into profits. Where is the money coming from, and where is it going? It is pulling out of high-valuation tech stocks and flowing into value stocks—industrials and consumer companies among the Dow Jones Industrial Average’s constituents—as a safe haven. A 7.6% plunge in oil prices in a single day also gave value stocks a boost: Brent crude closed at $104.77 and U.S. West Texas Intermediate at $96.46. Inflation concerns have eased for now, giving cyclical stocks a bit of breathing room. But the VIX climbing above 21 shows that fear has not gone away. This is not a completed rotation between styles; it is a rotation in progress.
The next test comes tonight: Advanced Micro Devices reports its third-quarter results after the market close. The market expects revenue of $13.09 billion, up 41.5% year over year, and earnings per share of $1.95, up 62.5%. Data center revenue is expected to come in at $8.2 billion to $8.3 billion. Options markets are pricing in an 8.95% move in the stock in either direction after the report, while AMD shares have already fallen nearly 30% from their high less than a month ago. Intel’s weak fourth-quarter forecast has already poured cold water on chip stocks. If AMD’s results miss expectations, chip stocks could take another leg down. If they beat expectations and offer strong guidance for data center revenue in 2027, the rotation could temporarily stall, giving tech stocks a chance to catch their breath.
Looking ahead, this divergence is likely to continue for a while. In the short term, money will keep seeking shelter in value stocks. For a Nasdaq Composite rebound, the first level to watch is whether it can recover the 25,500 mark. The real mid-term hurdles are twofold: tonight’s AMD earnings and Friday’s nonfarm payrolls report. If the market cannot clear them, the correction will deepen. There are three risks to watch: voting in the U.S. midterm elections takes place tonight, and the outcome is still uncertain; the oil-price plunge is based on expectations of diplomatic easing between the U.S. and Iran, and any breakdown in talks could send oil prices rebounding quickly; and Bitcoin has already fallen below $77,000. Sentiment across risk assets is interconnected, so another leg down in crypto could also weigh on sentiment at the U.S. market open.
When stocks rise, look for who’s swimming naked; when they fall, watch where the money goes. This migration is only just beginning. Keep an eye on AMD’s report tonight.
#美股 #Chips
Money is moving out of tech stocks. The split between a rising Dow and a falling Nasdaq is no one-day blip.
At the November 2 close, the Dow Jones Industrial Average rose 0.41% to 51,983.98, the S&P 500 fell 0.51% to 7,541.40, and the Nasdaq Composite dropped 1.07% to 25,164.32. The opening scene looked quite different: the Nasdaq Composite was up as much as 1.4%, and the S&P 500 as much as 1.1%. Then waves of selling in tech stocks erased all those gains in the afternoon. The Cboe Volatility Index (VIX, the “fear gauge”—the higher it is, the more worried the market is) rose 8.91% on the day to 21.15, moving above the key 20 threshold. The Nasdaq 100 fell 1.39%, officially entering correction territory—in plain English, down more than 10% from its high. The Nasdaq Composite also posted its worst monthly performance since March 2025 in October.
Apple is the clearest example. Its earnings clearly beat expectations: revenue was $114.48 billion, above the market estimate of $113.39 billion; earnings per share (EPS, or how much profit the company made per share) were $2.10, above the expected $1.99; and iPhone revenue was $57.58 billion, up 17.5% year over year. Yet the stock fell as much as 4.5% after hours. Why? Its gross margin forecast for the next quarter was just 45% to 46%, below this quarter’s 47.9% and the market’s 46.3% estimate. On the earnings call, the CFO pointed to the main reason: memory prices are rising. The company is nearly out of the cheaper memory it had stockpiled, so it will have to buy at higher prices—and prices will only get higher over time. Services revenue hit a quarterly record of $31.57 billion, but growth slipped below 10%, its lowest level in more than three years. Greater China revenue was $17.5 billion, up 21% year over year, but about $1 billion below expectations. More painful still is the valuation: Apple’s forward price-to-earnings ratio (how many times the stock price represents its earnings per share over the next year; the higher the multiple, the more expensive the stock) is about 35, nearly twice that of the S&P 500. Analysts have bluntly said that with profit growth forecast at just 1% next year, that growth cannot justify this price.
The chain of events is clear: the market is starting to price in the bill for AI. The pace of spending needs to match the pace of making money. Apple’s gross margin forecast is that bill: higher memory costs and investment in Siri AI are eating into profits. Where is the money coming from, and where is it going? It is pulling out of high-valuation tech stocks and flowing into value stocks—industrials and consumer companies among the Dow Jones Industrial Average’s constituents—as a safe haven. A 7.6% plunge in oil prices in a single day also gave value stocks a boost: Brent crude closed at $104.77 and U.S. West Texas Intermediate at $96.46. Inflation concerns have eased for now, giving cyclical stocks a bit of breathing room. But the VIX climbing above 21 shows that fear has not gone away. This is not a completed rotation between styles; it is a rotation in progress.
The next test comes tonight: Advanced Micro Devices reports its third-quarter results after the market close. The market expects revenue of $13.09 billion, up 41.5% year over year, and earnings per share of $1.95, up 62.5%. Data center revenue is expected to come in at $8.2 billion to $8.3 billion. Options markets are pricing in an 8.95% move in the stock in either direction after the report, while AMD shares have already fallen nearly 30% from their high less than a month ago. Intel’s weak fourth-quarter forecast has already poured cold water on chip stocks. If AMD’s results miss expectations, chip stocks could take another leg down. If they beat expectations and offer strong guidance for data center revenue in 2027, the rotation could temporarily stall, giving tech stocks a chance to catch their breath.
Looking ahead, this divergence is likely to continue for a while. In the short term, money will keep seeking shelter in value stocks. For a Nasdaq Composite rebound, the first level to watch is whether it can recover the 25,500 mark. The real mid-term hurdles are twofold: tonight’s AMD earnings and Friday’s nonfarm payrolls report. If the market cannot clear them, the correction will deepen. There are three risks to watch: voting in the U.S. midterm elections takes place tonight, and the outcome is still uncertain; the oil-price plunge is based on expectations of diplomatic easing between the U.S. and Iran, and any breakdown in talks could send oil prices rebounding quickly; and Bitcoin has already fallen below $77,000. Sentiment across risk assets is interconnected, so another leg down in crypto could also weigh on sentiment at the U.S. market open.
When stocks rise, look for who’s swimming naked; when they fall, watch where the money goes. This migration is only just beginning. Keep an eye on AMD’s report tonight.
#美股 #Chips
At the November 2 close, the Dow Jones Industrial Average rose 0.41% to 51,983.98, the S&P 500 fell 0.51% to 7,541.40, and the Nasdaq Composite dropped 1.07% to 25,164.32. The opening scene looked quite different: the Nasdaq Composite was up as much as 1.4%, and the S&P 500 as much as 1.1%. Then waves of selling in tech stocks erased all those gains in the afternoon. The Cboe Volatility Index (VIX, the “fear gauge”—the higher it is, the more worried the market is) rose 8.91% on the day to 21.15, moving above the key 20 threshold. The Nasdaq 100 fell 1.39%, officially entering correction territory—in plain English, down more than 10% from its high. The Nasdaq Composite also posted its worst monthly performance since March 2025 in October.
Apple is the clearest example. Its earnings clearly beat expectations: revenue was $114.48 billion, above the market estimate of $113.39 billion; earnings per share (EPS, or how much profit the company made per share) were $2.10, above the expected $1.99; and iPhone revenue was $57.58 billion, up 17.5% year over year. Yet the stock fell as much as 4.5% after hours. Why? Its gross margin forecast for the next quarter was just 45% to 46%, below this quarter’s 47.9% and the market’s 46.3% estimate. On the earnings call, the CFO pointed to the main reason: memory prices are rising. The company is nearly out of the cheaper memory it had stockpiled, so it will have to buy at higher prices—and prices will only get higher over time. Services revenue hit a quarterly record of $31.57 billion, but growth slipped below 10%, its lowest level in more than three years. Greater China revenue was $17.5 billion, up 21% year over year, but about $1 billion below expectations. More painful still is the valuation: Apple’s forward price-to-earnings ratio (how many times the stock price represents its earnings per share over the next year; the higher the multiple, the more expensive the stock) is about 35, nearly twice that of the S&P 500. Analysts have bluntly said that with profit growth forecast at just 1% next year, that growth cannot justify this price.
The chain of events is clear: the market is starting to price in the bill for AI. The pace of spending needs to match the pace of making money. Apple’s gross margin forecast is that bill: higher memory costs and investment in Siri AI are eating into profits. Where is the money coming from, and where is it going? It is pulling out of high-valuation tech stocks and flowing into value stocks—industrials and consumer companies among the Dow Jones Industrial Average’s constituents—as a safe haven. A 7.6% plunge in oil prices in a single day also gave value stocks a boost: Brent crude closed at $104.77 and U.S. West Texas Intermediate at $96.46. Inflation concerns have eased for now, giving cyclical stocks a bit of breathing room. But the VIX climbing above 21 shows that fear has not gone away. This is not a completed rotation between styles; it is a rotation in progress.
The next test comes tonight: Advanced Micro Devices reports its third-quarter results after the market close. The market expects revenue of $13.09 billion, up 41.5% year over year, and earnings per share of $1.95, up 62.5%. Data center revenue is expected to come in at $8.2 billion to $8.3 billion. Options markets are pricing in an 8.95% move in the stock in either direction after the report, while AMD shares have already fallen nearly 30% from their high less than a month ago. Intel’s weak fourth-quarter forecast has already poured cold water on chip stocks. If AMD’s results miss expectations, chip stocks could take another leg down. If they beat expectations and offer strong guidance for data center revenue in 2027, the rotation could temporarily stall, giving tech stocks a chance to catch their breath.
Looking ahead, this divergence is likely to continue for a while. In the short term, money will keep seeking shelter in value stocks. For a Nasdaq Composite rebound, the first level to watch is whether it can recover the 25,500 mark. The real mid-term hurdles are twofold: tonight’s AMD earnings and Friday’s nonfarm payrolls report. If the market cannot clear them, the correction will deepen. There are three risks to watch: voting in the U.S. midterm elections takes place tonight, and the outcome is still uncertain; the oil-price plunge is based on expectations of diplomatic easing between the U.S. and Iran, and any breakdown in talks could send oil prices rebounding quickly; and Bitcoin has already fallen below $77,000. Sentiment across risk assets is interconnected, so another leg down in crypto could also weigh on sentiment at the U.S. market open.
When stocks rise, look for who’s swimming naked; when they fall, watch where the money goes. This migration is only just beginning. Keep an eye on AMD’s report tonight.
#美股 #Chips
246
·
--
Bitcoin has fallen below $77,000, and the charts are flashing a danger signal.
CoinDesk reported today that the Guppy Multiple Moving Average (GMMA) on Bitcoin’s daily chart has turned bearish: the short-term moving averages have crossed below the long-term averages, while the long-term averages are also beginning to converge downward and flatten out. In plain English: short-term buyers have pulled back, and long-term investors are no longer stepping in aggressively. The market is reaching a consensus that “this isn’t a price to buy at just yet.” The same signal appeared in late May, after which Bitcoin fell below $60,000 within a week. But false signals also appeared in August and September last year, followed by a quick rebound—this indicator is no ironclad rule.
More worth watching is that the fundamentals are deteriorating at the same time. U.S. spot Bitcoin ETFs (exchange-traded funds) saw net outflows of $643 million on October 30, their largest since June, followed by another $399 million on November 2. Cumulative outflows reached $739 million over seven trading days. Institutional money is flowing out, not in.
The trigger was the fallout from Binance’s security incident. Reports circulated that Binance had suffered a cyberattack involving around $6.3 billion. On October 30, more than $1 billion in crypto futures positions were liquidated across the market, and the Fear and Greed Index fell to 26, in the fear zone. The depth of Binance’s Bitcoin order book briefly dropped by around 30%. Although net outflows have fallen from a peak of around $7 billion to $3.5 billion, and the deposit-to-withdrawal ratio has returned to 78%, the liquidity wound has yet to fully heal.
The chain of events is clear: a security shock undermines confidence → leveraged positions are forced to close → ETF money follows suit and exits → the price falls below the psychological $77,000 threshold → the GMMA confirms the bearish turn, giving bears a reason to keep probing lower.
The real variable tonight is the U.S. midterm election vote. Historical patterns suggest that Bitcoin often rebounds after midterm elections. Meanwhile, the implied volatility of Bitcoin options expiring on November 4 has risen to around 43.5%, well above the 36% for longer-dated contracts. Implied volatility is the price the options market puts on future volatility; the higher it is, the more traders expect a major move. They’re all buying insurance against big swings on election night.
Before the election results come in, $76,000–$76,600 is the first support zone. If it fails to hold, the next level to watch is $75,000. On the other hand, if risk sentiment improves after the election and ETF outflows stop, $79,500–$80,500 is the first resistance zone; Bitcoin needs to reclaim that range before we can talk about a bottom. Don’t chase shorts in a panic, and don’t buy the dip before the price has stabilized. Wait for the election-night uncertainty to clear.
Risk factors: Funds stolen from Binance are still being moved across chains; another security incident could deal a second blow to liquidity. If the midterm election produces a disputed result, risk assets may be sold off first as investors seek safety.
#比特币 #BTC
Bitcoin has fallen below $77,000, and the charts are flashing a danger signal.
CoinDesk reported today that the Guppy Multiple Moving Average (GMMA) on Bitcoin’s daily chart has turned bearish: the short-term moving averages have crossed below the long-term averages, while the long-term averages are also beginning to converge downward and flatten out. In plain English: short-term buyers have pulled back, and long-term investors are no longer stepping in aggressively. The market is reaching a consensus that “this isn’t a price to buy at just yet.” The same signal appeared in late May, after which Bitcoin fell below $60,000 within a week. But false signals also appeared in August and September last year, followed by a quick rebound—this indicator is no ironclad rule.
More worth watching is that the fundamentals are deteriorating at the same time. U.S. spot Bitcoin ETFs (exchange-traded funds) saw net outflows of $643 million on October 30, their largest since June, followed by another $399 million on November 2. Cumulative outflows reached $739 million over seven trading days. Institutional money is flowing out, not in.
The trigger was the fallout from Binance’s security incident. Reports circulated that Binance had suffered a cyberattack involving around $6.3 billion. On October 30, more than $1 billion in crypto futures positions were liquidated across the market, and the Fear and Greed Index fell to 26, in the fear zone. The depth of Binance’s Bitcoin order book briefly dropped by around 30%. Although net outflows have fallen from a peak of around $7 billion to $3.5 billion, and the deposit-to-withdrawal ratio has returned to 78%, the liquidity wound has yet to fully heal.
The chain of events is clear: a security shock undermines confidence → leveraged positions are forced to close → ETF money follows suit and exits → the price falls below the psychological $77,000 threshold → the GMMA confirms the bearish turn, giving bears a reason to keep probing lower.
The real variable tonight is the U.S. midterm election vote. Historical patterns suggest that Bitcoin often rebounds after midterm elections. Meanwhile, the implied volatility of Bitcoin options expiring on November 4 has risen to around 43.5%, well above the 36% for longer-dated contracts. Implied volatility is the price the options market puts on future volatility; the higher it is, the more traders expect a major move. They’re all buying insurance against big swings on election night.
Before the election results come in, $76,000–$76,600 is the first support zone. If it fails to hold, the next level to watch is $75,000. On the other hand, if risk sentiment improves after the election and ETF outflows stop, $79,500–$80,500 is the first resistance zone; Bitcoin needs to reclaim that range before we can talk about a bottom. Don’t chase shorts in a panic, and don’t buy the dip before the price has stabilized. Wait for the election-night uncertainty to clear.
Risk factors: Funds stolen from Binance are still being moved across chains; another security incident could deal a second blow to liquidity. If the midterm election produces a disputed result, risk assets may be sold off first as investors seek safety.
#比特币 #BTC
CoinDesk reported today that the Guppy Multiple Moving Average (GMMA) on Bitcoin’s daily chart has turned bearish: the short-term moving averages have crossed below the long-term averages, while the long-term averages are also beginning to converge downward and flatten out. In plain English: short-term buyers have pulled back, and long-term investors are no longer stepping in aggressively. The market is reaching a consensus that “this isn’t a price to buy at just yet.” The same signal appeared in late May, after which Bitcoin fell below $60,000 within a week. But false signals also appeared in August and September last year, followed by a quick rebound—this indicator is no ironclad rule.
More worth watching is that the fundamentals are deteriorating at the same time. U.S. spot Bitcoin ETFs (exchange-traded funds) saw net outflows of $643 million on October 30, their largest since June, followed by another $399 million on November 2. Cumulative outflows reached $739 million over seven trading days. Institutional money is flowing out, not in.
The trigger was the fallout from Binance’s security incident. Reports circulated that Binance had suffered a cyberattack involving around $6.3 billion. On October 30, more than $1 billion in crypto futures positions were liquidated across the market, and the Fear and Greed Index fell to 26, in the fear zone. The depth of Binance’s Bitcoin order book briefly dropped by around 30%. Although net outflows have fallen from a peak of around $7 billion to $3.5 billion, and the deposit-to-withdrawal ratio has returned to 78%, the liquidity wound has yet to fully heal.
The chain of events is clear: a security shock undermines confidence → leveraged positions are forced to close → ETF money follows suit and exits → the price falls below the psychological $77,000 threshold → the GMMA confirms the bearish turn, giving bears a reason to keep probing lower.
The real variable tonight is the U.S. midterm election vote. Historical patterns suggest that Bitcoin often rebounds after midterm elections. Meanwhile, the implied volatility of Bitcoin options expiring on November 4 has risen to around 43.5%, well above the 36% for longer-dated contracts. Implied volatility is the price the options market puts on future volatility; the higher it is, the more traders expect a major move. They’re all buying insurance against big swings on election night.
Before the election results come in, $76,000–$76,600 is the first support zone. If it fails to hold, the next level to watch is $75,000. On the other hand, if risk sentiment improves after the election and ETF outflows stop, $79,500–$80,500 is the first resistance zone; Bitcoin needs to reclaim that range before we can talk about a bottom. Don’t chase shorts in a panic, and don’t buy the dip before the price has stabilized. Wait for the election-night uncertainty to clear.
Risk factors: Funds stolen from Binance are still being moved across chains; another security incident could deal a second blow to liquidity. If the midterm election produces a disputed result, risk assets may be sold off first as investors seek safety.
#比特币 #BTC
·
--
Today is Election Day for the U.S. midterms. This election isn’t about choosing a president; it’s about determining whether Trump can still call the shots during the second half of his term. All 435 seats in the House of Representatives are up for election, as are 35 Senate seats, and 36 states are also holding gubernatorial elections. Polls open on November 3 Eastern Time, with results starting to come in from the morning of November 4 Beijing Time.
First, the seat math. A majority in the House requires 218 seats. Republicans currently hold exactly 218, Democrats have 214, and two seats are vacant. That means Republicans have no seats to spare: Democrats need only first reclaim one vacant seat they are expected to win, then flip three Republican-held seats to take control of the House. In the Senate, Republicans hold 53 seats, while Democrats have 45 plus two independents who caucus with them. Democrats need a net gain of four seats to reach a 51-seat majority, making the Senate a much tougher challenge than the House. In its October 23 ratings, the Cook Political Report listed 219 House seats as leaning Democratic, 198 as leaning Republican, and 17 as toss-ups. The October 30 average of generic congressional ballot polls from Silver Bulletin showed Democrats leading by 8.9 percentage points. An October 26 Reuters/Ipsos poll put Trump’s approval rating at 32%. Early voting has already set a midterm-election record: as of the morning of November 2, approximately 54.8 million Americans had voted by mail or in person early, compared with about 45.9 million in the 2022 midterms. Early voting means casting a ballot before Election Day; the higher the number, the more it indicates that both sides have mobilized their core voters.
What really matters to markets about this election isn’t who wins, but how far policy can go afterward. There are three scenarios. First, Democrats retake only the House while Republicans retain the Senate. This is the outcome polls point to as the most likely. Congress would be divided, and the House would likely block most of Trump’s legislative agenda for the second half of his term, including extending tax cuts, escalating tariffs, and deregulation. For markets, this would act as a brake: the fiscal-expansion accelerator would be harder to press, the pace of deficit deterioration would slow, and upward pressure on long-term Treasury yields could ease. But calls for AI regulation, antitrust investigations, and breaking up big tech companies would grow louder, forcing a repricing of policy risk for technology stocks. Second, Republicans hold on to both chambers. This would mean the strongest policy continuity, with AI infrastructure investment, tax cuts, and deregulation continuing to advance. That would be a short-term positive for risk assets, but concerns about a widening fiscal deficit could resurface, potentially weighing on long-term Treasury yields and the dollar. Third, Democrats win both chambers. This is the least likely but most disruptive scenario, signaling a wholesale policy shift for the second half of the term. Tariffs, energy, and tech regulation could all swing in a new direction, and markets would have to revalue a completely different policy mix.
Tonight, markets have to digest two major events, and election results are only one of them. The other is Advanced Micro Devices’ third-quarter earnings, due after the U.S. market closes tonight. The earnings call is scheduled for 5 p.m. Eastern Time, or 6 a.m. on November 4 Beijing Time. Wall Street expects revenue of about $13.09 billion, up approximately 41.6% year over year, and adjusted earnings per share of about $1.95, up roughly 62% from $1.20 in the same period last year. The company’s own guidance is for revenue of around $13 billion, plus or minus $300 million, and a non-GAAP gross margin of about 56%. The stock fell 10.88% in a single session on October 30, closing at $504.80. It has now fallen about 22% from its October 6 high of $649.42. The decline wasn’t driven by AMD’s own numbers, but by Intel’s lowered guidance, which dragged down sentiment across the entire chip sector. The real focus of the earnings report isn’t the third quarter, but whether the fourth-quarter guidance delivers on the shipment pace for Helios rack systems—AMD’s complete AI computing systems sold as whole racks, rather than as individual chips. Meta Platforms has already said that it is testing the installation of its first Helios systems. Yesterday, the Philadelphia Semiconductor Index fell 3.37% in a single session, while the Nasdaq 100 dropped 10% from its October high and entered a technical correction. A technical correction means a decline of more than 10% from a recent high; it’s the formal market term for a trend downgrade. Whether chip stocks can stop the bleeding will get its first test with tonight’s earnings report.
The risks are also plain to see. First, the results may not be clear tonight. Seventeen toss-up districts, along with seven key Senate races within the margin of polling error, mean that any close race could leave control of either chamber undecided for days. Uncertainty itself fuels volatility: the Chicago Board Options Exchange Volatility Index, or VIX fear gauge, has already climbed to 21.15. Second, oil prices have just suffered a single-day plunge of 7.6%. U.S. West Texas Intermediate crude closed at $96.46 per barrel and Brent crude at $104.77. If geopolitical developments suddenly shift, the inflation narrative could reverse immediately. Third, Bitcoin has fallen below $77,000 to about $76,800, while CNN’s Fear & Greed Index has dropped to 26, entering fear territory. Risk-asset sentiment may not have found a floor yet.
Election Day isn’t the finish line; it’s the starting point for pricing in policy during the second half of the term. Who controls Congress determines who picks up the bill for AI and whether more tariff bullets will be fired. Tonight’s vote count, alongside AMD’s earnings report, could each bring a surprise—and send us back to the kind of divergence we saw yesterday, with the Dow rising as the Nasdaq fell.
#美股 #U.S. Midterm Elections
Today is Election Day for the U.S. midterms. This election isn’t about choosing a president; it’s about determining whether Trump can still call the shots during the second half of his term. All 435 seats in the House of Representatives are up for election, as are 35 Senate seats, and 36 states are also holding gubernatorial elections. Polls open on November 3 Eastern Time, with results starting to come in from the morning of November 4 Beijing Time.
First, the seat math. A majority in the House requires 218 seats. Republicans currently hold exactly 218, Democrats have 214, and two seats are vacant. That means Republicans have no seats to spare: Democrats need only first reclaim one vacant seat they are expected to win, then flip three Republican-held seats to take control of the House. In the Senate, Republicans hold 53 seats, while Democrats have 45 plus two independents who caucus with them. Democrats need a net gain of four seats to reach a 51-seat majority, making the Senate a much tougher challenge than the House. In its October 23 ratings, the Cook Political Report listed 219 House seats as leaning Democratic, 198 as leaning Republican, and 17 as toss-ups. The October 30 average of generic congressional ballot polls from Silver Bulletin showed Democrats leading by 8.9 percentage points. An October 26 Reuters/Ipsos poll put Trump’s approval rating at 32%. Early voting has already set a midterm-election record: as of the morning of November 2, approximately 54.8 million Americans had voted by mail or in person early, compared with about 45.9 million in the 2022 midterms. Early voting means casting a ballot before Election Day; the higher the number, the more it indicates that both sides have mobilized their core voters.
What really matters to markets about this election isn’t who wins, but how far policy can go afterward. There are three scenarios. First, Democrats retake only the House while Republicans retain the Senate. This is the outcome polls point to as the most likely. Congress would be divided, and the House would likely block most of Trump’s legislative agenda for the second half of his term, including extending tax cuts, escalating tariffs, and deregulation. For markets, this would act as a brake: the fiscal-expansion accelerator would be harder to press, the pace of deficit deterioration would slow, and upward pressure on long-term Treasury yields could ease. But calls for AI regulation, antitrust investigations, and breaking up big tech companies would grow louder, forcing a repricing of policy risk for technology stocks. Second, Republicans hold on to both chambers. This would mean the strongest policy continuity, with AI infrastructure investment, tax cuts, and deregulation continuing to advance. That would be a short-term positive for risk assets, but concerns about a widening fiscal deficit could resurface, potentially weighing on long-term Treasury yields and the dollar. Third, Democrats win both chambers. This is the least likely but most disruptive scenario, signaling a wholesale policy shift for the second half of the term. Tariffs, energy, and tech regulation could all swing in a new direction, and markets would have to revalue a completely different policy mix.
Tonight, markets have to digest two major events, and election results are only one of them. The other is Advanced Micro Devices’ third-quarter earnings, due after the U.S. market closes tonight. The earnings call is scheduled for 5 p.m. Eastern Time, or 6 a.m. on November 4 Beijing Time. Wall Street expects revenue of about $13.09 billion, up approximately 41.6% year over year, and adjusted earnings per share of about $1.95, up roughly 62% from $1.20 in the same period last year. The company’s own guidance is for revenue of around $13 billion, plus or minus $300 million, and a non-GAAP gross margin of about 56%. The stock fell 10.88% in a single session on October 30, closing at $504.80. It has now fallen about 22% from its October 6 high of $649.42. The decline wasn’t driven by AMD’s own numbers, but by Intel’s lowered guidance, which dragged down sentiment across the entire chip sector. The real focus of the earnings report isn’t the third quarter, but whether the fourth-quarter guidance delivers on the shipment pace for Helios rack systems—AMD’s complete AI computing systems sold as whole racks, rather than as individual chips. Meta Platforms has already said that it is testing the installation of its first Helios systems. Yesterday, the Philadelphia Semiconductor Index fell 3.37% in a single session, while the Nasdaq 100 dropped 10% from its October high and entered a technical correction. A technical correction means a decline of more than 10% from a recent high; it’s the formal market term for a trend downgrade. Whether chip stocks can stop the bleeding will get its first test with tonight’s earnings report.
The risks are also plain to see. First, the results may not be clear tonight. Seventeen toss-up districts, along with seven key Senate races within the margin of polling error, mean that any close race could leave control of either chamber undecided for days. Uncertainty itself fuels volatility: the Chicago Board Options Exchange Volatility Index, or VIX fear gauge, has already climbed to 21.15. Second, oil prices have just suffered a single-day plunge of 7.6%. U.S. West Texas Intermediate crude closed at $96.46 per barrel and Brent crude at $104.77. If geopolitical developments suddenly shift, the inflation narrative could reverse immediately. Third, Bitcoin has fallen below $77,000 to about $76,800, while CNN’s Fear & Greed Index has dropped to 26, entering fear territory. Risk-asset sentiment may not have found a floor yet.
Election Day isn’t the finish line; it’s the starting point for pricing in policy during the second half of the term. Who controls Congress determines who picks up the bill for AI and whether more tariff bullets will be fired. Tonight’s vote count, alongside AMD’s earnings report, could each bring a surprise—and send us back to the kind of divergence we saw yesterday, with the Dow rising as the Nasdaq fell.
#美股 #U.S. Midterm Elections
First, the seat math. A majority in the House requires 218 seats. Republicans currently hold exactly 218, Democrats have 214, and two seats are vacant. That means Republicans have no seats to spare: Democrats need only first reclaim one vacant seat they are expected to win, then flip three Republican-held seats to take control of the House. In the Senate, Republicans hold 53 seats, while Democrats have 45 plus two independents who caucus with them. Democrats need a net gain of four seats to reach a 51-seat majority, making the Senate a much tougher challenge than the House. In its October 23 ratings, the Cook Political Report listed 219 House seats as leaning Democratic, 198 as leaning Republican, and 17 as toss-ups. The October 30 average of generic congressional ballot polls from Silver Bulletin showed Democrats leading by 8.9 percentage points. An October 26 Reuters/Ipsos poll put Trump’s approval rating at 32%. Early voting has already set a midterm-election record: as of the morning of November 2, approximately 54.8 million Americans had voted by mail or in person early, compared with about 45.9 million in the 2022 midterms. Early voting means casting a ballot before Election Day; the higher the number, the more it indicates that both sides have mobilized their core voters.
What really matters to markets about this election isn’t who wins, but how far policy can go afterward. There are three scenarios. First, Democrats retake only the House while Republicans retain the Senate. This is the outcome polls point to as the most likely. Congress would be divided, and the House would likely block most of Trump’s legislative agenda for the second half of his term, including extending tax cuts, escalating tariffs, and deregulation. For markets, this would act as a brake: the fiscal-expansion accelerator would be harder to press, the pace of deficit deterioration would slow, and upward pressure on long-term Treasury yields could ease. But calls for AI regulation, antitrust investigations, and breaking up big tech companies would grow louder, forcing a repricing of policy risk for technology stocks. Second, Republicans hold on to both chambers. This would mean the strongest policy continuity, with AI infrastructure investment, tax cuts, and deregulation continuing to advance. That would be a short-term positive for risk assets, but concerns about a widening fiscal deficit could resurface, potentially weighing on long-term Treasury yields and the dollar. Third, Democrats win both chambers. This is the least likely but most disruptive scenario, signaling a wholesale policy shift for the second half of the term. Tariffs, energy, and tech regulation could all swing in a new direction, and markets would have to revalue a completely different policy mix.
Tonight, markets have to digest two major events, and election results are only one of them. The other is Advanced Micro Devices’ third-quarter earnings, due after the U.S. market closes tonight. The earnings call is scheduled for 5 p.m. Eastern Time, or 6 a.m. on November 4 Beijing Time. Wall Street expects revenue of about $13.09 billion, up approximately 41.6% year over year, and adjusted earnings per share of about $1.95, up roughly 62% from $1.20 in the same period last year. The company’s own guidance is for revenue of around $13 billion, plus or minus $300 million, and a non-GAAP gross margin of about 56%. The stock fell 10.88% in a single session on October 30, closing at $504.80. It has now fallen about 22% from its October 6 high of $649.42. The decline wasn’t driven by AMD’s own numbers, but by Intel’s lowered guidance, which dragged down sentiment across the entire chip sector. The real focus of the earnings report isn’t the third quarter, but whether the fourth-quarter guidance delivers on the shipment pace for Helios rack systems—AMD’s complete AI computing systems sold as whole racks, rather than as individual chips. Meta Platforms has already said that it is testing the installation of its first Helios systems. Yesterday, the Philadelphia Semiconductor Index fell 3.37% in a single session, while the Nasdaq 100 dropped 10% from its October high and entered a technical correction. A technical correction means a decline of more than 10% from a recent high; it’s the formal market term for a trend downgrade. Whether chip stocks can stop the bleeding will get its first test with tonight’s earnings report.
The risks are also plain to see. First, the results may not be clear tonight. Seventeen toss-up districts, along with seven key Senate races within the margin of polling error, mean that any close race could leave control of either chamber undecided for days. Uncertainty itself fuels volatility: the Chicago Board Options Exchange Volatility Index, or VIX fear gauge, has already climbed to 21.15. Second, oil prices have just suffered a single-day plunge of 7.6%. U.S. West Texas Intermediate crude closed at $96.46 per barrel and Brent crude at $104.77. If geopolitical developments suddenly shift, the inflation narrative could reverse immediately. Third, Bitcoin has fallen below $77,000 to about $76,800, while CNN’s Fear & Greed Index has dropped to 26, entering fear territory. Risk-asset sentiment may not have found a floor yet.
Election Day isn’t the finish line; it’s the starting point for pricing in policy during the second half of the term. Who controls Congress determines who picks up the bill for AI and whether more tariff bullets will be fired. Tonight’s vote count, alongside AMD’s earnings report, could each bring a surprise—and send us back to the kind of divergence we saw yesterday, with the Dow rising as the Nasdaq fell.
#美股 #U.S. Midterm Elections
342
·
--
Oil prices plunged 7.6% overnight, yet U.S. stocks delivered a tale of two extremes—the divergence last night is more worth watching than the gains and losses themselves.
First, the facts. At the close on November 2: the Dow Jones Industrial Average rose 0.41% to 51,983.98; the S&P 500 fell 0.51% to 7,541.40; the Nasdaq Composite fell 1.07% to 25,164.32; and the Nasdaq 100 fell 1.4%. On the same day, Brent crude futures fell 7.63% to $104.77 per barrel, while U.S. West Texas Intermediate crude futures fell 7.36% to $96.46 per barrel. A one-day oil price drop of more than 7% is rare this year.
The trigger was a signal of easing geopolitical tensions: reports that the United States and Iran were seeking a diplomatic solution gained momentum. On Monday, President Trump expressed doubts about resuming military strikes, signaling that negotiations could yield an agreement. As the geopolitical risk premium eased, oil prices plunged.
The effects traveled along three lines, all pointing to the same conclusion: the market isn’t afraid the economy will falter right now; it’s afraid of who will pay the bill for artificial intelligence.
First, oil prices fell and cyclical stocks rose. The plunge in oil prices directly eased inflationary pressure. Seven of the S&P 500’s 11 sectors rose, with consumer discretionary stocks gaining 2.25% and materials up 1.83%. The Dow Jones Industrial Average also closed higher. There was just one exception: the energy sector fell 4%. Lower oil prices benefit oil users but hurt oil sellers, and oil companies’ profit expectations shrank along with prices.
Second, tech stocks kept falling. Lower oil prices should have been a market-wide positive: cooling inflation means more room for interest rate cuts. But investors were willing to buy only cheaper old-economy stocks, not take on the cash-burning new economy. The Philadelphia Semiconductor Index fell 3.37% in a single day. The Nasdaq Composite was already down 5.3% in October, and the Nasdaq 100 entered a technical correction—meaning it has fallen more than 10% from a recent high, the market’s formal way of saying the trend has been downgraded. NVIDIA and Meta Platforms each fell about 1%. Oracle announced $20 billion in financing to expand its AI and cloud businesses, and its stock fell 8.8%. The market has run out of patience with the story of burning cash to fuel growth. In after-hours trading, Apple reported better-than-expected earnings. Strong early demand for the iPhone 18 Pro lineup and higher prices offset rising memory chip costs, giving tech stocks a brief reprieve—but one breath of relief can’t save an entire sector.
Third, crypto assets moved in step with other risk assets. Bitcoin fell below $77,000 to around $76,800, down about 2% over 24 hours; Ethereum was around $2,250, down 1.7%. CNN’s Fear & Greed Index fell to 26, entering the fear zone, down from 37 the previous day. On October 30, U.S. spot Bitcoin ETFs saw net outflows of $643 million in a single day, their largest since June. Across the market, $366 million in positions were liquidated over 24 hours, affecting 93,000 traders. Bitcoin has fallen 9.5% over the past 30 days and is down about 39% from its all-time high of $126,080, extending its decline to four straight weeks. Institutional money is flowing out, while retail traders’ leveraged positions are being liquidated. This isn’t a signal to buy the dip—it’s a sign that sentiment may still be heading lower.
Taken together, last night’s market action really said just one thing: the positive news came from oil prices, while the negative news came from AI capital spending. And investors’ verdict was clear: they would rather buy the old economy, even if it can’t rally, than take a chance on the new economy, which is still selling a story. Once this kind of divergence takes hold, it’s hard to reverse in the short term with just one or two news items.
Looking ahead, there are three hurdles this week, and any one of them coming in above expectations could reverse the divergence. First, today is U.S. midterm election day. The results will determine control of Congress and directly affect the direction of AI regulation, banking regulation, and crypto policy. Second, Advanced Micro Devices reports after the market closes tonight, providing the next test for the AI hardware supply chain. Its results will directly determine whether chip stocks stabilize or fall for another round. Third, the October nonfarm payrolls report comes out Friday. With oil prices down and inflation expectations easing, employment data will determine how much room the Federal Reserve has to act next.
The risks are also plain to see. The Cboe Volatility Index, or VIX fear gauge, rose 8.91% to 21.15. Volatility is picking up, signaling widening disagreement about the market’s outlook. Oil prices can rise as quickly as they fell; if geopolitical news turns, the dynamics for energy and inflation could reverse immediately. Bitcoin’s $76,000 level is near-term support. If it fails to hold, the next level to watch is the buying support around $75,000.
Oil prices fell 7.6%, temporarily easing the inflation alarm, but no one has picked up the AI bill yet. Until AMD’s earnings and Friday’s nonfarm payrolls report are out, divergence remains the main theme—and chasing rallies or selling into dips could leave investors hurt on both sides.
#美股 #Crude Oil
Oil prices plunged 7.6% overnight, yet U.S. stocks delivered a tale of two extremes—the divergence last night is more worth watching than the gains and losses themselves.
First, the facts. At the close on November 2: the Dow Jones Industrial Average rose 0.41% to 51,983.98; the S&P 500 fell 0.51% to 7,541.40; the Nasdaq Composite fell 1.07% to 25,164.32; and the Nasdaq 100 fell 1.4%. On the same day, Brent crude futures fell 7.63% to $104.77 per barrel, while U.S. West Texas Intermediate crude futures fell 7.36% to $96.46 per barrel. A one-day oil price drop of more than 7% is rare this year.
The trigger was a signal of easing geopolitical tensions: reports that the United States and Iran were seeking a diplomatic solution gained momentum. On Monday, President Trump expressed doubts about resuming military strikes, signaling that negotiations could yield an agreement. As the geopolitical risk premium eased, oil prices plunged.
The effects traveled along three lines, all pointing to the same conclusion: the market isn’t afraid the economy will falter right now; it’s afraid of who will pay the bill for artificial intelligence.
First, oil prices fell and cyclical stocks rose. The plunge in oil prices directly eased inflationary pressure. Seven of the S&P 500’s 11 sectors rose, with consumer discretionary stocks gaining 2.25% and materials up 1.83%. The Dow Jones Industrial Average also closed higher. There was just one exception: the energy sector fell 4%. Lower oil prices benefit oil users but hurt oil sellers, and oil companies’ profit expectations shrank along with prices.
Second, tech stocks kept falling. Lower oil prices should have been a market-wide positive: cooling inflation means more room for interest rate cuts. But investors were willing to buy only cheaper old-economy stocks, not take on the cash-burning new economy. The Philadelphia Semiconductor Index fell 3.37% in a single day. The Nasdaq Composite was already down 5.3% in October, and the Nasdaq 100 entered a technical correction—meaning it has fallen more than 10% from a recent high, the market’s formal way of saying the trend has been downgraded. NVIDIA and Meta Platforms each fell about 1%. Oracle announced $20 billion in financing to expand its AI and cloud businesses, and its stock fell 8.8%. The market has run out of patience with the story of burning cash to fuel growth. In after-hours trading, Apple reported better-than-expected earnings. Strong early demand for the iPhone 18 Pro lineup and higher prices offset rising memory chip costs, giving tech stocks a brief reprieve—but one breath of relief can’t save an entire sector.
Third, crypto assets moved in step with other risk assets. Bitcoin fell below $77,000 to around $76,800, down about 2% over 24 hours; Ethereum was around $2,250, down 1.7%. CNN’s Fear & Greed Index fell to 26, entering the fear zone, down from 37 the previous day. On October 30, U.S. spot Bitcoin ETFs saw net outflows of $643 million in a single day, their largest since June. Across the market, $366 million in positions were liquidated over 24 hours, affecting 93,000 traders. Bitcoin has fallen 9.5% over the past 30 days and is down about 39% from its all-time high of $126,080, extending its decline to four straight weeks. Institutional money is flowing out, while retail traders’ leveraged positions are being liquidated. This isn’t a signal to buy the dip—it’s a sign that sentiment may still be heading lower.
Taken together, last night’s market action really said just one thing: the positive news came from oil prices, while the negative news came from AI capital spending. And investors’ verdict was clear: they would rather buy the old economy, even if it can’t rally, than take a chance on the new economy, which is still selling a story. Once this kind of divergence takes hold, it’s hard to reverse in the short term with just one or two news items.
Looking ahead, there are three hurdles this week, and any one of them coming in above expectations could reverse the divergence. First, today is U.S. midterm election day. The results will determine control of Congress and directly affect the direction of AI regulation, banking regulation, and crypto policy. Second, Advanced Micro Devices reports after the market closes tonight, providing the next test for the AI hardware supply chain. Its results will directly determine whether chip stocks stabilize or fall for another round. Third, the October nonfarm payrolls report comes out Friday. With oil prices down and inflation expectations easing, employment data will determine how much room the Federal Reserve has to act next.
The risks are also plain to see. The Cboe Volatility Index, or VIX fear gauge, rose 8.91% to 21.15. Volatility is picking up, signaling widening disagreement about the market’s outlook. Oil prices can rise as quickly as they fell; if geopolitical news turns, the dynamics for energy and inflation could reverse immediately. Bitcoin’s $76,000 level is near-term support. If it fails to hold, the next level to watch is the buying support around $75,000.
Oil prices fell 7.6%, temporarily easing the inflation alarm, but no one has picked up the AI bill yet. Until AMD’s earnings and Friday’s nonfarm payrolls report are out, divergence remains the main theme—and chasing rallies or selling into dips could leave investors hurt on both sides.
#美股 #Crude Oil
First, the facts. At the close on November 2: the Dow Jones Industrial Average rose 0.41% to 51,983.98; the S&P 500 fell 0.51% to 7,541.40; the Nasdaq Composite fell 1.07% to 25,164.32; and the Nasdaq 100 fell 1.4%. On the same day, Brent crude futures fell 7.63% to $104.77 per barrel, while U.S. West Texas Intermediate crude futures fell 7.36% to $96.46 per barrel. A one-day oil price drop of more than 7% is rare this year.
The trigger was a signal of easing geopolitical tensions: reports that the United States and Iran were seeking a diplomatic solution gained momentum. On Monday, President Trump expressed doubts about resuming military strikes, signaling that negotiations could yield an agreement. As the geopolitical risk premium eased, oil prices plunged.
The effects traveled along three lines, all pointing to the same conclusion: the market isn’t afraid the economy will falter right now; it’s afraid of who will pay the bill for artificial intelligence.
First, oil prices fell and cyclical stocks rose. The plunge in oil prices directly eased inflationary pressure. Seven of the S&P 500’s 11 sectors rose, with consumer discretionary stocks gaining 2.25% and materials up 1.83%. The Dow Jones Industrial Average also closed higher. There was just one exception: the energy sector fell 4%. Lower oil prices benefit oil users but hurt oil sellers, and oil companies’ profit expectations shrank along with prices.
Second, tech stocks kept falling. Lower oil prices should have been a market-wide positive: cooling inflation means more room for interest rate cuts. But investors were willing to buy only cheaper old-economy stocks, not take on the cash-burning new economy. The Philadelphia Semiconductor Index fell 3.37% in a single day. The Nasdaq Composite was already down 5.3% in October, and the Nasdaq 100 entered a technical correction—meaning it has fallen more than 10% from a recent high, the market’s formal way of saying the trend has been downgraded. NVIDIA and Meta Platforms each fell about 1%. Oracle announced $20 billion in financing to expand its AI and cloud businesses, and its stock fell 8.8%. The market has run out of patience with the story of burning cash to fuel growth. In after-hours trading, Apple reported better-than-expected earnings. Strong early demand for the iPhone 18 Pro lineup and higher prices offset rising memory chip costs, giving tech stocks a brief reprieve—but one breath of relief can’t save an entire sector.
Third, crypto assets moved in step with other risk assets. Bitcoin fell below $77,000 to around $76,800, down about 2% over 24 hours; Ethereum was around $2,250, down 1.7%. CNN’s Fear & Greed Index fell to 26, entering the fear zone, down from 37 the previous day. On October 30, U.S. spot Bitcoin ETFs saw net outflows of $643 million in a single day, their largest since June. Across the market, $366 million in positions were liquidated over 24 hours, affecting 93,000 traders. Bitcoin has fallen 9.5% over the past 30 days and is down about 39% from its all-time high of $126,080, extending its decline to four straight weeks. Institutional money is flowing out, while retail traders’ leveraged positions are being liquidated. This isn’t a signal to buy the dip—it’s a sign that sentiment may still be heading lower.
Taken together, last night’s market action really said just one thing: the positive news came from oil prices, while the negative news came from AI capital spending. And investors’ verdict was clear: they would rather buy the old economy, even if it can’t rally, than take a chance on the new economy, which is still selling a story. Once this kind of divergence takes hold, it’s hard to reverse in the short term with just one or two news items.
Looking ahead, there are three hurdles this week, and any one of them coming in above expectations could reverse the divergence. First, today is U.S. midterm election day. The results will determine control of Congress and directly affect the direction of AI regulation, banking regulation, and crypto policy. Second, Advanced Micro Devices reports after the market closes tonight, providing the next test for the AI hardware supply chain. Its results will directly determine whether chip stocks stabilize or fall for another round. Third, the October nonfarm payrolls report comes out Friday. With oil prices down and inflation expectations easing, employment data will determine how much room the Federal Reserve has to act next.
The risks are also plain to see. The Cboe Volatility Index, or VIX fear gauge, rose 8.91% to 21.15. Volatility is picking up, signaling widening disagreement about the market’s outlook. Oil prices can rise as quickly as they fell; if geopolitical news turns, the dynamics for energy and inflation could reverse immediately. Bitcoin’s $76,000 level is near-term support. If it fails to hold, the next level to watch is the buying support around $75,000.
Oil prices fell 7.6%, temporarily easing the inflation alarm, but no one has picked up the AI bill yet. Until AMD’s earnings and Friday’s nonfarm payrolls report are out, divergence remains the main theme—and chasing rallies or selling into dips could leave investors hurt on both sides.
#美股 #Crude Oil
297
·
--
Nvidia has fallen below its 200-day moving average, and the $200 mark has been tested twice in four days—the AI leader is being repriced by the market.
First, the numbers. Nvidia closed at $202.06 on November 2, down 1.26%, after hitting an intraday low of $201.66. Volume was 119 million shares, about 17% above the average for the past 20 trading days. This is not just a one-day fluctuation: the stock is down 6.45% over five trading days and 13.63% over a month, and has retreated 16.97% from its 52-week high of $243.37 on October 6. On the same day, the Philadelphia Semiconductor Index fell 3.37%, the technology sector declined for a third consecutive day, and the Nasdaq Composite fell 1.07%.
The catalyst was a report from Melius Research: on November 2, it cut its price target for Nvidia from $420 to $315, a 25% reduction, while maintaining its Buy rating. A price target is an analyst's estimate of what a stock will be worth over the next 12 months. Cutting the target without changing the Buy rating is essentially saying, “We still like it long term, but it's too expensive in the short term.” The reason for the cut is not Nvidia itself, but the buyers footing the bill: AI infrastructure costs are ballooning, and at least five companies with market caps above $1 trillion need to raise hundreds of billions of dollars to sustain their expansion plans. Reuters also reported last week that Nvidia is in talks to provide Nscale, a data center operator, with billions of dollars in credit guarantees to help it issue bonds and build data centers. No agreement has been signed yet, but the signal is clear: even the industry leader is stepping in to inject capital into its supply chain. On the same day, Apple reclaimed the top spot globally from Nvidia, with a market cap of $5.03 trillion versus Nvidia's roughly $4.93 trillion.
Technically, the stock is now showing a textbook weak structure. It has fallen below its 20-day moving average of $219.62, its 50-day moving average of $221.50, and its 200-day moving average of about $204.40. A moving average is the average cost basis represented by closing prices over a given period. Falling below it means most recent buyers are underwater, creating overhead selling pressure as they look to break even. The 200-day moving average is a long-term cost-basis line often seen as the dividing line between bull and bear markets; November 2 was the first close below it in this correction. The Relative Strength Index is just 26.9. Known as the RSI, it measures the strength of short-term buying and selling pressure; below 30 is considered oversold, and above 70 overbought. A reading of 26.9 indicates bears are in control and the stock may have fallen a bit too far in the short term. The MACD is at -4.46 and has formed a bearish crossover, with a histogram reading of -1.83; momentum is still moving lower. A descending trendline drawn from the October 6 high of $243.37 to the October 21 high of $222.19 is now overhead, and each time the stock bounces up to it, it gets knocked back down.
But there is one detail worth watching amid the weakness: the $200 mark has held twice in four days. The intraday low was $200.92 on October 30 and $201.66 on November 2. The stock tested the level twice and recovered both times, closing above $200 on both occasions. Testing the same price twice and recovering each time is technically called a potential double bottom, evidence that bears have twice tried and failed to break through. Of course, a potential pattern is only a potential pattern; until the closing price gets back above the 200-day moving average, it cannot be considered a bottom.
There are just two key levels to watch: support is first at $200.92, then at the round-number $200 mark. If the stock closes below $200, the next technical level to watch is around $190, near the July 29 low of $190.01. Resistance is first at the 200-day moving average, around $204.40. A move back above it would signal that the short-term bleeding has stopped. The first rebound targets are the 50-day moving average at $221.50 and the October 21 high of $222.19. A move above $222 would finally loosen the grip of the descending trendline.
Looking ahead, the real test comes after the market close on November 17, when Nvidia reports its third-quarter fiscal 2027 results. The company's own revenue guidance is about $108 billion, plus or minus 2%, while the market expects roughly $109 billion. Before the earnings report, the stock is likely to keep grinding around in the $200–$222 range: if it holds $200, an oversold bounce could come at any time, with the first target above $204. On the other hand, if $200 gives way—and Advanced Micro Devices reports weaker-than-expected results after the close tonight—selling pressure across the chip sector could spread again, and $190 would be no idle threat. Wall Street as a whole has not turned against the stock: 49 Buy ratings, 5 Strong Buy ratings, and only 1 Hold, with an average price target of about $319, nearly 60% above the current price. Even Melius Research's revised target of $315 is still more than 50% above the current price. The disagreement is not about whether the stock is worth owning, but about when it will stop falling.
The risks are also clear. Today is Election Day for the U.S. midterm elections, adding another layer of potential after-hours news. An oversold RSI does not mean a rebound is imminent; a stock can become even more oversold. If it closes below $200, stop-loss selling could accelerate. More importantly, whether AI capital spending can continue is the crucial question for the entire sector. What Melius Research is really asking in its report is, “Who will pay the bill?” There will be no answer to that question before the November 17 earnings report. Buying Nvidia around $200 is a bet that demand has not deteriorated; if that bet is wrong, the cost could be another steep selloff.
Technical analysis is for reference only and does not constitute investment advice.
#英伟达 #USStocks
Nvidia has fallen below its 200-day moving average, and the $200 mark has been tested twice in four days—the AI leader is being repriced by the market.
First, the numbers. Nvidia closed at $202.06 on November 2, down 1.26%, after hitting an intraday low of $201.66. Volume was 119 million shares, about 17% above the average for the past 20 trading days. This is not just a one-day fluctuation: the stock is down 6.45% over five trading days and 13.63% over a month, and has retreated 16.97% from its 52-week high of $243.37 on October 6. On the same day, the Philadelphia Semiconductor Index fell 3.37%, the technology sector declined for a third consecutive day, and the Nasdaq Composite fell 1.07%.
The catalyst was a report from Melius Research: on November 2, it cut its price target for Nvidia from $420 to $315, a 25% reduction, while maintaining its Buy rating. A price target is an analyst's estimate of what a stock will be worth over the next 12 months. Cutting the target without changing the Buy rating is essentially saying, “We still like it long term, but it's too expensive in the short term.” The reason for the cut is not Nvidia itself, but the buyers footing the bill: AI infrastructure costs are ballooning, and at least five companies with market caps above $1 trillion need to raise hundreds of billions of dollars to sustain their expansion plans. Reuters also reported last week that Nvidia is in talks to provide Nscale, a data center operator, with billions of dollars in credit guarantees to help it issue bonds and build data centers. No agreement has been signed yet, but the signal is clear: even the industry leader is stepping in to inject capital into its supply chain. On the same day, Apple reclaimed the top spot globally from Nvidia, with a market cap of $5.03 trillion versus Nvidia's roughly $4.93 trillion.
Technically, the stock is now showing a textbook weak structure. It has fallen below its 20-day moving average of $219.62, its 50-day moving average of $221.50, and its 200-day moving average of about $204.40. A moving average is the average cost basis represented by closing prices over a given period. Falling below it means most recent buyers are underwater, creating overhead selling pressure as they look to break even. The 200-day moving average is a long-term cost-basis line often seen as the dividing line between bull and bear markets; November 2 was the first close below it in this correction. The Relative Strength Index is just 26.9. Known as the RSI, it measures the strength of short-term buying and selling pressure; below 30 is considered oversold, and above 70 overbought. A reading of 26.9 indicates bears are in control and the stock may have fallen a bit too far in the short term. The MACD is at -4.46 and has formed a bearish crossover, with a histogram reading of -1.83; momentum is still moving lower. A descending trendline drawn from the October 6 high of $243.37 to the October 21 high of $222.19 is now overhead, and each time the stock bounces up to it, it gets knocked back down.
But there is one detail worth watching amid the weakness: the $200 mark has held twice in four days. The intraday low was $200.92 on October 30 and $201.66 on November 2. The stock tested the level twice and recovered both times, closing above $200 on both occasions. Testing the same price twice and recovering each time is technically called a potential double bottom, evidence that bears have twice tried and failed to break through. Of course, a potential pattern is only a potential pattern; until the closing price gets back above the 200-day moving average, it cannot be considered a bottom.
There are just two key levels to watch: support is first at $200.92, then at the round-number $200 mark. If the stock closes below $200, the next technical level to watch is around $190, near the July 29 low of $190.01. Resistance is first at the 200-day moving average, around $204.40. A move back above it would signal that the short-term bleeding has stopped. The first rebound targets are the 50-day moving average at $221.50 and the October 21 high of $222.19. A move above $222 would finally loosen the grip of the descending trendline.
Looking ahead, the real test comes after the market close on November 17, when Nvidia reports its third-quarter fiscal 2027 results. The company's own revenue guidance is about $108 billion, plus or minus 2%, while the market expects roughly $109 billion. Before the earnings report, the stock is likely to keep grinding around in the $200–$222 range: if it holds $200, an oversold bounce could come at any time, with the first target above $204. On the other hand, if $200 gives way—and Advanced Micro Devices reports weaker-than-expected results after the close tonight—selling pressure across the chip sector could spread again, and $190 would be no idle threat. Wall Street as a whole has not turned against the stock: 49 Buy ratings, 5 Strong Buy ratings, and only 1 Hold, with an average price target of about $319, nearly 60% above the current price. Even Melius Research's revised target of $315 is still more than 50% above the current price. The disagreement is not about whether the stock is worth owning, but about when it will stop falling.
The risks are also clear. Today is Election Day for the U.S. midterm elections, adding another layer of potential after-hours news. An oversold RSI does not mean a rebound is imminent; a stock can become even more oversold. If it closes below $200, stop-loss selling could accelerate. More importantly, whether AI capital spending can continue is the crucial question for the entire sector. What Melius Research is really asking in its report is, “Who will pay the bill?” There will be no answer to that question before the November 17 earnings report. Buying Nvidia around $200 is a bet that demand has not deteriorated; if that bet is wrong, the cost could be another steep selloff.
Technical analysis is for reference only and does not constitute investment advice.
#英伟达 #USStocks
First, the numbers. Nvidia closed at $202.06 on November 2, down 1.26%, after hitting an intraday low of $201.66. Volume was 119 million shares, about 17% above the average for the past 20 trading days. This is not just a one-day fluctuation: the stock is down 6.45% over five trading days and 13.63% over a month, and has retreated 16.97% from its 52-week high of $243.37 on October 6. On the same day, the Philadelphia Semiconductor Index fell 3.37%, the technology sector declined for a third consecutive day, and the Nasdaq Composite fell 1.07%.
The catalyst was a report from Melius Research: on November 2, it cut its price target for Nvidia from $420 to $315, a 25% reduction, while maintaining its Buy rating. A price target is an analyst's estimate of what a stock will be worth over the next 12 months. Cutting the target without changing the Buy rating is essentially saying, “We still like it long term, but it's too expensive in the short term.” The reason for the cut is not Nvidia itself, but the buyers footing the bill: AI infrastructure costs are ballooning, and at least five companies with market caps above $1 trillion need to raise hundreds of billions of dollars to sustain their expansion plans. Reuters also reported last week that Nvidia is in talks to provide Nscale, a data center operator, with billions of dollars in credit guarantees to help it issue bonds and build data centers. No agreement has been signed yet, but the signal is clear: even the industry leader is stepping in to inject capital into its supply chain. On the same day, Apple reclaimed the top spot globally from Nvidia, with a market cap of $5.03 trillion versus Nvidia's roughly $4.93 trillion.
Technically, the stock is now showing a textbook weak structure. It has fallen below its 20-day moving average of $219.62, its 50-day moving average of $221.50, and its 200-day moving average of about $204.40. A moving average is the average cost basis represented by closing prices over a given period. Falling below it means most recent buyers are underwater, creating overhead selling pressure as they look to break even. The 200-day moving average is a long-term cost-basis line often seen as the dividing line between bull and bear markets; November 2 was the first close below it in this correction. The Relative Strength Index is just 26.9. Known as the RSI, it measures the strength of short-term buying and selling pressure; below 30 is considered oversold, and above 70 overbought. A reading of 26.9 indicates bears are in control and the stock may have fallen a bit too far in the short term. The MACD is at -4.46 and has formed a bearish crossover, with a histogram reading of -1.83; momentum is still moving lower. A descending trendline drawn from the October 6 high of $243.37 to the October 21 high of $222.19 is now overhead, and each time the stock bounces up to it, it gets knocked back down.
But there is one detail worth watching amid the weakness: the $200 mark has held twice in four days. The intraday low was $200.92 on October 30 and $201.66 on November 2. The stock tested the level twice and recovered both times, closing above $200 on both occasions. Testing the same price twice and recovering each time is technically called a potential double bottom, evidence that bears have twice tried and failed to break through. Of course, a potential pattern is only a potential pattern; until the closing price gets back above the 200-day moving average, it cannot be considered a bottom.
There are just two key levels to watch: support is first at $200.92, then at the round-number $200 mark. If the stock closes below $200, the next technical level to watch is around $190, near the July 29 low of $190.01. Resistance is first at the 200-day moving average, around $204.40. A move back above it would signal that the short-term bleeding has stopped. The first rebound targets are the 50-day moving average at $221.50 and the October 21 high of $222.19. A move above $222 would finally loosen the grip of the descending trendline.
Looking ahead, the real test comes after the market close on November 17, when Nvidia reports its third-quarter fiscal 2027 results. The company's own revenue guidance is about $108 billion, plus or minus 2%, while the market expects roughly $109 billion. Before the earnings report, the stock is likely to keep grinding around in the $200–$222 range: if it holds $200, an oversold bounce could come at any time, with the first target above $204. On the other hand, if $200 gives way—and Advanced Micro Devices reports weaker-than-expected results after the close tonight—selling pressure across the chip sector could spread again, and $190 would be no idle threat. Wall Street as a whole has not turned against the stock: 49 Buy ratings, 5 Strong Buy ratings, and only 1 Hold, with an average price target of about $319, nearly 60% above the current price. Even Melius Research's revised target of $315 is still more than 50% above the current price. The disagreement is not about whether the stock is worth owning, but about when it will stop falling.
The risks are also clear. Today is Election Day for the U.S. midterm elections, adding another layer of potential after-hours news. An oversold RSI does not mean a rebound is imminent; a stock can become even more oversold. If it closes below $200, stop-loss selling could accelerate. More importantly, whether AI capital spending can continue is the crucial question for the entire sector. What Melius Research is really asking in its report is, “Who will pay the bill?” There will be no answer to that question before the November 17 earnings report. Buying Nvidia around $200 is a bet that demand has not deteriorated; if that bet is wrong, the cost could be another steep selloff.
Technical analysis is for reference only and does not constitute investment advice.
#英伟达 #USStocks
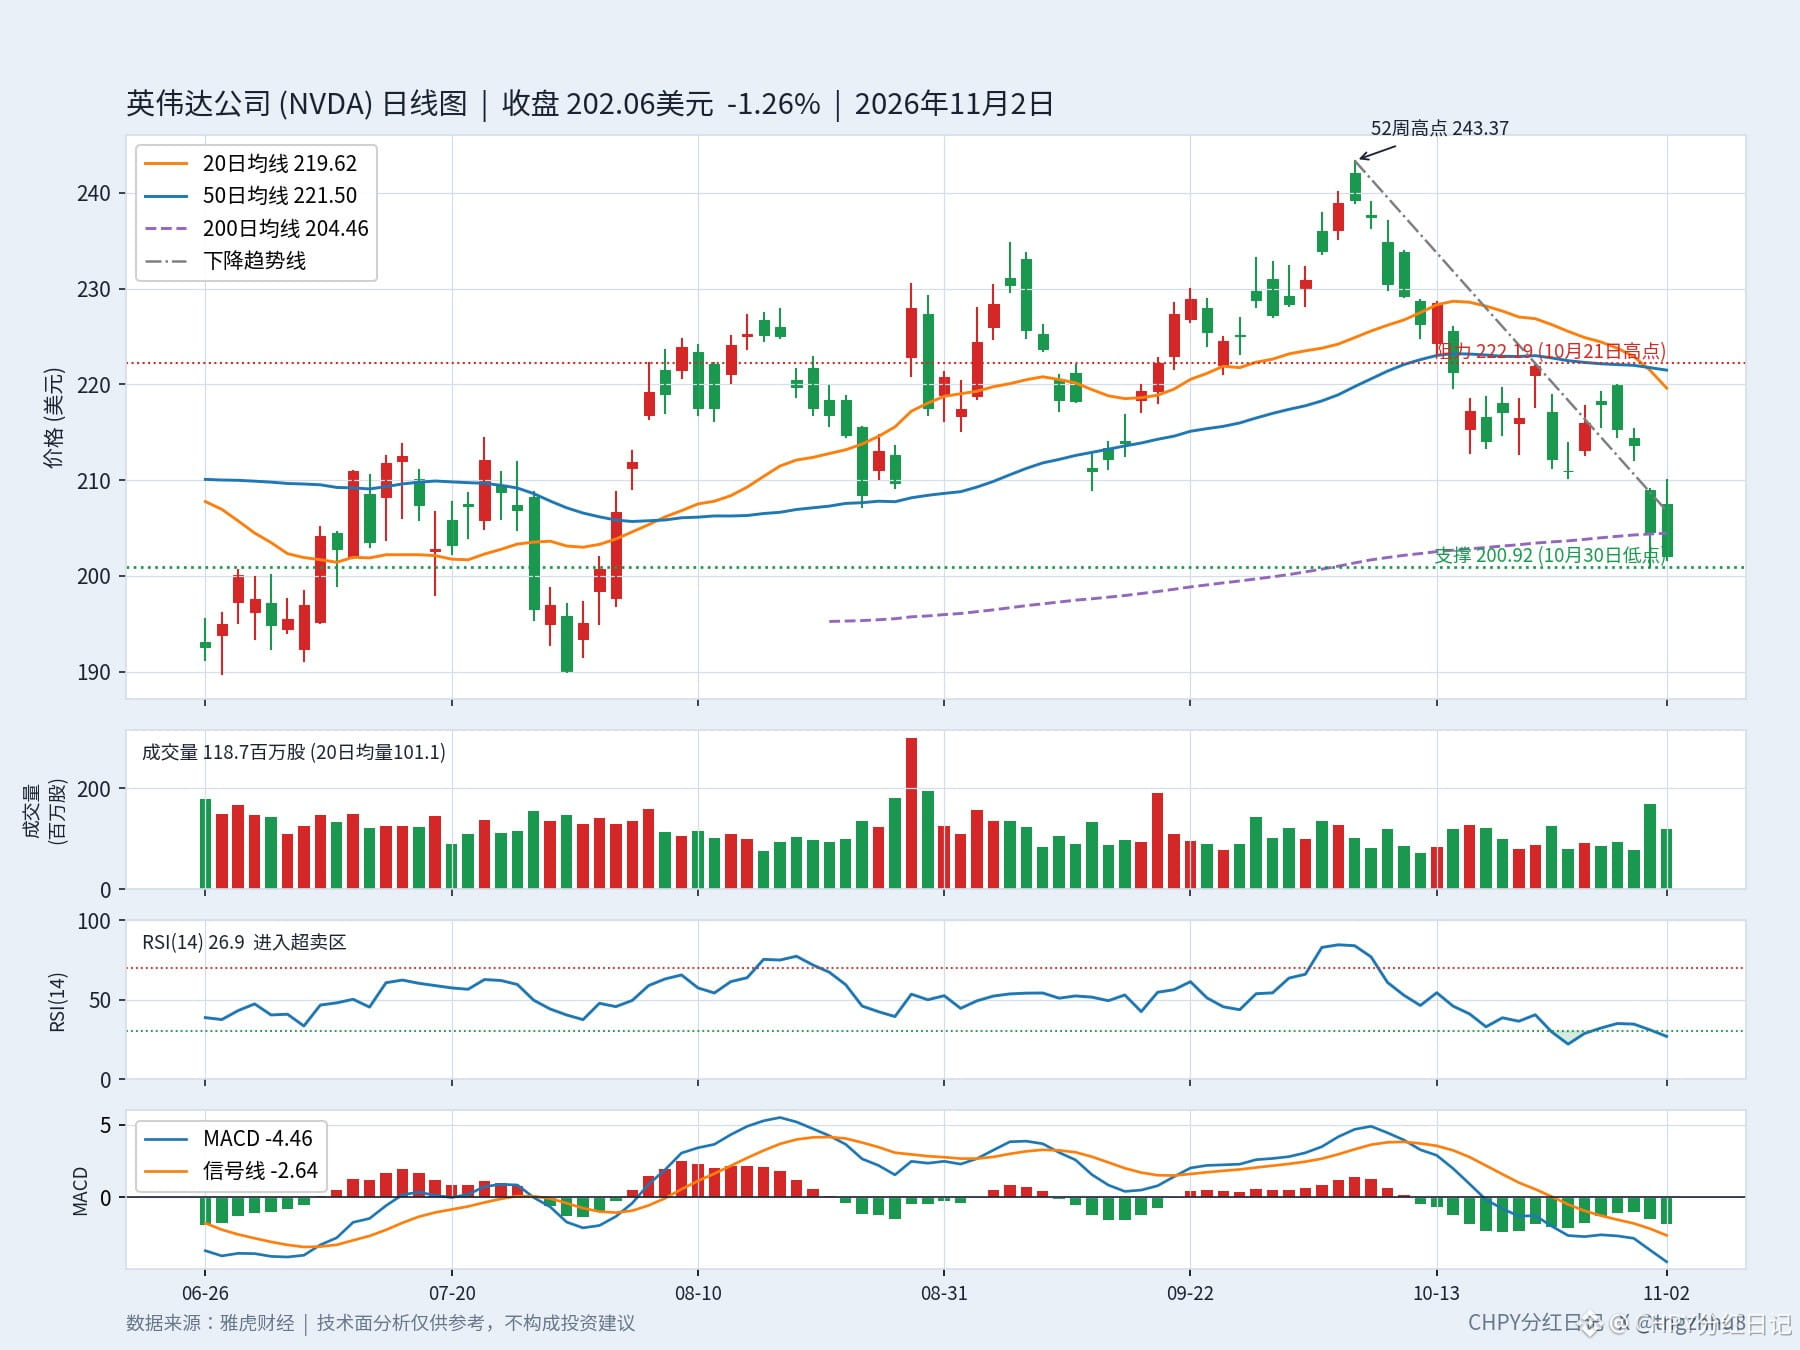
35
·
--
A $115 billion acquisition, and both buyer and seller get punished—Marvell Technology’s deal to acquire Lumentum is teaching the AI boom a lesson in valuation.
First, the deal itself. On November 2, Marvell Technology announced an all-stock acquisition of optical-components maker Lumentum, at an enterprise value of $115 billion: $1,132 per share, a 23.9% premium over the October 28 closing price, with each Lumentum share exchanged for 4.5 Marvell shares. After the deal closes, existing Marvell Technology shareholders are expected to own about 67% of the combined company, and Lumentum shareholders about 33%. The transaction is expected to close in the first half of 2028. An all-stock deal means the buyer pays with its own shares instead of cash, with the existing Marvell Technology shareholders’ ownership diluted by about a third as a result.
The market’s reaction that day was an emphatic rejection: Marvell Technology fell 12.7%, Lumentum fell 18.6%, and the Philadelphia Semiconductor Index followed with a 3.37% drop. What stings even more is that Lumentum’s earnings report, released the same day, was actually impressive: adjusted earnings per share of $4.57 and revenue of $1.26 billion last quarter, versus just $1.10 and $533.8 million in the same quarter last year—more than doubling. Earnings more than doubled, yet the stock fell. That shows the market isn’t questioning today’s business, but the price of the deal: based on core operating profit over the next 12 months, Lumentum is valued at about 33 times earnings, compared with an industry median of only around 16 times—more than twice as expensive.
Why does Marvell Technology have to buy it? Put simply: in AI data centers, thousands of chips need to exchange data around the clock. Copper cables are no longer fast enough or capable of reaching far enough, and optical connections are replacing copper as the new bottleneck in the entire AI supply chain. Marvell Technology has custom chips, network switching, and interconnect technology; Lumentum has lasers, optical transceiver modules, and optical circuit switching—which uses optical signals to “reroute” data directly, making it faster and more energy-efficient than electrical signals. Together, they aim to control the entire path of AI signals, from chips to racks, targeting a $550 billion market. Earlier this year, Nvidia invested $2 billion in each company, effectively taking sides in advance. The combined company is expected to generate more than $21 billion in annual revenue, with an adjusted operating margin of around 40%, as well as over $1 billion in annual cost synergies.
But the bill won’t come due until 2028, and the uncertainties in the meantime are formidable. First, the acquisition is being made at a cyclical peak valuation. A 33-times multiple assumes AI capital spending will only keep rising. If hyperscale data-center expansion slows next year or the year after, this high-priced acquisition will amount to buying at the top. Consider Oracle’s announcement on the same day that it would raise $20 billion to expand its AI and cloud businesses, which sent its stock down 8.8%—the market has run out of patience with the “burn cash for growth” story. Second, an all-stock deal comes with built-in dilution risk: every cent Marvell Technology’s share price falls reduces the deal’s total value by the same amount, so the actual value Lumentum shareholders receive isn’t locked in. Third, regulatory review could take 14 to 20 months. Optical components are a strategic part of AI infrastructure, and there’s no guarantee the deal will be approved.
There’s another signal here worth considering: this is the biggest tech-sector acquisition of 2026, and it comes just as the Nasdaq Composite fell 5.2% in October and the Philadelphia Semiconductor Index dropped 3.37% in a single day. Major mergers and acquisitions often happen near cyclical peaks—when industry leaders start paying sky-high prices for growth, it suggests the story of organic growth has run out of steam. In the short term, both buyer and seller have fallen, and the market has voted with its feet: no matter how high the premium, the first question is whether it’s worth it. Over the medium term, if the wave of AI hardware capital spending continues for another two to three years, and this integration really does give the company pricing power in optical connections, then today’s beating could make Marvell Technology a buying opportunity tomorrow. But if capital spending cools first, this $115 billion deal will be the most expensive lesson at the top of the cycle.
One more thing: Marvell Technology is among the top ten holdings in CHPY, accounting for about 6% based on early October data. The impact of this deal on its dividend calculations also needs to be considered. AMD reports earnings after the market closes tonight, making it the next test for the AI hardware supply chain.
#美股 #AI
A $115 billion acquisition, and both buyer and seller get punished—Marvell Technology’s deal to acquire Lumentum is teaching the AI boom a lesson in valuation.
First, the deal itself. On November 2, Marvell Technology announced an all-stock acquisition of optical-components maker Lumentum, at an enterprise value of $115 billion: $1,132 per share, a 23.9% premium over the October 28 closing price, with each Lumentum share exchanged for 4.5 Marvell shares. After the deal closes, existing Marvell Technology shareholders are expected to own about 67% of the combined company, and Lumentum shareholders about 33%. The transaction is expected to close in the first half of 2028. An all-stock deal means the buyer pays with its own shares instead of cash, with the existing Marvell Technology shareholders’ ownership diluted by about a third as a result.
The market’s reaction that day was an emphatic rejection: Marvell Technology fell 12.7%, Lumentum fell 18.6%, and the Philadelphia Semiconductor Index followed with a 3.37% drop. What stings even more is that Lumentum’s earnings report, released the same day, was actually impressive: adjusted earnings per share of $4.57 and revenue of $1.26 billion last quarter, versus just $1.10 and $533.8 million in the same quarter last year—more than doubling. Earnings more than doubled, yet the stock fell. That shows the market isn’t questioning today’s business, but the price of the deal: based on core operating profit over the next 12 months, Lumentum is valued at about 33 times earnings, compared with an industry median of only around 16 times—more than twice as expensive.
Why does Marvell Technology have to buy it? Put simply: in AI data centers, thousands of chips need to exchange data around the clock. Copper cables are no longer fast enough or capable of reaching far enough, and optical connections are replacing copper as the new bottleneck in the entire AI supply chain. Marvell Technology has custom chips, network switching, and interconnect technology; Lumentum has lasers, optical transceiver modules, and optical circuit switching—which uses optical signals to “reroute” data directly, making it faster and more energy-efficient than electrical signals. Together, they aim to control the entire path of AI signals, from chips to racks, targeting a $550 billion market. Earlier this year, Nvidia invested $2 billion in each company, effectively taking sides in advance. The combined company is expected to generate more than $21 billion in annual revenue, with an adjusted operating margin of around 40%, as well as over $1 billion in annual cost synergies.
But the bill won’t come due until 2028, and the uncertainties in the meantime are formidable. First, the acquisition is being made at a cyclical peak valuation. A 33-times multiple assumes AI capital spending will only keep rising. If hyperscale data-center expansion slows next year or the year after, this high-priced acquisition will amount to buying at the top. Consider Oracle’s announcement on the same day that it would raise $20 billion to expand its AI and cloud businesses, which sent its stock down 8.8%—the market has run out of patience with the “burn cash for growth” story. Second, an all-stock deal comes with built-in dilution risk: every cent Marvell Technology’s share price falls reduces the deal’s total value by the same amount, so the actual value Lumentum shareholders receive isn’t locked in. Third, regulatory review could take 14 to 20 months. Optical components are a strategic part of AI infrastructure, and there’s no guarantee the deal will be approved.
There’s another signal here worth considering: this is the biggest tech-sector acquisition of 2026, and it comes just as the Nasdaq Composite fell 5.2% in October and the Philadelphia Semiconductor Index dropped 3.37% in a single day. Major mergers and acquisitions often happen near cyclical peaks—when industry leaders start paying sky-high prices for growth, it suggests the story of organic growth has run out of steam. In the short term, both buyer and seller have fallen, and the market has voted with its feet: no matter how high the premium, the first question is whether it’s worth it. Over the medium term, if the wave of AI hardware capital spending continues for another two to three years, and this integration really does give the company pricing power in optical connections, then today’s beating could make Marvell Technology a buying opportunity tomorrow. But if capital spending cools first, this $115 billion deal will be the most expensive lesson at the top of the cycle.
One more thing: Marvell Technology is among the top ten holdings in CHPY, accounting for about 6% based on early October data. The impact of this deal on its dividend calculations also needs to be considered. AMD reports earnings after the market closes tonight, making it the next test for the AI hardware supply chain.
#美股 #AI
First, the deal itself. On November 2, Marvell Technology announced an all-stock acquisition of optical-components maker Lumentum, at an enterprise value of $115 billion: $1,132 per share, a 23.9% premium over the October 28 closing price, with each Lumentum share exchanged for 4.5 Marvell shares. After the deal closes, existing Marvell Technology shareholders are expected to own about 67% of the combined company, and Lumentum shareholders about 33%. The transaction is expected to close in the first half of 2028. An all-stock deal means the buyer pays with its own shares instead of cash, with the existing Marvell Technology shareholders’ ownership diluted by about a third as a result.
The market’s reaction that day was an emphatic rejection: Marvell Technology fell 12.7%, Lumentum fell 18.6%, and the Philadelphia Semiconductor Index followed with a 3.37% drop. What stings even more is that Lumentum’s earnings report, released the same day, was actually impressive: adjusted earnings per share of $4.57 and revenue of $1.26 billion last quarter, versus just $1.10 and $533.8 million in the same quarter last year—more than doubling. Earnings more than doubled, yet the stock fell. That shows the market isn’t questioning today’s business, but the price of the deal: based on core operating profit over the next 12 months, Lumentum is valued at about 33 times earnings, compared with an industry median of only around 16 times—more than twice as expensive.
Why does Marvell Technology have to buy it? Put simply: in AI data centers, thousands of chips need to exchange data around the clock. Copper cables are no longer fast enough or capable of reaching far enough, and optical connections are replacing copper as the new bottleneck in the entire AI supply chain. Marvell Technology has custom chips, network switching, and interconnect technology; Lumentum has lasers, optical transceiver modules, and optical circuit switching—which uses optical signals to “reroute” data directly, making it faster and more energy-efficient than electrical signals. Together, they aim to control the entire path of AI signals, from chips to racks, targeting a $550 billion market. Earlier this year, Nvidia invested $2 billion in each company, effectively taking sides in advance. The combined company is expected to generate more than $21 billion in annual revenue, with an adjusted operating margin of around 40%, as well as over $1 billion in annual cost synergies.
But the bill won’t come due until 2028, and the uncertainties in the meantime are formidable. First, the acquisition is being made at a cyclical peak valuation. A 33-times multiple assumes AI capital spending will only keep rising. If hyperscale data-center expansion slows next year or the year after, this high-priced acquisition will amount to buying at the top. Consider Oracle’s announcement on the same day that it would raise $20 billion to expand its AI and cloud businesses, which sent its stock down 8.8%—the market has run out of patience with the “burn cash for growth” story. Second, an all-stock deal comes with built-in dilution risk: every cent Marvell Technology’s share price falls reduces the deal’s total value by the same amount, so the actual value Lumentum shareholders receive isn’t locked in. Third, regulatory review could take 14 to 20 months. Optical components are a strategic part of AI infrastructure, and there’s no guarantee the deal will be approved.
There’s another signal here worth considering: this is the biggest tech-sector acquisition of 2026, and it comes just as the Nasdaq Composite fell 5.2% in October and the Philadelphia Semiconductor Index dropped 3.37% in a single day. Major mergers and acquisitions often happen near cyclical peaks—when industry leaders start paying sky-high prices for growth, it suggests the story of organic growth has run out of steam. In the short term, both buyer and seller have fallen, and the market has voted with its feet: no matter how high the premium, the first question is whether it’s worth it. Over the medium term, if the wave of AI hardware capital spending continues for another two to three years, and this integration really does give the company pricing power in optical connections, then today’s beating could make Marvell Technology a buying opportunity tomorrow. But if capital spending cools first, this $115 billion deal will be the most expensive lesson at the top of the cycle.
One more thing: Marvell Technology is among the top ten holdings in CHPY, accounting for about 6% based on early October data. The impact of this deal on its dividend calculations also needs to be considered. AMD reports earnings after the market closes tonight, making it the next test for the AI hardware supply chain.
#美股 #AI
110
Log in to explore more content
Join global crypto users on Binance Square
⚡️ Get latest and useful information about crypto.
💬 Trusted by the world’s largest crypto exchange.
👍 Discover real insights from verified creators.
Email / Phone number
Trending Topics
BTCRebounds80K
62,485 views
699 Discussing
BITCOIN UPDATE I’M STILL BEARISH, AND HERE’S WHY! 🚨⚠️
As you all witnessed, BTC bounced back from the $75,700 area and touched $81K. First, the market trapped long traders, and then it trapped short traders.
I’m still bearish. First of all, as everyone knows, Democrats won today’s US midterm elections, and in my view, this outcome is bearish for the market.
The market can remain volatile in the short term and trap as many traders as it wants, but that doesn’t change the overall market outlook.
There are several important upcoming events, including US Non Farm Payrolls (November 6), US CPI Inflation (November 10), US PPI (November 13), US Retail Sales (November 17), FOMC Meeting Minutes (November 18), US PCE Inflation (November 25), Federal Reserve interest rate expectations, the US Dollar Index (DXY), Treasury Yields, Nasdaq performance, Bitcoin ETF flows, and ongoing( Iran ) Israel geopolitical developments. All of these could have a significant impact on Bitcoin and the overall crypto market.
But don’t get too carried away by Bitcoin’s recent movement. Technically speaking, there hasn’t been any major bullish move yet. Yesterday, BTC was trading between $80K and $82K, and even today, it’s still around the same range.
If you want to turn bullish, that’s entirely your choice.
In my previous post, I clearly explained that BTC had technical support in the $75K / $76K zone, and the price bounced from that support and made its way back towards $80K. But this wasn’t something I had failed to mention before. In fact, I repeatedly mentioned in my posts that BTC could move towards $80K, $81K, or even $82K.
Despite that, I’m still bearish.
And I don’t have just one reason to support my bearish outlook. I have several reasons, which I’ve already explained in my previous posts.
For now, I’ll continue to wait for BTC to drop below $74K, which I believe could happen very soon. In my view, such a correction is also necessary for the market.
Anyone looking for crypto guidance just let me know.
#BTCRebounds80K
Strategic Adviser
·29 Likes
·30.9k views
Binance98PercentReplenished
39,086 views
551 Discussing
USMidterms-WhatAreMarketsExpecting?
341,936 views
2,061 Discussing