Nvidia has fallen below its 200-day moving average, and the $200 mark has been tested twice in four days—the AI leader is being repriced by the market.
First, the numbers. Nvidia closed at $202.06 on November 2, down 1.26%, after hitting an intraday low of $201.66. Volume was 119 million shares, about 17% above the average for the past 20 trading days. This is not just a one-day fluctuation: the stock is down 6.45% over five trading days and 13.63% over a month, and has retreated 16.97% from its 52-week high of $243.37 on October 6. On the same day, the Philadelphia Semiconductor Index fell 3.37%, the technology sector declined for a third consecutive day, and the Nasdaq Composite fell 1.07%.
The catalyst was a report from Melius Research: on November 2, it cut its price target for Nvidia from $420 to $315, a 25% reduction, while maintaining its Buy rating. A price target is an analyst's estimate of what a stock will be worth over the next 12 months. Cutting the target without changing the Buy rating is essentially saying, “We still like it long term, but it's too expensive in the short term.” The reason for the cut is not Nvidia itself, but the buyers footing the bill: AI infrastructure costs are ballooning, and at least five companies with market caps above $1 trillion need to raise hundreds of billions of dollars to sustain their expansion plans. Reuters also reported last week that Nvidia is in talks to provide Nscale, a data center operator, with billions of dollars in credit guarantees to help it issue bonds and build data centers. No agreement has been signed yet, but the signal is clear: even the industry leader is stepping in to inject capital into its supply chain. On the same day, Apple reclaimed the top spot globally from Nvidia, with a market cap of $5.03 trillion versus Nvidia's roughly $4.93 trillion.
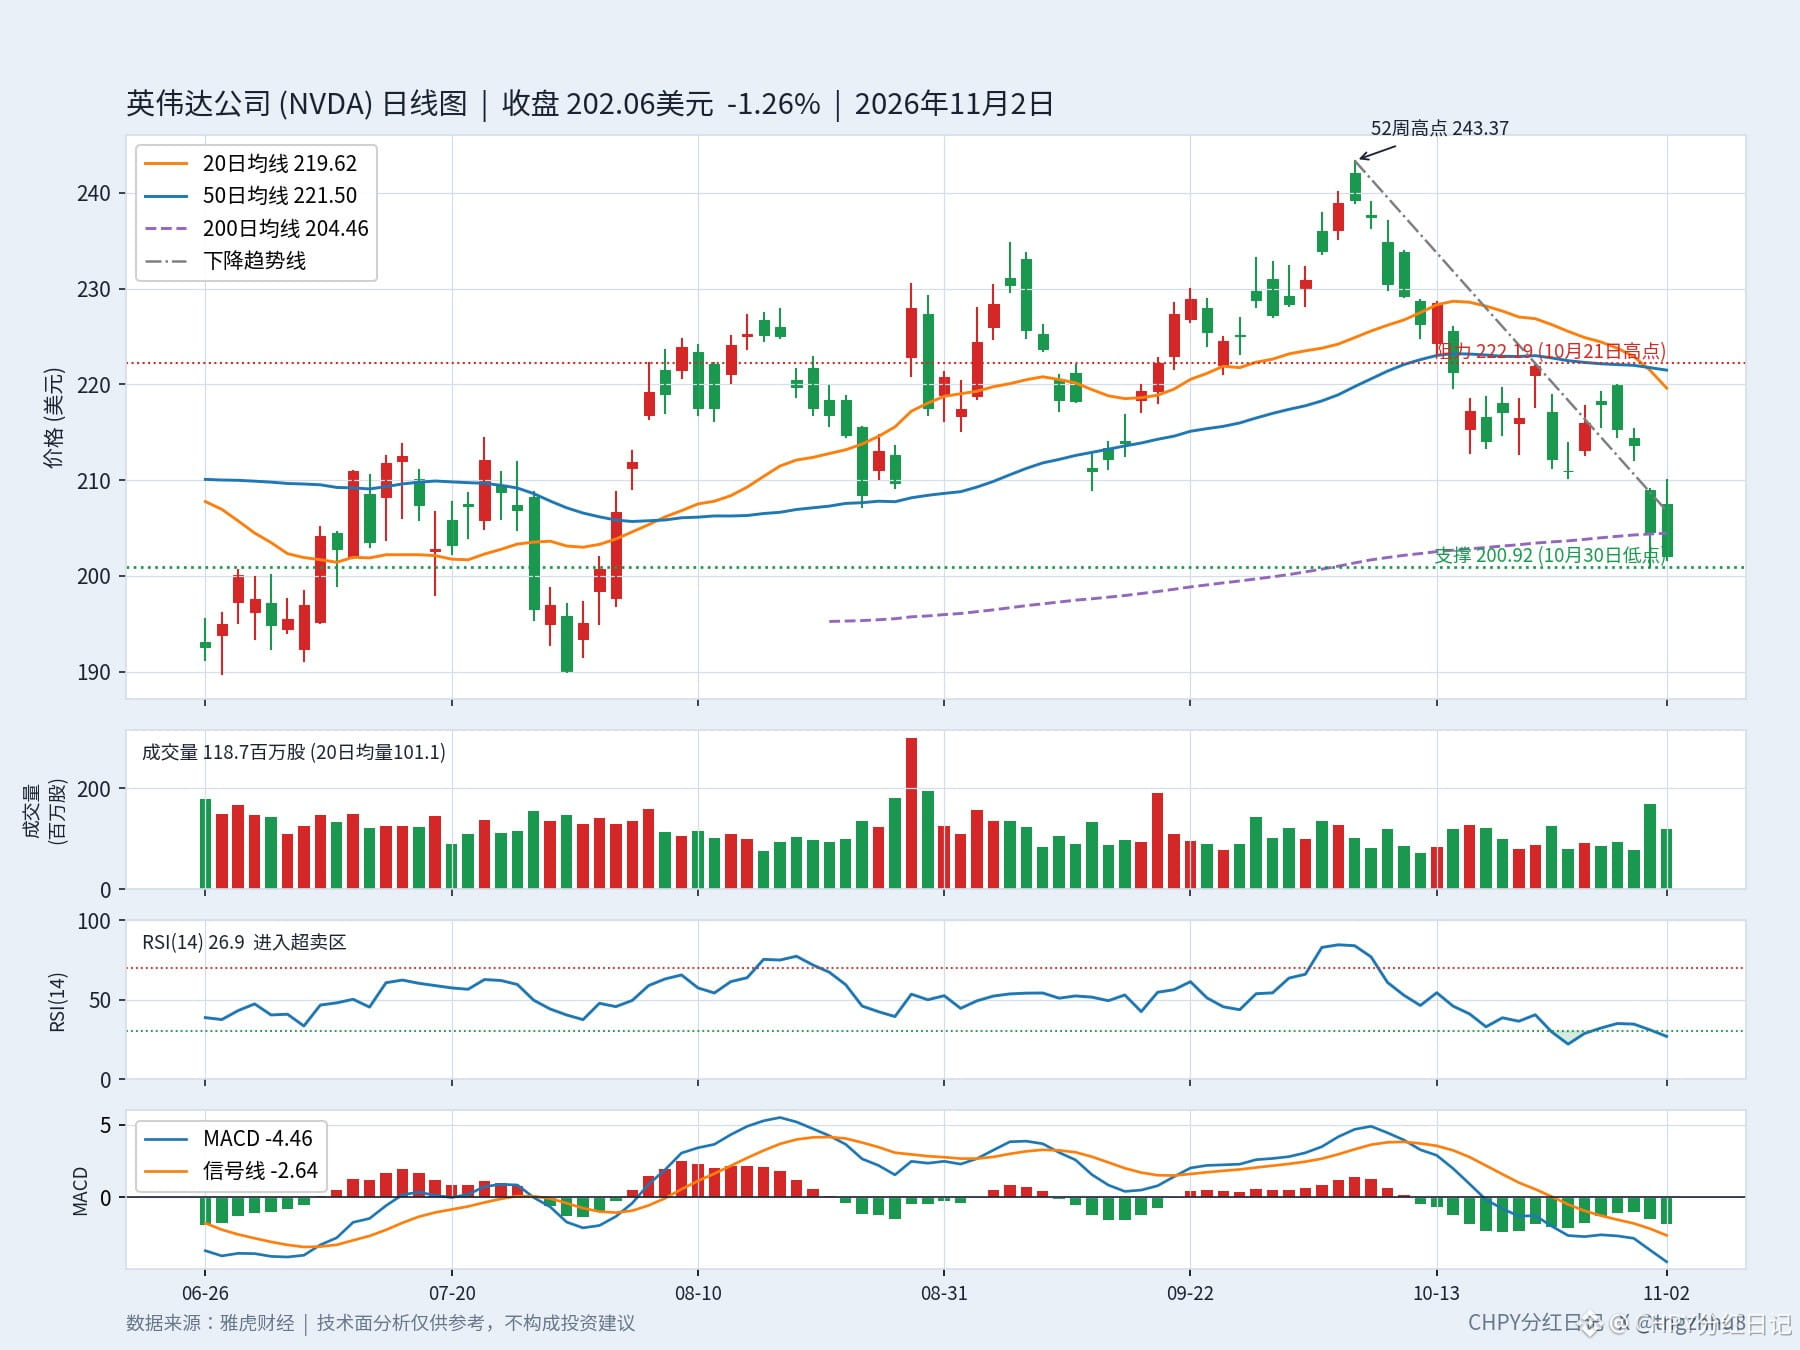
Technically, the stock is now showing a textbook weak structure. It has fallen below its 20-day moving average of $219.62, its 50-day moving average of $221.50, and its 200-day moving average of about $204.40. A moving average is the average cost basis represented by closing prices over a given period. Falling below it means most recent buyers are underwater, creating overhead selling pressure as they look to break even. The 200-day moving average is a long-term cost-basis line often seen as the dividing line between bull and bear markets; November 2 was the first close below it in this correction. The Relative Strength Index is just 26.9. Known as the RSI, it measures the strength of short-term buying and selling pressure; below 30 is considered oversold, and above 70 overbought. A reading of 26.9 indicates bears are in control and the stock may have fallen a bit too far in the short term. The MACD is at -4.46 and has formed a bearish crossover, with a histogram reading of -1.83; momentum is still moving lower. A descending trendline drawn from the October 6 high of $243.37 to the October 21 high of $222.19 is now overhead, and each time the stock bounces up to it, it gets knocked back down.
But there is one detail worth watching amid the weakness: the $200 mark has held twice in four days. The intraday low was $200.92 on October 30 and $201.66 on November 2. The stock tested the level twice and recovered both times, closing above $200 on both occasions. Testing the same price twice and recovering each time is technically called a potential double bottom, evidence that bears have twice tried and failed to break through. Of course, a potential pattern is only a potential pattern; until the closing price gets back above the 200-day moving average, it cannot be considered a bottom.
There are just two key levels to watch: support is first at $200.92, then at the round-number $200 mark. If the stock closes below $200, the next technical level to watch is around $190, near the July 29 low of $190.01. Resistance is first at the 200-day moving average, around $204.40. A move back above it would signal that the short-term bleeding has stopped. The first rebound targets are the 50-day moving average at $221.50 and the October 21 high of $222.19. A move above $222 would finally loosen the grip of the descending trendline.
Looking ahead, the real test comes after the market close on November 17, when Nvidia reports its third-quarter fiscal 2027 results. The company's own revenue guidance is about $108 billion, plus or minus 2%, while the market expects roughly $109 billion. Before the earnings report, the stock is likely to keep grinding around in the $200–$222 range: if it holds $200, an oversold bounce could come at any time, with the first target above $204. On the other hand, if $200 gives way—and Advanced Micro Devices reports weaker-than-expected results after the close tonight—selling pressure across the chip sector could spread again, and $190 would be no idle threat. Wall Street as a whole has not turned against the stock: 49 Buy ratings, 5 Strong Buy ratings, and only 1 Hold, with an average price target of about $319, nearly 60% above the current price. Even Melius Research's revised target of $315 is still more than 50% above the current price. The disagreement is not about whether the stock is worth owning, but about when it will stop falling.
The risks are also clear. Today is Election Day for the U.S. midterm elections, adding another layer of potential after-hours news. An oversold RSI does not mean a rebound is imminent; a stock can become even more oversold. If it closes below $200, stop-loss selling could accelerate. More importantly, whether AI capital spending can continue is the crucial question for the entire sector. What Melius Research is really asking in its report is, “Who will pay the bill?” There will be no answer to that question before the November 17 earnings report. Buying Nvidia around $200 is a bet that demand has not deteriorated; if that bet is wrong, the cost could be another steep selloff.
Technical analysis is for reference only and does not constitute investment advice.
#英伟达 #USStocks
First, the numbers. Nvidia closed at $202.06 on November 2, down 1.26%, after hitting an intraday low of $201.66. Volume was 119 million shares, about 17% above the average for the past 20 trading days. This is not just a one-day fluctuation: the stock is down 6.45% over five trading days and 13.63% over a month, and has retreated 16.97% from its 52-week high of $243.37 on October 6. On the same day, the Philadelphia Semiconductor Index fell 3.37%, the technology sector declined for a third consecutive day, and the Nasdaq Composite fell 1.07%.
The catalyst was a report from Melius Research: on November 2, it cut its price target for Nvidia from $420 to $315, a 25% reduction, while maintaining its Buy rating. A price target is an analyst's estimate of what a stock will be worth over the next 12 months. Cutting the target without changing the Buy rating is essentially saying, “We still like it long term, but it's too expensive in the short term.” The reason for the cut is not Nvidia itself, but the buyers footing the bill: AI infrastructure costs are ballooning, and at least five companies with market caps above $1 trillion need to raise hundreds of billions of dollars to sustain their expansion plans. Reuters also reported last week that Nvidia is in talks to provide Nscale, a data center operator, with billions of dollars in credit guarantees to help it issue bonds and build data centers. No agreement has been signed yet, but the signal is clear: even the industry leader is stepping in to inject capital into its supply chain. On the same day, Apple reclaimed the top spot globally from Nvidia, with a market cap of $5.03 trillion versus Nvidia's roughly $4.93 trillion.
Technically, the stock is now showing a textbook weak structure. It has fallen below its 20-day moving average of $219.62, its 50-day moving average of $221.50, and its 200-day moving average of about $204.40. A moving average is the average cost basis represented by closing prices over a given period. Falling below it means most recent buyers are underwater, creating overhead selling pressure as they look to break even. The 200-day moving average is a long-term cost-basis line often seen as the dividing line between bull and bear markets; November 2 was the first close below it in this correction. The Relative Strength Index is just 26.9. Known as the RSI, it measures the strength of short-term buying and selling pressure; below 30 is considered oversold, and above 70 overbought. A reading of 26.9 indicates bears are in control and the stock may have fallen a bit too far in the short term. The MACD is at -4.46 and has formed a bearish crossover, with a histogram reading of -1.83; momentum is still moving lower. A descending trendline drawn from the October 6 high of $243.37 to the October 21 high of $222.19 is now overhead, and each time the stock bounces up to it, it gets knocked back down.
But there is one detail worth watching amid the weakness: the $200 mark has held twice in four days. The intraday low was $200.92 on October 30 and $201.66 on November 2. The stock tested the level twice and recovered both times, closing above $200 on both occasions. Testing the same price twice and recovering each time is technically called a potential double bottom, evidence that bears have twice tried and failed to break through. Of course, a potential pattern is only a potential pattern; until the closing price gets back above the 200-day moving average, it cannot be considered a bottom.
There are just two key levels to watch: support is first at $200.92, then at the round-number $200 mark. If the stock closes below $200, the next technical level to watch is around $190, near the July 29 low of $190.01. Resistance is first at the 200-day moving average, around $204.40. A move back above it would signal that the short-term bleeding has stopped. The first rebound targets are the 50-day moving average at $221.50 and the October 21 high of $222.19. A move above $222 would finally loosen the grip of the descending trendline.
Looking ahead, the real test comes after the market close on November 17, when Nvidia reports its third-quarter fiscal 2027 results. The company's own revenue guidance is about $108 billion, plus or minus 2%, while the market expects roughly $109 billion. Before the earnings report, the stock is likely to keep grinding around in the $200–$222 range: if it holds $200, an oversold bounce could come at any time, with the first target above $204. On the other hand, if $200 gives way—and Advanced Micro Devices reports weaker-than-expected results after the close tonight—selling pressure across the chip sector could spread again, and $190 would be no idle threat. Wall Street as a whole has not turned against the stock: 49 Buy ratings, 5 Strong Buy ratings, and only 1 Hold, with an average price target of about $319, nearly 60% above the current price. Even Melius Research's revised target of $315 is still more than 50% above the current price. The disagreement is not about whether the stock is worth owning, but about when it will stop falling.
The risks are also clear. Today is Election Day for the U.S. midterm elections, adding another layer of potential after-hours news. An oversold RSI does not mean a rebound is imminent; a stock can become even more oversold. If it closes below $200, stop-loss selling could accelerate. More importantly, whether AI capital spending can continue is the crucial question for the entire sector. What Melius Research is really asking in its report is, “Who will pay the bill?” There will be no answer to that question before the November 17 earnings report. Buying Nvidia around $200 is a bet that demand has not deteriorated; if that bet is wrong, the cost could be another steep selloff.
Technical analysis is for reference only and does not constitute investment advice.
#英伟达 #USStocks