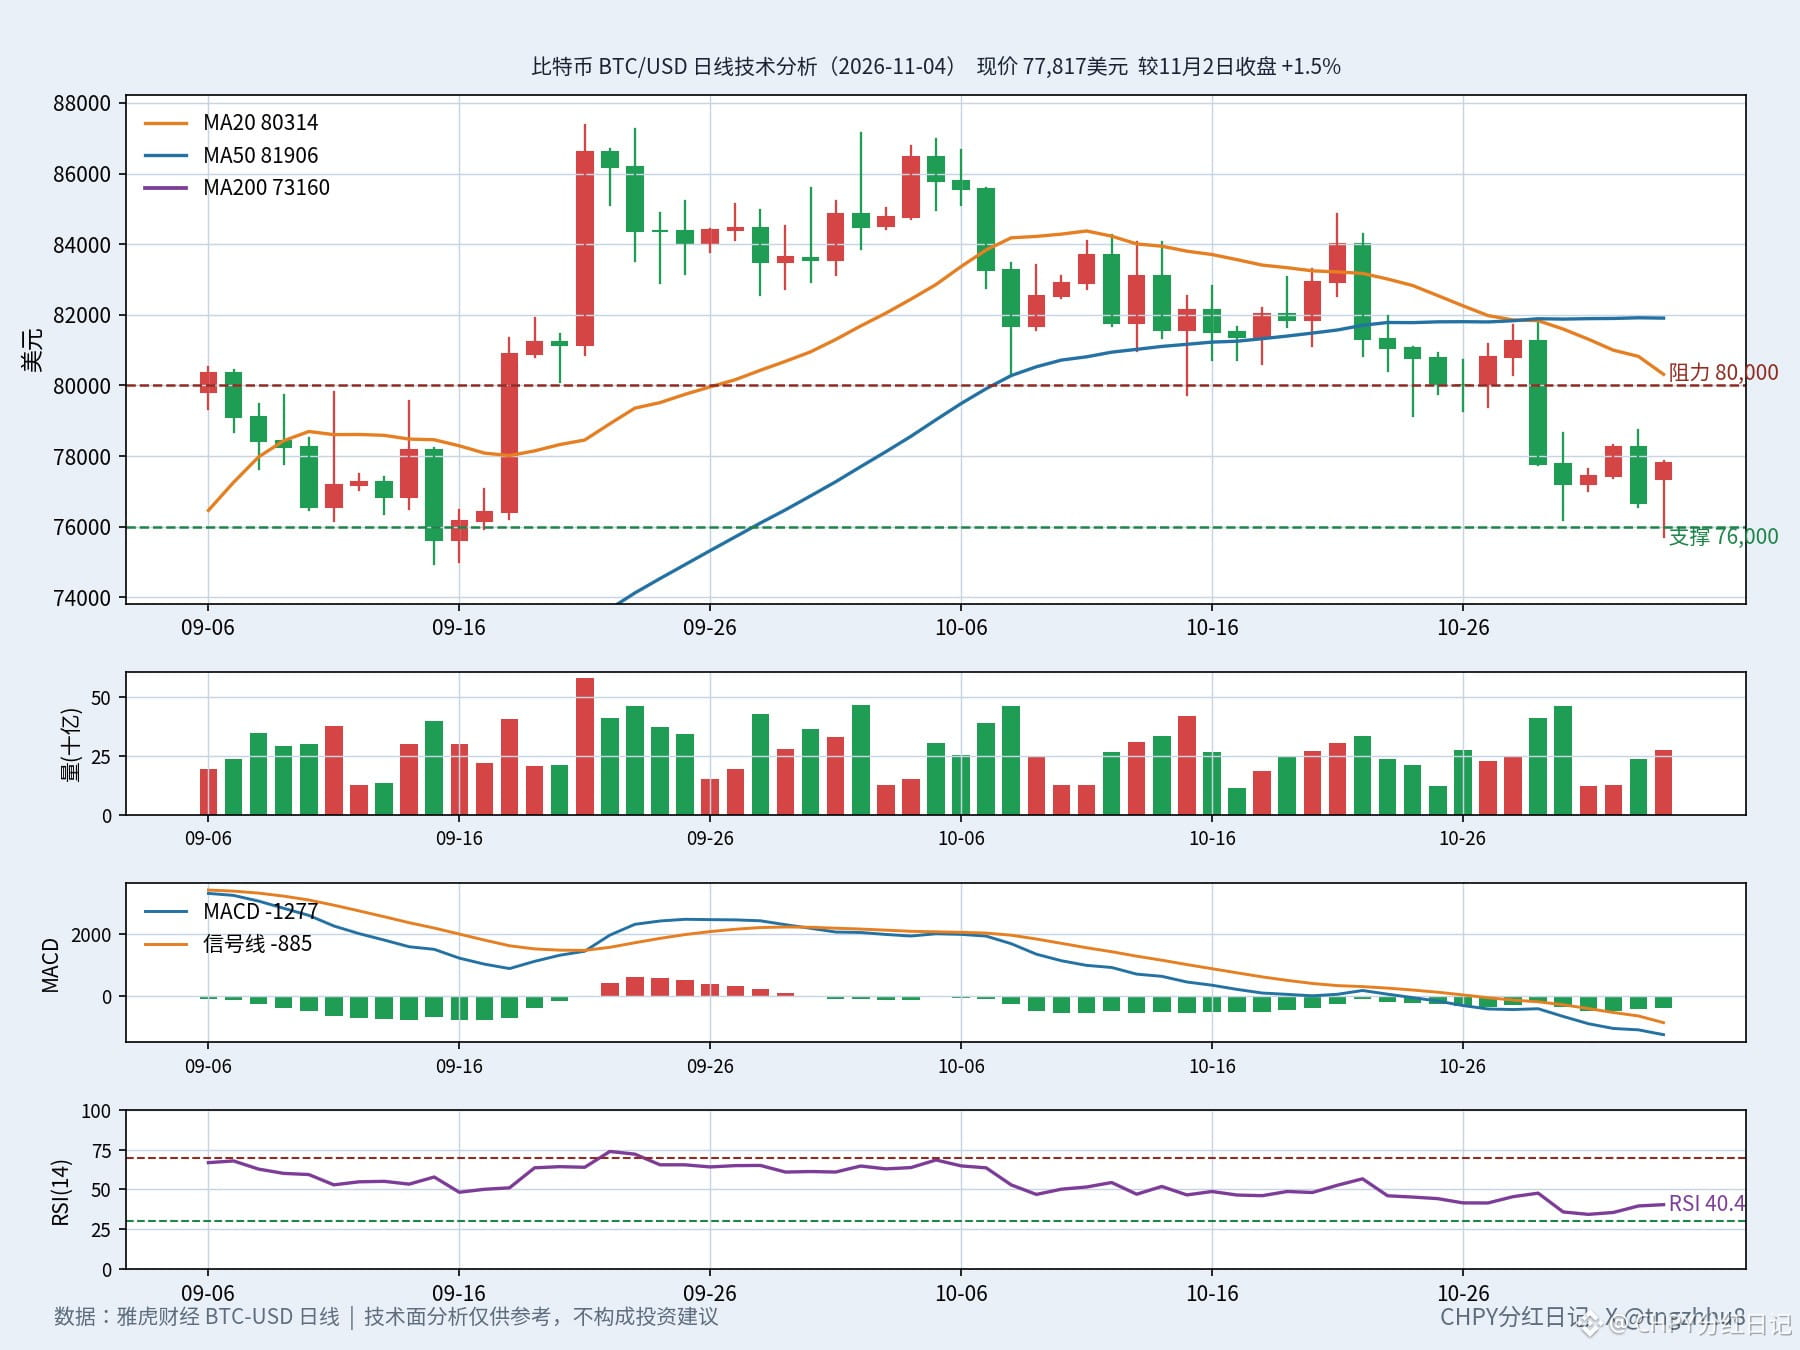
Bitcoin is stuck in a $76,000–$80,000 range, sitting right on its 100-day exponential moving average—a step up from here could stop the bleeding, while a step down could bring a high-volume breakdown.
First, the numbers. As of publication, Bitcoin was around $77,817, up about 1.5% from the November 2 close of $76,677, but still down about 4.2% over the past 7 days and 9.3% over the past 30 days. It is 38.3% below its all-time high of $126,080 on October 6, 2025, and 27.6% below its 52-week high of $107,428. Moving averages are the average cost line based on closing prices over a given period: the current price is about 3.1% below the 20-day moving average of $80,314 and 5.0% below the 50-day moving average of $81,906, but 6.4% above the 200-day moving average of $73,160. It is sitting right on the 100-day exponential moving average at $77,729. An exponential moving average is an average cost line that gives more weight to recent prices; the 100-day line is now the price level where bulls and bears are battling it out.
Momentum indicators also look poor. The Relative Strength Index is 40.4. Known as the RSI, it measures the strength of short-term buying and selling pressure. Below 30 is considered oversold and above 70 overbought. At 40.4, it shows bears still have the upper hand, although the index has edged up from 35.0 on November 2. The oversold bounce has not yet turned bullish. The MACD is -1,277, the signal line is -885, and the histogram is -392. MACD, or Moving Average Convergence Divergence, is a momentum indicator that measures the gap between short- and long-term moving averages. With the MACD below the signal line and the histogram negative, momentum is still heading down.
But there are two details worth watching amid the weakness. First, the two big bullish candles on September 18 and 21: on September 18, Bitcoin closed up 5.9% at $80,901; on September 21, it gained another 6.7% to $86,603, after reaching an intraday high of $87,364. In two days, the price was hauled back from around $76,000, and volume surged to $57.7 billion on September 21, the highest in nearly 60 days. Second, the $76,000 area has repeatedly held: Bitcoin closed at $76,677 on November 2, hit an intraday low of $75,710 today, then closed back at $77,817. The support zone is still holding, but the margin by which it holds is getting smaller each time.
The catalysts are in the news. Voting in the U.S. midterm elections took place on November 3, and counting is still underway; what markets fear most is uncertainty itself. Spot Bitcoin exchange-traded funds have seen consecutive net outflows: $643 million on October 30, followed by another $399 million on November 2. That is more than $1 billion over two trading days, with institutional money flowing out. The Crypto Fear & Greed Index is at 34, still in fear territory, though up 8 points from yesterday's 26.
There are just two key levels: first, support at $76,000. A close below $76,000 would put the next technical level around $75,000, followed by $74,750. Resistance comes first at the round-number level of $80,000. Only a move back above that level and the 20-day moving average at $80,314 would count as a short-term halt to the bleeding. The first rebound targets are the 50-day moving average at $81,906 and the September 21 intraday high of $87,364.
Looking ahead, the real tests are the final results of the U.S. midterm elections and Friday's October nonfarm payrolls report. Until then, Bitcoin will likely continue grinding within the $76,000–$80,000 range: if $76,000 holds, an oversold bounce could come at any time, with the first target above $80,000. On the other hand, if $76,000 gives way and spot Bitcoin ETFs continue to see large outflows, stop-loss selling could accelerate, and $75,000 will be no idle threat. Range-bound trading means prices move back and forth within a set range without going anywhere; it's a test of patience.
The risks are plain to see: an oversold RSI does not mean a rebound is imminent—an asset can become even more oversold. Bitcoin trades 24 hours a day, and overnight volatility is high; a level that looks promising during the day can be broken by a single bearish candle at night. More importantly, flows into and out of spot Bitcoin ETFs are the market's lifeline this time around. As long as outflows continue, any rebound should be treated first as an oversold bounce. Watching Bitcoin near $76,000 is a bet that demand hasn't completely broken down; get it wrong, and the cost could be another steep bearish candle.
Technical analysis is for reference only and does not constitute investment advice.
#比特币 #BTC
First, the numbers. As of publication, Bitcoin was around $77,817, up about 1.5% from the November 2 close of $76,677, but still down about 4.2% over the past 7 days and 9.3% over the past 30 days. It is 38.3% below its all-time high of $126,080 on October 6, 2025, and 27.6% below its 52-week high of $107,428. Moving averages are the average cost line based on closing prices over a given period: the current price is about 3.1% below the 20-day moving average of $80,314 and 5.0% below the 50-day moving average of $81,906, but 6.4% above the 200-day moving average of $73,160. It is sitting right on the 100-day exponential moving average at $77,729. An exponential moving average is an average cost line that gives more weight to recent prices; the 100-day line is now the price level where bulls and bears are battling it out.
Momentum indicators also look poor. The Relative Strength Index is 40.4. Known as the RSI, it measures the strength of short-term buying and selling pressure. Below 30 is considered oversold and above 70 overbought. At 40.4, it shows bears still have the upper hand, although the index has edged up from 35.0 on November 2. The oversold bounce has not yet turned bullish. The MACD is -1,277, the signal line is -885, and the histogram is -392. MACD, or Moving Average Convergence Divergence, is a momentum indicator that measures the gap between short- and long-term moving averages. With the MACD below the signal line and the histogram negative, momentum is still heading down.
But there are two details worth watching amid the weakness. First, the two big bullish candles on September 18 and 21: on September 18, Bitcoin closed up 5.9% at $80,901; on September 21, it gained another 6.7% to $86,603, after reaching an intraday high of $87,364. In two days, the price was hauled back from around $76,000, and volume surged to $57.7 billion on September 21, the highest in nearly 60 days. Second, the $76,000 area has repeatedly held: Bitcoin closed at $76,677 on November 2, hit an intraday low of $75,710 today, then closed back at $77,817. The support zone is still holding, but the margin by which it holds is getting smaller each time.
The catalysts are in the news. Voting in the U.S. midterm elections took place on November 3, and counting is still underway; what markets fear most is uncertainty itself. Spot Bitcoin exchange-traded funds have seen consecutive net outflows: $643 million on October 30, followed by another $399 million on November 2. That is more than $1 billion over two trading days, with institutional money flowing out. The Crypto Fear & Greed Index is at 34, still in fear territory, though up 8 points from yesterday's 26.
There are just two key levels: first, support at $76,000. A close below $76,000 would put the next technical level around $75,000, followed by $74,750. Resistance comes first at the round-number level of $80,000. Only a move back above that level and the 20-day moving average at $80,314 would count as a short-term halt to the bleeding. The first rebound targets are the 50-day moving average at $81,906 and the September 21 intraday high of $87,364.
Looking ahead, the real tests are the final results of the U.S. midterm elections and Friday's October nonfarm payrolls report. Until then, Bitcoin will likely continue grinding within the $76,000–$80,000 range: if $76,000 holds, an oversold bounce could come at any time, with the first target above $80,000. On the other hand, if $76,000 gives way and spot Bitcoin ETFs continue to see large outflows, stop-loss selling could accelerate, and $75,000 will be no idle threat. Range-bound trading means prices move back and forth within a set range without going anywhere; it's a test of patience.
The risks are plain to see: an oversold RSI does not mean a rebound is imminent—an asset can become even more oversold. Bitcoin trades 24 hours a day, and overnight volatility is high; a level that looks promising during the day can be broken by a single bearish candle at night. More importantly, flows into and out of spot Bitcoin ETFs are the market's lifeline this time around. As long as outflows continue, any rebound should be treated first as an oversold bounce. Watching Bitcoin near $76,000 is a bet that demand hasn't completely broken down; get it wrong, and the cost could be another steep bearish candle.
Technical analysis is for reference only and does not constitute investment advice.
#比特币 #BTC