

景定远
X:景定远🔸预测为交易参考,非决定性走势
Open Trade
Frequent Trader
3.9 Months
6 Following
114 Followers
240 Liked
Posts
Portfolio
All
Quotes
PINNED

景定远
·
--
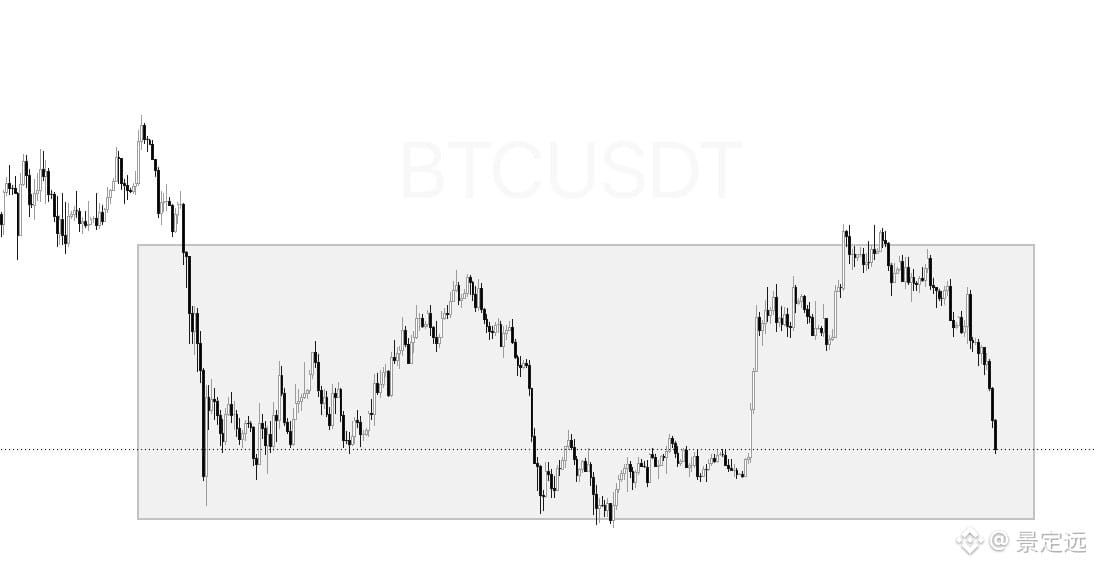
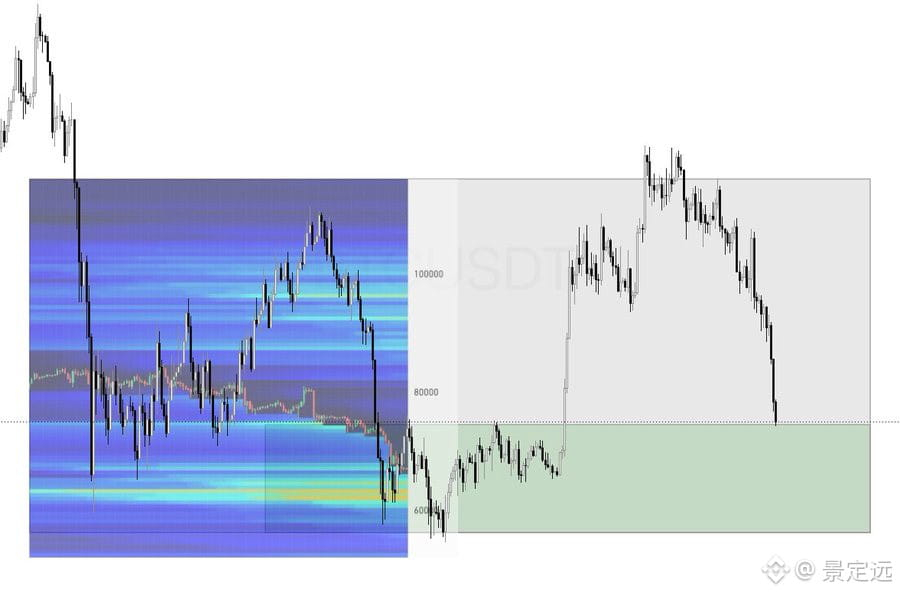
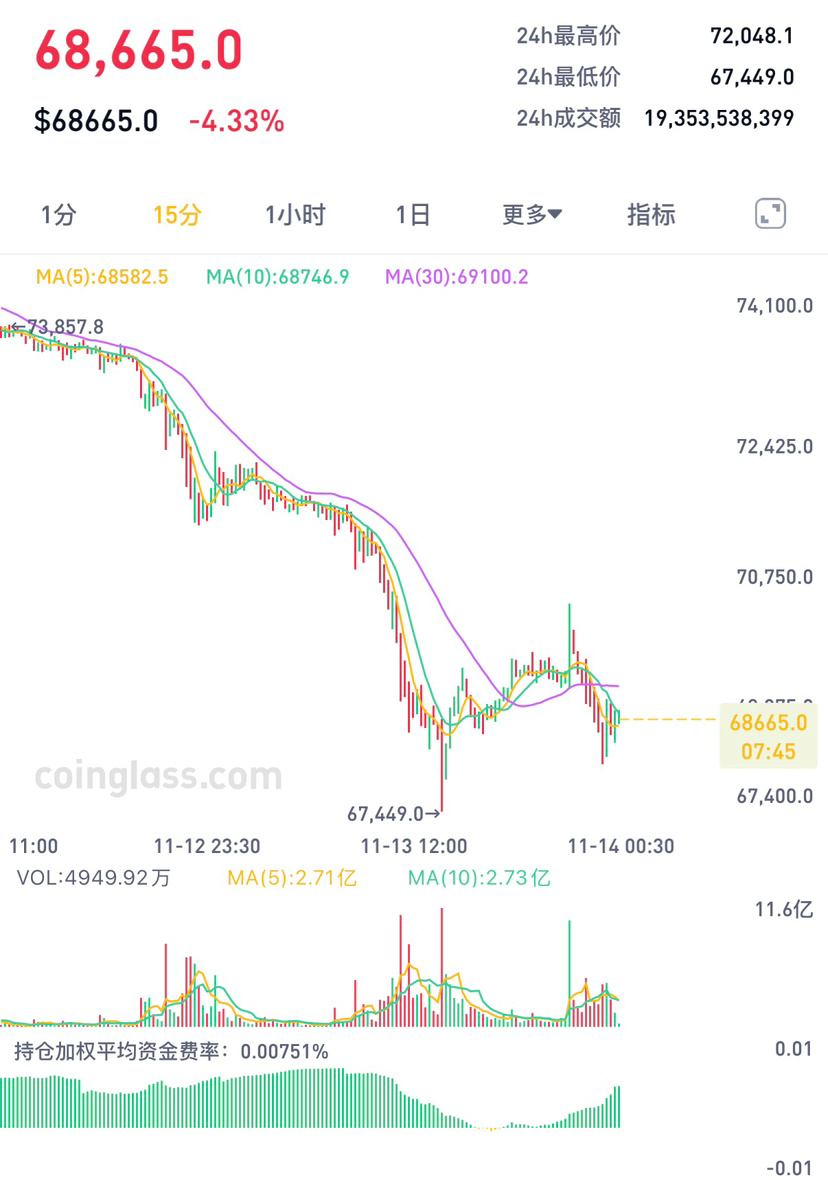
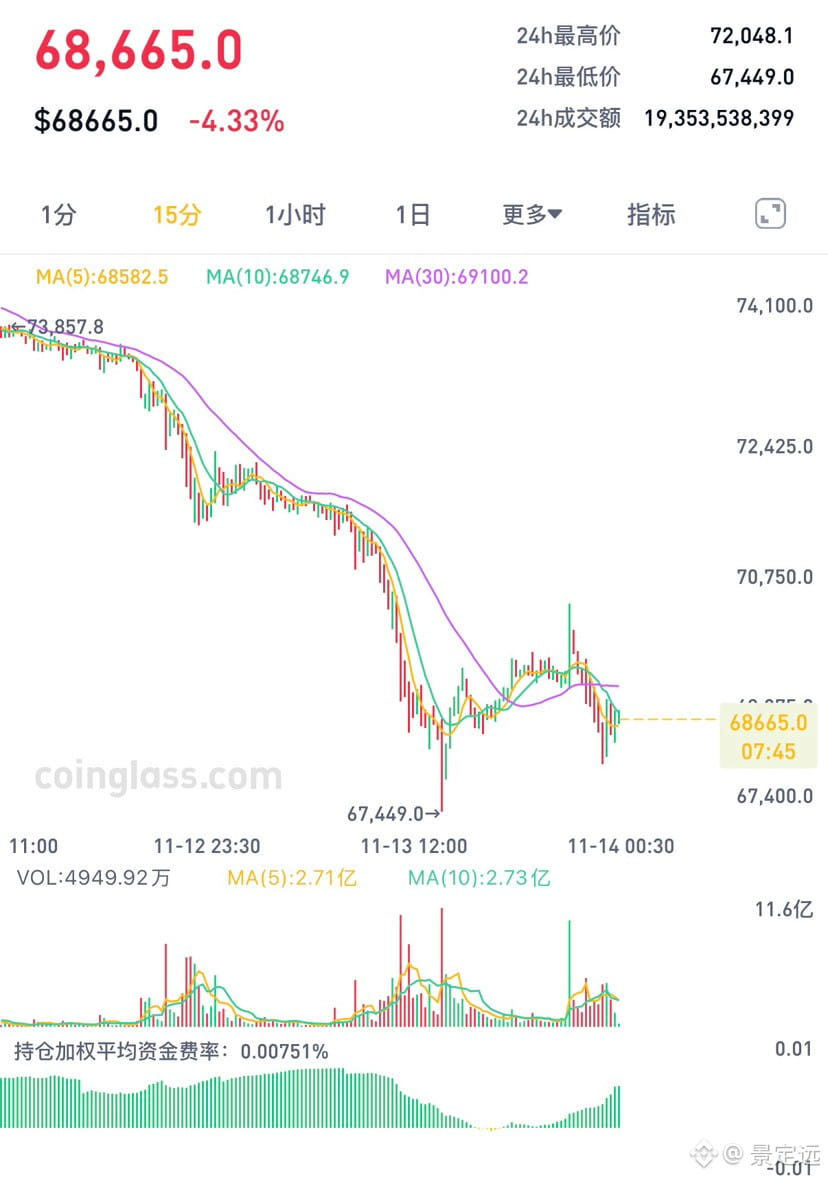
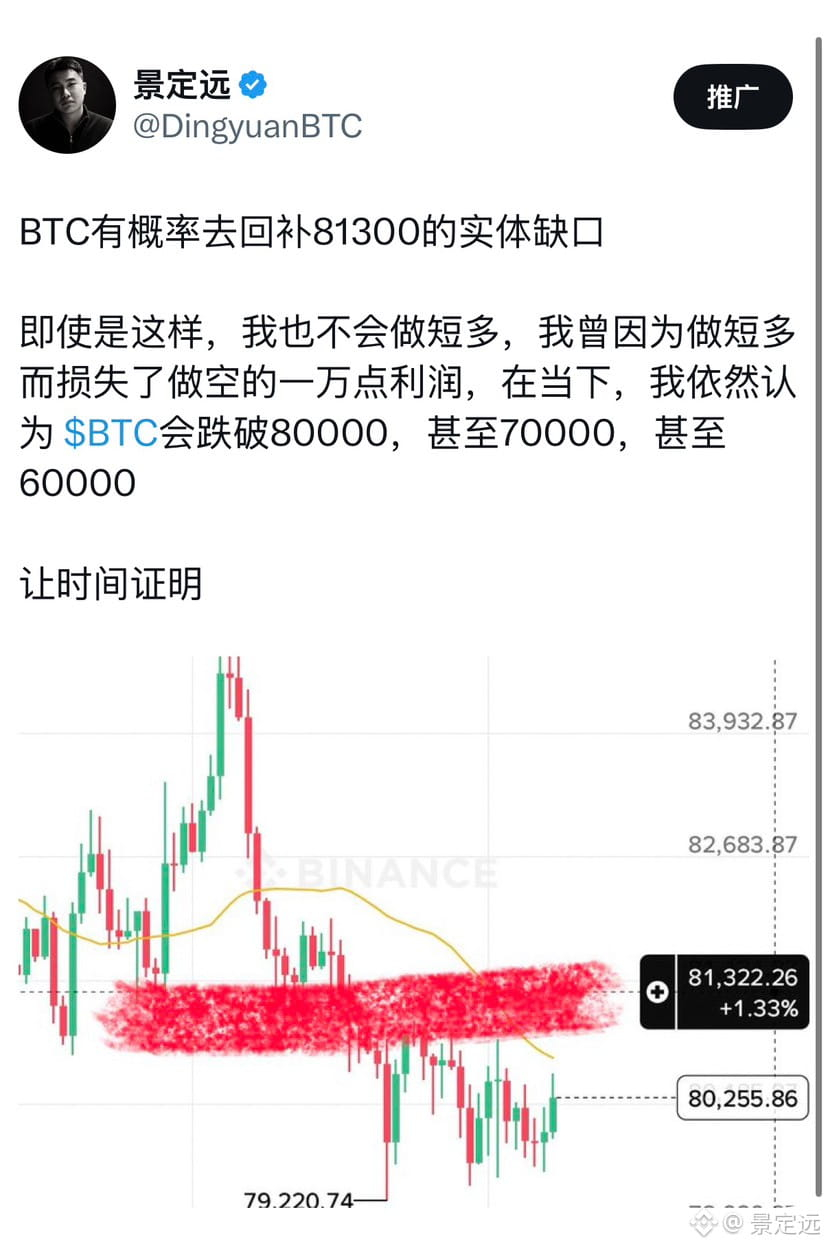
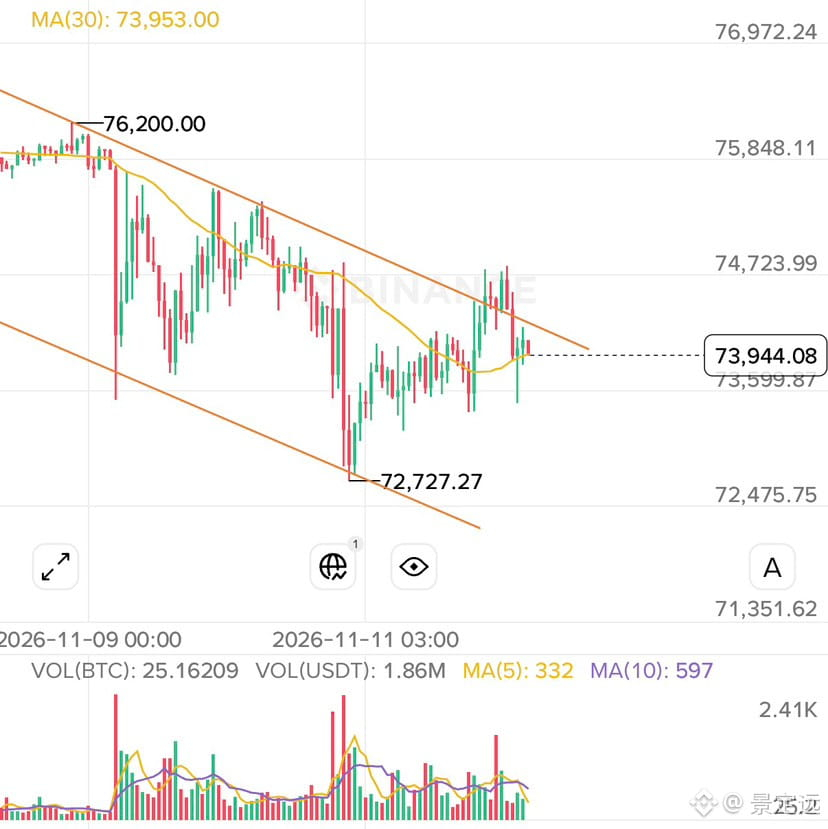
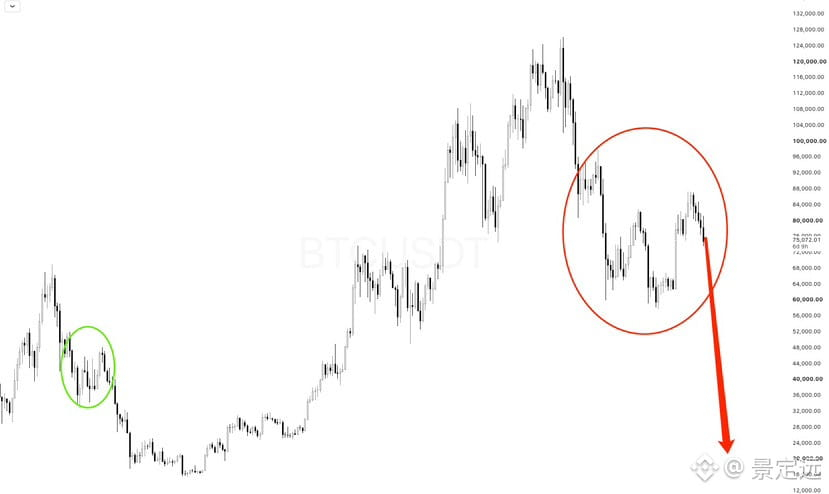
That’s the point of the big players keeping prices range-bound: give the bulls a little taste of profit, and they’ll start bottom-fishing with long positions again, providing liquidity for the downturn.
Forget the heavy losses.
Forget the downtrend.
Most people who go long at this level won’t take profits even if crypto prices rebound. As soon as prices rise, they see a bull market. $BTC Panic hasn’t set in yet!
Forget the heavy losses.
Forget the downtrend.
Most people who go long at this level won’t take profits even if crypto prices rebound. As soon as prices rise, they see a bull market. $BTC Panic hasn’t set in yet!


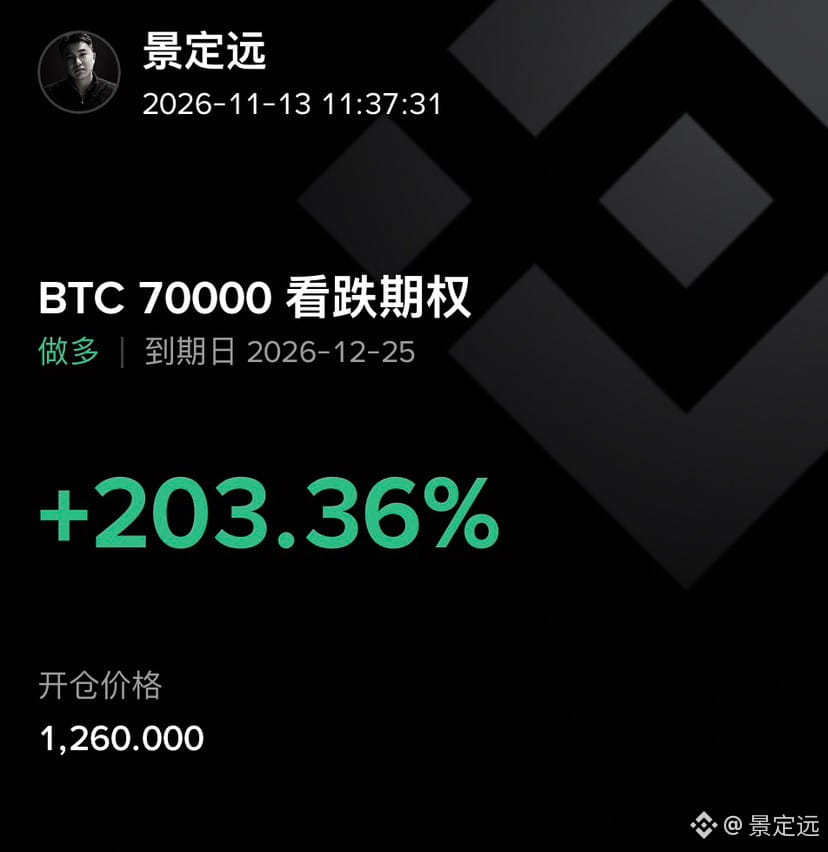
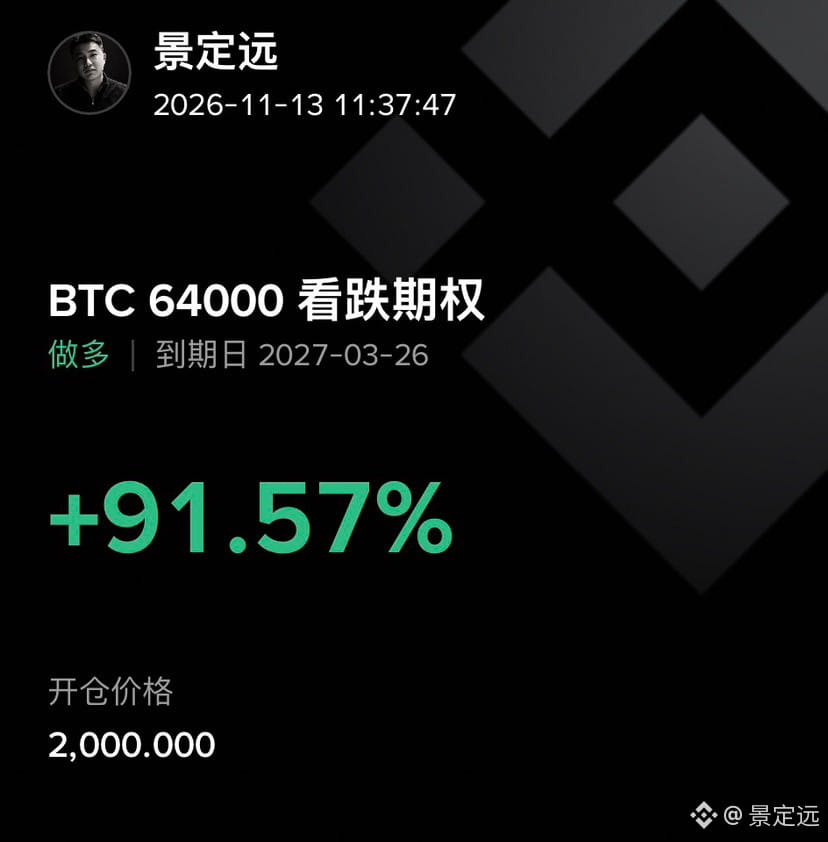
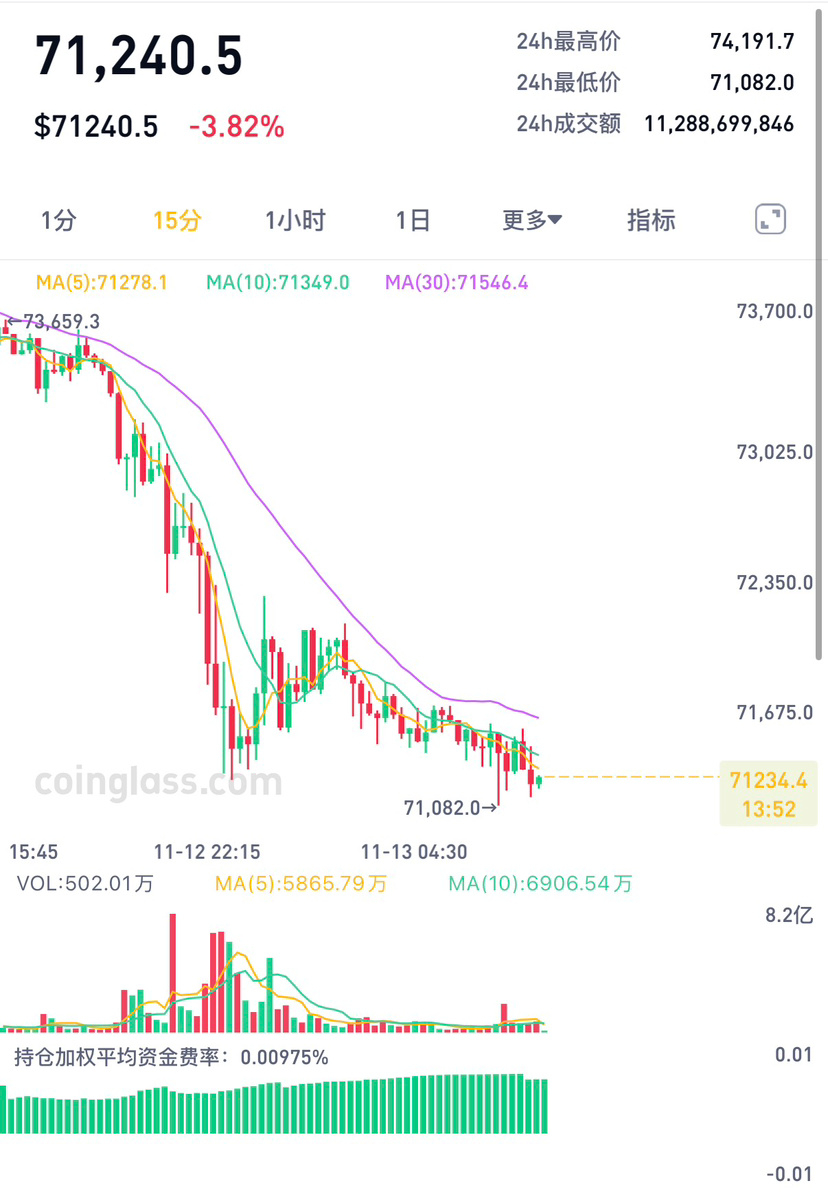
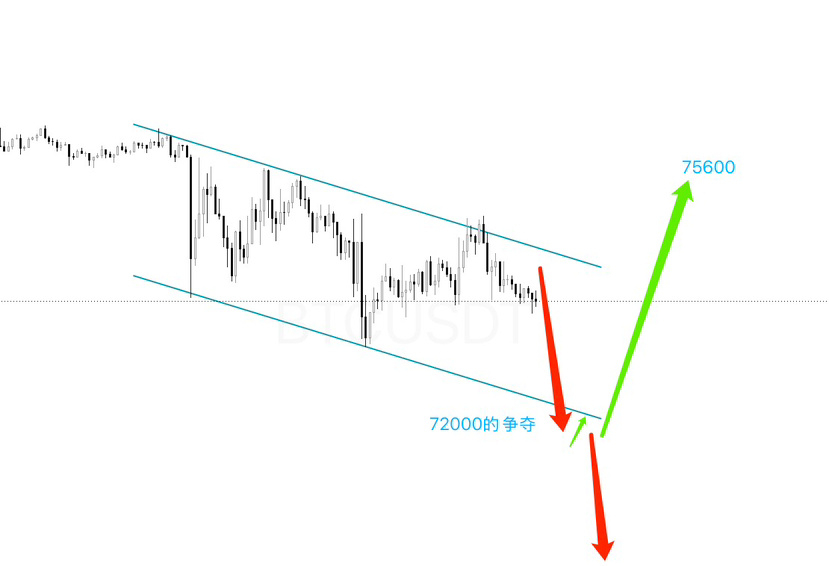
景定远
·
--
Bearish$BTC 11.11 Outlook|Will BTC Be Discounted?
MicroStrategy’s removal is imminent. Bulls should protect their positions. Regardless of the outcome, the market is likely to see major volatility. My personal bearish view remains unchanged.
Many people seem to have a superstition about the market pricing things in ahead of time: they think that once something has been priced in, there won’t be much volatility. That’s not necessarily true. On August 5, 2024, after Japan raised interest rates, Japanese stocks plunged and BTC crashed below 50K. People thought it had already been priced in then, too. Whether MicroStrategy’s removal will drag BTC down is still an unconfirmed major bearish catalyst, so those going long should manage their position sizes carefully.
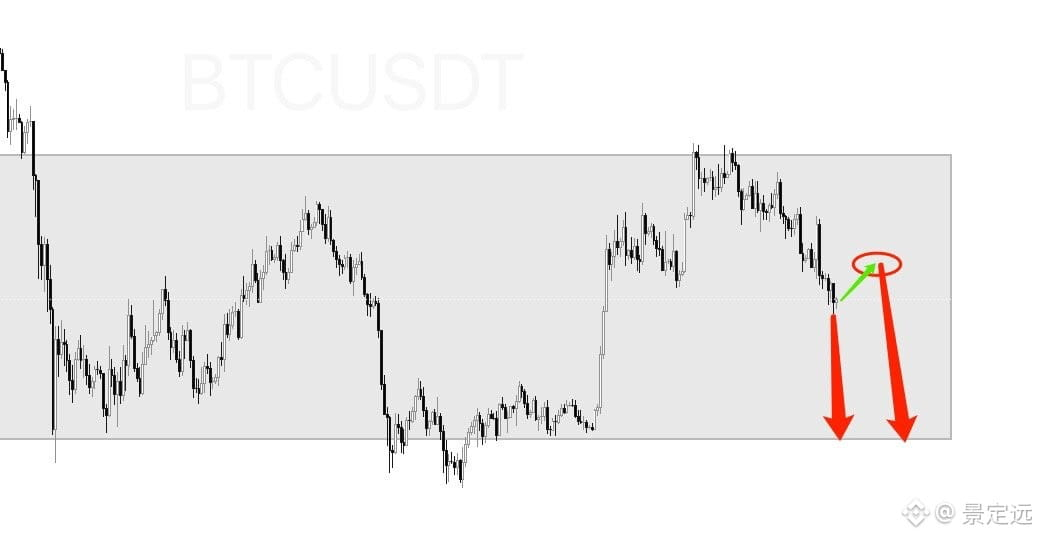
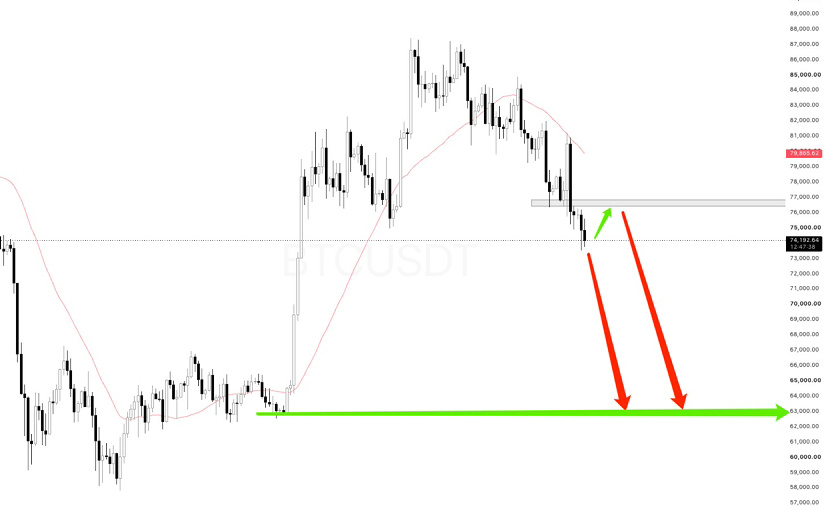
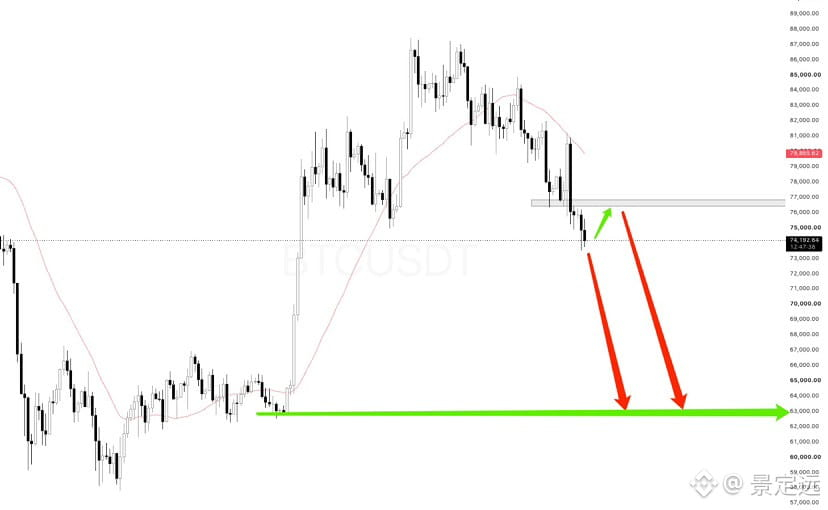
On the daily chart, after the two consecutive hammer candles mentioned previously, yesterday’s candle broke below the bodies of those hammers. The daily trend remains bearish. However, note that the decline has not been particularly smooth, and short liquidity around 77,000 is growing thicker. So there’s a chance of a rebound here to liquidate that liquidity before the price falls again.
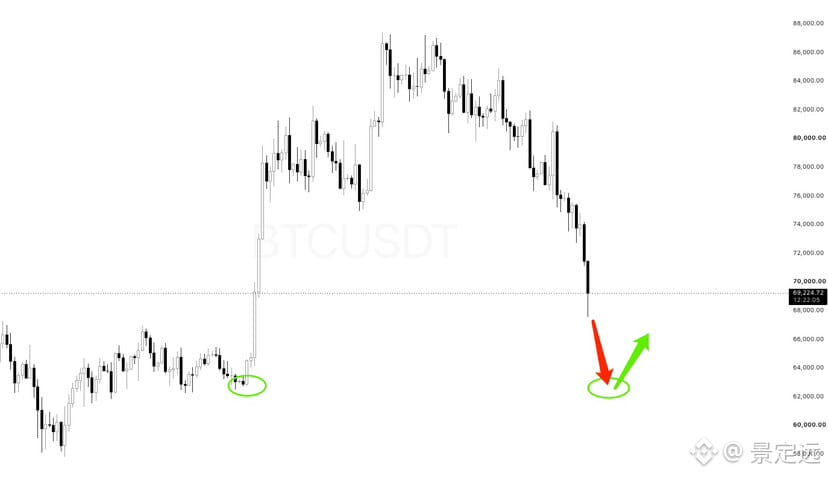
Looking at the overall daily structure, the parabolic decline shows no signs of bottoming, and there has been no panic selling. Meanwhile, a large amount of long-position liquidity at 63,000 is attracting the price.
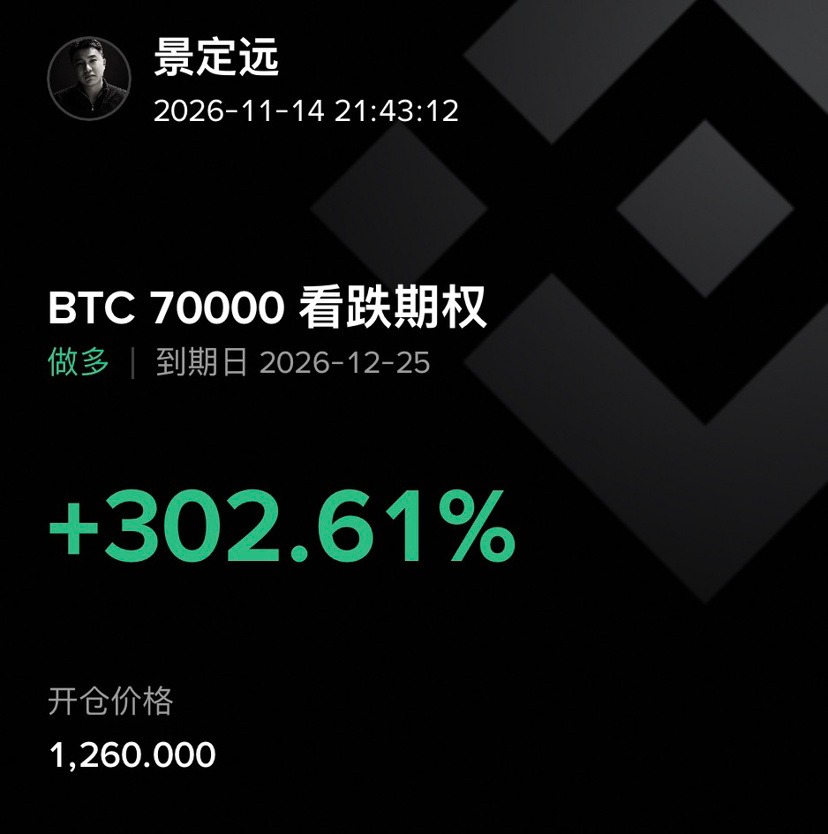
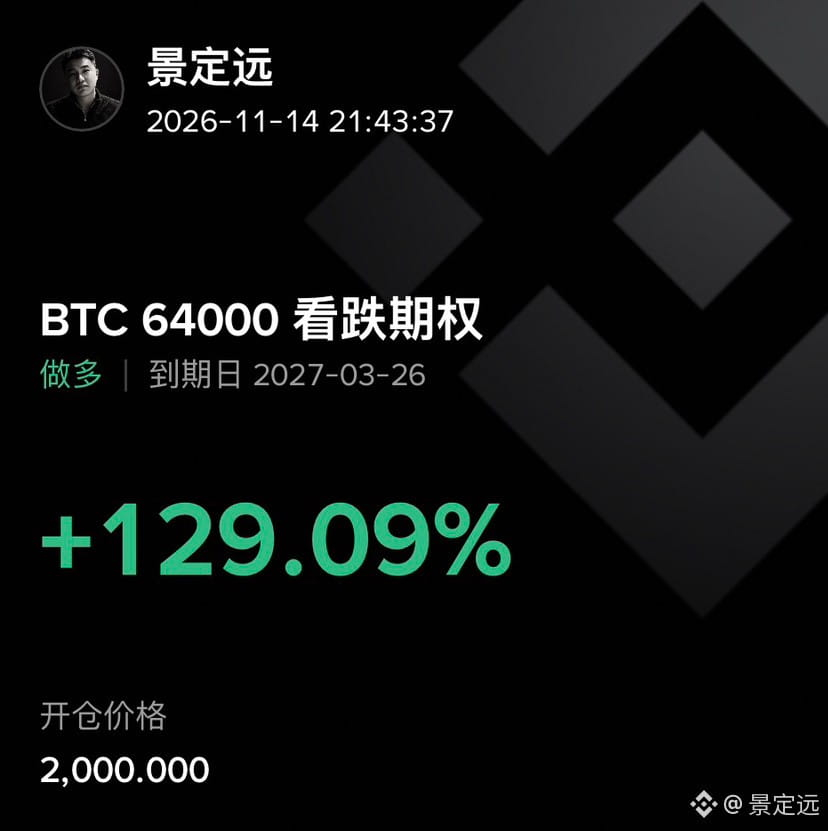
In my system, I would under no circumstances take profit on my short positions or open any long positions in this kind of price action. So I’ll still leave my take-profit order at 63,000. For options, I’ll watch the funding rate and market structure for confirmation before considering taking profit.
Looking at the data,
The dip-buying crowd still hasn’t given up on BTC, and funding rates remain high, which is also consistent with the characteristics of a ranging market.
Why do I say this is characteristic of a ranging market?
Because many people lose their capital in a range: they short at 60,000 and BTC surges; they go long at 80,000 and BTC plunges. This can wipe many people out, but that’s trading.
If I weren’t already holding a position, I wouldn’t trade near the current price. I’d watch for resistance around 77,000 and look for a short entry.
The chart below marks two possible paths for BTC.
This is a forecast for studying price action, not a definitive prediction of market behavior. Leave your questions about the market in the comments.
MicroStrategy’s removal is imminent. Bulls should protect their positions. Regardless of the outcome, the market is likely to see major volatility. My personal bearish view remains unchanged.
Many people seem to have a superstition about the market pricing things in ahead of time: they think that once something has been priced in, there won’t be much volatility. That’s not necessarily true. On August 5, 2024, after Japan raised interest rates, Japanese stocks plunged and BTC crashed below 50K. People thought it had already been priced in then, too. Whether MicroStrategy’s removal will drag BTC down is still an unconfirmed major bearish catalyst, so those going long should manage their position sizes carefully.
On the daily chart, after the two consecutive hammer candles mentioned previously, yesterday’s candle broke below the bodies of those hammers. The daily trend remains bearish. However, note that the decline has not been particularly smooth, and short liquidity around 77,000 is growing thicker. So there’s a chance of a rebound here to liquidate that liquidity before the price falls again.
Looking at the overall daily structure, the parabolic decline shows no signs of bottoming, and there has been no panic selling. Meanwhile, a large amount of long-position liquidity at 63,000 is attracting the price.
In my system, I would under no circumstances take profit on my short positions or open any long positions in this kind of price action. So I’ll still leave my take-profit order at 63,000. For options, I’ll watch the funding rate and market structure for confirmation before considering taking profit.
Looking at the data,
The dip-buying crowd still hasn’t given up on BTC, and funding rates remain high, which is also consistent with the characteristics of a ranging market.
Why do I say this is characteristic of a ranging market?
Because many people lose their capital in a range: they short at 60,000 and BTC surges; they go long at 80,000 and BTC plunges. This can wipe many people out, but that’s trading.
If I weren’t already holding a position, I wouldn’t trade near the current price. I’d watch for resistance around 77,000 and look for a short entry.
The chart below marks two possible paths for BTC.
This is a forecast for studying price action, not a definitive prediction of market behavior. Leave your questions about the market in the comments.
景定远
·
--
Bearish$BTC 11.10 Outlook on the Future Trend
In a downtrend, a hammer candle does not signal a reversal. Stay with the trend and keep looking for shorts.
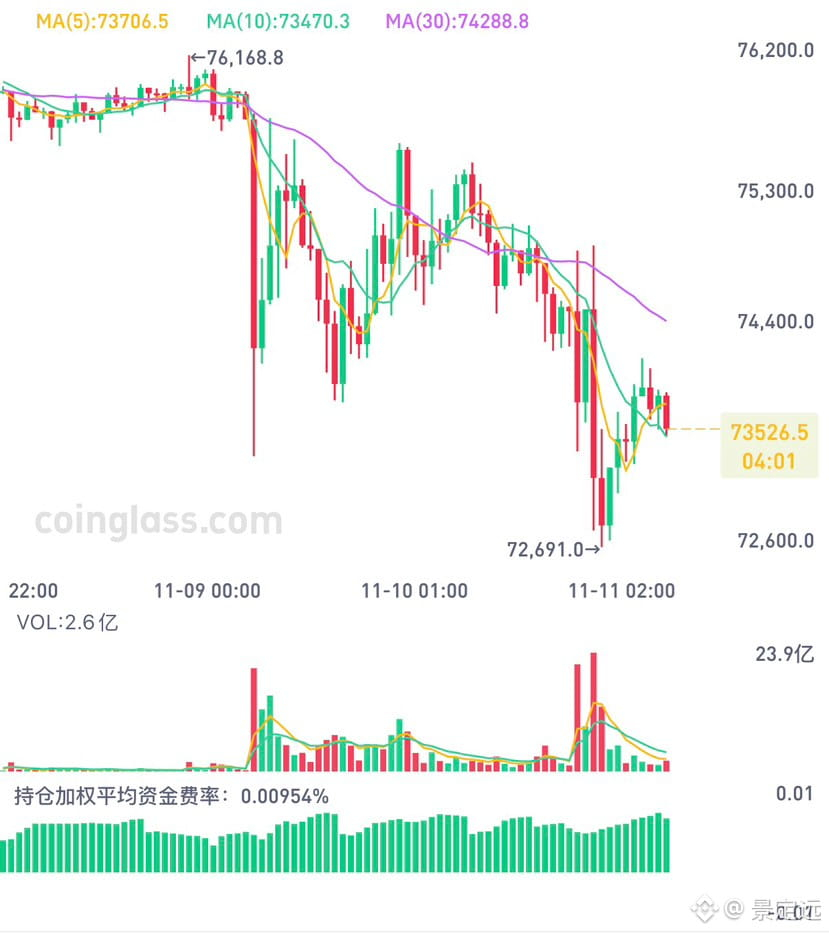
Many people say their timelines are all showing short positions, but I don't agree. Derivatives data shows a BTC long/short ratio above 3, while funding rates remain persistently high. Longs have been paying hefty funding fees. Clearly, the data shows that longs have an overwhelming numerical advantage. As mentioned earlier, the bulls have already fired all their bullets at this level.
On the daily chart, BTC has formed two consecutive hammer candles here, one bearish and one bullish. Many traders misunderstand hammer candles and see them as bullish. But I want to point out that a hammer in either a downtrend or an uptrend is not a reversal signal candle; it is not a reason to go long. Only if the daily hammer is broken above and followed by a convincing move would I consider that the downtrend might see a bounce after two bullish candles—not a reversal, since the preceding decline was strong.
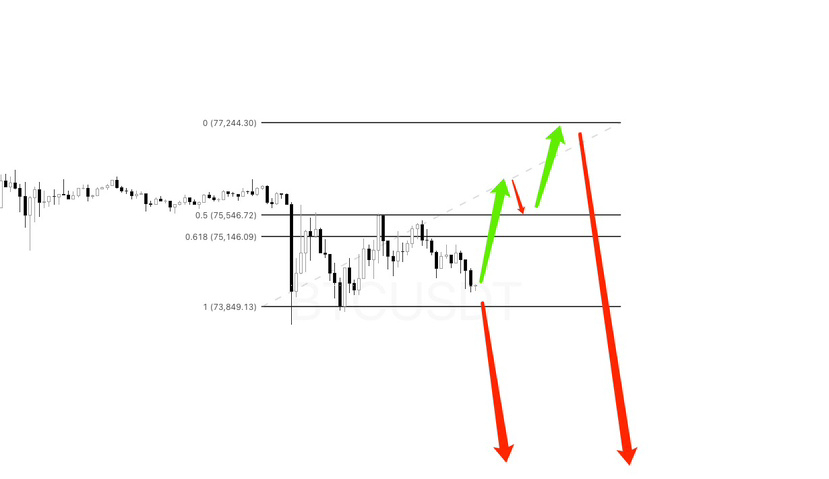
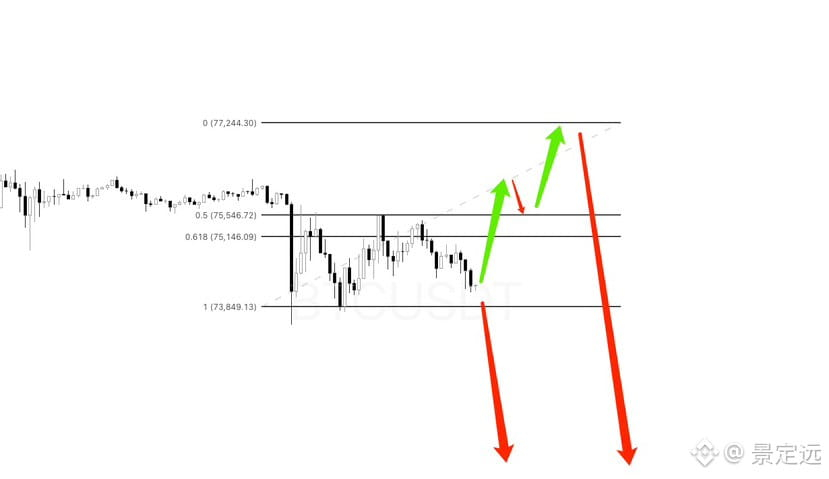
On the hourly chart, BTC has formed a small trading range without a breakout. Funding rates are also elevated within this range, so my subjective view is that this is still a bull trap. BTC could break upward into the 76500–77300 range. I call it a bull trap because if price rises, dip-buying bulls may think the bull market is back and won't take profits.
A breakout also requires the big players to cooperate. Strong downtrends rarely produce bounces. Making money from trading requires the right timing, place, and people—all of them.
The big players have been very crafty lately. Shorts who haven't entered are either caught in a major squeeze or can't get a short position filled at the liquidation level. This is exactly when traders need to be patient. Meanwhile, long traders have consistently been able to buy coins at a discount.
If I weren't holding a short position, I would look for an opportunity to short in the 76500–77300 range, then take partial profits near the previous low around 73000 and let the rest run to see whether price cascades lower after breaking 73000.
For a long, I would wait for BTC to break above around 75500 and then hold on a retest, before taking a short-term long on the right side of the chart, aiming for a move of around 1000 points.
Short target: 63000. I've been waiting a long time.
This forecast is for trend analysis, not a definitive statement about market behavior. Leave any questions about the market in the comments.
In a downtrend, a hammer candle does not signal a reversal. Stay with the trend and keep looking for shorts.
Many people say their timelines are all showing short positions, but I don't agree. Derivatives data shows a BTC long/short ratio above 3, while funding rates remain persistently high. Longs have been paying hefty funding fees. Clearly, the data shows that longs have an overwhelming numerical advantage. As mentioned earlier, the bulls have already fired all their bullets at this level.
On the daily chart, BTC has formed two consecutive hammer candles here, one bearish and one bullish. Many traders misunderstand hammer candles and see them as bullish. But I want to point out that a hammer in either a downtrend or an uptrend is not a reversal signal candle; it is not a reason to go long. Only if the daily hammer is broken above and followed by a convincing move would I consider that the downtrend might see a bounce after two bullish candles—not a reversal, since the preceding decline was strong.
On the hourly chart, BTC has formed a small trading range without a breakout. Funding rates are also elevated within this range, so my subjective view is that this is still a bull trap. BTC could break upward into the 76500–77300 range. I call it a bull trap because if price rises, dip-buying bulls may think the bull market is back and won't take profits.
A breakout also requires the big players to cooperate. Strong downtrends rarely produce bounces. Making money from trading requires the right timing, place, and people—all of them.
The big players have been very crafty lately. Shorts who haven't entered are either caught in a major squeeze or can't get a short position filled at the liquidation level. This is exactly when traders need to be patient. Meanwhile, long traders have consistently been able to buy coins at a discount.
If I weren't holding a short position, I would look for an opportunity to short in the 76500–77300 range, then take partial profits near the previous low around 73000 and let the rest run to see whether price cascades lower after breaking 73000.
For a long, I would wait for BTC to break above around 75500 and then hold on a retest, before taking a short-term long on the right side of the chart, aiming for a move of around 1000 points.
Short target: 63000. I've been waiting a long time.
This forecast is for trend analysis, not a definitive statement about market behavior. Leave any questions about the market in the comments.
景定远
·
--
Bearish$BTC 11.09 Outlook on the future trend
Traders should guard against a cascading BTC drop to 63000 that could liquidate their positions. I’ll take profit on all three of my short positions at 63000.
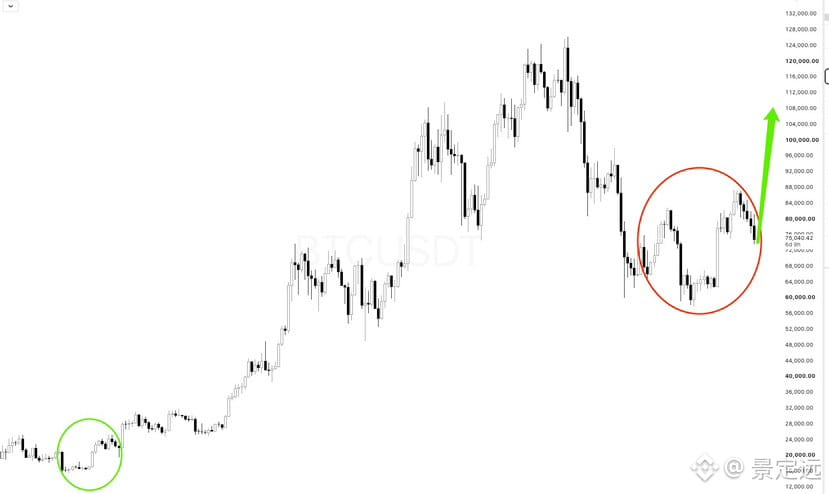
Looking at the daily chart, BTC’s rise from the 62800 low to -78000 has been very smooth. You could say this stretch is a vacuum zone, so a drop below 73000 is likely to be just as smooth, with a strong chance of cascading down to 63000.
Looking at the liquidation map, the higher-timeframe map shows a large number of long liquidation positions in the 60000–63000 range. Liquidation zones can attract price, but they can’t determine where it goes. When they align with the trend, however, their accuracy can be very high.
Looking at price action, after BTC fell through the previous candle that surged above 80000, it gave a strong follow-through signal. That’s bearish price action.
So I’m continuing to hold my short positions. If I didn’t have any positions today at this level, I’d be very cautious, for two reasons.
BTC has already fallen from 84500 to 73500. If the target is above 62000, the move is already halfway done. If you want to bet on a move down to 60000, placing a stop loss is very difficult. For 10000 points of potential profit, a 2:1 risk-reward ratio means your stop would need to be 5000 points away.
If BTC starts to rebound here, traders chasing the short will have a rough time.
So it comes down to your risk tolerance. If it were me, I’d place a short in the 76500–77000 range, where liquidation levels and the price pattern create resistance. Even at these levels, BTC would have to cooperate. If you’d traded the whole move from 87000 to 74000, you’d find that shorting either leaves you thousands of points underwater or gives you no opportunity at all.
73000 is the last support for the bulls. If it breaks, I’m only looking at 63000. If you’re planning to go long, be prepared—don’t let an extreme move liquidate you. As long as you’re in the market, there will always be opportunities.
Traders should guard against a cascading BTC drop to 63000 that could liquidate their positions. I’ll take profit on all three of my short positions at 63000.
Looking at the daily chart, BTC’s rise from the 62800 low to -78000 has been very smooth. You could say this stretch is a vacuum zone, so a drop below 73000 is likely to be just as smooth, with a strong chance of cascading down to 63000.
Looking at the liquidation map, the higher-timeframe map shows a large number of long liquidation positions in the 60000–63000 range. Liquidation zones can attract price, but they can’t determine where it goes. When they align with the trend, however, their accuracy can be very high.
Looking at price action, after BTC fell through the previous candle that surged above 80000, it gave a strong follow-through signal. That’s bearish price action.
So I’m continuing to hold my short positions. If I didn’t have any positions today at this level, I’d be very cautious, for two reasons.
BTC has already fallen from 84500 to 73500. If the target is above 62000, the move is already halfway done. If you want to bet on a move down to 60000, placing a stop loss is very difficult. For 10000 points of potential profit, a 2:1 risk-reward ratio means your stop would need to be 5000 points away.
If BTC starts to rebound here, traders chasing the short will have a rough time.
So it comes down to your risk tolerance. If it were me, I’d place a short in the 76500–77000 range, where liquidation levels and the price pattern create resistance. Even at these levels, BTC would have to cooperate. If you’d traded the whole move from 87000 to 74000, you’d find that shorting either leaves you thousands of points underwater or gives you no opportunity at all.
73000 is the last support for the bulls. If it breaks, I’m only looking at 63000. If you’re planning to go long, be prepared—don’t let an extreme move liquidate you. As long as you’re in the market, there will always be opportunities.
Log in to explore more content