$BTC 11.12 Future Market Outlook
Long-term bearish, stay put; short-term, watch for a rebound and look for buying opportunities. Four ways to trade.
On the daily chart, yesterday closed with a range-bound candlestick. This does not affect the bearish trend. But looking at the bigger picture, the daily downtrend is getting steeper and steeper. In a move like this, traders need to guard against a sharp sell-off climax in the downtrend. Although BTC has fallen from 84000 to 72000, there has still been no panic selling, so stay alert for a sharp drop if bulls give up on the daily timeframe.
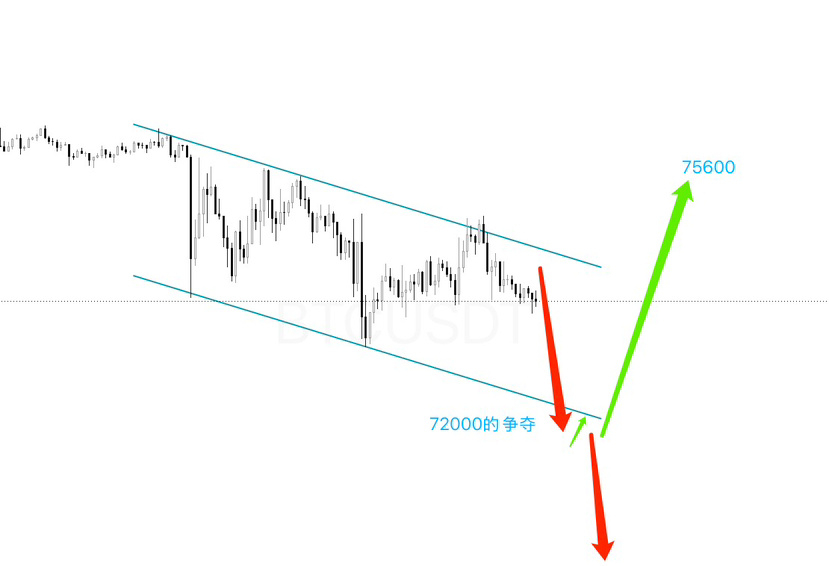
The one-hour chart looks a little different. The current decline appears to be a broad-channel downtrend. {I’ll cover broad channels in a dedicated update on the three-stage trading method; check the pinned post on my profile.} Put simply, a broad-channel decline on the hourly chart is bullish behavior. If the downtrend were strong, bulls wouldn’t keep buying the market back time and again, forming a downward-sloping trading range. So this is bullish.
The daily chart being bearish while the hourly chart is bullish is not contradictory, because the hourly rise may simply be a daily-chart rebound, or even just a wick.
When the market is complicated, trading gets complicated too. Here are four ways to trade in the short term:
1) If you didn’t short when my post earlier today signaled resistance at 74000, you can look to short again at the upper boundary of the broad channel, taking profit near support at 72000.
2) If BTC briefly breaks below the bottom of the broad channel and then recovers, traders can go long near the bottom in the direction of the move, taking profit around 75600.
3) If price breaks below the broad channel and fails to recover, then breaks below the low again, traders can short on confirmation, taking at least partial profits at 70000 and watching 63000 with the remainder.
4) If BTC rises without falling and breaks above the broad channel, traders can use the channel’s upper boundary to enter a breakout-and-retest long.
In my morning update, I noted resistance above 74000. The current price is 73400. I’m holding my long-term short position unchanged. Bearish liquidity around 77000 is getting thicker and thicker, and I’m still quite keen to add to my position on a rebound.
This forecast is for studying market trends and does not determine market behavior. If you have questions about the market, leave a comment.
Long-term bearish, stay put; short-term, watch for a rebound and look for buying opportunities. Four ways to trade.
On the daily chart, yesterday closed with a range-bound candlestick. This does not affect the bearish trend. But looking at the bigger picture, the daily downtrend is getting steeper and steeper. In a move like this, traders need to guard against a sharp sell-off climax in the downtrend. Although BTC has fallen from 84000 to 72000, there has still been no panic selling, so stay alert for a sharp drop if bulls give up on the daily timeframe.
The one-hour chart looks a little different. The current decline appears to be a broad-channel downtrend. {I’ll cover broad channels in a dedicated update on the three-stage trading method; check the pinned post on my profile.} Put simply, a broad-channel decline on the hourly chart is bullish behavior. If the downtrend were strong, bulls wouldn’t keep buying the market back time and again, forming a downward-sloping trading range. So this is bullish.
The daily chart being bearish while the hourly chart is bullish is not contradictory, because the hourly rise may simply be a daily-chart rebound, or even just a wick.
When the market is complicated, trading gets complicated too. Here are four ways to trade in the short term:
1) If you didn’t short when my post earlier today signaled resistance at 74000, you can look to short again at the upper boundary of the broad channel, taking profit near support at 72000.
2) If BTC briefly breaks below the bottom of the broad channel and then recovers, traders can go long near the bottom in the direction of the move, taking profit around 75600.
3) If price breaks below the broad channel and fails to recover, then breaks below the low again, traders can short on confirmation, taking at least partial profits at 70000 and watching 63000 with the remainder.
4) If BTC rises without falling and breaks above the broad channel, traders can use the channel’s upper boundary to enter a breakout-and-retest long.
In my morning update, I noted resistance above 74000. The current price is 73400. I’m holding my long-term short position unchanged. Bearish liquidity around 77000 is getting thicker and thicker, and I’m still quite keen to add to my position on a rebound.
This forecast is for studying market trends and does not determine market behavior. If you have questions about the market, leave a comment.