


Three-Stage Trading Method, Part 1: The Key to Candlestick Strength
Prologue: Pinned to the Homepage
Every candlestick represents a complete battle between bulls and bears!
To understand the strength of candlesticks and patterns, traders must grasp a fundamental concept: fractals. What is a fractal?
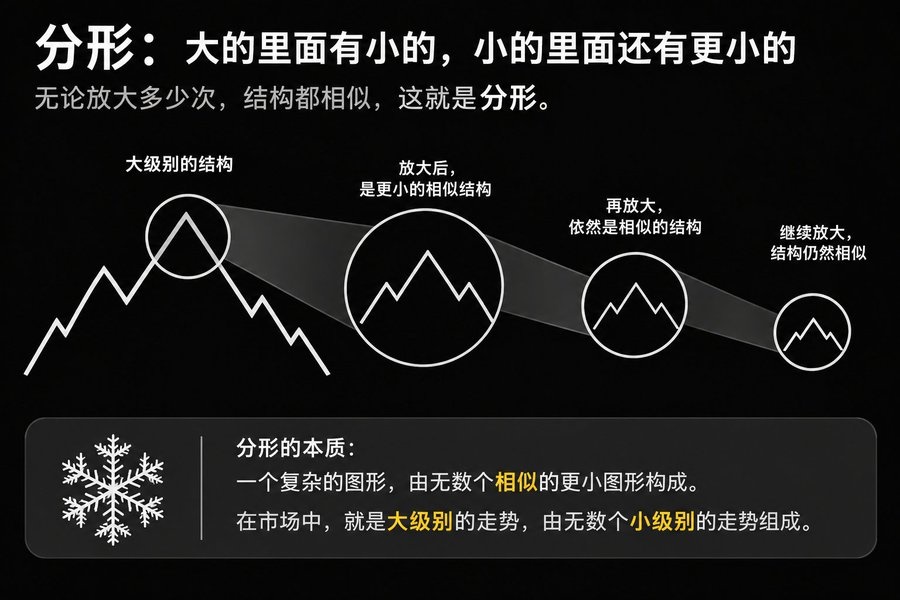
You should know that every candlestick on the timeframe we're looking at is, on a lower timeframe, either a consolidation range, a trend, or a V-shaped reversal. Once you truly understand the fractal nature of candlesticks, you'll know why some patterns are strong and others are weak. Take the well-known hammer candlestick, for example: it's a classic signal candle.
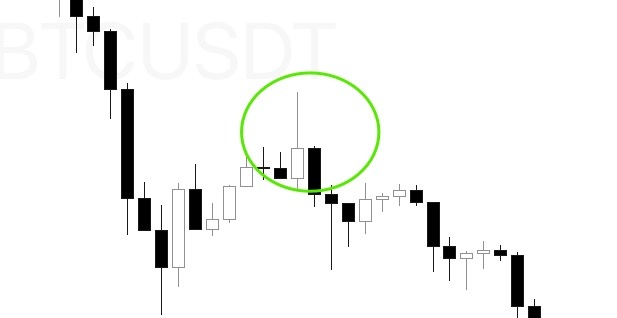
So why does a hammer become a signal candle?
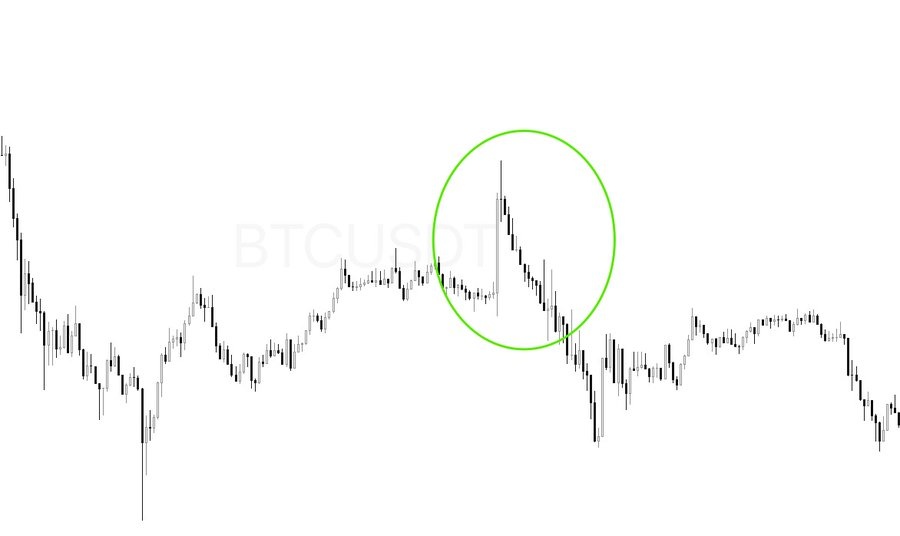
Because on a lower timeframe, it is a V-shaped reversal.
Now that we understand the concept of fractals, let’s look at candlestick strength.
1: Sideways candlestick: the candle closes in the 0–20% range
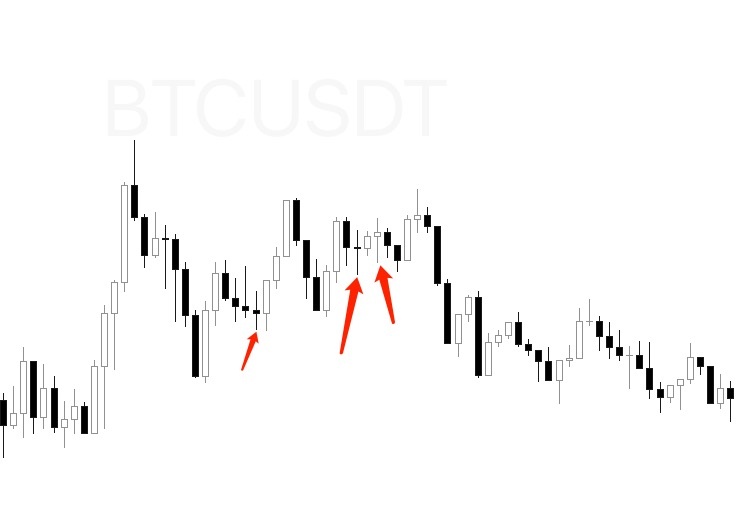
If we use the concept of fractals to understand this, then on a lower timeframe, the price action of a sideways candlestick is also sideways. So this is a sideways candle with little significance, right?
Not quite. This is where we need to bring in market context. If the previous candle has just broken through resistance and the next candle closes as a doji, then this doji gives us important information:
“The bears are unable to push the price down. This is most likely not a false breakout.”
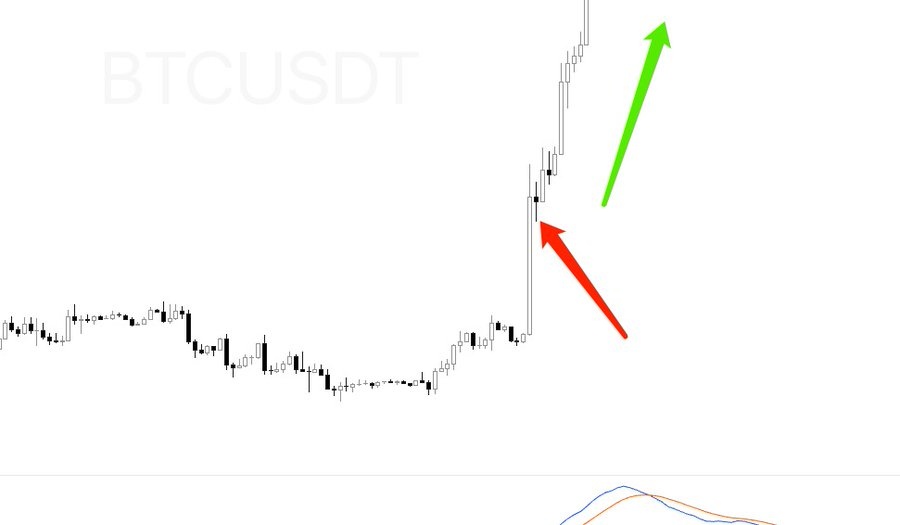
That means traders can go long after this candle. So, the strength of a sideways candlestick depends on its context. If the price is already in a sideways range, the candle has little significance and is more likely to maintain the existing price action.
2: Half-trend candlestick: the candle closes in the 20–80% range
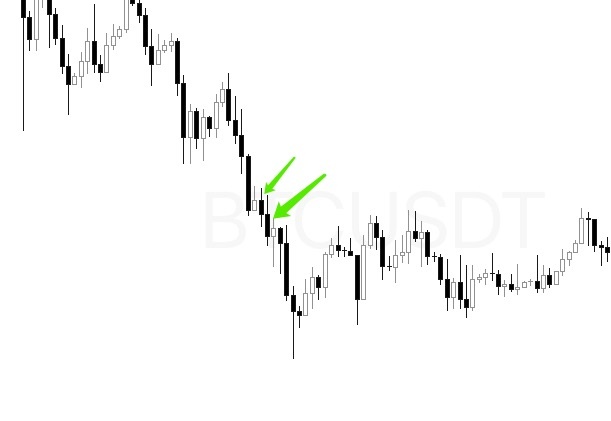
I call it a “half-trend candlestick” because I think this term is easier for Chinese-speaking traders to understand. A half-trend candle has a clear bullish or bearish direction, but its price action is not entirely one-sided. As a confirmation candle for a signal candle, it works better than a sideways candlestick.
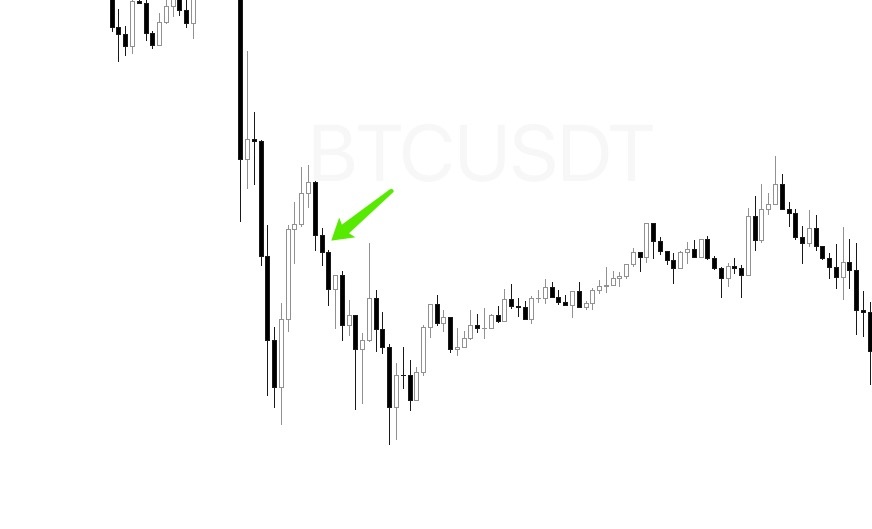
But a half-trend candlestick can become a signal candle only in a few situations. For example, when the market context is strongly bullish—that is, when the only trade to take is a long—you can go long for any reason. The same applies to shorting. Otherwise, I wouldn’t use this kind of candle as a trading opportunity.
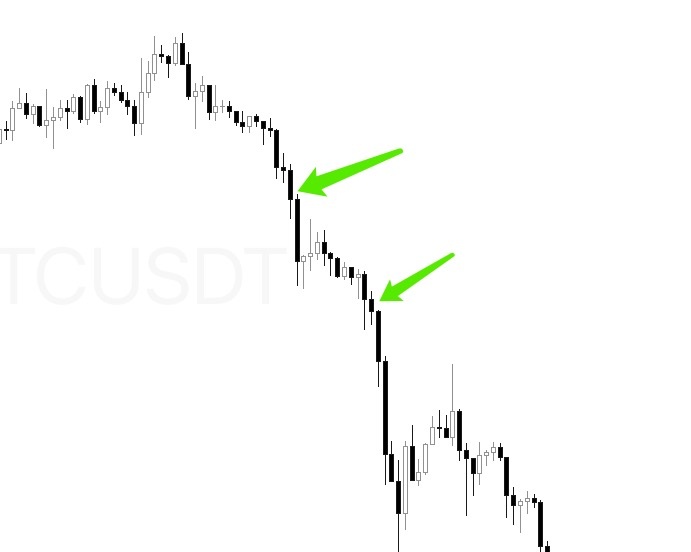
3: Trend candlestick: the candle closes in the 80–100% range
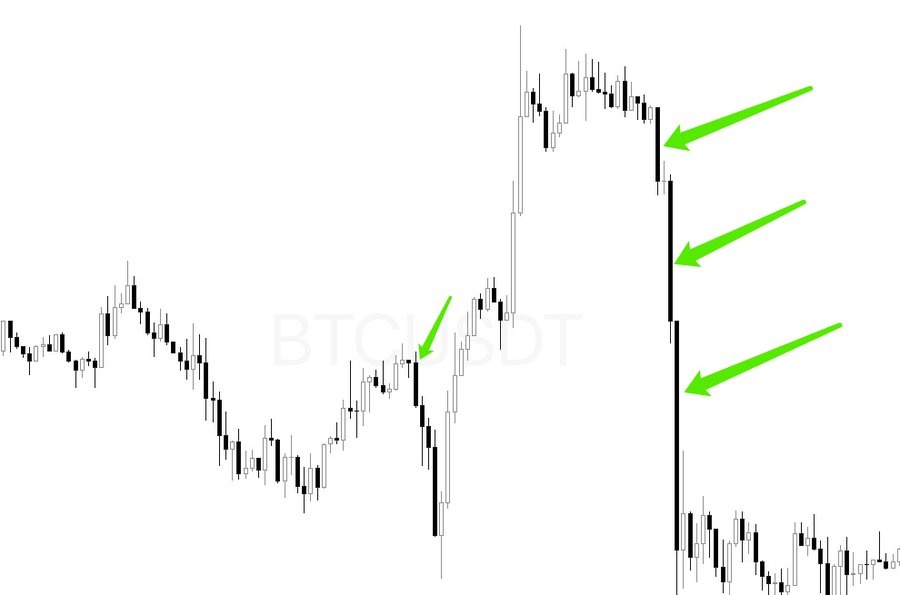
A trend candlestick is the strongest kind of candle. You can also call it a breakout candle. It is often used as a signal candle. Why?
If you look at a large bullish candle on a lower timeframe, it is a very strong trend that doesn’t look back.
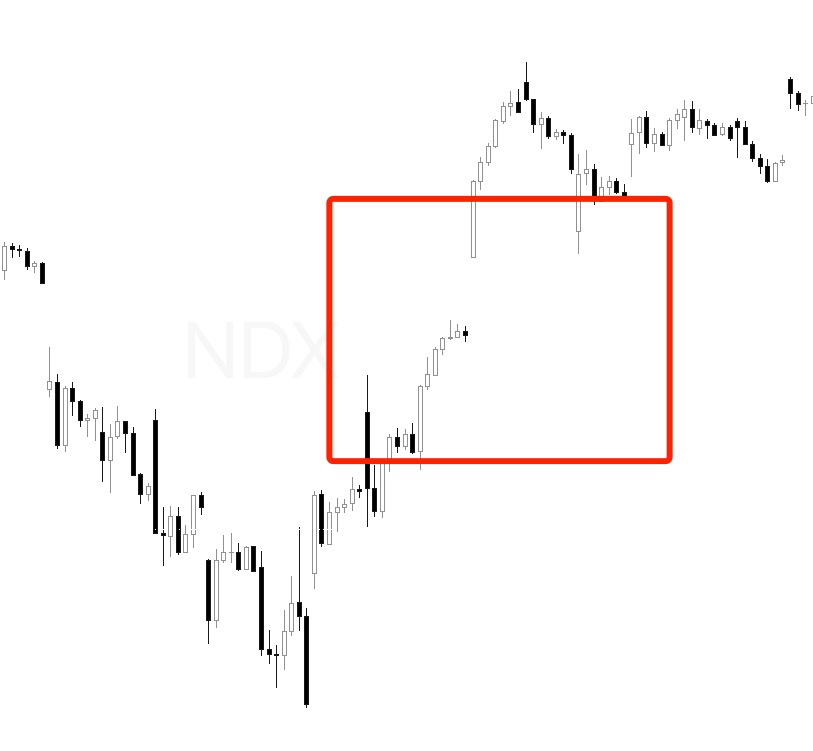
These types of candles can definitely be used as signal candles when they appear in a breakout from a sideways range or when a bottom turns bullish. But, as you can see, some trend candles break out and reverse direction—in fact, these are false breakouts. This shows the importance of follow-through, including follow-through after sideways and half-trend candles. (If the breakout is false, the opposing side will quickly push the price back. If it can’t, the price is more likely to maintain its original direction.) See the chart below.
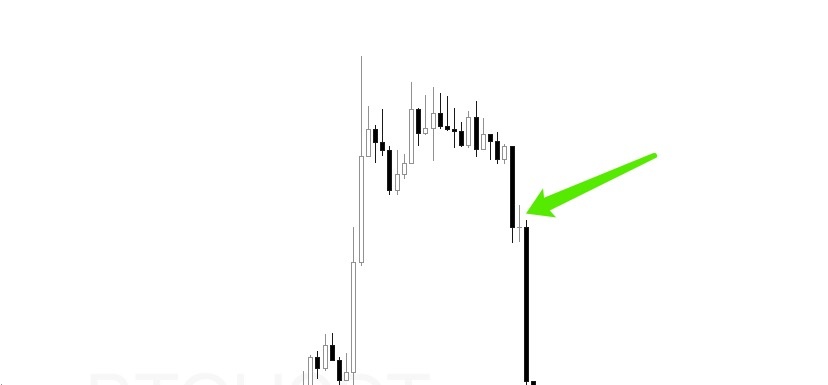
So, the first thing traders need to grasp in this article is not fractals or candlestick patterns, but the principle behind someone telling you to go long on one pattern and short on another. If you don’t understand the principle and simply follow rigid rules about which patterns to buy or sell, you may never achieve results, because your trading will be mechanical.
A line spoken by Sima Yi in Romance of the Three Kingdoms: “The way to conduct oneself in the world is to adapt to change.” I think trading is the same.
Second, fractals. Once you understand fractals, you can understand the essence of what a signal candle is. On a lower timeframe, a hammer is a strong V-shaped reversal signal; a large bullish candle represents a bull market; and a sideways candlestick represents a sideways market. Please fully grasp this point—it will be a great help later when looking for signal candles and developing a foundational understanding of trading.
Candlestick strength is relative. In other words, we need to introduce the concept of context. What is context?
For example, you know that a friend of yours has been working for a long time in a scam compound and hasn’t come home. One day, they suddenly call you and, in a friendly tone, tell you that the pay is great and that there’s money and women there, and invite you to work there. You certainly wouldn’t go, because you know the risk and reward are not in proportion.
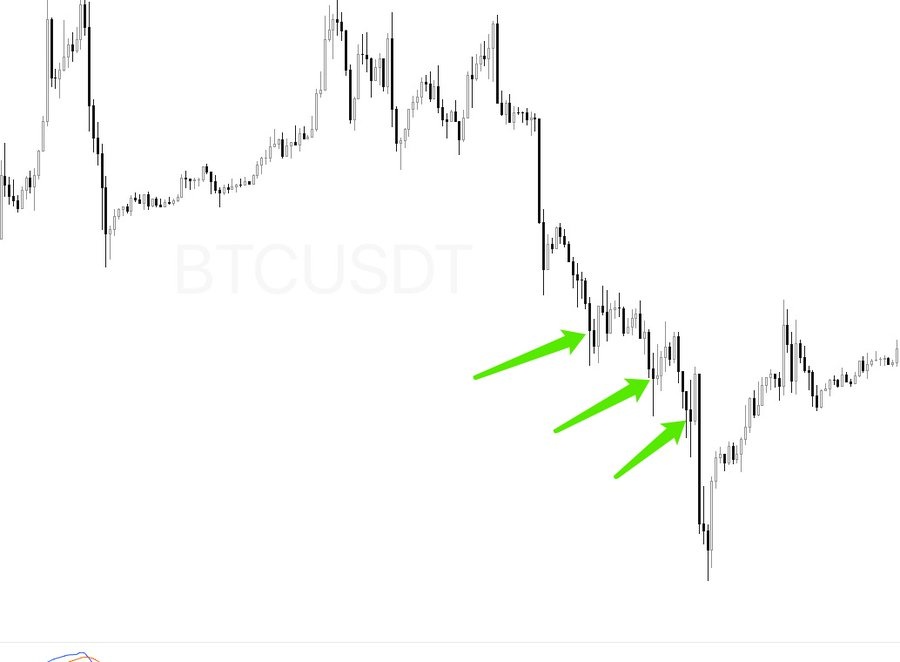
Yet many people look for signal candles to buy the dip during a strong downtrend, and end up getting stopped out again and again. Looking at a candlestick pattern without considering its context has very little value.
A real-world example:
In a downtrend, if a hammer has an upper wick and then breaks downward, that hammer can become your signal candle to go short.
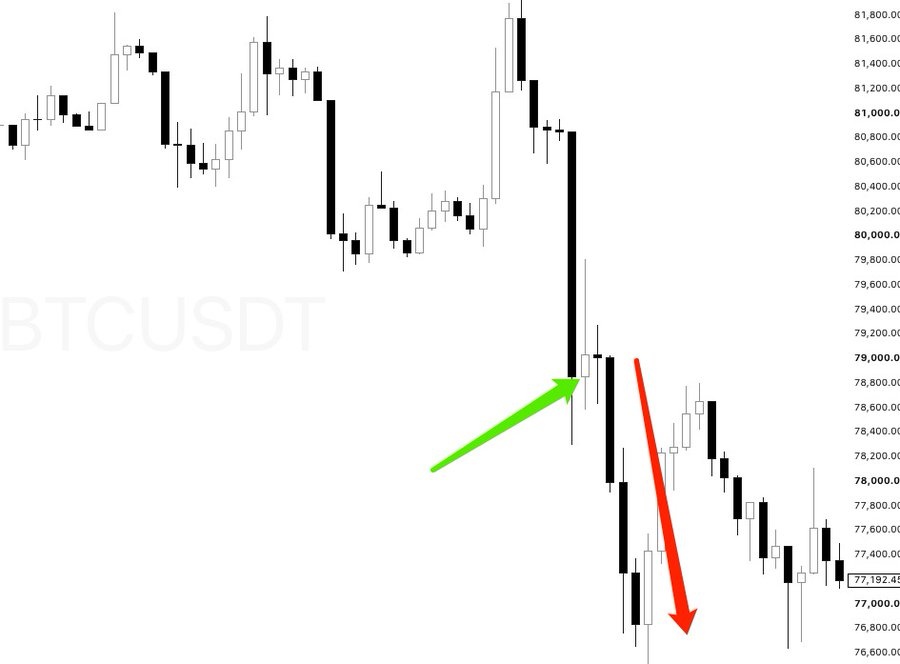
If a hammer has a lower wick and then breaks upward, I see this only as a temporary pause. The downtrend is not over. It becomes profitable to go long only after the bears make another attempt to push the price lower, fail, and the price breaks upward.
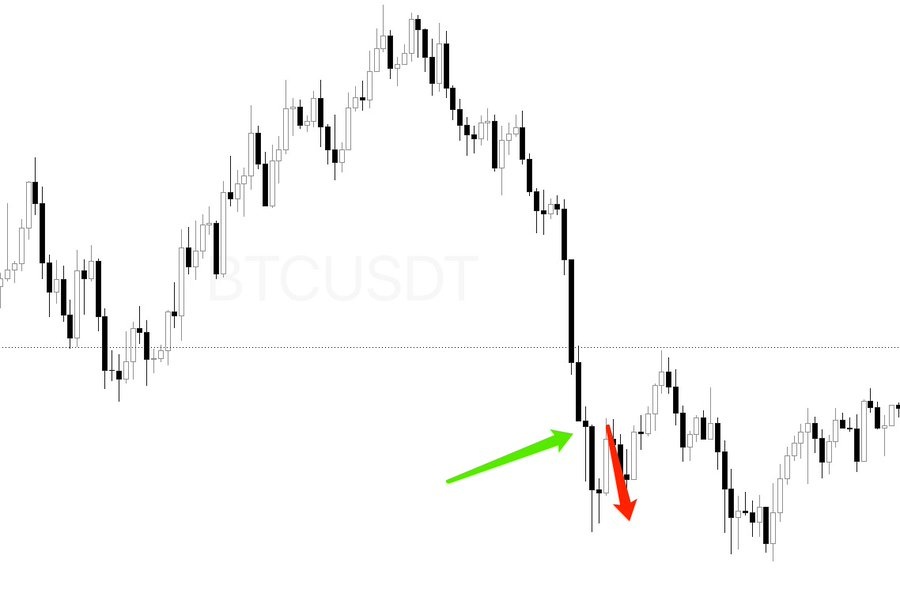
This article covers the candlestick basics of the three-stage trading method. In fact, these are also the basics of all trading techniques. I’ve simply distilled them, using the simplest words and diagrams to help traders understand the essence of candlestick logic.
Why do I say this?
Many books, in fact, have only a few key points to make, yet they turn them into an entire book. I won’t let my work become like theirs.
Please stay tuned. Visit my profile to connect and learn more.
Next time, we’ll move on to the practical section: how to find signal candles.