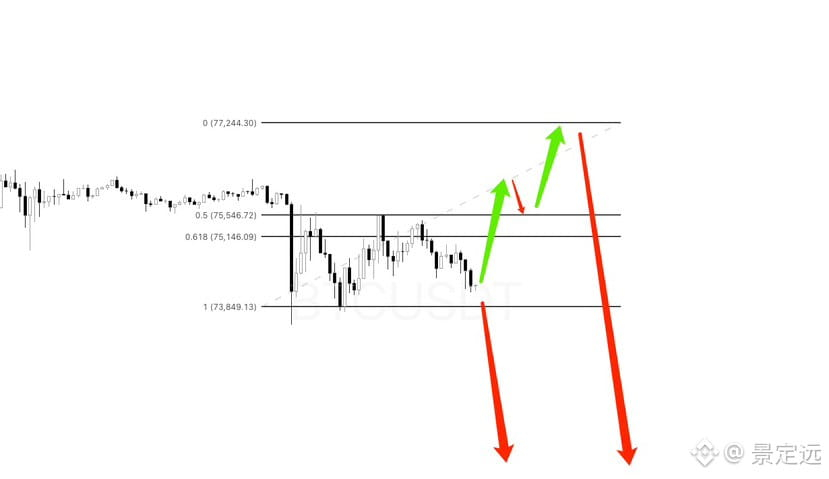
$BTC 11.10 Outlook on the Future Trend
In a downtrend, a hammer candle does not signal a reversal. Stay with the trend and keep looking for shorts.
Many people say their timelines are all showing short positions, but I don't agree. Derivatives data shows a BTC long/short ratio above 3, while funding rates remain persistently high. Longs have been paying hefty funding fees. Clearly, the data shows that longs have an overwhelming numerical advantage. As mentioned earlier, the bulls have already fired all their bullets at this level.
On the daily chart, BTC has formed two consecutive hammer candles here, one bearish and one bullish. Many traders misunderstand hammer candles and see them as bullish. But I want to point out that a hammer in either a downtrend or an uptrend is not a reversal signal candle; it is not a reason to go long. Only if the daily hammer is broken above and followed by a convincing move would I consider that the downtrend might see a bounce after two bullish candles—not a reversal, since the preceding decline was strong.
On the hourly chart, BTC has formed a small trading range without a breakout. Funding rates are also elevated within this range, so my subjective view is that this is still a bull trap. BTC could break upward into the 76500–77300 range. I call it a bull trap because if price rises, dip-buying bulls may think the bull market is back and won't take profits.
A breakout also requires the big players to cooperate. Strong downtrends rarely produce bounces. Making money from trading requires the right timing, place, and people—all of them.
The big players have been very crafty lately. Shorts who haven't entered are either caught in a major squeeze or can't get a short position filled at the liquidation level. This is exactly when traders need to be patient. Meanwhile, long traders have consistently been able to buy coins at a discount.
If I weren't holding a short position, I would look for an opportunity to short in the 76500–77300 range, then take partial profits near the previous low around 73000 and let the rest run to see whether price cascades lower after breaking 73000.
For a long, I would wait for BTC to break above around 75500 and then hold on a retest, before taking a short-term long on the right side of the chart, aiming for a move of around 1000 points.
Short target: 63000. I've been waiting a long time.
This forecast is for trend analysis, not a definitive statement about market behavior. Leave any questions about the market in the comments.
In a downtrend, a hammer candle does not signal a reversal. Stay with the trend and keep looking for shorts.
Many people say their timelines are all showing short positions, but I don't agree. Derivatives data shows a BTC long/short ratio above 3, while funding rates remain persistently high. Longs have been paying hefty funding fees. Clearly, the data shows that longs have an overwhelming numerical advantage. As mentioned earlier, the bulls have already fired all their bullets at this level.
On the daily chart, BTC has formed two consecutive hammer candles here, one bearish and one bullish. Many traders misunderstand hammer candles and see them as bullish. But I want to point out that a hammer in either a downtrend or an uptrend is not a reversal signal candle; it is not a reason to go long. Only if the daily hammer is broken above and followed by a convincing move would I consider that the downtrend might see a bounce after two bullish candles—not a reversal, since the preceding decline was strong.
On the hourly chart, BTC has formed a small trading range without a breakout. Funding rates are also elevated within this range, so my subjective view is that this is still a bull trap. BTC could break upward into the 76500–77300 range. I call it a bull trap because if price rises, dip-buying bulls may think the bull market is back and won't take profits.
A breakout also requires the big players to cooperate. Strong downtrends rarely produce bounces. Making money from trading requires the right timing, place, and people—all of them.
The big players have been very crafty lately. Shorts who haven't entered are either caught in a major squeeze or can't get a short position filled at the liquidation level. This is exactly when traders need to be patient. Meanwhile, long traders have consistently been able to buy coins at a discount.
If I weren't holding a short position, I would look for an opportunity to short in the 76500–77300 range, then take partial profits near the previous low around 73000 and let the rest run to see whether price cascades lower after breaking 73000.
For a long, I would wait for BTC to break above around 75500 and then hold on a retest, before taking a short-term long on the right side of the chart, aiming for a move of around 1000 points.
Short target: 63000. I've been waiting a long time.
This forecast is for trend analysis, not a definitive statement about market behavior. Leave any questions about the market in the comments.