

小恐龙说趋势
419 Posts
 LIVE
LIVE小恐龙说趋势
Report
Block User
X:XiaoKongLong_88 , 6 年加密市场经历 , 牛市里见过疯狂,熊市里见过人性
6 Following
2.0K+ Followers
2.4K+ Liked
Posts
All
Live
·
--
#比特币跌破8.4万美元
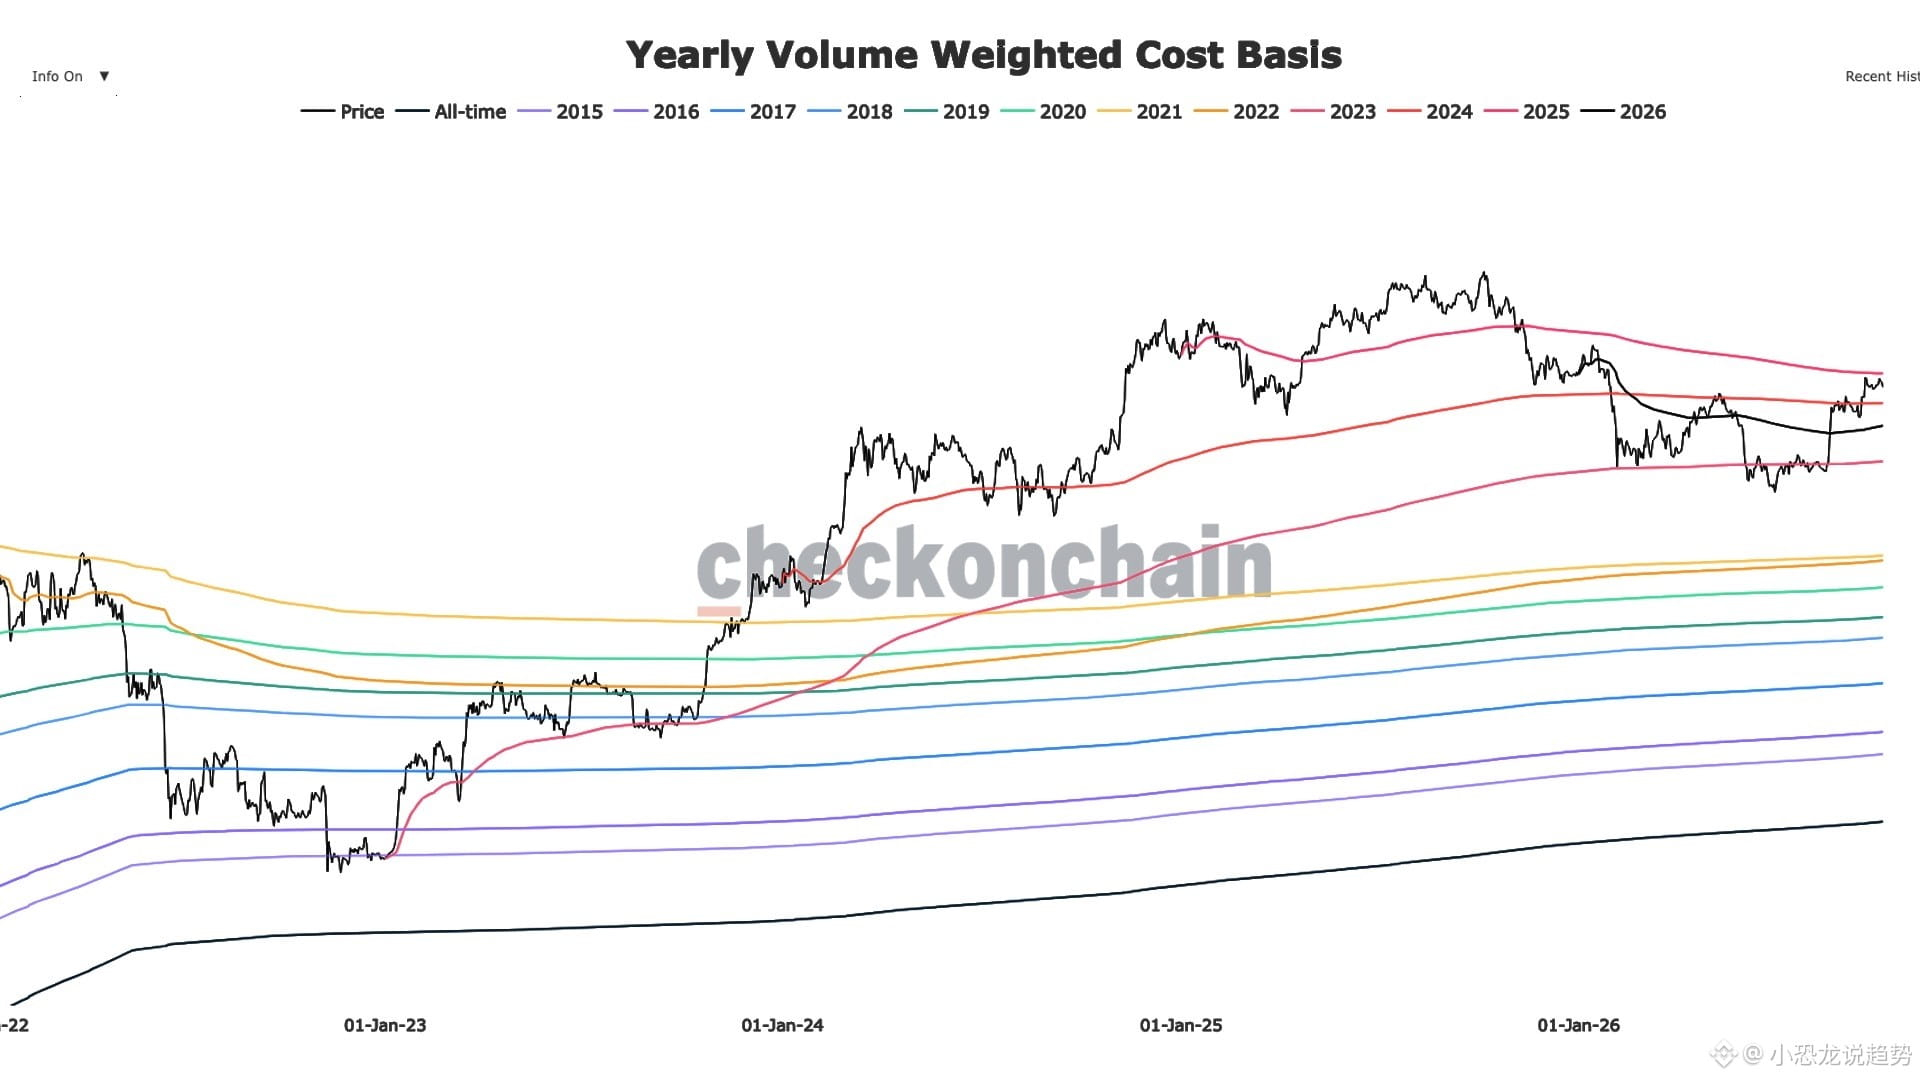
Below $84,000, only the latest cohort of buyers across the market is still underwater—and their cost basis happens to be $88,000 🦖
[📈 进群一起分析行情](https://app.binance.com/uni-qr/JpwCPfBj)
On October 7, Bitcoin slid from its September high of $87,500 to below $84,000. On-chain data provider checkonchain laid out the average cost basis of buyers across different years. The result: only the 2025 cohort is still underwater, with an average purchase price of around $88,000.
In other words, the current price is still about $4,000 short of their break-even point. These aren’t the oldest buyers, but the newest cohort. Their cost basis is right overhead, creating sell pressure from investors looking to break even. That’s why $88,000 has suddenly become so difficult to break through.
Looking lower, support levels aren’t just drawn at random. The average cost basis for U.S. spot Bitcoin ETFs is $82,300. This figure represents the average cost of all capital invested through ETF creations. ETF investors have only just returned to profit this year. If the price falls further, some may choose to add to their positions rather than sell at a loss.
There are two more levels below. Buyers who entered in 2026 have an average cost basis of about $73,500. They’ve been in profit ever since Bitcoin moved above that level in late August. Buyers from 2023 have a cost basis of around $65,000. That level held repeatedly during the 2026 bear market, with the price dipping below it for only a very short time 📉
The most interesting part is the historical pattern. The 2024 cohort’s cost basis is around $82,100. In May this year, Bitcoin was rejected at $82,100 and fell all the way to $60,000, only reclaiming that level in August. In other words, the same cost-basis level first acted as resistance, then as support, within six months ⚖️
My take: Bitcoin is currently caught between two levels. Above is the $88,000 break-even sell pressure from 2025 buyers; below is the ETF cost basis at $82,300. As long as the price doesn’t break below the lower level on heavy volume, consolidation is likely to remain the main trend. For a real change in direction, watch whether ETF flows continue to provide support or start to weaken 📊
When did you enter the market? Is your cost basis above or below $88,000? Let’s talk in the comments 🦖
Tap the profile picture to watch the livestream
Every day, I’ll keep you up to date on Bitcoin’s hot topics—not just what’s happening in the news, but also the logic and opportunities behind it 👀🚀
#比特币跌破8.4万美元
Below $84,000, only the latest cohort of buyers across the market is still underwater—and their cost basis happens to be $88,000 🦖
📈 进群一起分析行情
On October 7, Bitcoin slid from its September high of $87,500 to below $84,000. On-chain data provider checkonchain laid out the average cost basis of buyers across different years. The result: only the 2025 cohort is still underwater, with an average purchase price of around $88,000.
In other words, the current price is still about $4,000 short of their break-even point. These aren’t the oldest buyers, but the newest cohort. Their cost basis is right overhead, creating sell pressure from investors looking to break even. That’s why $88,000 has suddenly become so difficult to break through.
Looking lower, support levels aren’t just drawn at random. The average cost basis for U.S. spot Bitcoin ETFs is $82,300. This figure represents the average cost of all capital invested through ETF creations. ETF investors have only just returned to profit this year. If the price falls further, some may choose to add to their positions rather than sell at a loss.
There are two more levels below. Buyers who entered in 2026 have an average cost basis of about $73,500. They’ve been in profit ever since Bitcoin moved above that level in late August. Buyers from 2023 have a cost basis of around $65,000. That level held repeatedly during the 2026 bear market, with the price dipping below it for only a very short time 📉
The most interesting part is the historical pattern. The 2024 cohort’s cost basis is around $82,100. In May this year, Bitcoin was rejected at $82,100 and fell all the way to $60,000, only reclaiming that level in August. In other words, the same cost-basis level first acted as resistance, then as support, within six months ⚖️
My take: Bitcoin is currently caught between two levels. Above is the $88,000 break-even sell pressure from 2025 buyers; below is the ETF cost basis at $82,300. As long as the price doesn’t break below the lower level on heavy volume, consolidation is likely to remain the main trend. For a real change in direction, watch whether ETF flows continue to provide support or start to weaken 📊
When did you enter the market? Is your cost basis above or below $88,000? Let’s talk in the comments 🦖
Tap the profile picture to watch the livestream
Every day, I’ll keep you up to date on Bitcoin’s hot topics—not just what’s happening in the news, but also the logic and opportunities behind it 👀🚀
Below $84,000, only the latest cohort of buyers across the market is still underwater—and their cost basis happens to be $88,000 🦖
📈 进群一起分析行情
On October 7, Bitcoin slid from its September high of $87,500 to below $84,000. On-chain data provider checkonchain laid out the average cost basis of buyers across different years. The result: only the 2025 cohort is still underwater, with an average purchase price of around $88,000.
In other words, the current price is still about $4,000 short of their break-even point. These aren’t the oldest buyers, but the newest cohort. Their cost basis is right overhead, creating sell pressure from investors looking to break even. That’s why $88,000 has suddenly become so difficult to break through.
Looking lower, support levels aren’t just drawn at random. The average cost basis for U.S. spot Bitcoin ETFs is $82,300. This figure represents the average cost of all capital invested through ETF creations. ETF investors have only just returned to profit this year. If the price falls further, some may choose to add to their positions rather than sell at a loss.
There are two more levels below. Buyers who entered in 2026 have an average cost basis of about $73,500. They’ve been in profit ever since Bitcoin moved above that level in late August. Buyers from 2023 have a cost basis of around $65,000. That level held repeatedly during the 2026 bear market, with the price dipping below it for only a very short time 📉
The most interesting part is the historical pattern. The 2024 cohort’s cost basis is around $82,100. In May this year, Bitcoin was rejected at $82,100 and fell all the way to $60,000, only reclaiming that level in August. In other words, the same cost-basis level first acted as resistance, then as support, within six months ⚖️
My take: Bitcoin is currently caught between two levels. Above is the $88,000 break-even sell pressure from 2025 buyers; below is the ETF cost basis at $82,300. As long as the price doesn’t break below the lower level on heavy volume, consolidation is likely to remain the main trend. For a real change in direction, watch whether ETF flows continue to provide support or start to weaken 📊
When did you enter the market? Is your cost basis above or below $88,000? Let’s talk in the comments 🦖
Tap the profile picture to watch the livestream
Every day, I’ll keep you up to date on Bitcoin’s hot topics—not just what’s happening in the news, but also the logic and opportunities behind it 👀🚀
31
·
--
#比特币跌破8.4万美元
Liquidations surged 235% overnight, with $547 million in leveraged positions forcibly closed—but the sell-off wasn’t driven by crypto itself 🦖
[📣 盘面异动群里喊](https://app.binance.com/uni-qr/JpwCPfBj)
In the early hours of October 7, Bitcoin fell below $84,000. The immediate cause wasn’t on-chain activity, but Iran stepping up attacks on oil tankers in the Strait of Hormuz. Brent crude surged to $101 a barrel, pushing Treasury yields and the U.S. dollar higher along with it.
The real flashpoint was the derivatives market. Over the past 24 hours, total crypto liquidations surged 235% to $547 million, with Ethereum-related positions accounting for $174 million. Ether itself was trading around $2,600, down 3.5% on the day 💥
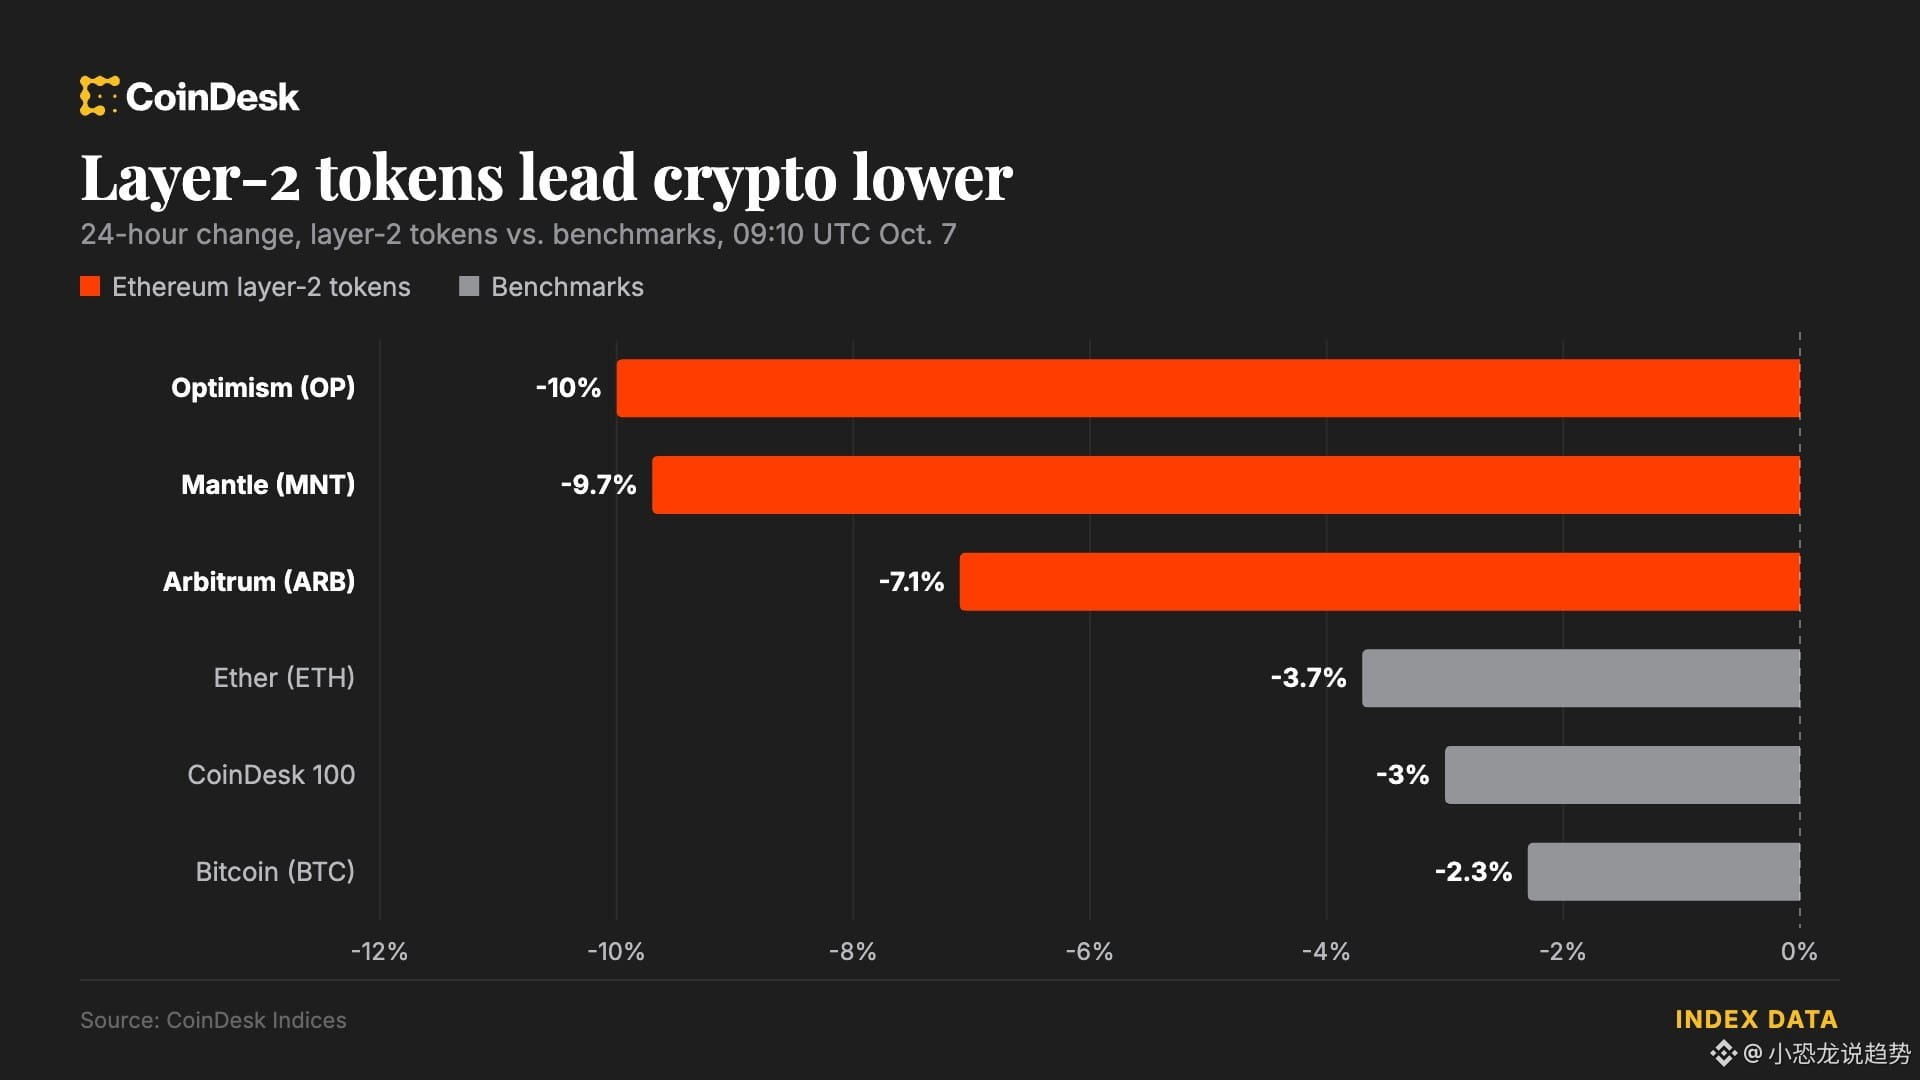
The further down the market you look, the worse it gets. The CoinDesk 80 Index, which tracks a basket of smaller coins, fell nearly 4% over 24 hours, while the CoinDesk 5, which represents the top names, dropped just 2.5%. The DeFi sector fell nearly 6%, and the meme coin index lost about 5%. Almost the only ones still rising were SAND, PUMP, and STX. This round has laid bare just how much leverage smaller coins carry 📉
One detail is especially worth considering: Spot Bitcoin ETFs still saw net inflows of $119 million on Tuesday—the fourth day of net inflows in the past five trading days. In other words, spot money is still gradually coming in. The positions being liquidated were mainly leveraged futures traders.
Now look at derivatives: 24-hour futures trading volume rose 16% to $182.85 billion, but open interest actually edged down 1% to $152.6 billion. Shorts accounted for more than 52% of taker volume. Trading picked up, open interest stayed flat, and sellers remained in control. This suggests traders aren’t opening new bullish positions; they’re readjusting their positions and picking sides ⚡
So rather than saying something has gone wrong with crypto, it’s more accurate to say the macro tide is going out. Rising oil prices, a stronger dollar, and higher Treasury yields put pressure on risk assets across the board. Bitcoin was simply no exception.
The key thing to watch next is the Federal Reserve’s September meeting minutes, due out tonight. The Fed had just raised rates by 25 basis points at that meeting, while recent weakness in employment data has led markets to see a lower probability of another hike in October. Whether the minutes strike a patient tone or still hint at one more hike before year-end could determine which way risk assets move in the short term ⚠️
My view is straightforward: $547 million in liquidations sounds alarming, but this looks more like a leverage flush than the end of the trend. The real question is whether the money that’s been gradually buying spot will still be there once the macro tensions ease 🦕
What do you think—was this a macro-driven sell-off, or is the market simply deleveraging? Let’s talk in the comments.
Tap the profile picture to watch the livestream.
Every day, I’ll help you follow the latest in crypto—not just what’s happening, but also the logic and opportunities behind it 👀🚀
#比特币跌破8.4万美元
Liquidations surged 235% overnight, with $547 million in leveraged positions forcibly closed—but the sell-off wasn’t driven by crypto itself 🦖
📣 盘面异动群里喊
In the early hours of October 7, Bitcoin fell below $84,000. The immediate cause wasn’t on-chain activity, but Iran stepping up attacks on oil tankers in the Strait of Hormuz. Brent crude surged to $101 a barrel, pushing Treasury yields and the U.S. dollar higher along with it.
The real flashpoint was the derivatives market. Over the past 24 hours, total crypto liquidations surged 235% to $547 million, with Ethereum-related positions accounting for $174 million. Ether itself was trading around $2,600, down 3.5% on the day 💥
The further down the market you look, the worse it gets. The CoinDesk 80 Index, which tracks a basket of smaller coins, fell nearly 4% over 24 hours, while the CoinDesk 5, which represents the top names, dropped just 2.5%. The DeFi sector fell nearly 6%, and the meme coin index lost about 5%. Almost the only ones still rising were SAND, PUMP, and STX. This round has laid bare just how much leverage smaller coins carry 📉
One detail is especially worth considering: Spot Bitcoin ETFs still saw net inflows of $119 million on Tuesday—the fourth day of net inflows in the past five trading days. In other words, spot money is still gradually coming in. The positions being liquidated were mainly leveraged futures traders.
Now look at derivatives: 24-hour futures trading volume rose 16% to $182.85 billion, but open interest actually edged down 1% to $152.6 billion. Shorts accounted for more than 52% of taker volume. Trading picked up, open interest stayed flat, and sellers remained in control. This suggests traders aren’t opening new bullish positions; they’re readjusting their positions and picking sides ⚡
So rather than saying something has gone wrong with crypto, it’s more accurate to say the macro tide is going out. Rising oil prices, a stronger dollar, and higher Treasury yields put pressure on risk assets across the board. Bitcoin was simply no exception.
The key thing to watch next is the Federal Reserve’s September meeting minutes, due out tonight. The Fed had just raised rates by 25 basis points at that meeting, while recent weakness in employment data has led markets to see a lower probability of another hike in October. Whether the minutes strike a patient tone or still hint at one more hike before year-end could determine which way risk assets move in the short term ⚠️
My view is straightforward: $547 million in liquidations sounds alarming, but this looks more like a leverage flush than the end of the trend. The real question is whether the money that’s been gradually buying spot will still be there once the macro tensions ease 🦕
What do you think—was this a macro-driven sell-off, or is the market simply deleveraging? Let’s talk in the comments.
Tap the profile picture to watch the livestream.
Every day, I’ll help you follow the latest in crypto—not just what’s happening, but also the logic and opportunities behind it 👀🚀
Liquidations surged 235% overnight, with $547 million in leveraged positions forcibly closed—but the sell-off wasn’t driven by crypto itself 🦖
📣 盘面异动群里喊
In the early hours of October 7, Bitcoin fell below $84,000. The immediate cause wasn’t on-chain activity, but Iran stepping up attacks on oil tankers in the Strait of Hormuz. Brent crude surged to $101 a barrel, pushing Treasury yields and the U.S. dollar higher along with it.
The real flashpoint was the derivatives market. Over the past 24 hours, total crypto liquidations surged 235% to $547 million, with Ethereum-related positions accounting for $174 million. Ether itself was trading around $2,600, down 3.5% on the day 💥
The further down the market you look, the worse it gets. The CoinDesk 80 Index, which tracks a basket of smaller coins, fell nearly 4% over 24 hours, while the CoinDesk 5, which represents the top names, dropped just 2.5%. The DeFi sector fell nearly 6%, and the meme coin index lost about 5%. Almost the only ones still rising were SAND, PUMP, and STX. This round has laid bare just how much leverage smaller coins carry 📉
One detail is especially worth considering: Spot Bitcoin ETFs still saw net inflows of $119 million on Tuesday—the fourth day of net inflows in the past five trading days. In other words, spot money is still gradually coming in. The positions being liquidated were mainly leveraged futures traders.
Now look at derivatives: 24-hour futures trading volume rose 16% to $182.85 billion, but open interest actually edged down 1% to $152.6 billion. Shorts accounted for more than 52% of taker volume. Trading picked up, open interest stayed flat, and sellers remained in control. This suggests traders aren’t opening new bullish positions; they’re readjusting their positions and picking sides ⚡
So rather than saying something has gone wrong with crypto, it’s more accurate to say the macro tide is going out. Rising oil prices, a stronger dollar, and higher Treasury yields put pressure on risk assets across the board. Bitcoin was simply no exception.
The key thing to watch next is the Federal Reserve’s September meeting minutes, due out tonight. The Fed had just raised rates by 25 basis points at that meeting, while recent weakness in employment data has led markets to see a lower probability of another hike in October. Whether the minutes strike a patient tone or still hint at one more hike before year-end could determine which way risk assets move in the short term ⚠️
My view is straightforward: $547 million in liquidations sounds alarming, but this looks more like a leverage flush than the end of the trend. The real question is whether the money that’s been gradually buying spot will still be there once the macro tensions ease 🦕
What do you think—was this a macro-driven sell-off, or is the market simply deleveraging? Let’s talk in the comments.
Tap the profile picture to watch the livestream.
Every day, I’ll help you follow the latest in crypto—not just what’s happening, but also the logic and opportunities behind it 👀🚀
580
·
--
A U.S.-listed company has amassed 6 million ETH, or 4.9% of the entire supply. Today, it announced a hard cap 🦖
[🔎 进群看完整分析](https://app.binance.com/uni-qr/JpwCPfBj)
On October 7, BitMine Chairman Tom Lee said during his speech at the Token2049 conference in Singapore that the company’s ETH holdings would be capped at 5% of the total supply. He put it plainly: it won’t buy more than 5% of all ETH.
Just how big is that? The total ETH supply is about 122 million, and BitMine already holds around 6 million—equivalent to 4.9%. It’s just about 100,000 ETH shy of that 5% hard limit. At current prices, those holdings represent a crypto treasury worth roughly $15.8 billion 💰
The next thing he said is even more thought-provoking: the company built most of its position during the bear market. It’s stopping further purchases now to prepare for the 25x move ahead 📈
Why set a ceiling now? The logic is actually quite practical. For years, BitMine has raised capital in the markets by issuing preferred shares and convertible bonds, using the proceeds to buy crypto. It kept buying while diluting existing shareholders along the way. Now, stopping at 5% means putting down the fundraising lever. In his words, with a hard 5% cap, the company can outperform ETH when its price rises, because investors won’t have to worry about it continually raising funds to buy more.
There’s another part of the equation: the $15.8 billion treasury is being staked. The company expects to earn about $334 million a year from staking. Even if it stops buying, staking rewards will continue to generate more ETH. The company has also said it may sell the ETH earned from staking to keep its holdings from exceeding the 5% limit.
Here’s my take: For the past two years, the market has been worried that institutions would accumulate ETH without limit, locking up the circulating supply. Now, for the first time, an institution is voluntarily hitting the brakes. That signal is more worth watching than how much it has bought. But stopping purchases doesn’t mean selling. Staking will continue to generate income, and the 5% cap looks more like a line the company has drawn for itself than a promise to the market.
Do you think an institution putting a cap on its crypto holdings is good news or bad news for Ethereum? Let’s discuss in the comments.
Tap the profile picture to watch the livestream.
Every day, I’ll help you follow the latest Ethereum developments—not just what’s happening, but also the logic and opportunities behind it 👀🚀
A U.S.-listed company has amassed 6 million ETH, or 4.9% of the entire supply. Today, it announced a hard cap 🦖
🔎 进群看完整分析
On October 7, BitMine Chairman Tom Lee said during his speech at the Token2049 conference in Singapore that the company’s ETH holdings would be capped at 5% of the total supply. He put it plainly: it won’t buy more than 5% of all ETH.
Just how big is that? The total ETH supply is about 122 million, and BitMine already holds around 6 million—equivalent to 4.9%. It’s just about 100,000 ETH shy of that 5% hard limit. At current prices, those holdings represent a crypto treasury worth roughly $15.8 billion 💰
The next thing he said is even more thought-provoking: the company built most of its position during the bear market. It’s stopping further purchases now to prepare for the 25x move ahead 📈
Why set a ceiling now? The logic is actually quite practical. For years, BitMine has raised capital in the markets by issuing preferred shares and convertible bonds, using the proceeds to buy crypto. It kept buying while diluting existing shareholders along the way. Now, stopping at 5% means putting down the fundraising lever. In his words, with a hard 5% cap, the company can outperform ETH when its price rises, because investors won’t have to worry about it continually raising funds to buy more.
There’s another part of the equation: the $15.8 billion treasury is being staked. The company expects to earn about $334 million a year from staking. Even if it stops buying, staking rewards will continue to generate more ETH. The company has also said it may sell the ETH earned from staking to keep its holdings from exceeding the 5% limit.
Here’s my take: For the past two years, the market has been worried that institutions would accumulate ETH without limit, locking up the circulating supply. Now, for the first time, an institution is voluntarily hitting the brakes. That signal is more worth watching than how much it has bought. But stopping purchases doesn’t mean selling. Staking will continue to generate income, and the 5% cap looks more like a line the company has drawn for itself than a promise to the market.
Do you think an institution putting a cap on its crypto holdings is good news or bad news for Ethereum? Let’s discuss in the comments.
Tap the profile picture to watch the livestream.
Every day, I’ll help you follow the latest Ethereum developments—not just what’s happening, but also the logic and opportunities behind it 👀🚀
🔎 进群看完整分析
On October 7, BitMine Chairman Tom Lee said during his speech at the Token2049 conference in Singapore that the company’s ETH holdings would be capped at 5% of the total supply. He put it plainly: it won’t buy more than 5% of all ETH.
Just how big is that? The total ETH supply is about 122 million, and BitMine already holds around 6 million—equivalent to 4.9%. It’s just about 100,000 ETH shy of that 5% hard limit. At current prices, those holdings represent a crypto treasury worth roughly $15.8 billion 💰
The next thing he said is even more thought-provoking: the company built most of its position during the bear market. It’s stopping further purchases now to prepare for the 25x move ahead 📈
Why set a ceiling now? The logic is actually quite practical. For years, BitMine has raised capital in the markets by issuing preferred shares and convertible bonds, using the proceeds to buy crypto. It kept buying while diluting existing shareholders along the way. Now, stopping at 5% means putting down the fundraising lever. In his words, with a hard 5% cap, the company can outperform ETH when its price rises, because investors won’t have to worry about it continually raising funds to buy more.
There’s another part of the equation: the $15.8 billion treasury is being staked. The company expects to earn about $334 million a year from staking. Even if it stops buying, staking rewards will continue to generate more ETH. The company has also said it may sell the ETH earned from staking to keep its holdings from exceeding the 5% limit.
Here’s my take: For the past two years, the market has been worried that institutions would accumulate ETH without limit, locking up the circulating supply. Now, for the first time, an institution is voluntarily hitting the brakes. That signal is more worth watching than how much it has bought. But stopping purchases doesn’t mean selling. Staking will continue to generate income, and the 5% cap looks more like a line the company has drawn for itself than a promise to the market.
Do you think an institution putting a cap on its crypto holdings is good news or bad news for Ethereum? Let’s discuss in the comments.
Tap the profile picture to watch the livestream.
Every day, I’ll help you follow the latest Ethereum developments—not just what’s happening, but also the logic and opportunities behind it 👀🚀

300
·
--
#比特币跌破8.4万美元
Bitcoin slides from $86,000 to $84,000, shedding $2,300 overnight. Its three-month staircase of gains is still standing—but only just 🦖
[👥 一起来群里抬杠](https://app.binance.com/uni-qr/JpwCPfBj)
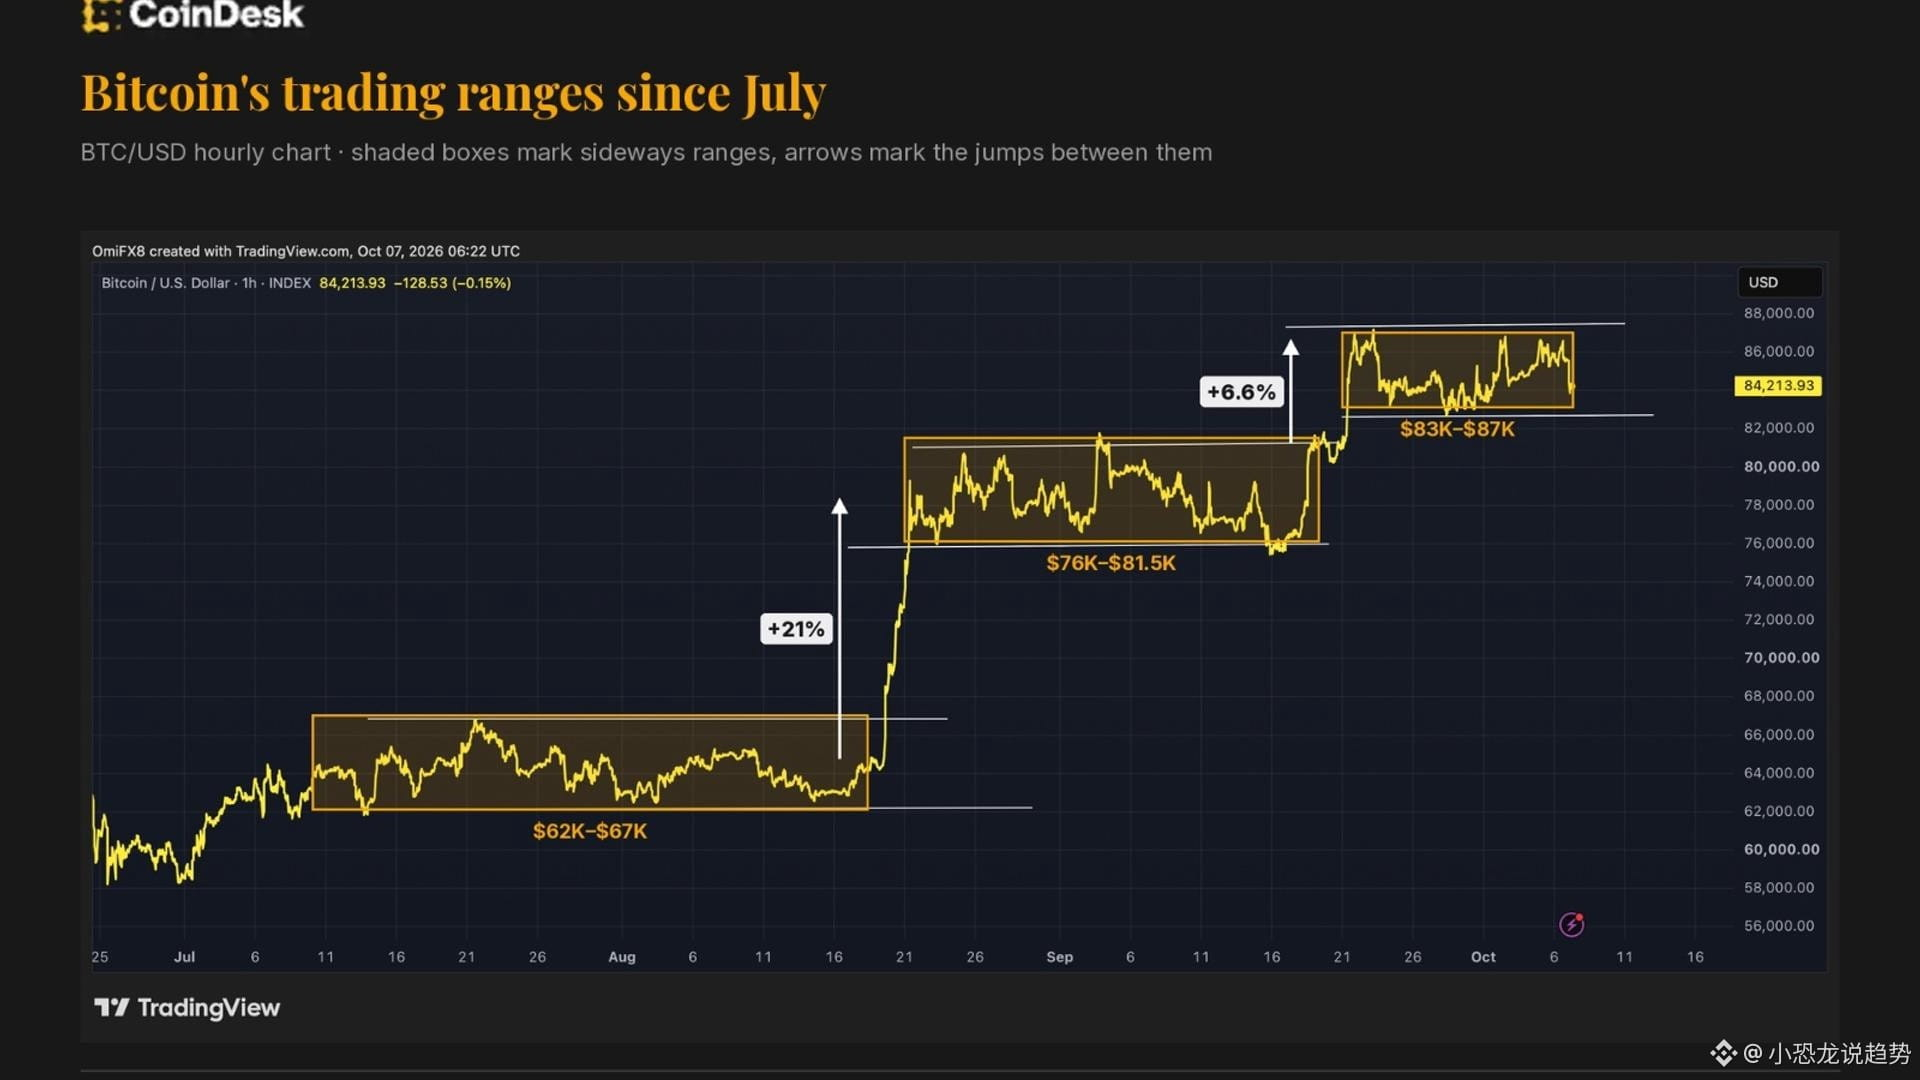
Early Wednesday, Bitcoin briefly fell to $84,200, down more than 2% in a day from around $86,500 on Tuesday. It was another close approach to the bottom of its range over the past two weeks. But here’s what’s interesting: it’s still holding firm within the $83,000–$87,000 range. The staircase of gains that began in July has yet to break.
Look at the staircase step by step, and the pattern is strikingly clear. From mid-July to August 18, Bitcoin traded sideways between $62,000 and $67,000. Then it surged 21% in three days, climbing to the next step. From late August to mid-September, it consolidated again, this time between $76,000 and $81,500. Then, from September 19 to 21, it jumped another 6.6%, and has held between $83,000 and $87,000 ever since 📊
The key threshold is $83,000. Vikram Subburaj, CEO of Indian exchange Giottus, put it plainly: as long as $83,000 holds, sellers haven’t managed to push the price back into the previous range. But if it decisively breaks below $82,000–$83,000, September’s breakout would be considered a failure, and attention would turn back to $80,000–$81,500. Another analyst, FxPro Chief Market Analyst Alex Kuptsikevich, sees support a little higher, at around $84,000. A break below that level would also point toward $80,000.
In my view, the trigger for this downturn didn’t actually come from within the crypto market. An attack on an Iranian oil tanker pushed oil prices higher, Treasury yields rose along with them, and risk assets came under broad pressure. Bitcoin simply retreated with the rest. But what makes it stand out is that since July, none of its sharp sell-offs have broken below the previous step. Whether the staircase can continue now depends on the $83,000 line—the level the bulls have defended most firmly over the past three months 🦕
Put another way, the market isn’t debating whether prices will fall; it’s debating whether this is a normal pullback or the beginning of a trend reversal. At the same price, bulls see a fourth step taking shape, while bears see each peak coming in lower than the last. The next few days will tell us who’s right ⚠️
Do you think support at $83,000 will hold, or is this staircase about to collapse? Share your thoughts in the comments.
Tap the profile picture to watch the livestream.
Every day, we bring you the latest Bitcoin news—not just what’s happening, but also the logic and opportunities behind it 👀🚀
#比特币跌破8.4万美元
Bitcoin slides from $86,000 to $84,000, shedding $2,300 overnight. Its three-month staircase of gains is still standing—but only just 🦖
👥 一起来群里抬杠
Early Wednesday, Bitcoin briefly fell to $84,200, down more than 2% in a day from around $86,500 on Tuesday. It was another close approach to the bottom of its range over the past two weeks. But here’s what’s interesting: it’s still holding firm within the $83,000–$87,000 range. The staircase of gains that began in July has yet to break.
Look at the staircase step by step, and the pattern is strikingly clear. From mid-July to August 18, Bitcoin traded sideways between $62,000 and $67,000. Then it surged 21% in three days, climbing to the next step. From late August to mid-September, it consolidated again, this time between $76,000 and $81,500. Then, from September 19 to 21, it jumped another 6.6%, and has held between $83,000 and $87,000 ever since 📊
The key threshold is $83,000. Vikram Subburaj, CEO of Indian exchange Giottus, put it plainly: as long as $83,000 holds, sellers haven’t managed to push the price back into the previous range. But if it decisively breaks below $82,000–$83,000, September’s breakout would be considered a failure, and attention would turn back to $80,000–$81,500. Another analyst, FxPro Chief Market Analyst Alex Kuptsikevich, sees support a little higher, at around $84,000. A break below that level would also point toward $80,000.
In my view, the trigger for this downturn didn’t actually come from within the crypto market. An attack on an Iranian oil tanker pushed oil prices higher, Treasury yields rose along with them, and risk assets came under broad pressure. Bitcoin simply retreated with the rest. But what makes it stand out is that since July, none of its sharp sell-offs have broken below the previous step. Whether the staircase can continue now depends on the $83,000 line—the level the bulls have defended most firmly over the past three months 🦕
Put another way, the market isn’t debating whether prices will fall; it’s debating whether this is a normal pullback or the beginning of a trend reversal. At the same price, bulls see a fourth step taking shape, while bears see each peak coming in lower than the last. The next few days will tell us who’s right ⚠️
Do you think support at $83,000 will hold, or is this staircase about to collapse? Share your thoughts in the comments.
Tap the profile picture to watch the livestream.
Every day, we bring you the latest Bitcoin news—not just what’s happening, but also the logic and opportunities behind it 👀🚀
Bitcoin slides from $86,000 to $84,000, shedding $2,300 overnight. Its three-month staircase of gains is still standing—but only just 🦖
👥 一起来群里抬杠
Early Wednesday, Bitcoin briefly fell to $84,200, down more than 2% in a day from around $86,500 on Tuesday. It was another close approach to the bottom of its range over the past two weeks. But here’s what’s interesting: it’s still holding firm within the $83,000–$87,000 range. The staircase of gains that began in July has yet to break.
Look at the staircase step by step, and the pattern is strikingly clear. From mid-July to August 18, Bitcoin traded sideways between $62,000 and $67,000. Then it surged 21% in three days, climbing to the next step. From late August to mid-September, it consolidated again, this time between $76,000 and $81,500. Then, from September 19 to 21, it jumped another 6.6%, and has held between $83,000 and $87,000 ever since 📊
The key threshold is $83,000. Vikram Subburaj, CEO of Indian exchange Giottus, put it plainly: as long as $83,000 holds, sellers haven’t managed to push the price back into the previous range. But if it decisively breaks below $82,000–$83,000, September’s breakout would be considered a failure, and attention would turn back to $80,000–$81,500. Another analyst, FxPro Chief Market Analyst Alex Kuptsikevich, sees support a little higher, at around $84,000. A break below that level would also point toward $80,000.
In my view, the trigger for this downturn didn’t actually come from within the crypto market. An attack on an Iranian oil tanker pushed oil prices higher, Treasury yields rose along with them, and risk assets came under broad pressure. Bitcoin simply retreated with the rest. But what makes it stand out is that since July, none of its sharp sell-offs have broken below the previous step. Whether the staircase can continue now depends on the $83,000 line—the level the bulls have defended most firmly over the past three months 🦕
Put another way, the market isn’t debating whether prices will fall; it’s debating whether this is a normal pullback or the beginning of a trend reversal. At the same price, bulls see a fourth step taking shape, while bears see each peak coming in lower than the last. The next few days will tell us who’s right ⚠️
Do you think support at $83,000 will hold, or is this staircase about to collapse? Share your thoughts in the comments.
Tap the profile picture to watch the livestream.
Every day, we bring you the latest Bitcoin news—not just what’s happening, but also the logic and opportunities behind it 👀🚀
39
·
--
Bitcoin rose 225% over three years—but take away its best 15 days and it would have lost 11%
[🔭 进群看资金去哪](https://app.binance.com/uni-qr/JpwCPfBj)
That’s the conclusion in an October 5 report by Zach Pandl, head of research at Grayscale. The analysis covered the three years through September 23 and used spot bitcoin prices against the U.S. dollar. The result is sobering: nearly all the gains were concentrated in a tiny handful of trading days. 🦖
Here are the numbers from the report: fewer than 0.5% of trading days accounted for more than half of the total gains. Remove just the five best days, and the 225% return falls straight to 95—less than half. Remove 10 days, and only 27% remains. Remove 15, and the return flips to a loss of 11%. 📊
To show just how extreme this is, Grayscale compared bitcoin with the Nasdaq 100. Over the same period, the Nasdaq rose 109%. Even after removing its 15 best days, it was still up 21%—a much more evenly distributed return. Before those 15 days were removed, bitcoin’s 225% return was more than twice the Nasdaq’s 109%. Afterward, bitcoin was down 11% while the Nasdaq was up 21%. The comparison completely flips.
These figures come from Grayscale’s research series, The Stack. The analysis used spot prices, not futures, and didn’t use leverage.
My take: these numbers shouldn’t be read as bearish. What they really show is that bitcoin’s returns are highly concentrated in a tiny number of days. If you happen to miss those days, your results over three years can be worlds apart. For ordinary investors, that means trying to time the market precisely is almost a game of chance. It’s hard to know in advance which days will be among those five. The only things you can control are your position size and whether you stay invested.
Worth noting: the 225% gain over three years isn’t quite as impressive as it sounds, either. Today, bitcoin briefly fell below $84,000, down about 1.5% on the day, and pulled further back from its early-month highs. Short-term sentiment is cooling, while long-term returns are propped up by a handful of trading days. Both are reminders of the same thing.
Do you think ordinary investors can really catch the 15 best days over a three-year period? Share your thoughts in the comments.
Tap the profile picture to watch the livestream.
Every day, we bring you the latest bitcoin topics—not just what’s happening, but the logic and opportunities behind it. 👀🚀
Bitcoin rose 225% over three years—but take away its best 15 days and it would have lost 11%
🔭 进群看资金去哪
That’s the conclusion in an October 5 report by Zach Pandl, head of research at Grayscale. The analysis covered the three years through September 23 and used spot bitcoin prices against the U.S. dollar. The result is sobering: nearly all the gains were concentrated in a tiny handful of trading days. 🦖
Here are the numbers from the report: fewer than 0.5% of trading days accounted for more than half of the total gains. Remove just the five best days, and the 225% return falls straight to 95—less than half. Remove 10 days, and only 27% remains. Remove 15, and the return flips to a loss of 11%. 📊
To show just how extreme this is, Grayscale compared bitcoin with the Nasdaq 100. Over the same period, the Nasdaq rose 109%. Even after removing its 15 best days, it was still up 21%—a much more evenly distributed return. Before those 15 days were removed, bitcoin’s 225% return was more than twice the Nasdaq’s 109%. Afterward, bitcoin was down 11% while the Nasdaq was up 21%. The comparison completely flips.
These figures come from Grayscale’s research series, The Stack. The analysis used spot prices, not futures, and didn’t use leverage.
My take: these numbers shouldn’t be read as bearish. What they really show is that bitcoin’s returns are highly concentrated in a tiny number of days. If you happen to miss those days, your results over three years can be worlds apart. For ordinary investors, that means trying to time the market precisely is almost a game of chance. It’s hard to know in advance which days will be among those five. The only things you can control are your position size and whether you stay invested.
Worth noting: the 225% gain over three years isn’t quite as impressive as it sounds, either. Today, bitcoin briefly fell below $84,000, down about 1.5% on the day, and pulled further back from its early-month highs. Short-term sentiment is cooling, while long-term returns are propped up by a handful of trading days. Both are reminders of the same thing.
Do you think ordinary investors can really catch the 15 best days over a three-year period? Share your thoughts in the comments.
Tap the profile picture to watch the livestream.
Every day, we bring you the latest bitcoin topics—not just what’s happening, but the logic and opportunities behind it. 👀🚀
🔭 进群看资金去哪
That’s the conclusion in an October 5 report by Zach Pandl, head of research at Grayscale. The analysis covered the three years through September 23 and used spot bitcoin prices against the U.S. dollar. The result is sobering: nearly all the gains were concentrated in a tiny handful of trading days. 🦖
Here are the numbers from the report: fewer than 0.5% of trading days accounted for more than half of the total gains. Remove just the five best days, and the 225% return falls straight to 95—less than half. Remove 10 days, and only 27% remains. Remove 15, and the return flips to a loss of 11%. 📊
To show just how extreme this is, Grayscale compared bitcoin with the Nasdaq 100. Over the same period, the Nasdaq rose 109%. Even after removing its 15 best days, it was still up 21%—a much more evenly distributed return. Before those 15 days were removed, bitcoin’s 225% return was more than twice the Nasdaq’s 109%. Afterward, bitcoin was down 11% while the Nasdaq was up 21%. The comparison completely flips.
These figures come from Grayscale’s research series, The Stack. The analysis used spot prices, not futures, and didn’t use leverage.
My take: these numbers shouldn’t be read as bearish. What they really show is that bitcoin’s returns are highly concentrated in a tiny number of days. If you happen to miss those days, your results over three years can be worlds apart. For ordinary investors, that means trying to time the market precisely is almost a game of chance. It’s hard to know in advance which days will be among those five. The only things you can control are your position size and whether you stay invested.
Worth noting: the 225% gain over three years isn’t quite as impressive as it sounds, either. Today, bitcoin briefly fell below $84,000, down about 1.5% on the day, and pulled further back from its early-month highs. Short-term sentiment is cooling, while long-term returns are propped up by a handful of trading days. Both are reminders of the same thing.
Do you think ordinary investors can really catch the 15 best days over a three-year period? Share your thoughts in the comments.
Tap the profile picture to watch the livestream.
Every day, we bring you the latest bitcoin topics—not just what’s happening, but the logic and opportunities behind it. 👀🚀

2
·
--
Ethereum ETFs see net outflows for six straight days, with $202 million outflow on the latest day, while Bitcoin ETFs log net inflows for eight straight days 🦖
[💬 群里一起聊行情](https://app.binance.com/uni-qr/JpwCPfBj)
U.S. spot Ethereum ETFs saw net outflows of $202 million on the latest trading day. That marks the sixth consecutive trading day of net redemptions, with not a single day of net inflows during that stretch. A one-way bleed.
The timeline is even more telling. Just about two weeks ago, in late September, spot Ethereum ETFs recorded $270 million in net inflows in a single day. BlackRock’s ETHA alone contributed $110 million. From a $270 million daily inflow to six straight days of outflows— institutional sentiment made a sharp U-turn in just two weeks 📈
On the same track, spot Bitcoin ETFs tell the exact opposite story: $31.1 million in net inflows on the latest day, marking their eighth consecutive trading day of net inflows. Not a single day in those eight was outweighed by redemptions. Spot Solana ETFs also recorded $26.1 million in net inflows in a single day over the same period 💰
Put these figures together and the takeaway is clear: money hasn’t left crypto ETFs. It has simply moved from Ethereum to Bitcoin and Solana. This is a reshuffling within crypto, not a retreat from the asset class as a whole.
Mechanically, net outflows from spot ETFs mean redemptions exceed creations. Authorized participants typically have to sell the corresponding spot Ethereum to meet those redemptions, so outflows directly add selling pressure to the spot market. But they’re only a demand signal, not a price directive ⚠️
The market is reflecting this too: Bitcoin is currently at $84,322, down 1.28% over 24 hours; Ethereum is at $2,620, down 2.79%; and Solana is at $118.82, down 0.61%. Ethereum’s decline is clearly steeper than Bitcoin’s, fully aligning with the direction of the fund flows 📉
My take is that Bitcoin is currently acting as crypto’s safe haven, while Ethereum is behaving like a risk asset. If the next report still shows net outflows, the redemption pressure that has lasted six straight days could spill over into the altcoin sector. On the other hand, a return to positive flows would signal that this wave of redemptions is starting to exhaust itself.
The number to watch is the next trading day’s figure. Another day of outflows would deepen the trend; a reversal to inflows would mean the pressure has largely eased. There’s no gray area in between.
Let’s talk in the comments: do you think institutions are abandoning Ethereum, or are funds just temporarily changing seats?
Every day, I bring you the latest on Ethereum and Bitcoin fund flows—not just what’s happening in the news, but also the logic and opportunities behind it 👀🚀
Ethereum ETFs see net outflows for six straight days, with $202 million outflow on the latest day, while Bitcoin ETFs log net inflows for eight straight days 🦖
💬 群里一起聊行情
U.S. spot Ethereum ETFs saw net outflows of $202 million on the latest trading day. That marks the sixth consecutive trading day of net redemptions, with not a single day of net inflows during that stretch. A one-way bleed.
The timeline is even more telling. Just about two weeks ago, in late September, spot Ethereum ETFs recorded $270 million in net inflows in a single day. BlackRock’s ETHA alone contributed $110 million. From a $270 million daily inflow to six straight days of outflows— institutional sentiment made a sharp U-turn in just two weeks 📈
On the same track, spot Bitcoin ETFs tell the exact opposite story: $31.1 million in net inflows on the latest day, marking their eighth consecutive trading day of net inflows. Not a single day in those eight was outweighed by redemptions. Spot Solana ETFs also recorded $26.1 million in net inflows in a single day over the same period 💰
Put these figures together and the takeaway is clear: money hasn’t left crypto ETFs. It has simply moved from Ethereum to Bitcoin and Solana. This is a reshuffling within crypto, not a retreat from the asset class as a whole.
Mechanically, net outflows from spot ETFs mean redemptions exceed creations. Authorized participants typically have to sell the corresponding spot Ethereum to meet those redemptions, so outflows directly add selling pressure to the spot market. But they’re only a demand signal, not a price directive ⚠️
The market is reflecting this too: Bitcoin is currently at $84,322, down 1.28% over 24 hours; Ethereum is at $2,620, down 2.79%; and Solana is at $118.82, down 0.61%. Ethereum’s decline is clearly steeper than Bitcoin’s, fully aligning with the direction of the fund flows 📉
My take is that Bitcoin is currently acting as crypto’s safe haven, while Ethereum is behaving like a risk asset. If the next report still shows net outflows, the redemption pressure that has lasted six straight days could spill over into the altcoin sector. On the other hand, a return to positive flows would signal that this wave of redemptions is starting to exhaust itself.
The number to watch is the next trading day’s figure. Another day of outflows would deepen the trend; a reversal to inflows would mean the pressure has largely eased. There’s no gray area in between.
Let’s talk in the comments: do you think institutions are abandoning Ethereum, or are funds just temporarily changing seats?
Every day, I bring you the latest on Ethereum and Bitcoin fund flows—not just what’s happening in the news, but also the logic and opportunities behind it 👀🚀
💬 群里一起聊行情
U.S. spot Ethereum ETFs saw net outflows of $202 million on the latest trading day. That marks the sixth consecutive trading day of net redemptions, with not a single day of net inflows during that stretch. A one-way bleed.
The timeline is even more telling. Just about two weeks ago, in late September, spot Ethereum ETFs recorded $270 million in net inflows in a single day. BlackRock’s ETHA alone contributed $110 million. From a $270 million daily inflow to six straight days of outflows— institutional sentiment made a sharp U-turn in just two weeks 📈
On the same track, spot Bitcoin ETFs tell the exact opposite story: $31.1 million in net inflows on the latest day, marking their eighth consecutive trading day of net inflows. Not a single day in those eight was outweighed by redemptions. Spot Solana ETFs also recorded $26.1 million in net inflows in a single day over the same period 💰
Put these figures together and the takeaway is clear: money hasn’t left crypto ETFs. It has simply moved from Ethereum to Bitcoin and Solana. This is a reshuffling within crypto, not a retreat from the asset class as a whole.
Mechanically, net outflows from spot ETFs mean redemptions exceed creations. Authorized participants typically have to sell the corresponding spot Ethereum to meet those redemptions, so outflows directly add selling pressure to the spot market. But they’re only a demand signal, not a price directive ⚠️
The market is reflecting this too: Bitcoin is currently at $84,322, down 1.28% over 24 hours; Ethereum is at $2,620, down 2.79%; and Solana is at $118.82, down 0.61%. Ethereum’s decline is clearly steeper than Bitcoin’s, fully aligning with the direction of the fund flows 📉
My take is that Bitcoin is currently acting as crypto’s safe haven, while Ethereum is behaving like a risk asset. If the next report still shows net outflows, the redemption pressure that has lasted six straight days could spill over into the altcoin sector. On the other hand, a return to positive flows would signal that this wave of redemptions is starting to exhaust itself.
The number to watch is the next trading day’s figure. Another day of outflows would deepen the trend; a reversal to inflows would mean the pressure has largely eased. There’s no gray area in between.
Let’s talk in the comments: do you think institutions are abandoning Ethereum, or are funds just temporarily changing seats?
Every day, I bring you the latest on Ethereum and Bitcoin fund flows—not just what’s happening in the news, but also the logic and opportunities behind it 👀🚀

335
·
--
#比特币跌破8.4万美元
$487 million in long positions liquidated overnight 💥 Bitcoin plunges back below $84,000 🦖
[👉 进群看盘面](https://app.binance.com/uni-qr/JpwCPfBj)
In the early Asian session on October 7, Bitcoin suddenly plunged from around $86,600, where it had been trading during the day on Tuesday, to a low of $83,840—a drop of about 1.5%. It fell straight through the $84,000 level that FxPro had previously flagged as a key threshold for the bears.
More importantly, the trigger didn’t come from crypto. Attacks on oil tankers in the Strait of Hormuz escalated, sending Brent crude up nearly 1% to around $101.50 a barrel. Oil prices, the dollar, and Treasury yields all rose at the same time 🛢️
According to data from The Block, around $487 million in long positions were liquidated in this crypto market sell-off. Nearly all major coins were in the red. Dogecoin (DOGE) led the declines, down about 5% to around 9 cents. Ethereum fell 3.5% to about $2,610, XRP dropped around 3% to $1.46, and HYPE fell 4% to about $91. BNB, SOL, ZEC, and TRX each lost between 1% and 2.5%.
On the macro front, the yield on 10-year U.S. Treasuries rose 3 basis points to 5.31%. The U.S. dollar strengthened against all G10 currencies, and Asian stocks also retreated. Risk assets were drained of liquidity across the board 📉
The key level now is $83,000. FxPro’s view is that if Bitcoin breaks decisively below it, $80,000 could come quickly. The current price is only about $1,200 above this line of defense. Meanwhile, the market is also waiting for the minutes of the Fed’s September meeting, due later today. The Fed cut rates by 25 basis points in September, and weaker-than-expected employment data has made another move this month seem less certain. Whether the minutes strike a patient tone or leave the door open to another move this year could determine the market’s next direction ⚠️
My take: this sell-off isn’t a crypto-specific problem. Oil prices, the dollar, and Treasury yields are working together to drain liquidity from the market, with volatile assets taking the first hit. The real question isn’t how much prices fell today, but whether $83,000 holds. If it does, this is a retest. If it breaks, $80,000 could arrive faster than anyone expects.
Let’s talk in the comments: do you think this is a pullback driven by oil prices, or the beginning of the end of the rebound?
I bring you the latest crypto market trends every day—not just what’s happening, but also the logic and opportunities behind the headlines 👀🚀
Tap my profile picture to watch the livestream
#比特币跌破8.4万美元
$487 million in long positions liquidated overnight 💥 Bitcoin plunges back below $84,000 🦖
👉 进群看盘面
In the early Asian session on October 7, Bitcoin suddenly plunged from around $86,600, where it had been trading during the day on Tuesday, to a low of $83,840—a drop of about 1.5%. It fell straight through the $84,000 level that FxPro had previously flagged as a key threshold for the bears.
More importantly, the trigger didn’t come from crypto. Attacks on oil tankers in the Strait of Hormuz escalated, sending Brent crude up nearly 1% to around $101.50 a barrel. Oil prices, the dollar, and Treasury yields all rose at the same time 🛢️
According to data from The Block, around $487 million in long positions were liquidated in this crypto market sell-off. Nearly all major coins were in the red. Dogecoin (DOGE) led the declines, down about 5% to around 9 cents. Ethereum fell 3.5% to about $2,610, XRP dropped around 3% to $1.46, and HYPE fell 4% to about $91. BNB, SOL, ZEC, and TRX each lost between 1% and 2.5%.
On the macro front, the yield on 10-year U.S. Treasuries rose 3 basis points to 5.31%. The U.S. dollar strengthened against all G10 currencies, and Asian stocks also retreated. Risk assets were drained of liquidity across the board 📉
The key level now is $83,000. FxPro’s view is that if Bitcoin breaks decisively below it, $80,000 could come quickly. The current price is only about $1,200 above this line of defense. Meanwhile, the market is also waiting for the minutes of the Fed’s September meeting, due later today. The Fed cut rates by 25 basis points in September, and weaker-than-expected employment data has made another move this month seem less certain. Whether the minutes strike a patient tone or leave the door open to another move this year could determine the market’s next direction ⚠️
My take: this sell-off isn’t a crypto-specific problem. Oil prices, the dollar, and Treasury yields are working together to drain liquidity from the market, with volatile assets taking the first hit. The real question isn’t how much prices fell today, but whether $83,000 holds. If it does, this is a retest. If it breaks, $80,000 could arrive faster than anyone expects.
Let’s talk in the comments: do you think this is a pullback driven by oil prices, or the beginning of the end of the rebound?
I bring you the latest crypto market trends every day—not just what’s happening, but also the logic and opportunities behind the headlines 👀🚀
Tap my profile picture to watch the livestream
$487 million in long positions liquidated overnight 💥 Bitcoin plunges back below $84,000 🦖
👉 进群看盘面
In the early Asian session on October 7, Bitcoin suddenly plunged from around $86,600, where it had been trading during the day on Tuesday, to a low of $83,840—a drop of about 1.5%. It fell straight through the $84,000 level that FxPro had previously flagged as a key threshold for the bears.
More importantly, the trigger didn’t come from crypto. Attacks on oil tankers in the Strait of Hormuz escalated, sending Brent crude up nearly 1% to around $101.50 a barrel. Oil prices, the dollar, and Treasury yields all rose at the same time 🛢️
According to data from The Block, around $487 million in long positions were liquidated in this crypto market sell-off. Nearly all major coins were in the red. Dogecoin (DOGE) led the declines, down about 5% to around 9 cents. Ethereum fell 3.5% to about $2,610, XRP dropped around 3% to $1.46, and HYPE fell 4% to about $91. BNB, SOL, ZEC, and TRX each lost between 1% and 2.5%.
On the macro front, the yield on 10-year U.S. Treasuries rose 3 basis points to 5.31%. The U.S. dollar strengthened against all G10 currencies, and Asian stocks also retreated. Risk assets were drained of liquidity across the board 📉
The key level now is $83,000. FxPro’s view is that if Bitcoin breaks decisively below it, $80,000 could come quickly. The current price is only about $1,200 above this line of defense. Meanwhile, the market is also waiting for the minutes of the Fed’s September meeting, due later today. The Fed cut rates by 25 basis points in September, and weaker-than-expected employment data has made another move this month seem less certain. Whether the minutes strike a patient tone or leave the door open to another move this year could determine the market’s next direction ⚠️
My take: this sell-off isn’t a crypto-specific problem. Oil prices, the dollar, and Treasury yields are working together to drain liquidity from the market, with volatile assets taking the first hit. The real question isn’t how much prices fell today, but whether $83,000 holds. If it does, this is a retest. If it breaks, $80,000 could arrive faster than anyone expects.
Let’s talk in the comments: do you think this is a pullback driven by oil prices, or the beginning of the end of the rebound?
I bring you the latest crypto market trends every day—not just what’s happening, but also the logic and opportunities behind the headlines 👀🚀
Tap my profile picture to watch the livestream

651
·
--
A German crypto trading platform with 1.1 million users has been shut down for nearly four months. Its own regulator rejected its license application to its face 🦖
[🚨 行情变了群里说](https://app.binance.com/uni-qr/JpwCPfBj)
Germany’s Federal Financial Supervisory Authority, BaFin, has just rejected a crypto trading platform’s application for MiCA authorization, according to an announcement from its operator on October 6. The platform has more than 1.1 million registered users, and it is operated by a publicly listed German financial group that also owns a bank.
Here’s the most painful part: the platform had effectively halted trading as early as June 12 while waiting for its MiCA license. Under the original plan, it was supposed to relaunch with a fresh look by the end of June, offering more than 100 cryptocurrencies, crypto-to-crypto trading, and staking. But the license never came through, and the relaunch kept getting delayed. In an August update to customers, it said assets had been migrated to new custody infrastructure and the old trading system had been shut down. In other words, users could see their assets but couldn’t trade: the balances were still there, but the access was gone.
The operator said it had anticipated the possibility of rejection and was looking into alternative operating models. It also reserved the right to file an objection or submit a new application. BaFin’s decision effectively overturned a deal that was already on the table. The company’s CEO, Moritz Eckert, said: “Our top priority now is to implement an alternative model and transparently inform customers about what happens next.”
There’s a piece of context that’s easy to overlook: MiCA is the EU’s unified crypto regulatory framework, intended to let licensed platforms operate across the entire bloc. At the same time, 50,000 Europeans are petitioning the EU to ease restrictions on stablecoin rewards as part of its MiCA review. On one side, there are licensing requirements; on the other, calls to loosen the rules. The two are colliding ⚖️
My take: MiCA has never been just a set of rules on paper. It’s a real gatekeeper for market entry. A platform with a million users can be put on pause for nearly four months because of a single license. For ordinary users, your ability to trade is tied to the platform’s compliance status, not your account balance. For the industry, compliance has gone from a bonus to a matter of survival 📉
But there’s another side to this: rejection doesn’t have to be the end of the road. The company could restore trading through a regulated partner. The things to watch are whether it files an objection or a new application, how long it takes to restore trading under an alternative model, and whether the EU will loosen MiCA rules as part of its review.
Let’s discuss in the comments: who should bear the cost of users’ lost time during these months of disruption?
Every day, I bring you the latest in crypto regulation—not just what’s happening, but the logic and opportunities behind the headlines 👀🚀
Tap my profile picture to watch the livestream
A German crypto trading platform with 1.1 million users has been shut down for nearly four months. Its own regulator rejected its license application to its face 🦖
🚨 行情变了群里说
Germany’s Federal Financial Supervisory Authority, BaFin, has just rejected a crypto trading platform’s application for MiCA authorization, according to an announcement from its operator on October 6. The platform has more than 1.1 million registered users, and it is operated by a publicly listed German financial group that also owns a bank.
Here’s the most painful part: the platform had effectively halted trading as early as June 12 while waiting for its MiCA license. Under the original plan, it was supposed to relaunch with a fresh look by the end of June, offering more than 100 cryptocurrencies, crypto-to-crypto trading, and staking. But the license never came through, and the relaunch kept getting delayed. In an August update to customers, it said assets had been migrated to new custody infrastructure and the old trading system had been shut down. In other words, users could see their assets but couldn’t trade: the balances were still there, but the access was gone.
The operator said it had anticipated the possibility of rejection and was looking into alternative operating models. It also reserved the right to file an objection or submit a new application. BaFin’s decision effectively overturned a deal that was already on the table. The company’s CEO, Moritz Eckert, said: “Our top priority now is to implement an alternative model and transparently inform customers about what happens next.”
There’s a piece of context that’s easy to overlook: MiCA is the EU’s unified crypto regulatory framework, intended to let licensed platforms operate across the entire bloc. At the same time, 50,000 Europeans are petitioning the EU to ease restrictions on stablecoin rewards as part of its MiCA review. On one side, there are licensing requirements; on the other, calls to loosen the rules. The two are colliding ⚖️
My take: MiCA has never been just a set of rules on paper. It’s a real gatekeeper for market entry. A platform with a million users can be put on pause for nearly four months because of a single license. For ordinary users, your ability to trade is tied to the platform’s compliance status, not your account balance. For the industry, compliance has gone from a bonus to a matter of survival 📉
But there’s another side to this: rejection doesn’t have to be the end of the road. The company could restore trading through a regulated partner. The things to watch are whether it files an objection or a new application, how long it takes to restore trading under an alternative model, and whether the EU will loosen MiCA rules as part of its review.
Let’s discuss in the comments: who should bear the cost of users’ lost time during these months of disruption?
Every day, I bring you the latest in crypto regulation—not just what’s happening, but the logic and opportunities behind the headlines 👀🚀
Tap my profile picture to watch the livestream
🚨 行情变了群里说
Germany’s Federal Financial Supervisory Authority, BaFin, has just rejected a crypto trading platform’s application for MiCA authorization, according to an announcement from its operator on October 6. The platform has more than 1.1 million registered users, and it is operated by a publicly listed German financial group that also owns a bank.
Here’s the most painful part: the platform had effectively halted trading as early as June 12 while waiting for its MiCA license. Under the original plan, it was supposed to relaunch with a fresh look by the end of June, offering more than 100 cryptocurrencies, crypto-to-crypto trading, and staking. But the license never came through, and the relaunch kept getting delayed. In an August update to customers, it said assets had been migrated to new custody infrastructure and the old trading system had been shut down. In other words, users could see their assets but couldn’t trade: the balances were still there, but the access was gone.
The operator said it had anticipated the possibility of rejection and was looking into alternative operating models. It also reserved the right to file an objection or submit a new application. BaFin’s decision effectively overturned a deal that was already on the table. The company’s CEO, Moritz Eckert, said: “Our top priority now is to implement an alternative model and transparently inform customers about what happens next.”
There’s a piece of context that’s easy to overlook: MiCA is the EU’s unified crypto regulatory framework, intended to let licensed platforms operate across the entire bloc. At the same time, 50,000 Europeans are petitioning the EU to ease restrictions on stablecoin rewards as part of its MiCA review. On one side, there are licensing requirements; on the other, calls to loosen the rules. The two are colliding ⚖️
My take: MiCA has never been just a set of rules on paper. It’s a real gatekeeper for market entry. A platform with a million users can be put on pause for nearly four months because of a single license. For ordinary users, your ability to trade is tied to the platform’s compliance status, not your account balance. For the industry, compliance has gone from a bonus to a matter of survival 📉
But there’s another side to this: rejection doesn’t have to be the end of the road. The company could restore trading through a regulated partner. The things to watch are whether it files an objection or a new application, how long it takes to restore trading under an alternative model, and whether the EU will loosen MiCA rules as part of its review.
Let’s discuss in the comments: who should bear the cost of users’ lost time during these months of disruption?
Every day, I bring you the latest in crypto regulation—not just what’s happening, but the logic and opportunities behind the headlines 👀🚀
Tap my profile picture to watch the livestream

4
·
--
U.S. regulators are stepping in. A draft proposal splits the crypto market in two: coins held on exchanges will require a license; coins kept in your own wallet get a green light 🦖
[⚡ 有大动静群里说](https://app.binance.com/uni-qr/JpwCPfBj)
On Monday, the U.S. Commodity Futures Trading Commission (CFTC) issued an advance notice of proposed rulemaking, laying out two complementary frameworks: Regulation CTX and Regulation CAM. One tightens the rules, the other opens the door. And there’s just one thing that draws the line between them: who holds your private keys ⚖️
Here’s the most counterintuitive part: if an exchange can offer you leverage—even if that leverage is mentioned only in its terms of service—and the coins you buy sit on the exchange’s own books rather than in your personal wallet, that fully paid transaction could still attract the CFTC’s attention. There’s only one way to avoid the rules: what’s known as “actual delivery.” And the CFTC suggests that the standard for actual delivery may be that customers hold their own private keys 🔑
By contrast, on-chain trading protocols would generally pass the test outright. In other words, the same leveraged trade gets treated differently when it happens on-chain. For the first time, this framework draws a clear regulatory distinction between centralized and decentralized platforms.
The rules for platforms are even more straightforward. The CAM framework would require exchanges that continue to keep customer assets on their own books while also offering leverage to obtain a crypto asset market license. The model is copied directly from futures exchanges. Once licensed, trades would have to go through futures commission merchants and brokers subject to compliance reviews. Leverage could be provided only by these institutions or by banks they endorse. By contrast, exchanges that don’t offer leverage could continue operating under state money transmitter licenses.
There’s also a revealing phrase in the document: the notice describes several previous cases against a U.S. exchange, a DAO, and a decentralized protocol as “regulation by enforcement.” Those four words amount to an official admission that the approach over the past few years was to make it up as they went along, case by case.
The timeline also shows how urgent this move is. Congress failed to pass the market structure bill, the CLARITY Act, in September. The CFTC then sent its framework to the White House for review. In August, Chair Michael Selig said, “If Congress doesn’t act, we will write the rules ourselves.” He also stressed that the rules are meant to head off fraud like FTX before it happens, rather than chase after it with fines afterward. Meanwhile, the SEC proposed its own Regulation Crypto Assets in August. How the two frameworks will fit together remains unknown.
My take: this isn’t an ordinary regulatory update. For the first time, the U.S. is saying outright that who holds your coins determines who has the authority to regulate you. For centralized leveraged exchanges, this means higher compliance costs. For self-custody wallets and on-chain protocols, it’s a relative win. But don’t celebrate just yet: the private-key standard is only an initial proposal, not a final rule. Reserve proof requirements and standards for preventing market manipulation in token listings are also still under consideration. The real thing to watch is whether this line shifts during the 60-day public comment period.
Do you think this is the right line to draw? Are coins in your own wallet really safe? Share your thoughts in the comments ⚠️
Tap the profile picture to watch the livestream
Every day, I’ll help you keep up with the latest crypto regulatory developments—not just what’s happening, but also the logic and opportunities behind it 👀🚀
U.S. regulators are stepping in. A draft proposal splits the crypto market in two: coins held on exchanges will require a license; coins kept in your own wallet get a green light 🦖
⚡ 有大动静群里说
On Monday, the U.S. Commodity Futures Trading Commission (CFTC) issued an advance notice of proposed rulemaking, laying out two complementary frameworks: Regulation CTX and Regulation CAM. One tightens the rules, the other opens the door. And there’s just one thing that draws the line between them: who holds your private keys ⚖️
Here’s the most counterintuitive part: if an exchange can offer you leverage—even if that leverage is mentioned only in its terms of service—and the coins you buy sit on the exchange’s own books rather than in your personal wallet, that fully paid transaction could still attract the CFTC’s attention. There’s only one way to avoid the rules: what’s known as “actual delivery.” And the CFTC suggests that the standard for actual delivery may be that customers hold their own private keys 🔑
By contrast, on-chain trading protocols would generally pass the test outright. In other words, the same leveraged trade gets treated differently when it happens on-chain. For the first time, this framework draws a clear regulatory distinction between centralized and decentralized platforms.
The rules for platforms are even more straightforward. The CAM framework would require exchanges that continue to keep customer assets on their own books while also offering leverage to obtain a crypto asset market license. The model is copied directly from futures exchanges. Once licensed, trades would have to go through futures commission merchants and brokers subject to compliance reviews. Leverage could be provided only by these institutions or by banks they endorse. By contrast, exchanges that don’t offer leverage could continue operating under state money transmitter licenses.
There’s also a revealing phrase in the document: the notice describes several previous cases against a U.S. exchange, a DAO, and a decentralized protocol as “regulation by enforcement.” Those four words amount to an official admission that the approach over the past few years was to make it up as they went along, case by case.
The timeline also shows how urgent this move is. Congress failed to pass the market structure bill, the CLARITY Act, in September. The CFTC then sent its framework to the White House for review. In August, Chair Michael Selig said, “If Congress doesn’t act, we will write the rules ourselves.” He also stressed that the rules are meant to head off fraud like FTX before it happens, rather than chase after it with fines afterward. Meanwhile, the SEC proposed its own Regulation Crypto Assets in August. How the two frameworks will fit together remains unknown.
My take: this isn’t an ordinary regulatory update. For the first time, the U.S. is saying outright that who holds your coins determines who has the authority to regulate you. For centralized leveraged exchanges, this means higher compliance costs. For self-custody wallets and on-chain protocols, it’s a relative win. But don’t celebrate just yet: the private-key standard is only an initial proposal, not a final rule. Reserve proof requirements and standards for preventing market manipulation in token listings are also still under consideration. The real thing to watch is whether this line shifts during the 60-day public comment period.
Do you think this is the right line to draw? Are coins in your own wallet really safe? Share your thoughts in the comments ⚠️
Tap the profile picture to watch the livestream
Every day, I’ll help you keep up with the latest crypto regulatory developments—not just what’s happening, but also the logic and opportunities behind it 👀🚀
⚡ 有大动静群里说
On Monday, the U.S. Commodity Futures Trading Commission (CFTC) issued an advance notice of proposed rulemaking, laying out two complementary frameworks: Regulation CTX and Regulation CAM. One tightens the rules, the other opens the door. And there’s just one thing that draws the line between them: who holds your private keys ⚖️
Here’s the most counterintuitive part: if an exchange can offer you leverage—even if that leverage is mentioned only in its terms of service—and the coins you buy sit on the exchange’s own books rather than in your personal wallet, that fully paid transaction could still attract the CFTC’s attention. There’s only one way to avoid the rules: what’s known as “actual delivery.” And the CFTC suggests that the standard for actual delivery may be that customers hold their own private keys 🔑
By contrast, on-chain trading protocols would generally pass the test outright. In other words, the same leveraged trade gets treated differently when it happens on-chain. For the first time, this framework draws a clear regulatory distinction between centralized and decentralized platforms.
The rules for platforms are even more straightforward. The CAM framework would require exchanges that continue to keep customer assets on their own books while also offering leverage to obtain a crypto asset market license. The model is copied directly from futures exchanges. Once licensed, trades would have to go through futures commission merchants and brokers subject to compliance reviews. Leverage could be provided only by these institutions or by banks they endorse. By contrast, exchanges that don’t offer leverage could continue operating under state money transmitter licenses.
There’s also a revealing phrase in the document: the notice describes several previous cases against a U.S. exchange, a DAO, and a decentralized protocol as “regulation by enforcement.” Those four words amount to an official admission that the approach over the past few years was to make it up as they went along, case by case.
The timeline also shows how urgent this move is. Congress failed to pass the market structure bill, the CLARITY Act, in September. The CFTC then sent its framework to the White House for review. In August, Chair Michael Selig said, “If Congress doesn’t act, we will write the rules ourselves.” He also stressed that the rules are meant to head off fraud like FTX before it happens, rather than chase after it with fines afterward. Meanwhile, the SEC proposed its own Regulation Crypto Assets in August. How the two frameworks will fit together remains unknown.
My take: this isn’t an ordinary regulatory update. For the first time, the U.S. is saying outright that who holds your coins determines who has the authority to regulate you. For centralized leveraged exchanges, this means higher compliance costs. For self-custody wallets and on-chain protocols, it’s a relative win. But don’t celebrate just yet: the private-key standard is only an initial proposal, not a final rule. Reserve proof requirements and standards for preventing market manipulation in token listings are also still under consideration. The real thing to watch is whether this line shifts during the 60-day public comment period.
Do you think this is the right line to draw? Are coins in your own wallet really safe? Share your thoughts in the comments ⚠️
Tap the profile picture to watch the livestream
Every day, I’ll help you keep up with the latest crypto regulatory developments—not just what’s happening, but also the logic and opportunities behind it 👀🚀

45
·
--
After a full six weeks of silence, it suddenly made a move: a U.S. government wallet transferred 833.6 Bitcoin in one go, worth about $71.5 million at current prices 🐋
[🕐 最新解读群里更新](https://app.binance.com/uni-qr/JpwCPfBj)
On-chain monitoring tools detected the unusual transfer at around 11 a.m. local time on October 6. The coins came from two old cases: the Potapenko and Turogin fraud case, and the 2016 exchange hack that shocked the entire industry. The last time these specific addresses were active was August 26.
There was another, more low-key transaction the same day: 40,285 BNB, worth about $31.63 million, passed through multiple intermediary addresses before eventually landing in an unlabeled wallet. Combined, the two transfers totaled nearly $103 million 💥
Let’s be clear about one thing: a government wallet transfer does not mean an immediate sell-off. These coins are generally held by the U.S. Marshals Service and the Department of Justice. Seized coins may be moved to a different custodian internally or prepared for future disposal. But historically, when long-dormant addresses like these become active, it often foreshadows an auction or disposal ⚠️
That’s why the market is nervous. The U.S. government holds hundreds of thousands of Bitcoin. Every unusual transfer is seen as potential overhead supply—even when only 833.6 coins are actually moved.
Here’s some context: BTC’s total market cap is currently about $1.7 trillion. $71.5 million accounts for just 0.04%. By itself, that amount isn’t enough to move the price. The real impact is on sentiment. Bulls aren’t most worried about these 833 coins; they’re worried about whether this is the first shot in a larger wave of disposals.
The current prices suggest the market isn’t taking much notice: BTC is at $84,418, down 1.39% over 24 hours; ETH is at $2,661, down 1.68%; and BNB is at $770.53. What’s weighing more heavily on the market right now is Bitcoin being rejected near $87,000 for the third time, along with Fed officials collectively striking a hawkish tone 🦖
My take: this transfer alone is not a sell signal, but it is a reminder that government-held coins are always hanging over the market. If the pace of disposals changes, both supply expectations and sentiment will be repriced. What’s worth watching next is whether funds flow to trading platforms and whether an auction announcement appears.
Do you think the U.S. government will eventually dump these coins on the market, or keep holding them? Let’s discuss in the comments. Do you know anyone who’s keeping an eye on government wallet activity?
I bring you the latest Bitcoin and on-chain whale activity every day—not just what’s happening, but also the logic and opportunities behind the headlines 👀🚀
After a full six weeks of silence, it suddenly made a move: a U.S. government wallet transferred 833.6 Bitcoin in one go, worth about $71.5 million at current prices 🐋
🕐 最新解读群里更新
On-chain monitoring tools detected the unusual transfer at around 11 a.m. local time on October 6. The coins came from two old cases: the Potapenko and Turogin fraud case, and the 2016 exchange hack that shocked the entire industry. The last time these specific addresses were active was August 26.
There was another, more low-key transaction the same day: 40,285 BNB, worth about $31.63 million, passed through multiple intermediary addresses before eventually landing in an unlabeled wallet. Combined, the two transfers totaled nearly $103 million 💥
Let’s be clear about one thing: a government wallet transfer does not mean an immediate sell-off. These coins are generally held by the U.S. Marshals Service and the Department of Justice. Seized coins may be moved to a different custodian internally or prepared for future disposal. But historically, when long-dormant addresses like these become active, it often foreshadows an auction or disposal ⚠️
That’s why the market is nervous. The U.S. government holds hundreds of thousands of Bitcoin. Every unusual transfer is seen as potential overhead supply—even when only 833.6 coins are actually moved.
Here’s some context: BTC’s total market cap is currently about $1.7 trillion. $71.5 million accounts for just 0.04%. By itself, that amount isn’t enough to move the price. The real impact is on sentiment. Bulls aren’t most worried about these 833 coins; they’re worried about whether this is the first shot in a larger wave of disposals.
The current prices suggest the market isn’t taking much notice: BTC is at $84,418, down 1.39% over 24 hours; ETH is at $2,661, down 1.68%; and BNB is at $770.53. What’s weighing more heavily on the market right now is Bitcoin being rejected near $87,000 for the third time, along with Fed officials collectively striking a hawkish tone 🦖
My take: this transfer alone is not a sell signal, but it is a reminder that government-held coins are always hanging over the market. If the pace of disposals changes, both supply expectations and sentiment will be repriced. What’s worth watching next is whether funds flow to trading platforms and whether an auction announcement appears.
Do you think the U.S. government will eventually dump these coins on the market, or keep holding them? Let’s discuss in the comments. Do you know anyone who’s keeping an eye on government wallet activity?
I bring you the latest Bitcoin and on-chain whale activity every day—not just what’s happening, but also the logic and opportunities behind the headlines 👀🚀
🕐 最新解读群里更新
On-chain monitoring tools detected the unusual transfer at around 11 a.m. local time on October 6. The coins came from two old cases: the Potapenko and Turogin fraud case, and the 2016 exchange hack that shocked the entire industry. The last time these specific addresses were active was August 26.
There was another, more low-key transaction the same day: 40,285 BNB, worth about $31.63 million, passed through multiple intermediary addresses before eventually landing in an unlabeled wallet. Combined, the two transfers totaled nearly $103 million 💥
Let’s be clear about one thing: a government wallet transfer does not mean an immediate sell-off. These coins are generally held by the U.S. Marshals Service and the Department of Justice. Seized coins may be moved to a different custodian internally or prepared for future disposal. But historically, when long-dormant addresses like these become active, it often foreshadows an auction or disposal ⚠️
That’s why the market is nervous. The U.S. government holds hundreds of thousands of Bitcoin. Every unusual transfer is seen as potential overhead supply—even when only 833.6 coins are actually moved.
Here’s some context: BTC’s total market cap is currently about $1.7 trillion. $71.5 million accounts for just 0.04%. By itself, that amount isn’t enough to move the price. The real impact is on sentiment. Bulls aren’t most worried about these 833 coins; they’re worried about whether this is the first shot in a larger wave of disposals.
The current prices suggest the market isn’t taking much notice: BTC is at $84,418, down 1.39% over 24 hours; ETH is at $2,661, down 1.68%; and BNB is at $770.53. What’s weighing more heavily on the market right now is Bitcoin being rejected near $87,000 for the third time, along with Fed officials collectively striking a hawkish tone 🦖
My take: this transfer alone is not a sell signal, but it is a reminder that government-held coins are always hanging over the market. If the pace of disposals changes, both supply expectations and sentiment will be repriced. What’s worth watching next is whether funds flow to trading platforms and whether an auction announcement appears.
Do you think the U.S. government will eventually dump these coins on the market, or keep holding them? Let’s discuss in the comments. Do you know anyone who’s keeping an eye on government wallet activity?
I bring you the latest Bitcoin and on-chain whale activity every day—not just what’s happening, but also the logic and opportunities behind the headlines 👀🚀
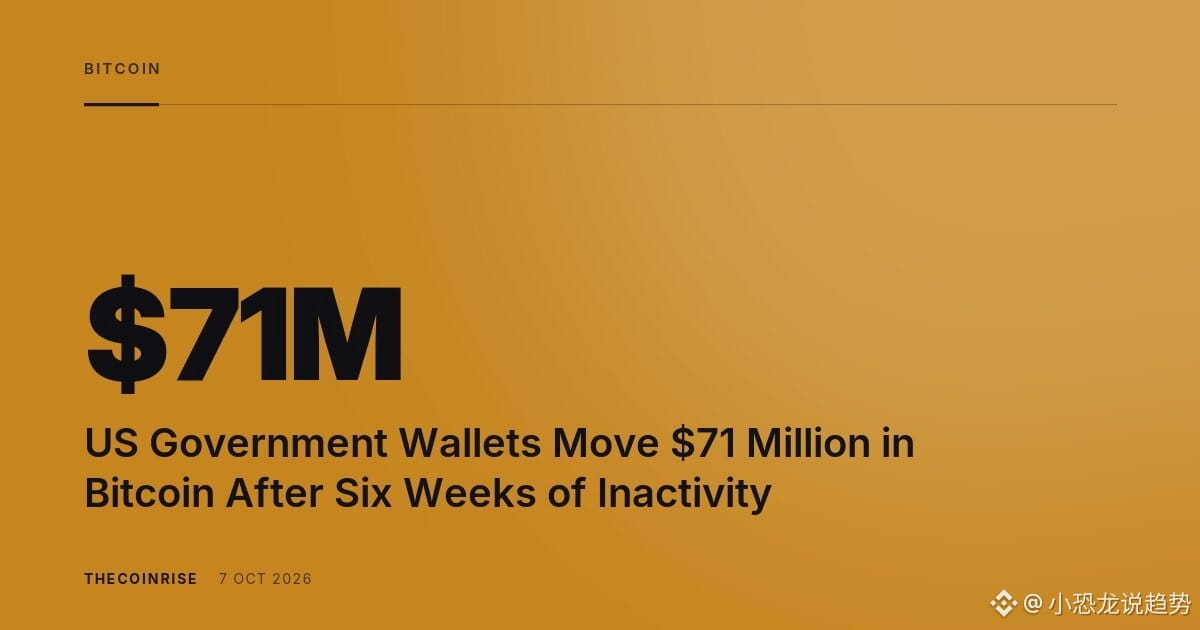
1
1.4k
·
--
#美联储10月维持利率概率升至82.3%
Markets’ bets on the Fed holding steady in October surged to 89.5%, but Fed officials spoke out that same evening: there’s still work to do on short-term rates 🦖
[🔍 进群聊行情](https://app.binance.com/uni-qr/JpwCPfBj)
Early in the morning on October 7 Beijing time, two Fed officials spoke in quick succession: Kansas City Fed President Schmid and San Francisco Fed President Daly. Their message was remarkably consistent. Just three weeks after the latest rate hike, they’re now saying inflation is picking up again—and it’s not yet time to call off this tightening cycle.
The numbers best illustrate the divide. On October 5, CME FedWatch showed an 82.3% probability that rates would remain unchanged in October, and just a 17.7% probability of a 25-basis-point hike. But in the same data, the probability of no change in December fell to 17.3%. The odds of another 25 basis points of cumulative hikes stood at a hefty 68.7%, while the chance of another 50 basis points was 14%. 📊 By October 7, the odds of holding steady in October had climbed again, to 89.5%. In a nutshell: bets are on a pause in the near term, but more hikes before year-end.
Schmid was the most direct. He said inflation is a thief that harms the lower half of income earners far more than the higher half. If the Fed doesn’t keep acting to bring inflation back down to 2%, its credibility will be at risk. He listed energy prices as one of the biggest challenges for monetary policy, and singled out AI as driving up demand through data centers and semiconductors. He stressed that the sharp rise in 5-, 10- and 30-year Treasury yields is indeed changing the cost of capital—but the Fed focuses on short-term rates, and there’s still work to do there.
Daly’s focus was a little different. She reiterated that she strongly supported the rate hike three weeks ago, saying a hike was entirely necessary at this point. What really worries her is that AI-driven chip demand could spill over into autos and home appliances. Companies have already started locking in forward contracts, and in her view, this isn’t a one-off shock; it may take longer to ease. As for whether rates should rise further, that will depend on tariffs, oil prices amid the Middle East conflict, and how the effects of AI evolve.
Interestingly, the officials struck a hawkish tone, but markets didn’t seem to care. On Tuesday, the Dow rose 0.49% and the S&P 500 gained 0.58%. Both the Nasdaq and S&P 500 closed at record highs. Bitcoin, meanwhile, hovered around $85,463, down 0.66% over 24 hours, while Ethereum fell 0.89% to $2,694.
My take: the real question this time isn’t whether the Fed hikes in October, but what the path looks like for the rest of the year. A 68.7% chance of another hike before December shows that the market doesn’t see a pause as the end point—it sees it as a halftime break. ⚠️ If the officials’ hawkish outlook is borne out by the data, U.S. stocks still hitting new highs and Bitcoin hovering around $85,000 will both have to be repriced. On the other hand, if inflation data cooperate, markets will once again mark down the odds of a hike. That’s why every inflation and jobs report from here on will carry more weight.
Let’s talk in the comments: do you think the Fed will hike rates again this year? 📈
Every day, I bring you the latest on the Fed and crypto markets—not just what’s happening, but the logic and opportunities behind it. 👀🚀
#美联储10月维持利率概率升至82.3%
Markets’ bets on the Fed holding steady in October surged to 89.5%, but Fed officials spoke out that same evening: there’s still work to do on short-term rates 🦖
🔍 进群聊行情
Early in the morning on October 7 Beijing time, two Fed officials spoke in quick succession: Kansas City Fed President Schmid and San Francisco Fed President Daly. Their message was remarkably consistent. Just three weeks after the latest rate hike, they’re now saying inflation is picking up again—and it’s not yet time to call off this tightening cycle.
The numbers best illustrate the divide. On October 5, CME FedWatch showed an 82.3% probability that rates would remain unchanged in October, and just a 17.7% probability of a 25-basis-point hike. But in the same data, the probability of no change in December fell to 17.3%. The odds of another 25 basis points of cumulative hikes stood at a hefty 68.7%, while the chance of another 50 basis points was 14%. 📊 By October 7, the odds of holding steady in October had climbed again, to 89.5%. In a nutshell: bets are on a pause in the near term, but more hikes before year-end.
Schmid was the most direct. He said inflation is a thief that harms the lower half of income earners far more than the higher half. If the Fed doesn’t keep acting to bring inflation back down to 2%, its credibility will be at risk. He listed energy prices as one of the biggest challenges for monetary policy, and singled out AI as driving up demand through data centers and semiconductors. He stressed that the sharp rise in 5-, 10- and 30-year Treasury yields is indeed changing the cost of capital—but the Fed focuses on short-term rates, and there’s still work to do there.
Daly’s focus was a little different. She reiterated that she strongly supported the rate hike three weeks ago, saying a hike was entirely necessary at this point. What really worries her is that AI-driven chip demand could spill over into autos and home appliances. Companies have already started locking in forward contracts, and in her view, this isn’t a one-off shock; it may take longer to ease. As for whether rates should rise further, that will depend on tariffs, oil prices amid the Middle East conflict, and how the effects of AI evolve.
Interestingly, the officials struck a hawkish tone, but markets didn’t seem to care. On Tuesday, the Dow rose 0.49% and the S&P 500 gained 0.58%. Both the Nasdaq and S&P 500 closed at record highs. Bitcoin, meanwhile, hovered around $85,463, down 0.66% over 24 hours, while Ethereum fell 0.89% to $2,694.
My take: the real question this time isn’t whether the Fed hikes in October, but what the path looks like for the rest of the year. A 68.7% chance of another hike before December shows that the market doesn’t see a pause as the end point—it sees it as a halftime break. ⚠️ If the officials’ hawkish outlook is borne out by the data, U.S. stocks still hitting new highs and Bitcoin hovering around $85,000 will both have to be repriced. On the other hand, if inflation data cooperate, markets will once again mark down the odds of a hike. That’s why every inflation and jobs report from here on will carry more weight.
Let’s talk in the comments: do you think the Fed will hike rates again this year? 📈
Every day, I bring you the latest on the Fed and crypto markets—not just what’s happening, but the logic and opportunities behind it. 👀🚀
Markets’ bets on the Fed holding steady in October surged to 89.5%, but Fed officials spoke out that same evening: there’s still work to do on short-term rates 🦖
🔍 进群聊行情
Early in the morning on October 7 Beijing time, two Fed officials spoke in quick succession: Kansas City Fed President Schmid and San Francisco Fed President Daly. Their message was remarkably consistent. Just three weeks after the latest rate hike, they’re now saying inflation is picking up again—and it’s not yet time to call off this tightening cycle.
The numbers best illustrate the divide. On October 5, CME FedWatch showed an 82.3% probability that rates would remain unchanged in October, and just a 17.7% probability of a 25-basis-point hike. But in the same data, the probability of no change in December fell to 17.3%. The odds of another 25 basis points of cumulative hikes stood at a hefty 68.7%, while the chance of another 50 basis points was 14%. 📊 By October 7, the odds of holding steady in October had climbed again, to 89.5%. In a nutshell: bets are on a pause in the near term, but more hikes before year-end.
Schmid was the most direct. He said inflation is a thief that harms the lower half of income earners far more than the higher half. If the Fed doesn’t keep acting to bring inflation back down to 2%, its credibility will be at risk. He listed energy prices as one of the biggest challenges for monetary policy, and singled out AI as driving up demand through data centers and semiconductors. He stressed that the sharp rise in 5-, 10- and 30-year Treasury yields is indeed changing the cost of capital—but the Fed focuses on short-term rates, and there’s still work to do there.
Daly’s focus was a little different. She reiterated that she strongly supported the rate hike three weeks ago, saying a hike was entirely necessary at this point. What really worries her is that AI-driven chip demand could spill over into autos and home appliances. Companies have already started locking in forward contracts, and in her view, this isn’t a one-off shock; it may take longer to ease. As for whether rates should rise further, that will depend on tariffs, oil prices amid the Middle East conflict, and how the effects of AI evolve.
Interestingly, the officials struck a hawkish tone, but markets didn’t seem to care. On Tuesday, the Dow rose 0.49% and the S&P 500 gained 0.58%. Both the Nasdaq and S&P 500 closed at record highs. Bitcoin, meanwhile, hovered around $85,463, down 0.66% over 24 hours, while Ethereum fell 0.89% to $2,694.
My take: the real question this time isn’t whether the Fed hikes in October, but what the path looks like for the rest of the year. A 68.7% chance of another hike before December shows that the market doesn’t see a pause as the end point—it sees it as a halftime break. ⚠️ If the officials’ hawkish outlook is borne out by the data, U.S. stocks still hitting new highs and Bitcoin hovering around $85,000 will both have to be repriced. On the other hand, if inflation data cooperate, markets will once again mark down the odds of a hike. That’s why every inflation and jobs report from here on will carry more weight.
Let’s talk in the comments: do you think the Fed will hike rates again this year? 📈
Every day, I bring you the latest on the Fed and crypto markets—not just what’s happening, but the logic and opportunities behind it. 👀🚀

281
·
--
$2.76 million frozen just like that, with no explanation for over a year. A company has taken the world’s largest stablecoin issuer to court 🦖
[📣 盘面异动群里喊](https://app.binance.com/uni-qr/JpwCPfBj)
The plaintiff is cross-border payments company Conduit Technology. It filed a complaint in the U.S. District Court for the Southern District of New York, accusing Tether of freezing $2.76 million in USDT held in its treasury wallet on September 24, 2025. The reason still hasn’t been made clear, and the money had been used as the company’s operating account.
According to the complaint, the wallet was opened in May 2025 and processed more than $1.1 billion in transactions in just four months. After the freeze, the company couldn’t stay afloat: it laid off staff and closed its offices ⚠️
Tether’s stated basis was a 2024 investigation by Brazil’s Federal Police into a company called Onix. Onix did use Conduit’s platform, but Conduit says its wallet was created nearly a month after Onix’s last transaction and never held a single cent belonging to Onix. Brazilian police also confirmed that they had never flagged the wallet. The decision was actually made by Tether’s own T3 Financial Crime Unit, based on its own standards and its own judgment.
The complaint lists four claims: conversion, unjust enrichment, breach of fiduciary duty, and computer fraud. The demand is simple: give the money back. An even more galling point is that while the tokens remain frozen, Tether continues to collect the interest on the U.S. Treasury securities backing them, while all the costs of the freeze fall on someone else 💰
This isn’t the first time. Just about a month ago, two Thai citizens also sued Tether over $42.4 million in frozen funds. Before that, hundreds of millions of USDT flagged as linked to illegal activity were frozen over time. The irony is that the same company is criticized for freezing funds too readily, while also being accused of not freezing enough. It can’t win either way.
My take: the real significance of this case isn’t the $2.76 million. It’s a question everyone will eventually have to face: Is the stablecoin in your wallet actually your money? ⚖️ The answer for now is that it is only yours if the issuer says so. The issuer can make its own judgment and enforce it without a court ruling first. By taking this case to court, Conduit is effectively forcing the courts to clarify this gray area for the first time.
If the court requires issuers to provide evidence and pay compensation, they may be more cautious about freezing tokens in the future, and people whose funds are frozen by mistake will have a path to seek recourse. But on the other hand, it could also slow down the recovery of illicit funds. That’s the double-edged nature of it.
Let’s talk in the comments: do you think stablecoin issuers should have this kind of one-click freezing power?
Every day, I bring you the latest on stablecoins and regulatory developments—not just what’s happening, but the logic and opportunities behind the headlines 👀🚀
$2.76 million frozen just like that, with no explanation for over a year. A company has taken the world’s largest stablecoin issuer to court 🦖
📣 盘面异动群里喊
The plaintiff is cross-border payments company Conduit Technology. It filed a complaint in the U.S. District Court for the Southern District of New York, accusing Tether of freezing $2.76 million in USDT held in its treasury wallet on September 24, 2025. The reason still hasn’t been made clear, and the money had been used as the company’s operating account.
According to the complaint, the wallet was opened in May 2025 and processed more than $1.1 billion in transactions in just four months. After the freeze, the company couldn’t stay afloat: it laid off staff and closed its offices ⚠️
Tether’s stated basis was a 2024 investigation by Brazil’s Federal Police into a company called Onix. Onix did use Conduit’s platform, but Conduit says its wallet was created nearly a month after Onix’s last transaction and never held a single cent belonging to Onix. Brazilian police also confirmed that they had never flagged the wallet. The decision was actually made by Tether’s own T3 Financial Crime Unit, based on its own standards and its own judgment.
The complaint lists four claims: conversion, unjust enrichment, breach of fiduciary duty, and computer fraud. The demand is simple: give the money back. An even more galling point is that while the tokens remain frozen, Tether continues to collect the interest on the U.S. Treasury securities backing them, while all the costs of the freeze fall on someone else 💰
This isn’t the first time. Just about a month ago, two Thai citizens also sued Tether over $42.4 million in frozen funds. Before that, hundreds of millions of USDT flagged as linked to illegal activity were frozen over time. The irony is that the same company is criticized for freezing funds too readily, while also being accused of not freezing enough. It can’t win either way.
My take: the real significance of this case isn’t the $2.76 million. It’s a question everyone will eventually have to face: Is the stablecoin in your wallet actually your money? ⚖️ The answer for now is that it is only yours if the issuer says so. The issuer can make its own judgment and enforce it without a court ruling first. By taking this case to court, Conduit is effectively forcing the courts to clarify this gray area for the first time.
If the court requires issuers to provide evidence and pay compensation, they may be more cautious about freezing tokens in the future, and people whose funds are frozen by mistake will have a path to seek recourse. But on the other hand, it could also slow down the recovery of illicit funds. That’s the double-edged nature of it.
Let’s talk in the comments: do you think stablecoin issuers should have this kind of one-click freezing power?
Every day, I bring you the latest on stablecoins and regulatory developments—not just what’s happening, but the logic and opportunities behind the headlines 👀🚀
📣 盘面异动群里喊
The plaintiff is cross-border payments company Conduit Technology. It filed a complaint in the U.S. District Court for the Southern District of New York, accusing Tether of freezing $2.76 million in USDT held in its treasury wallet on September 24, 2025. The reason still hasn’t been made clear, and the money had been used as the company’s operating account.
According to the complaint, the wallet was opened in May 2025 and processed more than $1.1 billion in transactions in just four months. After the freeze, the company couldn’t stay afloat: it laid off staff and closed its offices ⚠️
Tether’s stated basis was a 2024 investigation by Brazil’s Federal Police into a company called Onix. Onix did use Conduit’s platform, but Conduit says its wallet was created nearly a month after Onix’s last transaction and never held a single cent belonging to Onix. Brazilian police also confirmed that they had never flagged the wallet. The decision was actually made by Tether’s own T3 Financial Crime Unit, based on its own standards and its own judgment.
The complaint lists four claims: conversion, unjust enrichment, breach of fiduciary duty, and computer fraud. The demand is simple: give the money back. An even more galling point is that while the tokens remain frozen, Tether continues to collect the interest on the U.S. Treasury securities backing them, while all the costs of the freeze fall on someone else 💰
This isn’t the first time. Just about a month ago, two Thai citizens also sued Tether over $42.4 million in frozen funds. Before that, hundreds of millions of USDT flagged as linked to illegal activity were frozen over time. The irony is that the same company is criticized for freezing funds too readily, while also being accused of not freezing enough. It can’t win either way.
My take: the real significance of this case isn’t the $2.76 million. It’s a question everyone will eventually have to face: Is the stablecoin in your wallet actually your money? ⚖️ The answer for now is that it is only yours if the issuer says so. The issuer can make its own judgment and enforce it without a court ruling first. By taking this case to court, Conduit is effectively forcing the courts to clarify this gray area for the first time.
If the court requires issuers to provide evidence and pay compensation, they may be more cautious about freezing tokens in the future, and people whose funds are frozen by mistake will have a path to seek recourse. But on the other hand, it could also slow down the recovery of illicit funds. That’s the double-edged nature of it.
Let’s talk in the comments: do you think stablecoin issuers should have this kind of one-click freezing power?
Every day, I bring you the latest on stablecoins and regulatory developments—not just what’s happening, but the logic and opportunities behind the headlines 👀🚀

84
·
--
#比特币三度受阻8.7万美元
Two whale accounts are betting big in the same direction, holding $1.58 billion in shorts—but Bitcoin is stuck just below $87,000 🐋
[📈 进群看今日思路](https://app.binance.com/uni-qr/JpwCPfBj)
On the afternoon of October 6, on-chain monitors showed that two linked Hyperliquid wallets held a combined net short position worth around $1.58 billion, targeting Bitcoin and Ethereum. Their shorts included 189,400 ETH and 5,120 BTC, worth about $948 million combined.
Even more intriguing is who’s behind them. On-chain analytics platforms Nansen and Arkham have both labeled the addresses as belonging to Abraxas Capital Management, a London-based investment firm managing billions of dollars in assets. Its fund is called Heka Funds.
Interestingly, both short positions are currently underwater, with combined unrealized losses of about $115 million. But the wallets have plenty of assets to back them up, including millions of dollars in recent deposits. In other words, they can afford to take the hit.
Besides Bitcoin and Ethereum, the wallets are also short SOL, HYPE, ENA, XRP, SUI, and PUMP—almost a ready-made list of bearish bets.
My take: don’t rush to treat whales as oracles. On-chain data is public, and whales know better than anyone that everyone is watching them. Visible positions like these can easily sway retail sentiment. Plus, many institutions short as a hedge, and their spot long positions may have already offset the shorts. Short positions alone don’t prove that they’re truly bearish on the broader market.
What’s worth watching is that Bitcoin climbed above $86,000 twice on Tuesday but still couldn’t break $87,000. That’s the third time it’s been turned back ⚠️ On one side, whales are adding to their shorts; on the other, Bitcoin is holding on to its October gains. With the price around $85,600, we’ll soon see who blinks first in this standoff.
Do you think the bears will win this round, or will they be forced to close their positions in a short squeeze? Let’s talk in the comments 🦖
Tap the profile picture to watch the livestream
Every day, we bring you the latest on Bitcoin, whale activity, and market trends. We don’t just tell you what’s happening—we help you understand the logic and opportunities behind it 👀🚀
#比特币三度受阻8.7万美元
Two whale accounts are betting big in the same direction, holding $1.58 billion in shorts—but Bitcoin is stuck just below $87,000 🐋
📈 进群看今日思路
On the afternoon of October 6, on-chain monitors showed that two linked Hyperliquid wallets held a combined net short position worth around $1.58 billion, targeting Bitcoin and Ethereum. Their shorts included 189,400 ETH and 5,120 BTC, worth about $948 million combined.
Even more intriguing is who’s behind them. On-chain analytics platforms Nansen and Arkham have both labeled the addresses as belonging to Abraxas Capital Management, a London-based investment firm managing billions of dollars in assets. Its fund is called Heka Funds.
Interestingly, both short positions are currently underwater, with combined unrealized losses of about $115 million. But the wallets have plenty of assets to back them up, including millions of dollars in recent deposits. In other words, they can afford to take the hit.
Besides Bitcoin and Ethereum, the wallets are also short SOL, HYPE, ENA, XRP, SUI, and PUMP—almost a ready-made list of bearish bets.
My take: don’t rush to treat whales as oracles. On-chain data is public, and whales know better than anyone that everyone is watching them. Visible positions like these can easily sway retail sentiment. Plus, many institutions short as a hedge, and their spot long positions may have already offset the shorts. Short positions alone don’t prove that they’re truly bearish on the broader market.
What’s worth watching is that Bitcoin climbed above $86,000 twice on Tuesday but still couldn’t break $87,000. That’s the third time it’s been turned back ⚠️ On one side, whales are adding to their shorts; on the other, Bitcoin is holding on to its October gains. With the price around $85,600, we’ll soon see who blinks first in this standoff.
Do you think the bears will win this round, or will they be forced to close their positions in a short squeeze? Let’s talk in the comments 🦖
Tap the profile picture to watch the livestream
Every day, we bring you the latest on Bitcoin, whale activity, and market trends. We don’t just tell you what’s happening—we help you understand the logic and opportunities behind it 👀🚀
Two whale accounts are betting big in the same direction, holding $1.58 billion in shorts—but Bitcoin is stuck just below $87,000 🐋
📈 进群看今日思路
On the afternoon of October 6, on-chain monitors showed that two linked Hyperliquid wallets held a combined net short position worth around $1.58 billion, targeting Bitcoin and Ethereum. Their shorts included 189,400 ETH and 5,120 BTC, worth about $948 million combined.
Even more intriguing is who’s behind them. On-chain analytics platforms Nansen and Arkham have both labeled the addresses as belonging to Abraxas Capital Management, a London-based investment firm managing billions of dollars in assets. Its fund is called Heka Funds.
Interestingly, both short positions are currently underwater, with combined unrealized losses of about $115 million. But the wallets have plenty of assets to back them up, including millions of dollars in recent deposits. In other words, they can afford to take the hit.
Besides Bitcoin and Ethereum, the wallets are also short SOL, HYPE, ENA, XRP, SUI, and PUMP—almost a ready-made list of bearish bets.
My take: don’t rush to treat whales as oracles. On-chain data is public, and whales know better than anyone that everyone is watching them. Visible positions like these can easily sway retail sentiment. Plus, many institutions short as a hedge, and their spot long positions may have already offset the shorts. Short positions alone don’t prove that they’re truly bearish on the broader market.
What’s worth watching is that Bitcoin climbed above $86,000 twice on Tuesday but still couldn’t break $87,000. That’s the third time it’s been turned back ⚠️ On one side, whales are adding to their shorts; on the other, Bitcoin is holding on to its October gains. With the price around $85,600, we’ll soon see who blinks first in this standoff.
Do you think the bears will win this round, or will they be forced to close their positions in a short squeeze? Let’s talk in the comments 🦖
Tap the profile picture to watch the livestream
Every day, we bring you the latest on Bitcoin, whale activity, and market trends. We don’t just tell you what’s happening—we help you understand the logic and opportunities behind it 👀🚀
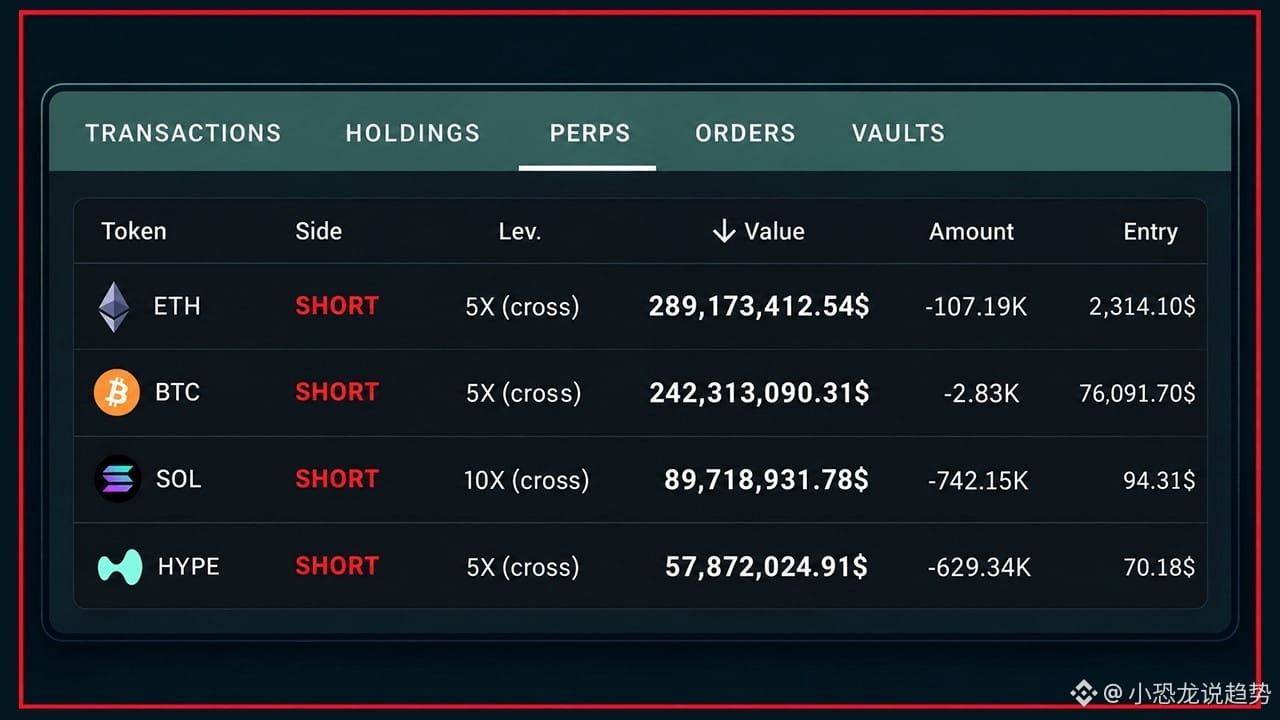
1.2k
·
--
#比特币三度受阻8.7万美元
Rejected at $87,000 for the Third Time: Bitcoin Gets Slapped Back 🦖
[🧭 群里聊方向](https://app.binance.com/uni-qr/JpwCPfBj)
Bitcoin failed for the third time early this morning to break through $87,000. Its price fell 1.2% to around $85,600, and the total crypto market cap shrank to about $2.93 trillion. Since September 23, this same wall has turned it back three times.
First, what exactly is this wall? Every time the price climbs above $87,000, a wave of sell orders appears and pushes it back down. That suggests a crowd of holders is waiting to sell at that level. Analysts explain that Bitcoin has reached the apex of a triangle, with rising support below and resistance at $87,000 overhead—a level that’s been holding firm for more than ten days. Volatility will only increase before a breakout.
Now let’s look at what actually happened overnight. U.S. Bitcoin ETFs saw net outflows of around $90 million in a single day 🔴 Meanwhile, the yield on 10-year U.S. Treasuries rose to 5.32%, its highest level since 2002, while the two-year yield climbed to 4.83%. The Nasdaq 100 closed at a record high, and the S&P 500 was just 0.5% shy of its record. In other words, money hasn’t disappeared—it’s moving into U.S. stocks and bonds, not Bitcoin.
The most interesting part is the rotation within the crypto market. ADA surged 11% in a day, NEAR and GRT each gained around 7%, and HYPE rose 3% against the trend to $94. Meanwhile, Ethereum, XRP, SOL, and Dogecoin all fell 1% to 2%, while BNB dropped 2.5% ⚠️ This isn’t a market-wide collapse. It’s capital moving out of large-cap leaders and into smaller coins in search of greater upside.
My take: Bitcoin needs real spot buying to absorb the selling pressure before it can truly clear $87,000. A rebound driven by leverage and short covering will just get knocked back by the same sell orders. If it can establish itself above that level, the way opens to highs not seen in eight months 📈 To the downside, $84,000 is the short-term support level. If it breaks, $80,000 will come back into view.
Put simply, bulls and bears are locked in a tight range, each trying to outlast the other. Whoever blinks first loses. The real direction won’t be decided by today’s small red candle, but by whether fresh money is willing to buy at these prices.
Do you think this is the final shakeout before a push to new highs, or a sign the rebound has run its course? Share your take in the comments.
I bring you the latest Bitcoin news every day—not just what’s happening, but the logic and opportunities behind it 👀🚀
Tap my profile picture to watch the livestream
#比特币三度受阻8.7万美元
Rejected at $87,000 for the Third Time: Bitcoin Gets Slapped Back 🦖
🧭 群里聊方向
Bitcoin failed for the third time early this morning to break through $87,000. Its price fell 1.2% to around $85,600, and the total crypto market cap shrank to about $2.93 trillion. Since September 23, this same wall has turned it back three times.
First, what exactly is this wall? Every time the price climbs above $87,000, a wave of sell orders appears and pushes it back down. That suggests a crowd of holders is waiting to sell at that level. Analysts explain that Bitcoin has reached the apex of a triangle, with rising support below and resistance at $87,000 overhead—a level that’s been holding firm for more than ten days. Volatility will only increase before a breakout.
Now let’s look at what actually happened overnight. U.S. Bitcoin ETFs saw net outflows of around $90 million in a single day 🔴 Meanwhile, the yield on 10-year U.S. Treasuries rose to 5.32%, its highest level since 2002, while the two-year yield climbed to 4.83%. The Nasdaq 100 closed at a record high, and the S&P 500 was just 0.5% shy of its record. In other words, money hasn’t disappeared—it’s moving into U.S. stocks and bonds, not Bitcoin.
The most interesting part is the rotation within the crypto market. ADA surged 11% in a day, NEAR and GRT each gained around 7%, and HYPE rose 3% against the trend to $94. Meanwhile, Ethereum, XRP, SOL, and Dogecoin all fell 1% to 2%, while BNB dropped 2.5% ⚠️ This isn’t a market-wide collapse. It’s capital moving out of large-cap leaders and into smaller coins in search of greater upside.
My take: Bitcoin needs real spot buying to absorb the selling pressure before it can truly clear $87,000. A rebound driven by leverage and short covering will just get knocked back by the same sell orders. If it can establish itself above that level, the way opens to highs not seen in eight months 📈 To the downside, $84,000 is the short-term support level. If it breaks, $80,000 will come back into view.
Put simply, bulls and bears are locked in a tight range, each trying to outlast the other. Whoever blinks first loses. The real direction won’t be decided by today’s small red candle, but by whether fresh money is willing to buy at these prices.
Do you think this is the final shakeout before a push to new highs, or a sign the rebound has run its course? Share your take in the comments.
I bring you the latest Bitcoin news every day—not just what’s happening, but the logic and opportunities behind it 👀🚀
Tap my profile picture to watch the livestream
Rejected at $87,000 for the Third Time: Bitcoin Gets Slapped Back 🦖
🧭 群里聊方向
Bitcoin failed for the third time early this morning to break through $87,000. Its price fell 1.2% to around $85,600, and the total crypto market cap shrank to about $2.93 trillion. Since September 23, this same wall has turned it back three times.
First, what exactly is this wall? Every time the price climbs above $87,000, a wave of sell orders appears and pushes it back down. That suggests a crowd of holders is waiting to sell at that level. Analysts explain that Bitcoin has reached the apex of a triangle, with rising support below and resistance at $87,000 overhead—a level that’s been holding firm for more than ten days. Volatility will only increase before a breakout.
Now let’s look at what actually happened overnight. U.S. Bitcoin ETFs saw net outflows of around $90 million in a single day 🔴 Meanwhile, the yield on 10-year U.S. Treasuries rose to 5.32%, its highest level since 2002, while the two-year yield climbed to 4.83%. The Nasdaq 100 closed at a record high, and the S&P 500 was just 0.5% shy of its record. In other words, money hasn’t disappeared—it’s moving into U.S. stocks and bonds, not Bitcoin.
The most interesting part is the rotation within the crypto market. ADA surged 11% in a day, NEAR and GRT each gained around 7%, and HYPE rose 3% against the trend to $94. Meanwhile, Ethereum, XRP, SOL, and Dogecoin all fell 1% to 2%, while BNB dropped 2.5% ⚠️ This isn’t a market-wide collapse. It’s capital moving out of large-cap leaders and into smaller coins in search of greater upside.
My take: Bitcoin needs real spot buying to absorb the selling pressure before it can truly clear $87,000. A rebound driven by leverage and short covering will just get knocked back by the same sell orders. If it can establish itself above that level, the way opens to highs not seen in eight months 📈 To the downside, $84,000 is the short-term support level. If it breaks, $80,000 will come back into view.
Put simply, bulls and bears are locked in a tight range, each trying to outlast the other. Whoever blinks first loses. The real direction won’t be decided by today’s small red candle, but by whether fresh money is willing to buy at these prices.
Do you think this is the final shakeout before a push to new highs, or a sign the rebound has run its course? Share your take in the comments.
I bring you the latest Bitcoin news every day—not just what’s happening, but the logic and opportunities behind it 👀🚀
Tap my profile picture to watch the livestream
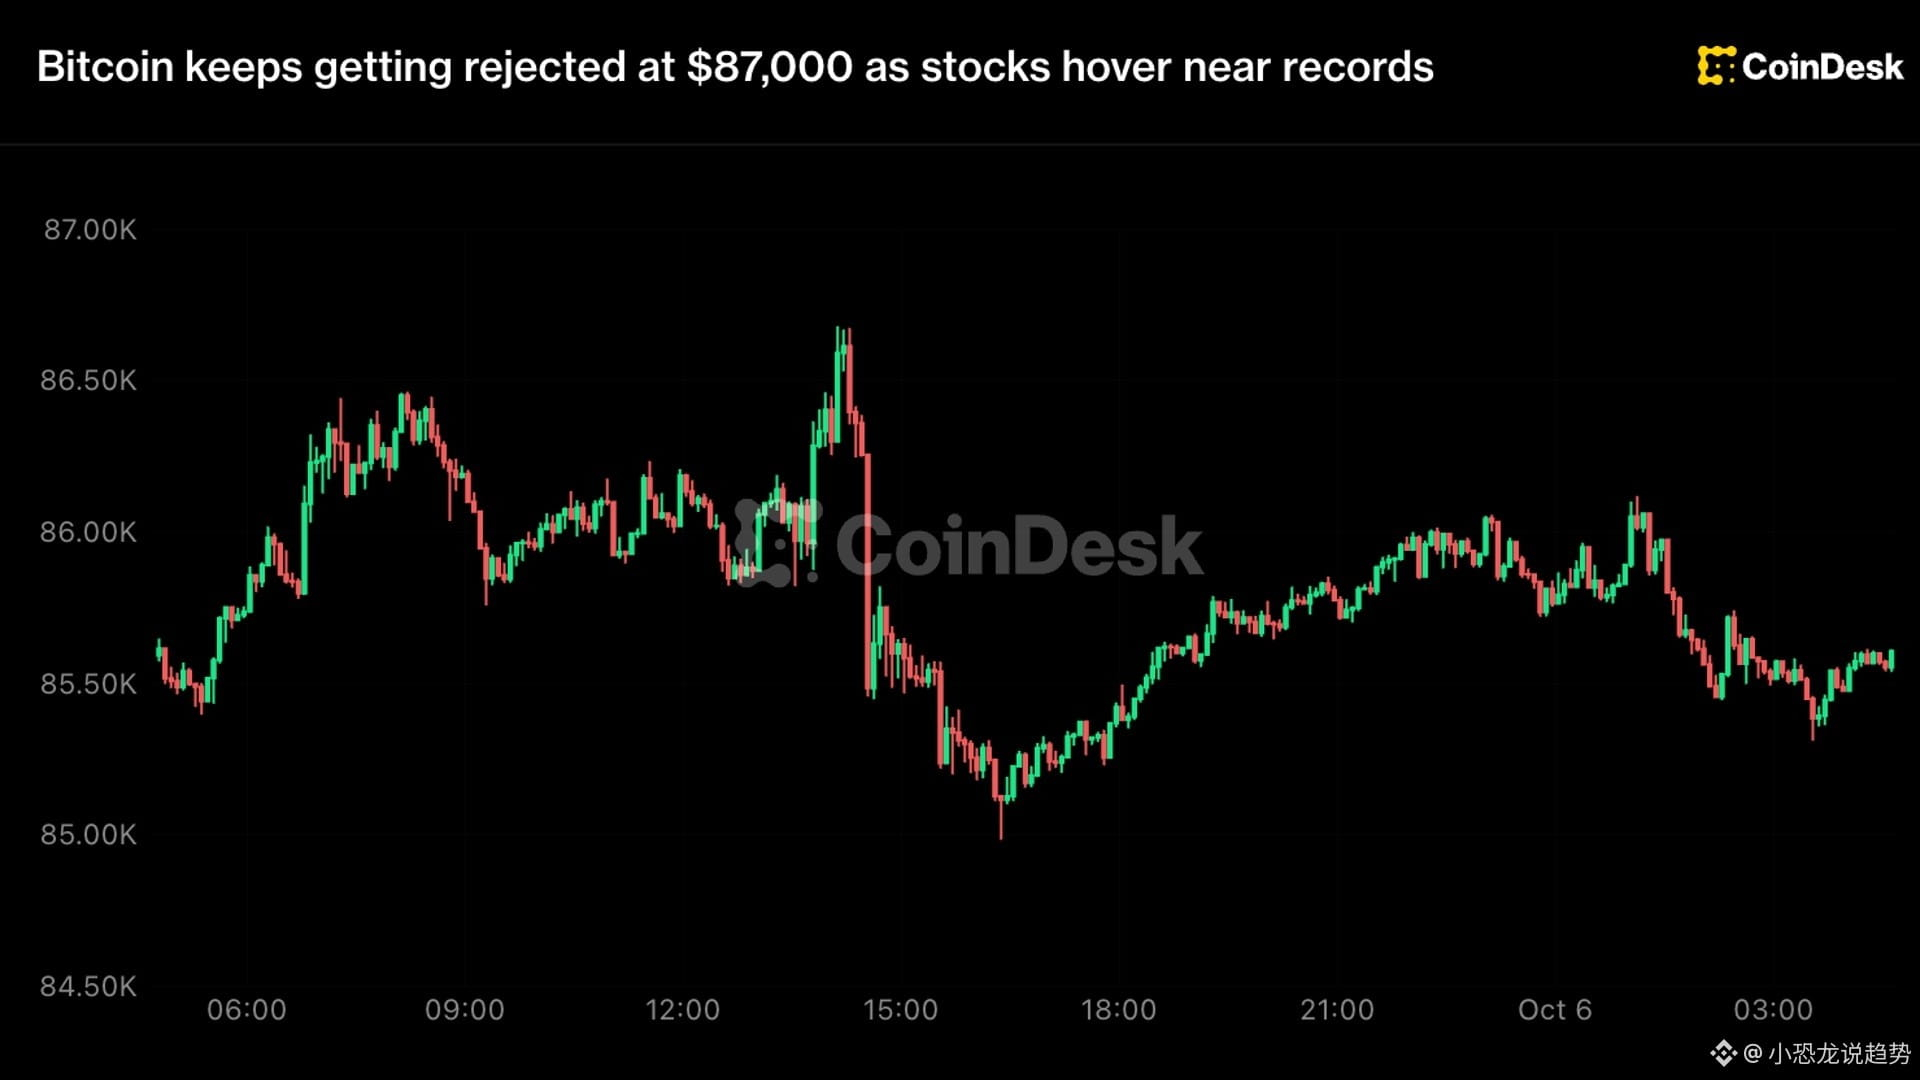
1.3k
·
--
#以太坊q3涨70%流动性下降
Ethereum surged 70% in Q3, but its order-book depth is now just 40% of Bitcoin’s 🦖
[📊 进群看每日策略](https://app.binance.com/uni-qr/JpwCPfBj)
Ethereum rose 70% in Q3, outperforming Bitcoin’s 42% gain. But a CoinGecko report compiled by TechFlow reveals a striking contrast: the asset that rose the most is seeing its order book get thinner.
CoinGecko measured the median daily market depth for Ethereum from July 6 to September 30. It was only 35% to 45% of Bitcoin’s. At the same time last year, the ratio was at least 60%. 📉
The numbers make it even clearer: within 0.15% of the market price, Ethereum’s depth was just $13 million to $14 million. In other words, a trade worth tens of millions of dollars could move the price by 0.15%. It’s getting harder for large orders to enter and exit smoothly without making waves. ⚠️
Ethereum isn’t the only one seeing thinner order books. SOL’s depth within 2% of the market price has fallen from about $28 million on each side of the order book last year to around $20 million now. This 2% depth is precisely what determines how much selling or buying pressure the market can absorb during a sharp move. 🐋
By comparison, XRP’s total depth has remained steady at around $30 million, with about $18 million in buy orders and $14 million in sell orders—a clear imbalance. More interestingly, XRP’s market cap is about 40% higher than SOL’s, yet its 2% depth is still lower. One reason is that SOL’s average daily trading volume is 25% higher than XRP’s.
Put simply, a 70% gain doesn’t mean stronger market support. Price gains reflect sentiment; depth is the foundation. A thin order book has a straightforward consequence: the same amount of capital can cause a bigger swing. It feels great on the way up, but if a large sell order hits, prices can fall faster than most people can trigger their stop-losses.
Adding to the backdrop, spot Ethereum ETFs saw net outflows of about $51 million on Monday, marking five consecutive trading days of outflows. The total outflow over those five days was about $206 million. Meanwhile, the 10-year U.S. Treasury yield is above 5%, and risk-free assets are competing with risk assets for capital.
What I think is worth watching isn’t how much higher ETH can go, but whether its market depth can recover. If prices keep rising without depth returning, volatility in this rally will increase, and pullbacks could bring a string of further drops.
Do you hold ETH or SOL? Do you think this rally is driven by real demand, or is it just a flash of excitement in a thin market?
I bring you the latest crypto market trends every day—not just what’s happening in the news, but also the logic and opportunities behind it. 👀🚀
Tap my profile picture to watch the livestream
#以太坊q3涨70%流动性下降
Ethereum surged 70% in Q3, but its order-book depth is now just 40% of Bitcoin’s 🦖
📊 进群看每日策略
Ethereum rose 70% in Q3, outperforming Bitcoin’s 42% gain. But a CoinGecko report compiled by TechFlow reveals a striking contrast: the asset that rose the most is seeing its order book get thinner.
CoinGecko measured the median daily market depth for Ethereum from July 6 to September 30. It was only 35% to 45% of Bitcoin’s. At the same time last year, the ratio was at least 60%. 📉
The numbers make it even clearer: within 0.15% of the market price, Ethereum’s depth was just $13 million to $14 million. In other words, a trade worth tens of millions of dollars could move the price by 0.15%. It’s getting harder for large orders to enter and exit smoothly without making waves. ⚠️
Ethereum isn’t the only one seeing thinner order books. SOL’s depth within 2% of the market price has fallen from about $28 million on each side of the order book last year to around $20 million now. This 2% depth is precisely what determines how much selling or buying pressure the market can absorb during a sharp move. 🐋
By comparison, XRP’s total depth has remained steady at around $30 million, with about $18 million in buy orders and $14 million in sell orders—a clear imbalance. More interestingly, XRP’s market cap is about 40% higher than SOL’s, yet its 2% depth is still lower. One reason is that SOL’s average daily trading volume is 25% higher than XRP’s.
Put simply, a 70% gain doesn’t mean stronger market support. Price gains reflect sentiment; depth is the foundation. A thin order book has a straightforward consequence: the same amount of capital can cause a bigger swing. It feels great on the way up, but if a large sell order hits, prices can fall faster than most people can trigger their stop-losses.
Adding to the backdrop, spot Ethereum ETFs saw net outflows of about $51 million on Monday, marking five consecutive trading days of outflows. The total outflow over those five days was about $206 million. Meanwhile, the 10-year U.S. Treasury yield is above 5%, and risk-free assets are competing with risk assets for capital.
What I think is worth watching isn’t how much higher ETH can go, but whether its market depth can recover. If prices keep rising without depth returning, volatility in this rally will increase, and pullbacks could bring a string of further drops.
Do you hold ETH or SOL? Do you think this rally is driven by real demand, or is it just a flash of excitement in a thin market?
I bring you the latest crypto market trends every day—not just what’s happening in the news, but also the logic and opportunities behind it. 👀🚀
Tap my profile picture to watch the livestream
Ethereum surged 70% in Q3, but its order-book depth is now just 40% of Bitcoin’s 🦖
📊 进群看每日策略
Ethereum rose 70% in Q3, outperforming Bitcoin’s 42% gain. But a CoinGecko report compiled by TechFlow reveals a striking contrast: the asset that rose the most is seeing its order book get thinner.
CoinGecko measured the median daily market depth for Ethereum from July 6 to September 30. It was only 35% to 45% of Bitcoin’s. At the same time last year, the ratio was at least 60%. 📉
The numbers make it even clearer: within 0.15% of the market price, Ethereum’s depth was just $13 million to $14 million. In other words, a trade worth tens of millions of dollars could move the price by 0.15%. It’s getting harder for large orders to enter and exit smoothly without making waves. ⚠️
Ethereum isn’t the only one seeing thinner order books. SOL’s depth within 2% of the market price has fallen from about $28 million on each side of the order book last year to around $20 million now. This 2% depth is precisely what determines how much selling or buying pressure the market can absorb during a sharp move. 🐋
By comparison, XRP’s total depth has remained steady at around $30 million, with about $18 million in buy orders and $14 million in sell orders—a clear imbalance. More interestingly, XRP’s market cap is about 40% higher than SOL’s, yet its 2% depth is still lower. One reason is that SOL’s average daily trading volume is 25% higher than XRP’s.
Put simply, a 70% gain doesn’t mean stronger market support. Price gains reflect sentiment; depth is the foundation. A thin order book has a straightforward consequence: the same amount of capital can cause a bigger swing. It feels great on the way up, but if a large sell order hits, prices can fall faster than most people can trigger their stop-losses.
Adding to the backdrop, spot Ethereum ETFs saw net outflows of about $51 million on Monday, marking five consecutive trading days of outflows. The total outflow over those five days was about $206 million. Meanwhile, the 10-year U.S. Treasury yield is above 5%, and risk-free assets are competing with risk assets for capital.
What I think is worth watching isn’t how much higher ETH can go, but whether its market depth can recover. If prices keep rising without depth returning, volatility in this rally will increase, and pullbacks could bring a string of further drops.
Do you hold ETH or SOL? Do you think this rally is driven by real demand, or is it just a flash of excitement in a thin market?
I bring you the latest crypto market trends every day—not just what’s happening in the news, but also the logic and opportunities behind it. 👀🚀
Tap my profile picture to watch the livestream

627
·
--
Verified
#ada涨10%突破0.27美元
Bitcoin stays put while ADA rockets 12% in a day to a five-month high 🦖
[📢 ⏰ 消息群里第一时间说](https://app.binance.com/uni-qr/JpwCPfBj)
On October 5, Cardano’s native token ADA touched an intraday high of $0.27, gaining around 12% on the day. It was ADA’s strongest day since May this year and its highest price in five months. Meanwhile, Bitcoin barely moved around $85,700, and Ethereum hovered around $2,712—the rally wasn’t following the broader market; it was doing its own thing.
The momentum came from two things. On the fundamentals side: RealFi launched its mainnet on October 1, bringing real-world assets (RWAs) onto the Cardano mainnet. At the same time, the USDr stablecoin was integrated into three DeFi apps: Lace, Liqwid, and SundaeSwap. On the narrative side: after ADA started climbing, its founder posted a 15-minute ADA/USDT chart showing the price rise from around 0.244 to 0.264, along with the hashtag #LeiosIsComing. It became the community’s rallying cry that day 📈.
So what exactly is Leios? Its full name is Linear Leios, its specification number is CIP-164, and it’s part of the Dijkstra hard fork. The idea isn’t to replace the existing main chain—Ouroboros Praos will continue to handle security and ordering, with an additional layer of “endorsement blocks” to bundle more transactions. Stake pools will verify these blocks using BLS signatures before they’re added to the ledger. Since June 2026, the system has been running on the Musashi Dojo testnet, with data processing speeds reaching around 6 times higher. Developers estimate that under ideal conditions, throughput could increase by 10 to 65 times.
The technical indicators are also lining up: the 50-day moving average has crossed above the 200-day moving average, forming a golden cross, while the daily momentum indicator has climbed to 68.69, nearing overbought territory. The next major hurdle above is $0.28.
But there’s a contrast worth watching. Actual trading volume for ADA on decentralized exchanges (DEXs) hasn’t kept pace with the price surge—the hype is running ahead of real usage. And Leios won’t actually go live until the end of 2026, alongside Dijkstra. After launch, stake pool operators will also need to manually register their cryptographic keys, and throughput will be increased gradually by tuning parameters—it won’t reach full power at the flip of a switch ⚠️.
In other words: this looks more like a “narrative-first” rally—a hashtag and a roadmap were enough to send a coin that had been decoupled from the broader market up 12%. What will really determine whether it can hold above $0.27 or even test $0.28 isn’t the next post, but whether DEX trading and staking interest on-chain can catch up.
Let’s talk in the comments: do you think this rally is pricing in upgrade expectations early, or is it another case of “news pumps the price, but on-chain activity doesn’t follow”?
Every day, we bring you the latest crypto market trends—not just what’s happening, but the logic and opportunities behind it 👀🚀
Tap the profile picture to watch the livestream
#ada涨10%突破0.27美元
Bitcoin stays put while ADA rockets 12% in a day to a five-month high 🦖
📢 ⏰ 消息群里第一时间说
On October 5, Cardano’s native token ADA touched an intraday high of $0.27, gaining around 12% on the day. It was ADA’s strongest day since May this year and its highest price in five months. Meanwhile, Bitcoin barely moved around $85,700, and Ethereum hovered around $2,712—the rally wasn’t following the broader market; it was doing its own thing.
The momentum came from two things. On the fundamentals side: RealFi launched its mainnet on October 1, bringing real-world assets (RWAs) onto the Cardano mainnet. At the same time, the USDr stablecoin was integrated into three DeFi apps: Lace, Liqwid, and SundaeSwap. On the narrative side: after ADA started climbing, its founder posted a 15-minute ADA/USDT chart showing the price rise from around 0.244 to 0.264, along with the hashtag #LeiosIsComing. It became the community’s rallying cry that day 📈.
So what exactly is Leios? Its full name is Linear Leios, its specification number is CIP-164, and it’s part of the Dijkstra hard fork. The idea isn’t to replace the existing main chain—Ouroboros Praos will continue to handle security and ordering, with an additional layer of “endorsement blocks” to bundle more transactions. Stake pools will verify these blocks using BLS signatures before they’re added to the ledger. Since June 2026, the system has been running on the Musashi Dojo testnet, with data processing speeds reaching around 6 times higher. Developers estimate that under ideal conditions, throughput could increase by 10 to 65 times.
The technical indicators are also lining up: the 50-day moving average has crossed above the 200-day moving average, forming a golden cross, while the daily momentum indicator has climbed to 68.69, nearing overbought territory. The next major hurdle above is $0.28.
But there’s a contrast worth watching. Actual trading volume for ADA on decentralized exchanges (DEXs) hasn’t kept pace with the price surge—the hype is running ahead of real usage. And Leios won’t actually go live until the end of 2026, alongside Dijkstra. After launch, stake pool operators will also need to manually register their cryptographic keys, and throughput will be increased gradually by tuning parameters—it won’t reach full power at the flip of a switch ⚠️.
In other words: this looks more like a “narrative-first” rally—a hashtag and a roadmap were enough to send a coin that had been decoupled from the broader market up 12%. What will really determine whether it can hold above $0.27 or even test $0.28 isn’t the next post, but whether DEX trading and staking interest on-chain can catch up.
Let’s talk in the comments: do you think this rally is pricing in upgrade expectations early, or is it another case of “news pumps the price, but on-chain activity doesn’t follow”?
Every day, we bring you the latest crypto market trends—not just what’s happening, but the logic and opportunities behind it 👀🚀
Tap the profile picture to watch the livestream
Bitcoin stays put while ADA rockets 12% in a day to a five-month high 🦖
📢 ⏰ 消息群里第一时间说
On October 5, Cardano’s native token ADA touched an intraday high of $0.27, gaining around 12% on the day. It was ADA’s strongest day since May this year and its highest price in five months. Meanwhile, Bitcoin barely moved around $85,700, and Ethereum hovered around $2,712—the rally wasn’t following the broader market; it was doing its own thing.
The momentum came from two things. On the fundamentals side: RealFi launched its mainnet on October 1, bringing real-world assets (RWAs) onto the Cardano mainnet. At the same time, the USDr stablecoin was integrated into three DeFi apps: Lace, Liqwid, and SundaeSwap. On the narrative side: after ADA started climbing, its founder posted a 15-minute ADA/USDT chart showing the price rise from around 0.244 to 0.264, along with the hashtag #LeiosIsComing. It became the community’s rallying cry that day 📈.
So what exactly is Leios? Its full name is Linear Leios, its specification number is CIP-164, and it’s part of the Dijkstra hard fork. The idea isn’t to replace the existing main chain—Ouroboros Praos will continue to handle security and ordering, with an additional layer of “endorsement blocks” to bundle more transactions. Stake pools will verify these blocks using BLS signatures before they’re added to the ledger. Since June 2026, the system has been running on the Musashi Dojo testnet, with data processing speeds reaching around 6 times higher. Developers estimate that under ideal conditions, throughput could increase by 10 to 65 times.
The technical indicators are also lining up: the 50-day moving average has crossed above the 200-day moving average, forming a golden cross, while the daily momentum indicator has climbed to 68.69, nearing overbought territory. The next major hurdle above is $0.28.
But there’s a contrast worth watching. Actual trading volume for ADA on decentralized exchanges (DEXs) hasn’t kept pace with the price surge—the hype is running ahead of real usage. And Leios won’t actually go live until the end of 2026, alongside Dijkstra. After launch, stake pool operators will also need to manually register their cryptographic keys, and throughput will be increased gradually by tuning parameters—it won’t reach full power at the flip of a switch ⚠️.
In other words: this looks more like a “narrative-first” rally—a hashtag and a roadmap were enough to send a coin that had been decoupled from the broader market up 12%. What will really determine whether it can hold above $0.27 or even test $0.28 isn’t the next post, but whether DEX trading and staking interest on-chain can catch up.
Let’s talk in the comments: do you think this rally is pricing in upgrade expectations early, or is it another case of “news pumps the price, but on-chain activity doesn’t follow”?
Every day, we bring you the latest crypto market trends—not just what’s happening, but the logic and opportunities behind it 👀🚀
Tap the profile picture to watch the livestream

2
2.3k
·
--
#美联储10月维持利率概率升至82.3%
Bitcoin rose 43% in three months, but hit a 5% wall 🦖
[⚡ 有大动静群里说](https://app.binance.com/uni-qr/JpwCPfBj)
This was Bitcoin’s best third quarter since 2017, but research firm Delphi Digital poured cold water on the rally in its latest weekly report: the real obstacle isn’t the crypto market itself—it’s U.S. Treasury yields, which have climbed above 5%, their highest level in decades.
Here’s what they said, translated: “When a government bond can offer a risk-free return of more than 5%, every risk asset has to work twice as hard to justify the investment.” 💥
Here are the numbers: Bitcoin briefly surged to $87,000 last week, gaining more than 35% since mid-August and 43% over the third quarter as a whole. Meanwhile, the U.S. Treasury repeatedly increased the scale of its long-term bond buybacks, taking them all the way up to $6 billion just to support liquidity in the bond market. The money hasn’t disappeared—it’s just found a more comfortable place to go.
The real turning point came last Friday. The U.S. added just 29,000 jobs in September, far below the market’s expectation of 80,000, according to the Bureau of Labor Statistics. That sent the market’s odds of a rate hike in October tumbling from above 75% a week earlier to around 24% (CME FedWatch). New York Fed President Williams also said: “Given what we’ve already done in September, there’s no need to rush.”
My take: In the short term, this gives Bitcoin some breathing room. Cooling rate expectations give risk assets a chance to catch their breath. But in the medium term, its real rival isn’t the Fed—it’s that 5% Treasury yield. As long as “5% risk-free” remains on offer, every Bitcoin rally has to prove it’s “worth more than Treasuries.” The “debasement trade”—the idea that government debt and money printing will dilute the dollar—makes sense in theory, but it takes time, not a sudden breakout.
Two things are worth watching: whether the Fed really holds rates steady at its October meeting, and whether long-term Treasury yields can fall back below 5%. A change in either could shift Bitcoin’s direction. 📉
Let’s talk in the comments: If risk-free returns really are 5%, how much of your portfolio would you still allocate to Bitcoin?
Tap the profile picture to watch the livestream.
Every day, we bring you the latest in crypto—not just what’s happening, but the logic and opportunities behind it 👀🚀
#美联储10月维持利率概率升至82.3%
Bitcoin rose 43% in three months, but hit a 5% wall 🦖
⚡ 有大动静群里说
This was Bitcoin’s best third quarter since 2017, but research firm Delphi Digital poured cold water on the rally in its latest weekly report: the real obstacle isn’t the crypto market itself—it’s U.S. Treasury yields, which have climbed above 5%, their highest level in decades.
Here’s what they said, translated: “When a government bond can offer a risk-free return of more than 5%, every risk asset has to work twice as hard to justify the investment.” 💥
Here are the numbers: Bitcoin briefly surged to $87,000 last week, gaining more than 35% since mid-August and 43% over the third quarter as a whole. Meanwhile, the U.S. Treasury repeatedly increased the scale of its long-term bond buybacks, taking them all the way up to $6 billion just to support liquidity in the bond market. The money hasn’t disappeared—it’s just found a more comfortable place to go.
The real turning point came last Friday. The U.S. added just 29,000 jobs in September, far below the market’s expectation of 80,000, according to the Bureau of Labor Statistics. That sent the market’s odds of a rate hike in October tumbling from above 75% a week earlier to around 24% (CME FedWatch). New York Fed President Williams also said: “Given what we’ve already done in September, there’s no need to rush.”
My take: In the short term, this gives Bitcoin some breathing room. Cooling rate expectations give risk assets a chance to catch their breath. But in the medium term, its real rival isn’t the Fed—it’s that 5% Treasury yield. As long as “5% risk-free” remains on offer, every Bitcoin rally has to prove it’s “worth more than Treasuries.” The “debasement trade”—the idea that government debt and money printing will dilute the dollar—makes sense in theory, but it takes time, not a sudden breakout.
Two things are worth watching: whether the Fed really holds rates steady at its October meeting, and whether long-term Treasury yields can fall back below 5%. A change in either could shift Bitcoin’s direction. 📉
Let’s talk in the comments: If risk-free returns really are 5%, how much of your portfolio would you still allocate to Bitcoin?
Tap the profile picture to watch the livestream.
Every day, we bring you the latest in crypto—not just what’s happening, but the logic and opportunities behind it 👀🚀
Bitcoin rose 43% in three months, but hit a 5% wall 🦖
⚡ 有大动静群里说
This was Bitcoin’s best third quarter since 2017, but research firm Delphi Digital poured cold water on the rally in its latest weekly report: the real obstacle isn’t the crypto market itself—it’s U.S. Treasury yields, which have climbed above 5%, their highest level in decades.
Here’s what they said, translated: “When a government bond can offer a risk-free return of more than 5%, every risk asset has to work twice as hard to justify the investment.” 💥
Here are the numbers: Bitcoin briefly surged to $87,000 last week, gaining more than 35% since mid-August and 43% over the third quarter as a whole. Meanwhile, the U.S. Treasury repeatedly increased the scale of its long-term bond buybacks, taking them all the way up to $6 billion just to support liquidity in the bond market. The money hasn’t disappeared—it’s just found a more comfortable place to go.
The real turning point came last Friday. The U.S. added just 29,000 jobs in September, far below the market’s expectation of 80,000, according to the Bureau of Labor Statistics. That sent the market’s odds of a rate hike in October tumbling from above 75% a week earlier to around 24% (CME FedWatch). New York Fed President Williams also said: “Given what we’ve already done in September, there’s no need to rush.”
My take: In the short term, this gives Bitcoin some breathing room. Cooling rate expectations give risk assets a chance to catch their breath. But in the medium term, its real rival isn’t the Fed—it’s that 5% Treasury yield. As long as “5% risk-free” remains on offer, every Bitcoin rally has to prove it’s “worth more than Treasuries.” The “debasement trade”—the idea that government debt and money printing will dilute the dollar—makes sense in theory, but it takes time, not a sudden breakout.
Two things are worth watching: whether the Fed really holds rates steady at its October meeting, and whether long-term Treasury yields can fall back below 5%. A change in either could shift Bitcoin’s direction. 📉
Let’s talk in the comments: If risk-free returns really are 5%, how much of your portfolio would you still allocate to Bitcoin?
Tap the profile picture to watch the livestream.
Every day, we bring you the latest in crypto—not just what’s happening, but the logic and opportunities behind it 👀🚀

1
519
·
--
#solana代币化股票9月交易量破44亿美元
Tokenized stocks: a month of trading volume reaches $4.4 billion. The NYSE parent company now wants to personally move 60+ U.S. stocks onto the blockchain 🦖
[💬 群里一起聊行情](https://app.binance.com/uni-qr/JpwCPfBj)
First, let’s talk about the new move. A leading crypto exchange has formed a 50-50 joint venture with the New York Stock Exchange’s parent company, Intercontinental Exchange (ICE). This month, the JV has already filed an application with the U.S. SEC, planning to operate a “Tokenized Securities Trading Venue” (TSV). The first batch will cover stocks from more than 60 companies listed in the U.S. The basis is the SEC’s “Innovation Exemption” issued in September—allowing certain on-chain venues to conduct limited trading of tokenized U.S. stocks. Trades would go through automated market makers and liquidity-pool matching, without needing to route through traditional matching venues.
Why is this timing worth watching? Because this track has already started heating up. Tokenized stocks on Solana saw trading volume exceed $4.4 billion in September, setting a monthly record. The main drivers are the on-chain trading venues Raydium and Orca. But here’s the cold shower: $4.4 billion is the cumulative trading amount between both buyers and sellers—it is not market cap, and it’s not new capital flowing in. In fact, the value of tokenized stocks truly circulating on Solana in September was only about $684 million.
Put the two together, and the context becomes clear: first, the SEC exemption cracks open the gate; then major institutions with licenses rush to get in. A player of this level from the NYSE parent company matters more than short-term trading volume—it signals that “stocks on-chain” is moving from a crypto-native niche into legitimate business that traditional exchanges also want to compete for.
For ordinary users, the most direct change could be this: in the future, you really may be able to trade U.S. stocks 24/7 using stablecoins, without waiting for traditional brokerages to open. But on the flip side, the pricing, clearing, and which country’s securities laws govern tokenized stocks—these gaps still haven’t been filled. ⚖️
There’s another more realistic problem: the current “pool” is only on the order of a few hundred million dollars. If a large institution truly moves in funds at the tens-of-millions or even millions scale, insufficient depth would immediately amplify the issue. You might think you’re buying “U.S. stocks,” but you may actually just be buying a thinly liquid instrument—or a voucher with regulatory questions still hanging over it. 📉
If one day Apple or Nvidia can truly buy U.S. stocks on-chain 24/7 with stablecoins, would you move part of your U.S. stock positions onto the chain? Let’s discuss in the comments.
Click the avatar to watch the livestream
Every day, I’ll take you through crypto hot topics—not just what happens in the news, but also the logic and opportunities behind it 👀🚀
#solana代币化股票9月交易量破44亿美元
Tokenized stocks: a month of trading volume reaches $4.4 billion. The NYSE parent company now wants to personally move 60+ U.S. stocks onto the blockchain 🦖
💬 群里一起聊行情
First, let’s talk about the new move. A leading crypto exchange has formed a 50-50 joint venture with the New York Stock Exchange’s parent company, Intercontinental Exchange (ICE). This month, the JV has already filed an application with the U.S. SEC, planning to operate a “Tokenized Securities Trading Venue” (TSV). The first batch will cover stocks from more than 60 companies listed in the U.S. The basis is the SEC’s “Innovation Exemption” issued in September—allowing certain on-chain venues to conduct limited trading of tokenized U.S. stocks. Trades would go through automated market makers and liquidity-pool matching, without needing to route through traditional matching venues.
Why is this timing worth watching? Because this track has already started heating up. Tokenized stocks on Solana saw trading volume exceed $4.4 billion in September, setting a monthly record. The main drivers are the on-chain trading venues Raydium and Orca. But here’s the cold shower: $4.4 billion is the cumulative trading amount between both buyers and sellers—it is not market cap, and it’s not new capital flowing in. In fact, the value of tokenized stocks truly circulating on Solana in September was only about $684 million.
Put the two together, and the context becomes clear: first, the SEC exemption cracks open the gate; then major institutions with licenses rush to get in. A player of this level from the NYSE parent company matters more than short-term trading volume—it signals that “stocks on-chain” is moving from a crypto-native niche into legitimate business that traditional exchanges also want to compete for.
For ordinary users, the most direct change could be this: in the future, you really may be able to trade U.S. stocks 24/7 using stablecoins, without waiting for traditional brokerages to open. But on the flip side, the pricing, clearing, and which country’s securities laws govern tokenized stocks—these gaps still haven’t been filled. ⚖️
There’s another more realistic problem: the current “pool” is only on the order of a few hundred million dollars. If a large institution truly moves in funds at the tens-of-millions or even millions scale, insufficient depth would immediately amplify the issue. You might think you’re buying “U.S. stocks,” but you may actually just be buying a thinly liquid instrument—or a voucher with regulatory questions still hanging over it. 📉
If one day Apple or Nvidia can truly buy U.S. stocks on-chain 24/7 with stablecoins, would you move part of your U.S. stock positions onto the chain? Let’s discuss in the comments.
Click the avatar to watch the livestream
Every day, I’ll take you through crypto hot topics—not just what happens in the news, but also the logic and opportunities behind it 👀🚀
Tokenized stocks: a month of trading volume reaches $4.4 billion. The NYSE parent company now wants to personally move 60+ U.S. stocks onto the blockchain 🦖
💬 群里一起聊行情
First, let’s talk about the new move. A leading crypto exchange has formed a 50-50 joint venture with the New York Stock Exchange’s parent company, Intercontinental Exchange (ICE). This month, the JV has already filed an application with the U.S. SEC, planning to operate a “Tokenized Securities Trading Venue” (TSV). The first batch will cover stocks from more than 60 companies listed in the U.S. The basis is the SEC’s “Innovation Exemption” issued in September—allowing certain on-chain venues to conduct limited trading of tokenized U.S. stocks. Trades would go through automated market makers and liquidity-pool matching, without needing to route through traditional matching venues.
Why is this timing worth watching? Because this track has already started heating up. Tokenized stocks on Solana saw trading volume exceed $4.4 billion in September, setting a monthly record. The main drivers are the on-chain trading venues Raydium and Orca. But here’s the cold shower: $4.4 billion is the cumulative trading amount between both buyers and sellers—it is not market cap, and it’s not new capital flowing in. In fact, the value of tokenized stocks truly circulating on Solana in September was only about $684 million.
Put the two together, and the context becomes clear: first, the SEC exemption cracks open the gate; then major institutions with licenses rush to get in. A player of this level from the NYSE parent company matters more than short-term trading volume—it signals that “stocks on-chain” is moving from a crypto-native niche into legitimate business that traditional exchanges also want to compete for.
For ordinary users, the most direct change could be this: in the future, you really may be able to trade U.S. stocks 24/7 using stablecoins, without waiting for traditional brokerages to open. But on the flip side, the pricing, clearing, and which country’s securities laws govern tokenized stocks—these gaps still haven’t been filled. ⚖️
There’s another more realistic problem: the current “pool” is only on the order of a few hundred million dollars. If a large institution truly moves in funds at the tens-of-millions or even millions scale, insufficient depth would immediately amplify the issue. You might think you’re buying “U.S. stocks,” but you may actually just be buying a thinly liquid instrument—or a voucher with regulatory questions still hanging over it. 📉
If one day Apple or Nvidia can truly buy U.S. stocks on-chain 24/7 with stablecoins, would you move part of your U.S. stock positions onto the chain? Let’s discuss in the comments.
Click the avatar to watch the livestream
Every day, I’ll take you through crypto hot topics—not just what happens in the news, but also the logic and opportunities behind it 👀🚀

744
·
--
Verified
#以太坊验证者退出队列增392%
850,000 ETH wait in line to “get off” : Verifiers exiting the queue—up 392% since early October, directly setting a 2026 high.🦖
[⚡ 有大动静群里说](https://app.binance.com/uni-qr/JpwCPfBj)
According to beaconcha.in’s data on validator exits, there are currently 850,736 ETH stuck in the queue waiting to withdraw. Estimated at about $2,700 per ETH, that’s worth roughly $2.3 billion. The wait time has been extended to about 14 days and 18 hours, with only 256 validators allowed through per epoch.
The trigger wasn’t a market crash—it was a wallet’s risk-control action. On September 30, MetaMask disclosed a security incident affecting its staking infrastructure. It then proactively and preventively exited around 17,000 validators, totaling about 523,000 ETH (around $1.4 billion). ⚠️ The official position is that users’ wallets weren’t directly threatened, but this batch of “preventive evacuations” was enough by itself to push the queue to the top.
Breaking down the numbers 📊: Total staked ETH across the network is about 43.6 million, with 878,089 active validators. This queue volume is about 2% of that. The proportion isn’t huge, but the direction is telling—it proves something: the large-scale migration of validators is driven not just by price, but by operational and security decisions.
My take: the exit queue is a “buffer valve,” not a sell-pressure switch. For ETH to go out, it has to wait for more than two weeks. The pace at which it truly hits spot is being deliberately slowed. So don’t read “850,000 ETH queued” as “850,000 ETH about to dump immediately.” What’s more worth watching is the metric “queue time” itself—once it keeps stretching, it indicates that exit demand exceeds the network’s processing capacity. That pressure then propagates into discounting on liquid staking derivatives, staking yields, and the redemption timing of related protocols.
What’s really being repriced this time is, in effect, “who is holding your staking.” A wallet’s risk-control decision can instantly change the flow of funds across the chain. The knock-on effects caused by this concentration are more worth worrying about than any price chart.
Do you think this wave of exits is just for risk avoidance, or a convenient profit-taking move? Let’s discuss in the comments.
Click the avatar to watch the live stream
Every day, I’ll keep you updated on Ethereum and the on-chain data hot spots—not only what happens in the news, but also how to understand the underlying logic and opportunities behind it 👀🚀
#以太坊验证者退出队列增392%
850,000 ETH wait in line to “get off” : Verifiers exiting the queue—up 392% since early October, directly setting a 2026 high.🦖
⚡ 有大动静群里说
According to beaconcha.in’s data on validator exits, there are currently 850,736 ETH stuck in the queue waiting to withdraw. Estimated at about $2,700 per ETH, that’s worth roughly $2.3 billion. The wait time has been extended to about 14 days and 18 hours, with only 256 validators allowed through per epoch.
The trigger wasn’t a market crash—it was a wallet’s risk-control action. On September 30, MetaMask disclosed a security incident affecting its staking infrastructure. It then proactively and preventively exited around 17,000 validators, totaling about 523,000 ETH (around $1.4 billion). ⚠️ The official position is that users’ wallets weren’t directly threatened, but this batch of “preventive evacuations” was enough by itself to push the queue to the top.
Breaking down the numbers 📊: Total staked ETH across the network is about 43.6 million, with 878,089 active validators. This queue volume is about 2% of that. The proportion isn’t huge, but the direction is telling—it proves something: the large-scale migration of validators is driven not just by price, but by operational and security decisions.
My take: the exit queue is a “buffer valve,” not a sell-pressure switch. For ETH to go out, it has to wait for more than two weeks. The pace at which it truly hits spot is being deliberately slowed. So don’t read “850,000 ETH queued” as “850,000 ETH about to dump immediately.” What’s more worth watching is the metric “queue time” itself—once it keeps stretching, it indicates that exit demand exceeds the network’s processing capacity. That pressure then propagates into discounting on liquid staking derivatives, staking yields, and the redemption timing of related protocols.
What’s really being repriced this time is, in effect, “who is holding your staking.” A wallet’s risk-control decision can instantly change the flow of funds across the chain. The knock-on effects caused by this concentration are more worth worrying about than any price chart.
Do you think this wave of exits is just for risk avoidance, or a convenient profit-taking move? Let’s discuss in the comments.
Click the avatar to watch the live stream
Every day, I’ll keep you updated on Ethereum and the on-chain data hot spots—not only what happens in the news, but also how to understand the underlying logic and opportunities behind it 👀🚀
850,000 ETH wait in line to “get off” : Verifiers exiting the queue—up 392% since early October, directly setting a 2026 high.🦖
⚡ 有大动静群里说
According to beaconcha.in’s data on validator exits, there are currently 850,736 ETH stuck in the queue waiting to withdraw. Estimated at about $2,700 per ETH, that’s worth roughly $2.3 billion. The wait time has been extended to about 14 days and 18 hours, with only 256 validators allowed through per epoch.
The trigger wasn’t a market crash—it was a wallet’s risk-control action. On September 30, MetaMask disclosed a security incident affecting its staking infrastructure. It then proactively and preventively exited around 17,000 validators, totaling about 523,000 ETH (around $1.4 billion). ⚠️ The official position is that users’ wallets weren’t directly threatened, but this batch of “preventive evacuations” was enough by itself to push the queue to the top.
Breaking down the numbers 📊: Total staked ETH across the network is about 43.6 million, with 878,089 active validators. This queue volume is about 2% of that. The proportion isn’t huge, but the direction is telling—it proves something: the large-scale migration of validators is driven not just by price, but by operational and security decisions.
My take: the exit queue is a “buffer valve,” not a sell-pressure switch. For ETH to go out, it has to wait for more than two weeks. The pace at which it truly hits spot is being deliberately slowed. So don’t read “850,000 ETH queued” as “850,000 ETH about to dump immediately.” What’s more worth watching is the metric “queue time” itself—once it keeps stretching, it indicates that exit demand exceeds the network’s processing capacity. That pressure then propagates into discounting on liquid staking derivatives, staking yields, and the redemption timing of related protocols.
What’s really being repriced this time is, in effect, “who is holding your staking.” A wallet’s risk-control decision can instantly change the flow of funds across the chain. The knock-on effects caused by this concentration are more worth worrying about than any price chart.
Do you think this wave of exits is just for risk avoidance, or a convenient profit-taking move? Let’s discuss in the comments.
Click the avatar to watch the live stream
Every day, I’ll keep you updated on Ethereum and the on-chain data hot spots—not only what happens in the news, but also how to understand the underlying logic and opportunities behind it 👀🚀
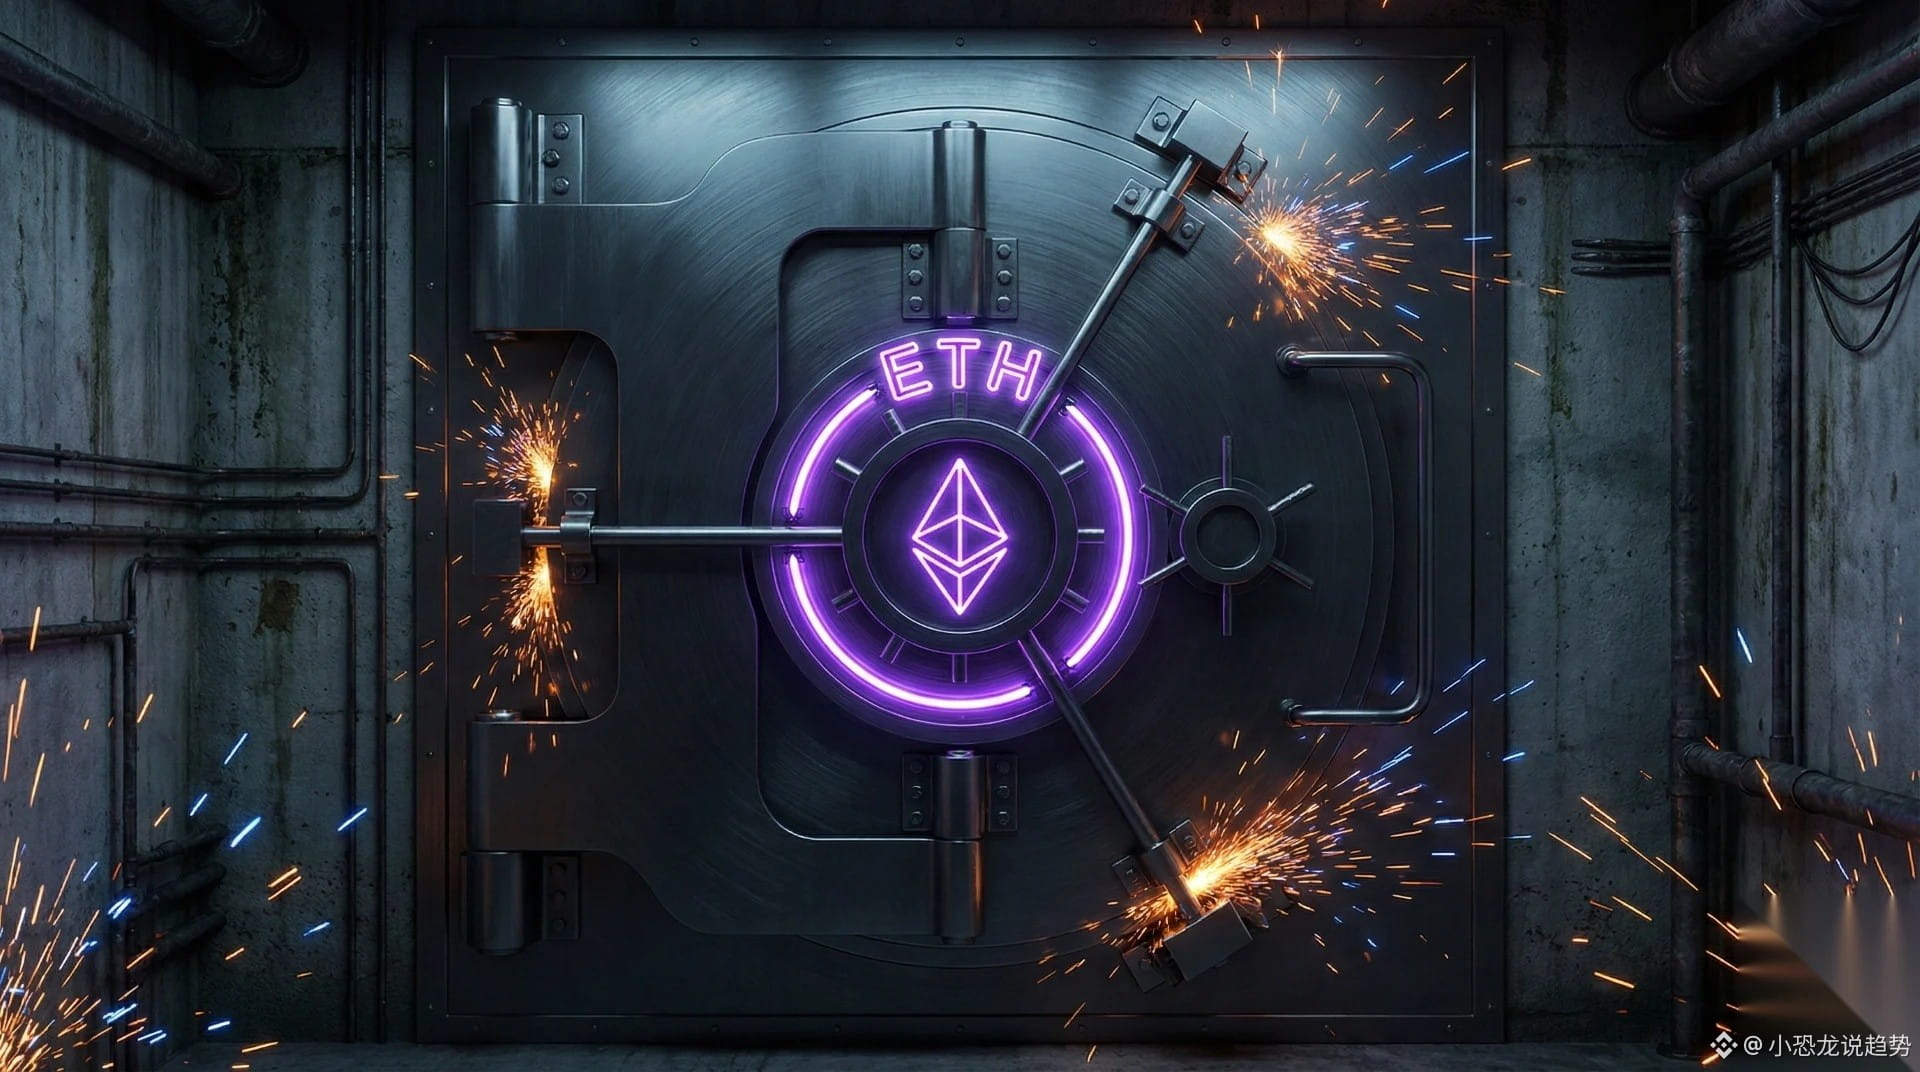
2
559
Log in to explore more content
Join global crypto users on Binance Square
⚡️ Get latest and useful information about crypto.
💬 Trusted by the world’s largest crypto exchange.
👍 Discover real insights from verified creators.
Email / Phone number