

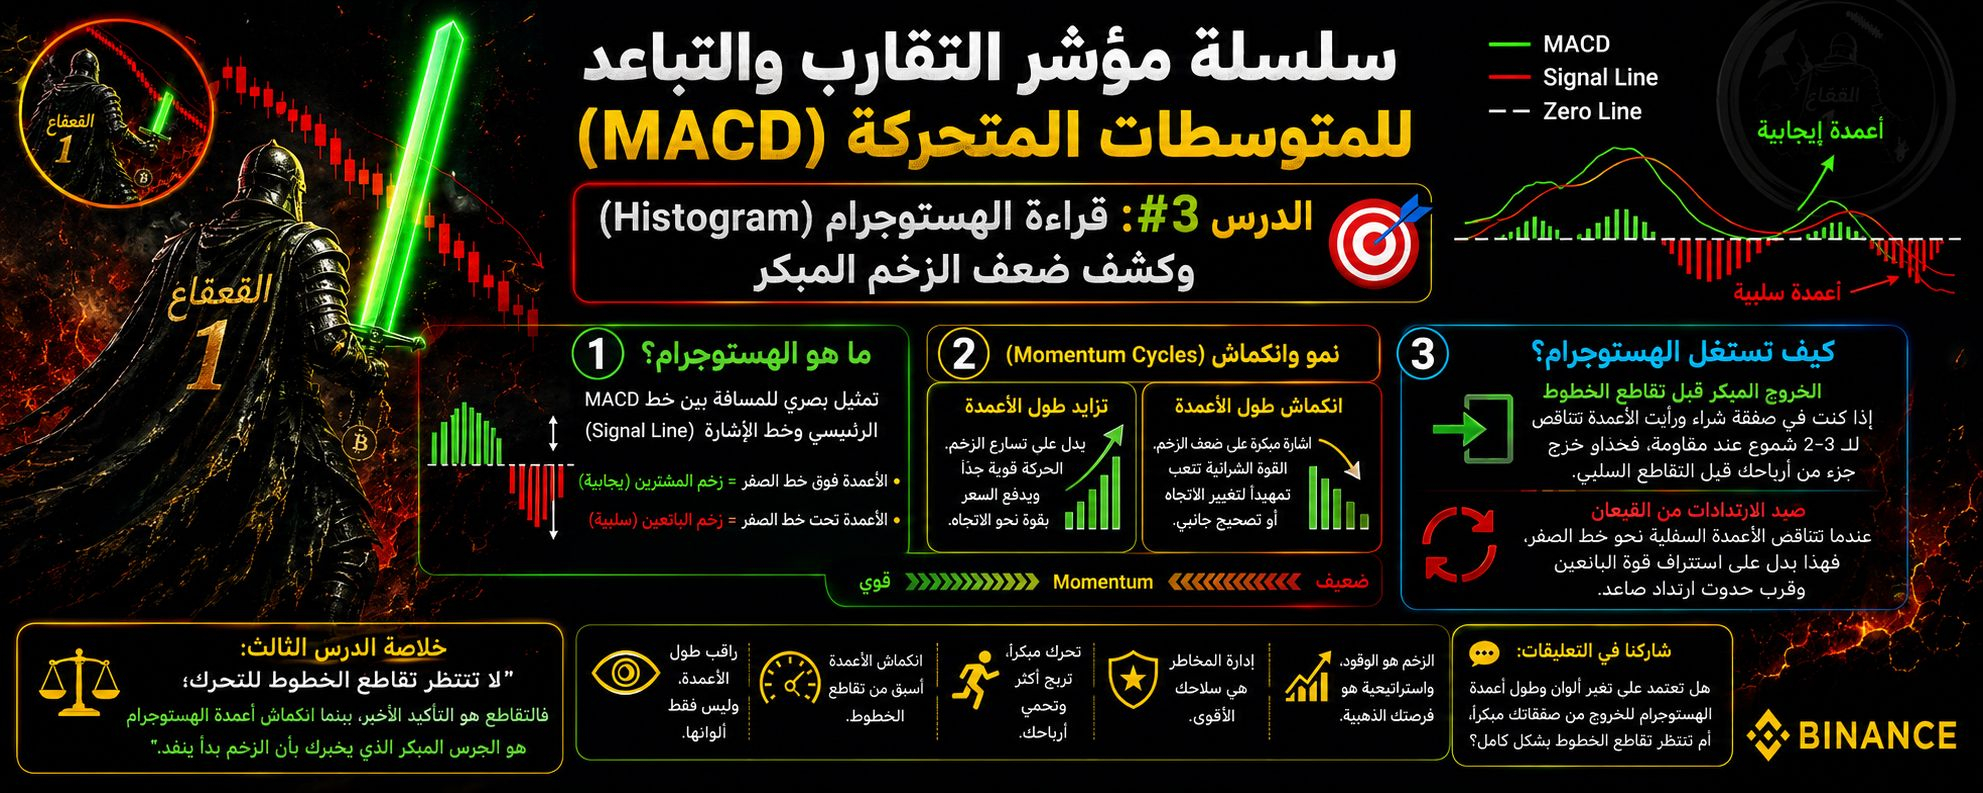

Hello, my fellow traders! Welcome to the third stop in our series. After learning line structure and the secrets of how its intersections work with the zero line, today we move to the fastest and most responsive member of this indicator: **the Histogram**—the real screen for measuring the market’s pulse before the official intersections occur.
---
🎯 **Rule #3:** "Line intersections tell you what happened, but the histogram tells you what is happening now and what will happen soon.. It’s the fuel that drives the trend car!"
---
💡 **1️⃣ What is the histogram? And how do you read it on the chart?**
The histogram is just a visual representation of the distance between the **main MACD line** and the **signal line**:
• **Columns above the zero line (positive):** means the MACD line is above the signal line (momentum is in favor of the buyers).
• **Bars below the zero line (negative):** means the MACD line is below the signal line (momentum is in favor of the sellers).
---
🧬 **2️⃣ The behavioral secret: growth and contraction of the bars (Momentum Cycles)**
The mistake most traders make is waiting until the bars change from green to red (or the other way around). The professional watches **the change in the bar length itself**:
• **Increasing bar length (Expanding Bars):**
Indicates momentum acceleration. The current move is very strong, and buyers (or sellers) are pushing the price with all their power.
• **Shrinking bar length (Shrinking Bars):**
The most important early signal on the chart! When the bar length starts shrinking while it is still above the zero line, it means buying power has begun to tire and the upward momentum is weakening—setting up for a change in direction or the start of a sideways correction.
---
🔍 **3️⃣ How do you use the histogram in scalping trades and day trading?**
• **Early exit before the lines cross:** If you’re in a buy trade and you see the histogram bars start to shrink for 2–3 consecutive candles near a resistance area, this is a warning to take part of your profits before the MACD line crosses bearishly.
• **Catching bounces from the bottoms:** When prices are in a sharp decline and the lower histogram bars begin to contract (shortening gradually toward the zero line), this is a sign that the sellers’ strength is being depleted and an upward rebound is near.
---
⚖️️ **Third lesson summary:**
"Don’t wait for the lines to cross to move; the crossover is only the final confirmation, while the shrinking histogram bars are the early bell telling you that momentum has started to run out."
---
💬 **Share with us in the comments:**
Do you rely on changes in the colors and length of the histogram bars to exit your trades early, or do you wait for the lines to cross completely?
#القعقاع_1 #BinanceSquare #SpotT
#cryptotrading #MACD #TechnicalAnalysis


@HAMS15 @CHAIN news @CoinVoice @connie三姐汇汇 @Chenbó辰镈 @Caicai诗雨 @Cherry 上帝的宝贝 @Crypto钟良 @CX反买必胜 @CC 程程 BNB @CoinSummer @Daft Punk–不是反指版 @DeHui德惠VC @Danny小学僧 @DL钱行-神话MUA