
#bmnr
bmnr
89,617 views
671 Discussing
Hot
Latest

·
--
When risk is tightly managed, high-quality entries speak for themselves. We're tracking a fresh long play on $BMNR right now.
⚡ $BMNR — LONG SETUP
📍 Entry: 22.48 – 22.62
🎯 TP1: 22.89
🎯 TP2: 23.07
🎯 TP3: 23.35
🛑 Stop Loss: 22.35
Trade here 👇
📌 Trade management rules: see pinned post.
What's your take on $BMNR at these levels? Drop your thoughts below and follow for more setup updates!
#WriteToEarn #BMNR #CryptoTrading #BinanceSquare #Crypto
When risk is tightly managed, high-quality entries speak for themselves. We're tracking a fresh long play on $BMNR right now.
⚡ $BMNR — LONG SETUP
📍 Entry: 22.48 – 22.62
🎯 TP1: 22.89
🎯 TP2: 23.07
🎯 TP3: 23.35
🛑 Stop Loss: 22.35
Trade here 👇
📌 Trade management rules: see pinned post.
What's your take on $BMNR at these levels? Drop your thoughts below and follow for more setup updates!
#WriteToEarn #BMNR #CryptoTrading #BinanceSquare #Crypto
⚡ $BMNR — LONG SETUP
📍 Entry: 22.48 – 22.62
🎯 TP1: 22.89
🎯 TP2: 23.07
🎯 TP3: 23.35
🛑 Stop Loss: 22.35
Trade here 👇
📌 Trade management rules: see pinned post.
What's your take on $BMNR at these levels? Drop your thoughts below and follow for more setup updates!
#WriteToEarn #BMNR #CryptoTrading #BinanceSquare #Crypto
1
15

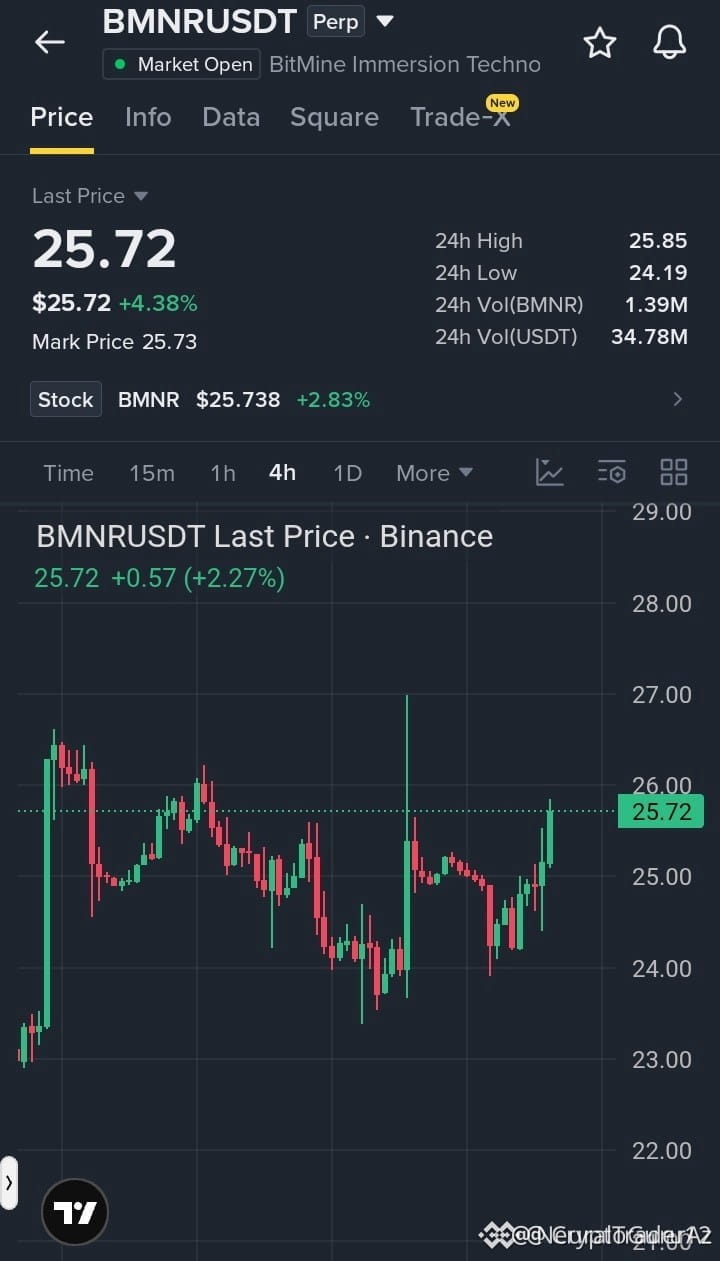
🚨 $BMNR TESTS SUPPLY ZONE AFTER 24.00 LIQUIDITY RECLAIM FOR POTENTIAL CONTINUATION ⚡
Entry: 25.30 - 25.75 ⚡
Target: 26.10 - 27.20 🚀
Stop Loss: 24.70 ⚠️
Smart money defended the 24.00 demand pool with conviction, building a steady sequence of higher lows across the 4H timeframe. 📊 Order flow is shifting decisively as buyers press directly into the 25.70–25.85 key supply overhead.
🔍 A clean breakout above 25.85 confirms structural expansion toward upper inefficiency pockets. Patience remains key here—await proper retest confirmation inside the demand block to execute with optimal risk parameters. 💡
💬 Will you take the immediate breakout confirmation or wait for a discount sweep into the entry zone? 👇
⚠️ Not financial advice. Always manage your risk. 🛡️
🏷️ #BMNR #CryptoAnalysis #Breakout #SmartMoney #LSK
🎯 🦈
🚨 $BMNR TESTS SUPPLY ZONE AFTER 24.00 LIQUIDITY RECLAIM FOR POTENTIAL CONTINUATION ⚡
Entry: 25.30 - 25.75 ⚡
Target: 26.10 - 27.20 🚀
Stop Loss: 24.70 ⚠️
Smart money defended the 24.00 demand pool with conviction, building a steady sequence of higher lows across the 4H timeframe. 📊 Order flow is shifting decisively as buyers press directly into the 25.70–25.85 key supply overhead.
🔍 A clean breakout above 25.85 confirms structural expansion toward upper inefficiency pockets. Patience remains key here—await proper retest confirmation inside the demand block to execute with optimal risk parameters. 💡
💬 Will you take the immediate breakout confirmation or wait for a discount sweep into the entry zone? 👇
⚠️ Not financial advice. Always manage your risk. 🛡️
🏷️ #BMNR #CryptoAnalysis #Breakout #SmartMoney #LSK
🎯 🦈
Entry: 25.30 - 25.75 ⚡
Target: 26.10 - 27.20 🚀
Stop Loss: 24.70 ⚠️
Smart money defended the 24.00 demand pool with conviction, building a steady sequence of higher lows across the 4H timeframe. 📊 Order flow is shifting decisively as buyers press directly into the 25.70–25.85 key supply overhead.
🔍 A clean breakout above 25.85 confirms structural expansion toward upper inefficiency pockets. Patience remains key here—await proper retest confirmation inside the demand block to execute with optimal risk parameters. 💡
💬 Will you take the immediate breakout confirmation or wait for a discount sweep into the entry zone? 👇
⚠️ Not financial advice. Always manage your risk. 🛡️
🏷️ #BMNR #CryptoAnalysis #Breakout #SmartMoney #LSK
🎯 🦈
19

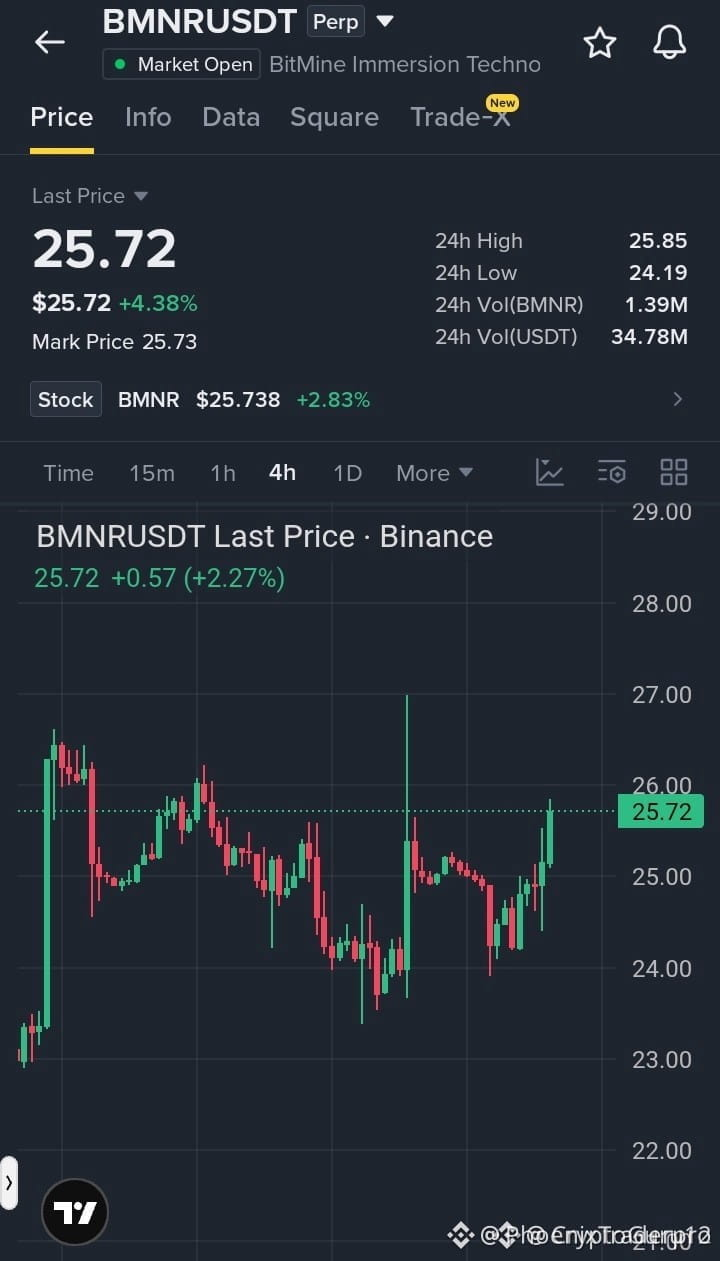
$BMNR DEMAND ZONE HOLDS AS BUYERS PREPARE TO BREAK RESISTANCE! 💥
Entry: 25.30 - 25.75 ⚡
Target: 26.10 - 27.20 🚀
Stop Loss: 24.70 ⚠️
After defending the 24.00 floor with heavy absorption, $BMNR is printing clear higher lows on the 4-hour timeframe and hammering directly against the 25.85 ceiling. 📊
Market structure has swung decisively back to the bulls as order flow builds up for an expansion phase. ⚡ Clearing 25.85 opens a clean runway toward higher resistance levels as supply thins out rapidly. 📌 Are you entering on this buildup or waiting for confirmed breakout acceptance? 👇
⚠️ Not financial advice. Always manage your risk. 🛡️
🏷️ #BMNR #LongSetup #Breakout #Altcoins #Crypto
🔥 💎
$BMNR DEMAND ZONE HOLDS AS BUYERS PREPARE TO BREAK RESISTANCE! 💥
Entry: 25.30 - 25.75 ⚡
Target: 26.10 - 27.20 🚀
Stop Loss: 24.70 ⚠️
After defending the 24.00 floor with heavy absorption, $BMNR is printing clear higher lows on the 4-hour timeframe and hammering directly against the 25.85 ceiling. 📊
Market structure has swung decisively back to the bulls as order flow builds up for an expansion phase. ⚡ Clearing 25.85 opens a clean runway toward higher resistance levels as supply thins out rapidly. 📌 Are you entering on this buildup or waiting for confirmed breakout acceptance? 👇
⚠️ Not financial advice. Always manage your risk. 🛡️
🏷️ #BMNR #LongSetup #Breakout #Altcoins #Crypto
🔥 💎
Entry: 25.30 - 25.75 ⚡
Target: 26.10 - 27.20 🚀
Stop Loss: 24.70 ⚠️
After defending the 24.00 floor with heavy absorption, $BMNR is printing clear higher lows on the 4-hour timeframe and hammering directly against the 25.85 ceiling. 📊
Market structure has swung decisively back to the bulls as order flow builds up for an expansion phase. ⚡ Clearing 25.85 opens a clean runway toward higher resistance levels as supply thins out rapidly. 📌 Are you entering on this buildup or waiting for confirmed breakout acceptance? 👇
⚠️ Not financial advice. Always manage your risk. 🛡️
🏷️ #BMNR #LongSetup #Breakout #Altcoins #Crypto
🔥 💎
22

·
--
Bullish
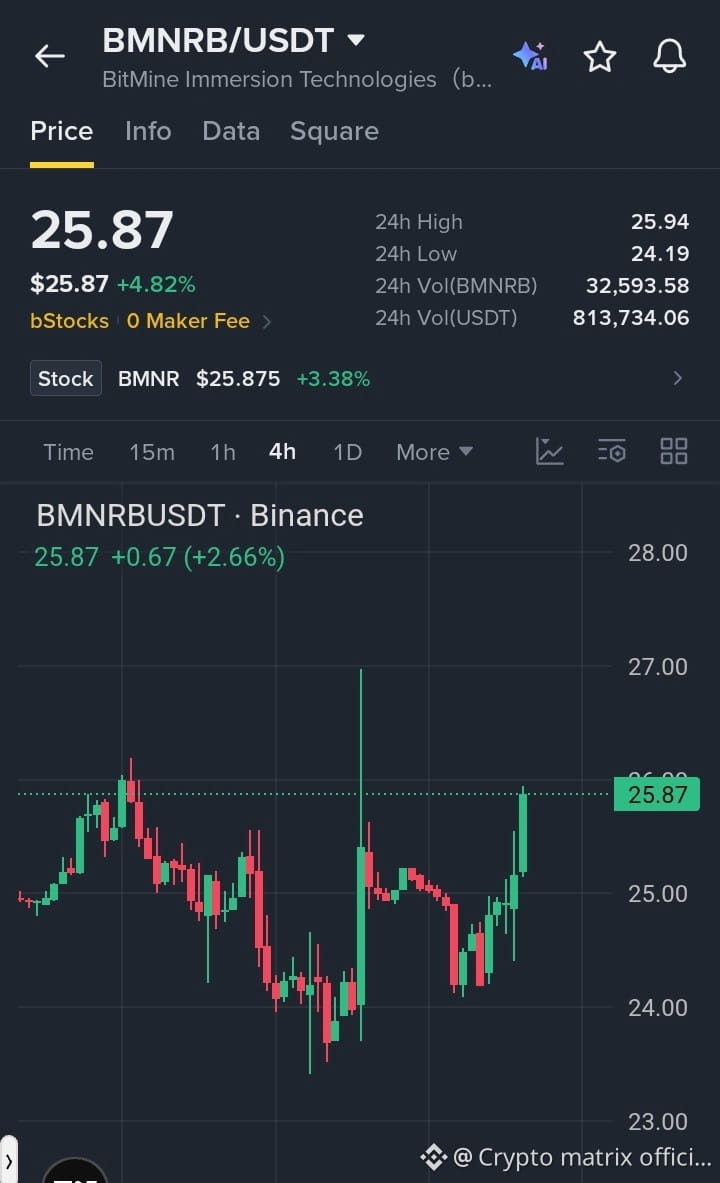
$BMNR LONG TRADE SETUP
#BMNR is showing strong bullish recovery on the 4H chart, with price breaking above the 25.00 area and pushing toward the 26.00 resistance zone. Holding above 25.50 could support further continuation.
LONG TRADE
Entry: 25.50 – 25.90
TP1: 26.20
TP2: 26.60
Final TP: 27.00
SL: 25.10
★ Visit the
{future}(BMNRUSDT)
$LSK
{future}(LSKUSDT)
$龙虾
{future}(龙虾USDT)
$BMNR LONG TRADE SETUP
#BMNR is showing strong bullish recovery on the 4H chart, with price breaking above the 25.00 area and pushing toward the 26.00 resistance zone. Holding above 25.50 could support further continuation.
LONG TRADE
Entry: 25.50 – 25.90
TP1: 26.20
TP2: 26.60
Final TP: 27.00
SL: 25.10
★ Visit the
$LSK
$龙虾
#BMNR is showing strong bullish recovery on the 4H chart, with price breaking above the 25.00 area and pushing toward the 26.00 resistance zone. Holding above 25.50 could support further continuation.
LONG TRADE
Entry: 25.50 – 25.90
TP1: 26.20
TP2: 26.60
Final TP: 27.00
SL: 25.10
★ Visit the
$LSK
$龙虾
2
317


·
--
Bullish
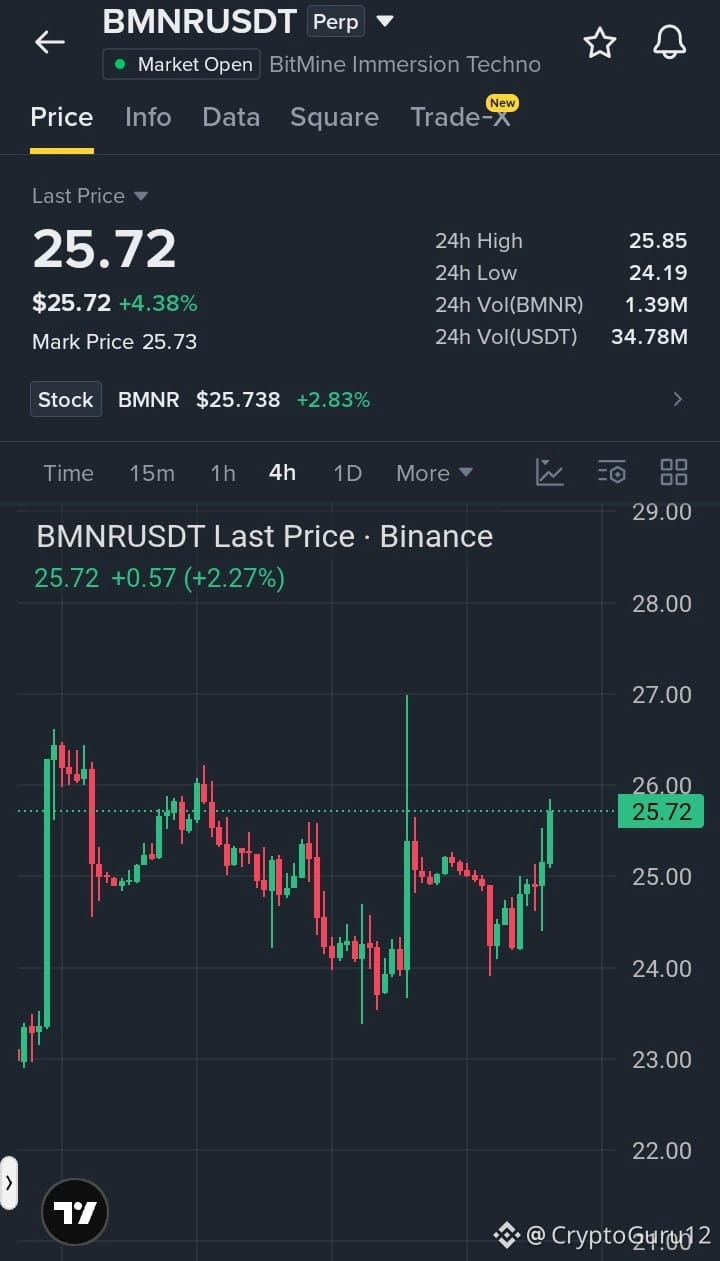
$BMNR LONG... Buyers Are Pushing Higher
#BMNR has bounced strongly from the 24.00 support zone and is now testing the 25.70–25.85 resistance area. The 4H structure is turning bullish with higher lows and a strong upside move. A confirmed breakout above 25.85 could bring the next resistance levels into focus.
Trade Setup: LONG
Entry Zone: 25.30 – 25.75
TP1: 26.10
TP2: 26.45
TP3: 26.80
TP4: 27.20
Stop Loss: 24.70
Wait for a clean breakout or retest confirmation before entering.
Buy and Trade
{future}(BMNRUSDT)
$LSK
{future}(LSKUSDT)
$龙虾
{future}(龙虾USDT)
$BMNR LONG... Buyers Are Pushing Higher
#BMNR has bounced strongly from the 24.00 support zone and is now testing the 25.70–25.85 resistance area. The 4H structure is turning bullish with higher lows and a strong upside move. A confirmed breakout above 25.85 could bring the next resistance levels into focus.
Trade Setup: LONG
Entry Zone: 25.30 – 25.75
TP1: 26.10
TP2: 26.45
TP3: 26.80
TP4: 27.20
Stop Loss: 24.70
Wait for a clean breakout or retest confirmation before entering.
Buy and Trade
$LSK
$龙虾
#BMNR has bounced strongly from the 24.00 support zone and is now testing the 25.70–25.85 resistance area. The 4H structure is turning bullish with higher lows and a strong upside move. A confirmed breakout above 25.85 could bring the next resistance levels into focus.
Trade Setup: LONG
Entry Zone: 25.30 – 25.75
TP1: 26.10
TP2: 26.45
TP3: 26.80
TP4: 27.20
Stop Loss: 24.70
Wait for a clean breakout or retest confirmation before entering.
Buy and Trade
$LSK
$龙虾
1
434

·
--
$BMNR 24 hours drops nearly 5%, and the funding rate is still positive at 0.00056595. This is a single-signal judgment, with no other news or macro variables to corroborate it.
A positive funding rate means longs are paying, but the price falling means they are currently at an unrealized loss. This structure—longs both “holding on” through losses while paying—usually points to positions being overly heavy and forced to be maintained. The current open position volume of 628331 has not shown any obvious decline, which may suggest that some capital is adding to the position to dilute the cost, creating a vicious cycle.
Trading label: #TradFi #链上美股 #BMNR
Where do you think this set of judgment is most likely to be wrong?
$BMNR 24 hours drops nearly 5%, and the funding rate is still positive at 0.00056595. This is a single-signal judgment, with no other news or macro variables to corroborate it.
A positive funding rate means longs are paying, but the price falling means they are currently at an unrealized loss. This structure—longs both “holding on” through losses while paying—usually points to positions being overly heavy and forced to be maintained. The current open position volume of 628331 has not shown any obvious decline, which may suggest that some capital is adding to the position to dilute the cost, creating a vicious cycle.
Trading label: #TradFi #链上美股 #BMNR
Where do you think this set of judgment is most likely to be wrong?
A positive funding rate means longs are paying, but the price falling means they are currently at an unrealized loss. This structure—longs both “holding on” through losses while paying—usually points to positions being overly heavy and forced to be maintained. The current open position volume of 628331 has not shown any obvious decline, which may suggest that some capital is adding to the position to dilute the cost, creating a vicious cycle.
Trading label: #TradFi #链上美股 #BMNR
Where do you think this set of judgment is most likely to be wrong?
47

·
--
BMNR dropped 6.778% in 24 hours; the price is back to 23.38. The funding rate is 0.00046678, meaning longs are paying shorts. The old dog glanced at this data: a price decline paired with a positive funding rate is a typical long squeeze/overtrading structure, with liquidation pressure piling up in the shadows.
The angle is M4_mover—just watch the 24-hour anomaly. When funding is above zero, the iron law says longs are crowded. A positive funding rate means the cost of holding longs is continuously bleeding. Current OI is 631833.34. The input didn’t provide the change value, but the absolute number isn’t small—leveraged positions may be concentrated. One price signal pointing downward is already enough to indicate the trend; combined with the funding structure, it shows longs are holding on with negative feedback.
The old dog’s take: any rebound from this level is likely to be crushed by funding costs, and the probability of further downside remains high. The market may be betting on an oversold bounce, but I’m against the consensus. With funding positive, when longs keep holding, they often end up wrong—because liquidity gets drained by the fee rate. The second-order effects are clear: if the price drops again, longs will be forced to liquidate; sell pressure will surge and accelerate the decline. Shorts just collect the funding fee, keeping their costs low. Who pays the price? Long holders bear it all.
Clear trigger actions: if the price breaks below 23, I’ll close all related long positions. If it rebounds to above 24.5, I’ll switch to watching mode and won’t chase.
Trading tag: #BinanceFutures #TradFi #USDⓈM #BMNR #BMNRUSDT $BMNR
BMNR dropped 6.778% in 24 hours; the price is back to 23.38. The funding rate is 0.00046678, meaning longs are paying shorts. The old dog glanced at this data: a price decline paired with a positive funding rate is a typical long squeeze/overtrading structure, with liquidation pressure piling up in the shadows.
The angle is M4_mover—just watch the 24-hour anomaly. When funding is above zero, the iron law says longs are crowded. A positive funding rate means the cost of holding longs is continuously bleeding. Current OI is 631833.34. The input didn’t provide the change value, but the absolute number isn’t small—leveraged positions may be concentrated. One price signal pointing downward is already enough to indicate the trend; combined with the funding structure, it shows longs are holding on with negative feedback.
The old dog’s take: any rebound from this level is likely to be crushed by funding costs, and the probability of further downside remains high. The market may be betting on an oversold bounce, but I’m against the consensus. With funding positive, when longs keep holding, they often end up wrong—because liquidity gets drained by the fee rate. The second-order effects are clear: if the price drops again, longs will be forced to liquidate; sell pressure will surge and accelerate the decline. Shorts just collect the funding fee, keeping their costs low. Who pays the price? Long holders bear it all.
Clear trigger actions: if the price breaks below 23, I’ll close all related long positions. If it rebounds to above 24.5, I’ll switch to watching mode and won’t chase.
Trading tag: #BinanceFutures #TradFi #USDⓈM #BMNR #BMNRUSDT $BMNR
The angle is M4_mover—just watch the 24-hour anomaly. When funding is above zero, the iron law says longs are crowded. A positive funding rate means the cost of holding longs is continuously bleeding. Current OI is 631833.34. The input didn’t provide the change value, but the absolute number isn’t small—leveraged positions may be concentrated. One price signal pointing downward is already enough to indicate the trend; combined with the funding structure, it shows longs are holding on with negative feedback.
The old dog’s take: any rebound from this level is likely to be crushed by funding costs, and the probability of further downside remains high. The market may be betting on an oversold bounce, but I’m against the consensus. With funding positive, when longs keep holding, they often end up wrong—because liquidity gets drained by the fee rate. The second-order effects are clear: if the price drops again, longs will be forced to liquidate; sell pressure will surge and accelerate the decline. Shorts just collect the funding fee, keeping their costs low. Who pays the price? Long holders bear it all.
Clear trigger actions: if the price breaks below 23, I’ll close all related long positions. If it rebounds to above 24.5, I’ll switch to watching mode and won’t chase.
Trading tag: #BinanceFutures #TradFi #USDⓈM #BMNR #BMNRUSDT $BMNR
11

$BMNR 24 hours dropped 7.29%, now at 23.39, but the funding rate is still positive at 0.0005. A typical combination of a drop in price plus a positive funding rate.
The concept of the Trump trade has recently cooled off a bit; the market’s various policy statements from him are starting to be downplayed. In this context, as a correlated asset, $BMNR is seeing a price pullback but the funding rate hasn’t flipped negative—this suggests the longs are still stubbornly holding on, not admitting defeat. The longs are paying fees to maintain their positions; if the price keeps slipping, liquidation pressure will quickly surface. The position size is 630,000—not particularly heavy, but the fact that we haven’t seen a negative funding rate indicates the shorts have not yet formed an overwhelming advantage. The longs are still hoping for a rebound.
I’m currently shorting $BMNR. Specifically: short direction, 2x leverage. Set the stop-loss at 24.3 (near the prior high), take-profit at 21.5, with position size at 10%. The logic is to bet that after the Trump narrative cools down, the crowded long positions will collapse first. If the price straight-up rallies back above 24.3, it would indicate new political upside catalysts, and my short thesis would be invalid—then I’ll cut the position immediately.
Trading tag: #TradFi #链上美股 #BMNR
Where do you think this set of assumptions is most likely to be wrong?
$BMNR 24 hours dropped 7.29%, now at 23.39, but the funding rate is still positive at 0.0005. A typical combination of a drop in price plus a positive funding rate.
The concept of the Trump trade has recently cooled off a bit; the market’s various policy statements from him are starting to be downplayed. In this context, as a correlated asset, $BMNR is seeing a price pullback but the funding rate hasn’t flipped negative—this suggests the longs are still stubbornly holding on, not admitting defeat. The longs are paying fees to maintain their positions; if the price keeps slipping, liquidation pressure will quickly surface. The position size is 630,000—not particularly heavy, but the fact that we haven’t seen a negative funding rate indicates the shorts have not yet formed an overwhelming advantage. The longs are still hoping for a rebound.
I’m currently shorting $BMNR . Specifically: short direction, 2x leverage. Set the stop-loss at 24.3 (near the prior high), take-profit at 21.5, with position size at 10%. The logic is to bet that after the Trump narrative cools down, the crowded long positions will collapse first. If the price straight-up rallies back above 24.3, it would indicate new political upside catalysts, and my short thesis would be invalid—then I’ll cut the position immediately.
Trading tag: #TradFi #链上美股 #BMNR
Where do you think this set of assumptions is most likely to be wrong?
The concept of the Trump trade has recently cooled off a bit; the market’s various policy statements from him are starting to be downplayed. In this context, as a correlated asset, $BMNR is seeing a price pullback but the funding rate hasn’t flipped negative—this suggests the longs are still stubbornly holding on, not admitting defeat. The longs are paying fees to maintain their positions; if the price keeps slipping, liquidation pressure will quickly surface. The position size is 630,000—not particularly heavy, but the fact that we haven’t seen a negative funding rate indicates the shorts have not yet formed an overwhelming advantage. The longs are still hoping for a rebound.
I’m currently shorting $BMNR . Specifically: short direction, 2x leverage. Set the stop-loss at 24.3 (near the prior high), take-profit at 21.5, with position size at 10%. The logic is to bet that after the Trump narrative cools down, the crowded long positions will collapse first. If the price straight-up rallies back above 24.3, it would indicate new political upside catalysts, and my short thesis would be invalid—then I’ll cut the position immediately.
Trading tag: #TradFi #链上美股 #BMNR
Where do you think this set of assumptions is most likely to be wrong?
$BMNR fell 7.29% over the past 24 hours; the price is at 23.39, but the funding rate is still positive at 0.0005. This structure suggests that the longs are still stubbornly holding on, paying money to the shorts.
Why is the funding rate still positive even after the drop? This is a typical Trump trade reversal trap. The market has been betting that he will post a bullish tweet about technology stocks. $BMNR, as the underlying for an on-chain US stock contract, was previously heavily positioned by those people. Now that the price has come down, these longs either believe strongly enough to hold, or they’re trapped and can only add more to average down. A positive funding rate is evidence—they’re continuously paying to maintain their positions.
As a derivatives trader, I’m waiting for a Trump tweet about tougher trade policies toward China. That would directly break through this long-position structure. With the price currently at 23.39, if another hardline China-related news item comes out, $BMNR could potentially smash through the 23 level. I’ll short it at that time, with a stop-loss at 23.8. I’ll start with 10% of the position to capture a quick move.
The condition for this thesis to fail is if Trump suddenly switches and tweets praise about Chinese technology companies.
Trading tag: #TradFi #链上美股 #BMNR
Where do you think this thesis is most likely to be wrong?
$BMNR fell 7.29% over the past 24 hours; the price is at 23.39, but the funding rate is still positive at 0.0005. This structure suggests that the longs are still stubbornly holding on, paying money to the shorts.
Why is the funding rate still positive even after the drop? This is a typical Trump trade reversal trap. The market has been betting that he will post a bullish tweet about technology stocks. $BMNR , as the underlying for an on-chain US stock contract, was previously heavily positioned by those people. Now that the price has come down, these longs either believe strongly enough to hold, or they’re trapped and can only add more to average down. A positive funding rate is evidence—they’re continuously paying to maintain their positions.
As a derivatives trader, I’m waiting for a Trump tweet about tougher trade policies toward China. That would directly break through this long-position structure. With the price currently at 23.39, if another hardline China-related news item comes out, $BMNR could potentially smash through the 23 level. I’ll short it at that time, with a stop-loss at 23.8. I’ll start with 10% of the position to capture a quick move.
The condition for this thesis to fail is if Trump suddenly switches and tweets praise about Chinese technology companies.
Trading tag: #TradFi #链上美股 #BMNR
Where do you think this thesis is most likely to be wrong?
Why is the funding rate still positive even after the drop? This is a typical Trump trade reversal trap. The market has been betting that he will post a bullish tweet about technology stocks. $BMNR , as the underlying for an on-chain US stock contract, was previously heavily positioned by those people. Now that the price has come down, these longs either believe strongly enough to hold, or they’re trapped and can only add more to average down. A positive funding rate is evidence—they’re continuously paying to maintain their positions.
As a derivatives trader, I’m waiting for a Trump tweet about tougher trade policies toward China. That would directly break through this long-position structure. With the price currently at 23.39, if another hardline China-related news item comes out, $BMNR could potentially smash through the 23 level. I’ll short it at that time, with a stop-loss at 23.8. I’ll start with 10% of the position to capture a quick move.
The condition for this thesis to fail is if Trump suddenly switches and tweets praise about Chinese technology companies.
Trading tag: #TradFi #链上美股 #BMNR
Where do you think this thesis is most likely to be wrong?
9
$BMNR 24 hours dropped 7.29%, now at 23.39. This drawdown isn’t small in TradFi perps.
I’m bearish. The core logic is that longs are stubbornly absorbing negative feedback. The price is falling, but the funding rate is positive at 0.0005 annualized, which isn’t low. This suggests longs are still paying shorts; they’re hard-backing the decline while their costs accumulate. Open interest at 630k hasn’t dropped noticeably, further confirming this. The market is betting on the so-called Trump trade, waiting for some policy catalyst to save them. But based on the price action and the funding structure, this kind of expectation is, for now, only a cost.
The strongest counter-evidence is that if Trump actually posts a bullish tweet or a policy comes through, it could instantly blow up the shorts. But right now there’s no reliable source indicating that this would happen; that’s an assumption that hasn’t materialized.
Second-order impact: If longs keep holding on like this, the funding rate will continue draining them. Once they can’t hold any longer and get liquidated/closed, and there’s no fresh batch of longs to take over, the price can easily drop another step. Their closing actions will become fuel for the selloff.
My invalidation conditions: If the price rebounds and holds above 23.39, while the funding rate starts to decline—indicating the long positioning structure is improving—then I’ll admit I was wrong.
Trading tag: #TradFi #链上美股 #BMNR
Where do you think this thesis is most likely to be wrong?
$BMNR 24 hours dropped 7.29%, now at 23.39. This drawdown isn’t small in TradFi perps.
I’m bearish. The core logic is that longs are stubbornly absorbing negative feedback. The price is falling, but the funding rate is positive at 0.0005 annualized, which isn’t low. This suggests longs are still paying shorts; they’re hard-backing the decline while their costs accumulate. Open interest at 630k hasn’t dropped noticeably, further confirming this. The market is betting on the so-called Trump trade, waiting for some policy catalyst to save them. But based on the price action and the funding structure, this kind of expectation is, for now, only a cost.
The strongest counter-evidence is that if Trump actually posts a bullish tweet or a policy comes through, it could instantly blow up the shorts. But right now there’s no reliable source indicating that this would happen; that’s an assumption that hasn’t materialized.
Second-order impact: If longs keep holding on like this, the funding rate will continue draining them. Once they can’t hold any longer and get liquidated/closed, and there’s no fresh batch of longs to take over, the price can easily drop another step. Their closing actions will become fuel for the selloff.
My invalidation conditions: If the price rebounds and holds above 23.39, while the funding rate starts to decline—indicating the long positioning structure is improving—then I’ll admit I was wrong.
Trading tag: #TradFi #链上美股 #BMNR
Where do you think this thesis is most likely to be wrong?
I’m bearish. The core logic is that longs are stubbornly absorbing negative feedback. The price is falling, but the funding rate is positive at 0.0005 annualized, which isn’t low. This suggests longs are still paying shorts; they’re hard-backing the decline while their costs accumulate. Open interest at 630k hasn’t dropped noticeably, further confirming this. The market is betting on the so-called Trump trade, waiting for some policy catalyst to save them. But based on the price action and the funding structure, this kind of expectation is, for now, only a cost.
The strongest counter-evidence is that if Trump actually posts a bullish tweet or a policy comes through, it could instantly blow up the shorts. But right now there’s no reliable source indicating that this would happen; that’s an assumption that hasn’t materialized.
Second-order impact: If longs keep holding on like this, the funding rate will continue draining them. Once they can’t hold any longer and get liquidated/closed, and there’s no fresh batch of longs to take over, the price can easily drop another step. Their closing actions will become fuel for the selloff.
My invalidation conditions: If the price rebounds and holds above 23.39, while the funding rate starts to decline—indicating the long positioning structure is improving—then I’ll admit I was wrong.
Trading tag: #TradFi #链上美股 #BMNR
Where do you think this thesis is most likely to be wrong?
3

·
--
$BMNR In the past 24 hours, it has fallen 8.952%. The quote is 23.29, but the funding rate remains positive at 0.00011356. Prices are dropping and longs are paying money—that’s a typical structure of longs getting trapped while adding to positions, with costs accumulating.
My judgment is simple: at the current price level, longs are using the funding rate to hard-fight the decline, bleeding every hour. The open interest of 607369 hasn’t shown any clear drop, which suggests there hasn’t been large-scale stop-loss selling. But this “slow-boiling frog” situation is the most dangerous: once there is new sell pressure, it can easily trigger a chain of liquidations.
Trading tag: #TradFi #链上美股 #BMNR
Where do you think this assessment is most likely to be wrong?
$BMNR In the past 24 hours, it has fallen 8.952%. The quote is 23.29, but the funding rate remains positive at 0.00011356. Prices are dropping and longs are paying money—that’s a typical structure of longs getting trapped while adding to positions, with costs accumulating.
My judgment is simple: at the current price level, longs are using the funding rate to hard-fight the decline, bleeding every hour. The open interest of 607369 hasn’t shown any clear drop, which suggests there hasn’t been large-scale stop-loss selling. But this “slow-boiling frog” situation is the most dangerous: once there is new sell pressure, it can easily trigger a chain of liquidations.
Trading tag: #TradFi #链上美股 #BMNR
Where do you think this assessment is most likely to be wrong?
My judgment is simple: at the current price level, longs are using the funding rate to hard-fight the decline, bleeding every hour. The open interest of 607369 hasn’t shown any clear drop, which suggests there hasn’t been large-scale stop-loss selling. But this “slow-boiling frog” situation is the most dangerous: once there is new sell pressure, it can easily trigger a chain of liquidations.
Trading tag: #TradFi #链上美股 #BMNR
Where do you think this assessment is most likely to be wrong?
24
·
--
$BMNR fell 8.95% in the past 24 hours, but the funding rate is still positive at 0.011%. Prices are down, yet the financing cost doesn’t fall—this is a typical liquidity crisis signal for long positions.
Judging purely from these two data points, investors holding long positions are passively carrying the order. The price decline indicates that selling pressure is real, but a positive funding rate means they still have to pay the shorts, stacking their holding costs. Under this structure, any rebound could be pushed back down first by stop-loss orders from these trapped longs.
Trading tag: #TradFi #链上美股 #BMNR
Where do you think this assessment is most likely to be wrong?
$BMNR fell 8.95% in the past 24 hours, but the funding rate is still positive at 0.011%. Prices are down, yet the financing cost doesn’t fall—this is a typical liquidity crisis signal for long positions.
Judging purely from these two data points, investors holding long positions are passively carrying the order. The price decline indicates that selling pressure is real, but a positive funding rate means they still have to pay the shorts, stacking their holding costs. Under this structure, any rebound could be pushed back down first by stop-loss orders from these trapped longs.
Trading tag: #TradFi #链上美股 #BMNR
Where do you think this assessment is most likely to be wrong?
Judging purely from these two data points, investors holding long positions are passively carrying the order. The price decline indicates that selling pressure is real, but a positive funding rate means they still have to pay the shorts, stacking their holding costs. Under this structure, any rebound could be pushed back down first by stop-loss orders from these trapped longs.
Trading tag: #TradFi #链上美股 #BMNR
Where do you think this assessment is most likely to be wrong?
26
·
--
$BMNR 24 hours saw a drop of nearly 9%, but the funding rate is still positive, around 0.011%. This is a single-signal assessment.
In the downtrend, longs are still paying fees—this is a typical long-squeezed-and-averaged-in structure. The funding fee cost will keep accumulating; unless the price quickly reverses, the liquidation pressure on this portion of the position will grow larger and larger. I don’t see any new macro tailwind that can immediately change this situation.
The strongest counterevidence is a rapid rebound that regains lost ground, along with the funding rate turning negative—meaning the shorts are starting to concede. My current view is: as long as the price can’t hold above that level and the funding rate remains positive, don’t touch it.
Trading tag: #TradFi #链上美股 #BMNR
Where do you think this assessment is most likely to be wrong?
$BMNR 24 hours saw a drop of nearly 9%, but the funding rate is still positive, around 0.011%. This is a single-signal assessment.
In the downtrend, longs are still paying fees—this is a typical long-squeezed-and-averaged-in structure. The funding fee cost will keep accumulating; unless the price quickly reverses, the liquidation pressure on this portion of the position will grow larger and larger. I don’t see any new macro tailwind that can immediately change this situation.
The strongest counterevidence is a rapid rebound that regains lost ground, along with the funding rate turning negative—meaning the shorts are starting to concede. My current view is: as long as the price can’t hold above that level and the funding rate remains positive, don’t touch it.
Trading tag: #TradFi #链上美股 #BMNR
Where do you think this assessment is most likely to be wrong?
In the downtrend, longs are still paying fees—this is a typical long-squeezed-and-averaged-in structure. The funding fee cost will keep accumulating; unless the price quickly reverses, the liquidation pressure on this portion of the position will grow larger and larger. I don’t see any new macro tailwind that can immediately change this situation.
The strongest counterevidence is a rapid rebound that regains lost ground, along with the funding rate turning negative—meaning the shorts are starting to concede. My current view is: as long as the price can’t hold above that level and the funding rate remains positive, don’t touch it.
Trading tag: #TradFi #链上美股 #BMNR
Where do you think this assessment is most likely to be wrong?
18

·
--
$BMNR #BMNR
Event Alert: Short Selling Warning | BMNR
15m not triggered yet, but 1h short-side activity is strong
Structure: GMMA short side
Reason: 1h trading value 12.0x / 4h trading value 10.7x / 1h body weak and closed lower / 1h broke below VWAP / 1h capped below EMA8/20 / GMMA short side
Current Price 23.6700
Breakdown Level 23.0500
Invalidation Level 25.1114
Watch Levels Below 21.3030 / 18.9360
Funding Fee +0.0000% (long/short balanced)
For chart observation only; not investment advice.
$BMNR #BMNR
Event Alert: Short Selling Warning | BMNR
15m not triggered yet, but 1h short-side activity is strong
Structure: GMMA short side
Reason: 1h trading value 12.0x / 4h trading value 10.7x / 1h body weak and closed lower / 1h broke below VWAP / 1h capped below EMA8/20 / GMMA short side
Current Price 23.6700
Breakdown Level 23.0500
Invalidation Level 25.1114
Watch Levels Below 21.3030 / 18.9360
Funding Fee +0.0000% (long/short balanced)
For chart observation only; not investment advice.
Event Alert: Short Selling Warning | BMNR
15m not triggered yet, but 1h short-side activity is strong
Structure: GMMA short side
Reason: 1h trading value 12.0x / 4h trading value 10.7x / 1h body weak and closed lower / 1h broke below VWAP / 1h capped below EMA8/20 / GMMA short side
Current Price 23.6700
Breakdown Level 23.0500
Invalidation Level 25.1114
Watch Levels Below 21.3030 / 18.9360
Funding Fee +0.0000% (long/short balanced)
For chart observation only; not investment advice.
302
·
--
$BMNR #BMNR
Market move alert: Short-selling warning | BMNR
15m: Monitor for short-side activity
1h: Increased volume / structure weakening
4h: GMMA short
pump_score: 10/12
Current price: 23.6700
Breakdown level: 23.0500
Invalidation level: 25.1114
Downside levels to watch: 21.3030 / 18.9360
Funding rate: +0.0000% (longs and shorts are balanced)
Near the trigger level you may execute according to the direction; the invalidation level is the stop-loss.
$BMNR #BMNR
Market move alert: Short-selling warning | BMNR
15m: Monitor for short-side activity
1h: Increased volume / structure weakening
4h: GMMA short
pump_score: 10/12
Current price: 23.6700
Breakdown level: 23.0500
Invalidation level: 25.1114
Downside levels to watch: 21.3030 / 18.9360
Funding rate: +0.0000% (longs and shorts are balanced)
Near the trigger level you may execute according to the direction; the invalidation level is the stop-loss.
Market move alert: Short-selling warning | BMNR
15m: Monitor for short-side activity
1h: Increased volume / structure weakening
4h: GMMA short
pump_score: 10/12
Current price: 23.6700
Breakdown level: 23.0500
Invalidation level: 25.1114
Downside levels to watch: 21.3030 / 18.9360
Funding rate: +0.0000% (longs and shorts are balanced)
Near the trigger level you may execute according to the direction; the invalidation level is the stop-loss.
459

5-minute trend scan: 3 clear short opportunities.
$BMNR — Short. In a downtrend, after a high-volume breakout, it keeps sliding downward. Volume surged 6.92x, and bearish momentum is extremely strong. 5-minute consolidation, 15-minute downtrend, 1-hour downtrend. Entry score 80, structure score 73. Higher-timeframe upside (short) space: 3.93%.
Current price: 23.48. Entry: 23.40–23.55. Stop-loss: 23.80. Target: 22.50. Risk/reward: 3.1:1.
Conclusion: Can short. Very high entry score, volume-follow-through confirming the breakdown, and bearish alignment across multiple timeframes.
$TRX — Short. In a downtrend, it breaks down on increased volume. Volume is 1.84x. Price breaks below EMA support. 5-minute down, 15-minute down, 1-hour sideways. Entry score 71, structure score 72. Higher-timeframe space: 3.58%.
Current price: 0.3314. Entry: 0.3310–0.3320. Stop-loss: 0.3340. Target: 0.3250. Risk/reward: 2.5:1.
Conclusion: Can short. Breakout confirmation with increased volume; short- and mid-term trends are consistent to the downside.
$HIVE — Short. The ranging structure breaks to the downside. Volume is 3.56x. Price tests and challenges low-point support. 5-minute ranging, 15-minute ranging, 1-hour downtrend. Entry score 63, structure score 78. Higher-timeframe space: 1.69%.
Current price: 0.05122. Entry: 0.0511–0.0513. Stop-loss: 0.0518. Target: 0.0495. Risk/reward: 2.8:1.
Conclusion: Can short. Structure score is very high, volume breakdown confirmed, and the higher timeframe remains bearish.
Suggested position sizing: no more than 10% per coin. Overall bearish—focus on risk control.
#BMNR #TRX #HIVE #做空 #Technical analysis
5-minute trend scan: 3 clear short opportunities.
$BMNR — Short. In a downtrend, after a high-volume breakout, it keeps sliding downward. Volume surged 6.92x, and bearish momentum is extremely strong. 5-minute consolidation, 15-minute downtrend, 1-hour downtrend. Entry score 80, structure score 73. Higher-timeframe upside (short) space: 3.93%.
Current price: 23.48. Entry: 23.40–23.55. Stop-loss: 23.80. Target: 22.50. Risk/reward: 3.1:1.
Conclusion: Can short. Very high entry score, volume-follow-through confirming the breakdown, and bearish alignment across multiple timeframes.
$TRX — Short. In a downtrend, it breaks down on increased volume. Volume is 1.84x. Price breaks below EMA support. 5-minute down, 15-minute down, 1-hour sideways. Entry score 71, structure score 72. Higher-timeframe space: 3.58%.
Current price: 0.3314. Entry: 0.3310–0.3320. Stop-loss: 0.3340. Target: 0.3250. Risk/reward: 2.5:1.
Conclusion: Can short. Breakout confirmation with increased volume; short- and mid-term trends are consistent to the downside.
$HIVE — Short. The ranging structure breaks to the downside. Volume is 3.56x. Price tests and challenges low-point support. 5-minute ranging, 15-minute ranging, 1-hour downtrend. Entry score 63, structure score 78. Higher-timeframe space: 1.69%.
Current price: 0.05122. Entry: 0.0511–0.0513. Stop-loss: 0.0518. Target: 0.0495. Risk/reward: 2.8:1.
Conclusion: Can short. Structure score is very high, volume breakdown confirmed, and the higher timeframe remains bearish.
Suggested position sizing: no more than 10% per coin. Overall bearish—focus on risk control.
#BMNR #TRX #HIVE #做空 #Technical analysis
$BMNR — Short. In a downtrend, after a high-volume breakout, it keeps sliding downward. Volume surged 6.92x, and bearish momentum is extremely strong. 5-minute consolidation, 15-minute downtrend, 1-hour downtrend. Entry score 80, structure score 73. Higher-timeframe upside (short) space: 3.93%.
Current price: 23.48. Entry: 23.40–23.55. Stop-loss: 23.80. Target: 22.50. Risk/reward: 3.1:1.
Conclusion: Can short. Very high entry score, volume-follow-through confirming the breakdown, and bearish alignment across multiple timeframes.
$TRX — Short. In a downtrend, it breaks down on increased volume. Volume is 1.84x. Price breaks below EMA support. 5-minute down, 15-minute down, 1-hour sideways. Entry score 71, structure score 72. Higher-timeframe space: 3.58%.
Current price: 0.3314. Entry: 0.3310–0.3320. Stop-loss: 0.3340. Target: 0.3250. Risk/reward: 2.5:1.
Conclusion: Can short. Breakout confirmation with increased volume; short- and mid-term trends are consistent to the downside.
$HIVE — Short. The ranging structure breaks to the downside. Volume is 3.56x. Price tests and challenges low-point support. 5-minute ranging, 15-minute ranging, 1-hour downtrend. Entry score 63, structure score 78. Higher-timeframe space: 1.69%.
Current price: 0.05122. Entry: 0.0511–0.0513. Stop-loss: 0.0518. Target: 0.0495. Risk/reward: 2.8:1.
Conclusion: Can short. Structure score is very high, volume breakdown confirmed, and the higher timeframe remains bearish.
Suggested position sizing: no more than 10% per coin. Overall bearish—focus on risk control.
#BMNR #TRX #HIVE #做空 #Technical analysis
1
·
--
The contract price of $BMNR fell 4.674% in the past 24 hours, and the current price is 24.27. But looking at the funding rate—it’s flat at 0. Price is moving, while the funding rate isn’t. This suggests the selloff driving this drop is not due to a sudden, internal imbalance of long/short power in the derivatives market.
This is typically seen when global news sentiment is transmitted to on-chain U.S. stock futures contracts. The decline comes from immediate selling driven by spot prices or broad macro sentiment, but the futures market’s response—especially funding rate adjustments—often lags.
Now the funding rate is 0, meaning neither side has a strongly skewed view that would require paying fees to maintain positions.
The market is waiting. If next a broadly negative global event is confirmed, or if risk assets’ overall preference continues to drift downward, this flat-funding order book will quickly turn negative, and shorts will start paying. Conversely, if there’s no new bad news, the price may just churn around this level.
The key to watch is whether the funding rate can break below the zero line. If the funding rate turns negative and the price continues to grind lower, then the short consensus is truly formed—at that point, it’s the real shorting window. With the funding rate flat and the price falling, I choose to wait and not chase the short. I’ll wait for a signal.
Trading tag: #TradFi #链上美股 #BMNR
Where do you think this assessment is most likely to be wrong?
The contract price of $BMNR fell 4.674% in the past 24 hours, and the current price is 24.27. But looking at the funding rate—it’s flat at 0. Price is moving, while the funding rate isn’t. This suggests the selloff driving this drop is not due to a sudden, internal imbalance of long/short power in the derivatives market.
This is typically seen when global news sentiment is transmitted to on-chain U.S. stock futures contracts. The decline comes from immediate selling driven by spot prices or broad macro sentiment, but the futures market’s response—especially funding rate adjustments—often lags.
Now the funding rate is 0, meaning neither side has a strongly skewed view that would require paying fees to maintain positions.
The market is waiting. If next a broadly negative global event is confirmed, or if risk assets’ overall preference continues to drift downward, this flat-funding order book will quickly turn negative, and shorts will start paying. Conversely, if there’s no new bad news, the price may just churn around this level.
The key to watch is whether the funding rate can break below the zero line. If the funding rate turns negative and the price continues to grind lower, then the short consensus is truly formed—at that point, it’s the real shorting window. With the funding rate flat and the price falling, I choose to wait and not chase the short. I’ll wait for a signal.
Trading tag: #TradFi #链上美股 #BMNR
Where do you think this assessment is most likely to be wrong?
This is typically seen when global news sentiment is transmitted to on-chain U.S. stock futures contracts. The decline comes from immediate selling driven by spot prices or broad macro sentiment, but the futures market’s response—especially funding rate adjustments—often lags.
Now the funding rate is 0, meaning neither side has a strongly skewed view that would require paying fees to maintain positions.
The market is waiting. If next a broadly negative global event is confirmed, or if risk assets’ overall preference continues to drift downward, this flat-funding order book will quickly turn negative, and shorts will start paying. Conversely, if there’s no new bad news, the price may just churn around this level.
The key to watch is whether the funding rate can break below the zero line. If the funding rate turns negative and the price continues to grind lower, then the short consensus is truly formed—at that point, it’s the real shorting window. With the funding rate flat and the price falling, I choose to wait and not chase the short. I’ll wait for a signal.
Trading tag: #TradFi #链上美股 #BMNR
Where do you think this assessment is most likely to be wrong?
16
·
--
$BMNR fell 4.67% over the past 24 hours. The quote is $24.27, and trading volume is close to $35 million. The most striking data point is that the funding rate has fallen to zero, while open interest stands at 488,000.
As the price pulls back, the funding rate returns to neutral—this is a signal that the bulls and bears have temporarily called a truce. When prices are dropping, short sellers typically push funding into negative territory, but with it at zero, it suggests the shorts are not launching a major offensive, and longs are not panic-selling or closing positions. The market is waiting for direction.
Trading volume isn’t low, yet the price is down. Coupled with the zero funding rate, this can be interpreted as position rotation, with both sides actively reducing exposure or locking positions. No one is willing to take on overnight risk at these levels. Under this structure, any incremental inflow of capital could tip the balance.
The counterargument is that this is just a normal pullback in a bull market, and the trend hasn’t changed. However, open interest isn’t particularly high. If, going forward, there is a lack of fresh macro drivers and the market relies mainly on battles among existing capital, then after a period of narrow-range consolidation, a directional breakout is likely to occur.
The key points to watch next are whether the price can hold above the $24 whole-dollar level, and whether trading volume increases during rebounds. If the rebound comes on declining volume, it indicates weak buying power; if the sell-off comes on rising volume, the selling pressure is confirmed.
I’ll wait.
Trading tag: #TradFi #链上美股 #BMNR
Where do you think this assessment is most likely to be wrong?
$BMNR fell 4.67% over the past 24 hours. The quote is $24.27, and trading volume is close to $35 million. The most striking data point is that the funding rate has fallen to zero, while open interest stands at 488,000.
As the price pulls back, the funding rate returns to neutral—this is a signal that the bulls and bears have temporarily called a truce. When prices are dropping, short sellers typically push funding into negative territory, but with it at zero, it suggests the shorts are not launching a major offensive, and longs are not panic-selling or closing positions. The market is waiting for direction.
Trading volume isn’t low, yet the price is down. Coupled with the zero funding rate, this can be interpreted as position rotation, with both sides actively reducing exposure or locking positions. No one is willing to take on overnight risk at these levels. Under this structure, any incremental inflow of capital could tip the balance.
The counterargument is that this is just a normal pullback in a bull market, and the trend hasn’t changed. However, open interest isn’t particularly high. If, going forward, there is a lack of fresh macro drivers and the market relies mainly on battles among existing capital, then after a period of narrow-range consolidation, a directional breakout is likely to occur.
The key points to watch next are whether the price can hold above the $24 whole-dollar level, and whether trading volume increases during rebounds. If the rebound comes on declining volume, it indicates weak buying power; if the sell-off comes on rising volume, the selling pressure is confirmed.
I’ll wait.
Trading tag: #TradFi #链上美股 #BMNR
Where do you think this assessment is most likely to be wrong?
As the price pulls back, the funding rate returns to neutral—this is a signal that the bulls and bears have temporarily called a truce. When prices are dropping, short sellers typically push funding into negative territory, but with it at zero, it suggests the shorts are not launching a major offensive, and longs are not panic-selling or closing positions. The market is waiting for direction.
Trading volume isn’t low, yet the price is down. Coupled with the zero funding rate, this can be interpreted as position rotation, with both sides actively reducing exposure or locking positions. No one is willing to take on overnight risk at these levels. Under this structure, any incremental inflow of capital could tip the balance.
The counterargument is that this is just a normal pullback in a bull market, and the trend hasn’t changed. However, open interest isn’t particularly high. If, going forward, there is a lack of fresh macro drivers and the market relies mainly on battles among existing capital, then after a period of narrow-range consolidation, a directional breakout is likely to occur.
The key points to watch next are whether the price can hold above the $24 whole-dollar level, and whether trading volume increases during rebounds. If the rebound comes on declining volume, it indicates weak buying power; if the sell-off comes on rising volume, the selling pressure is confirmed.
I’ll wait.
Trading tag: #TradFi #链上美股 #BMNR
Where do you think this assessment is most likely to be wrong?
6

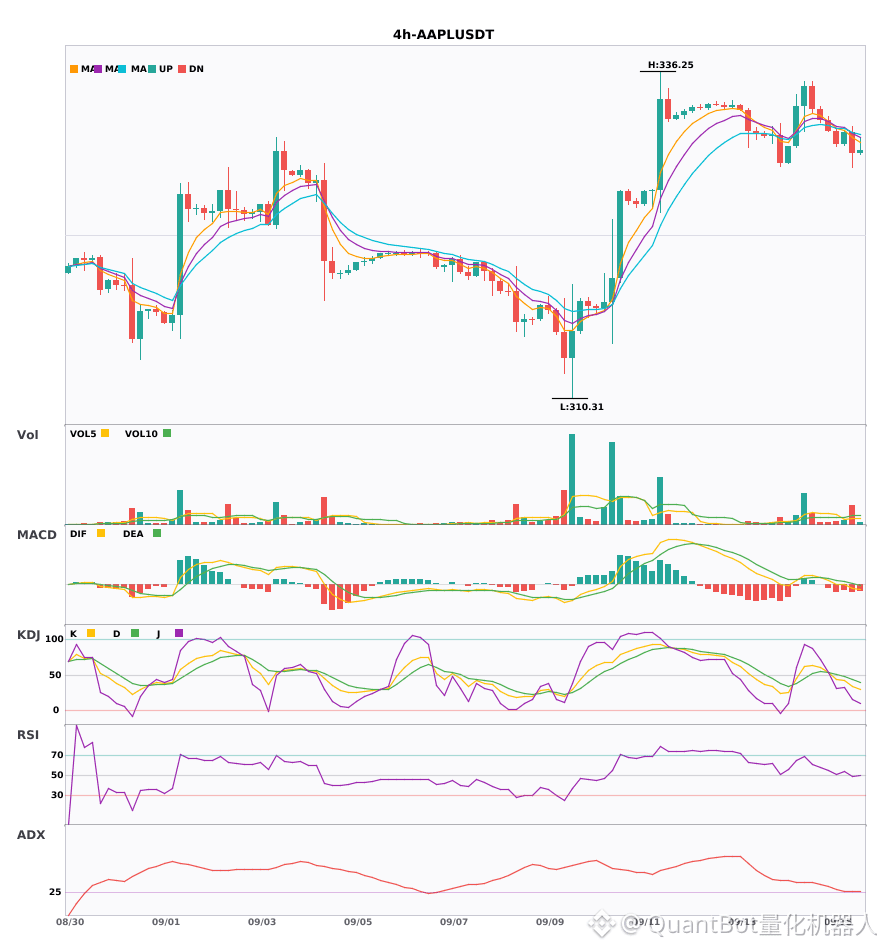
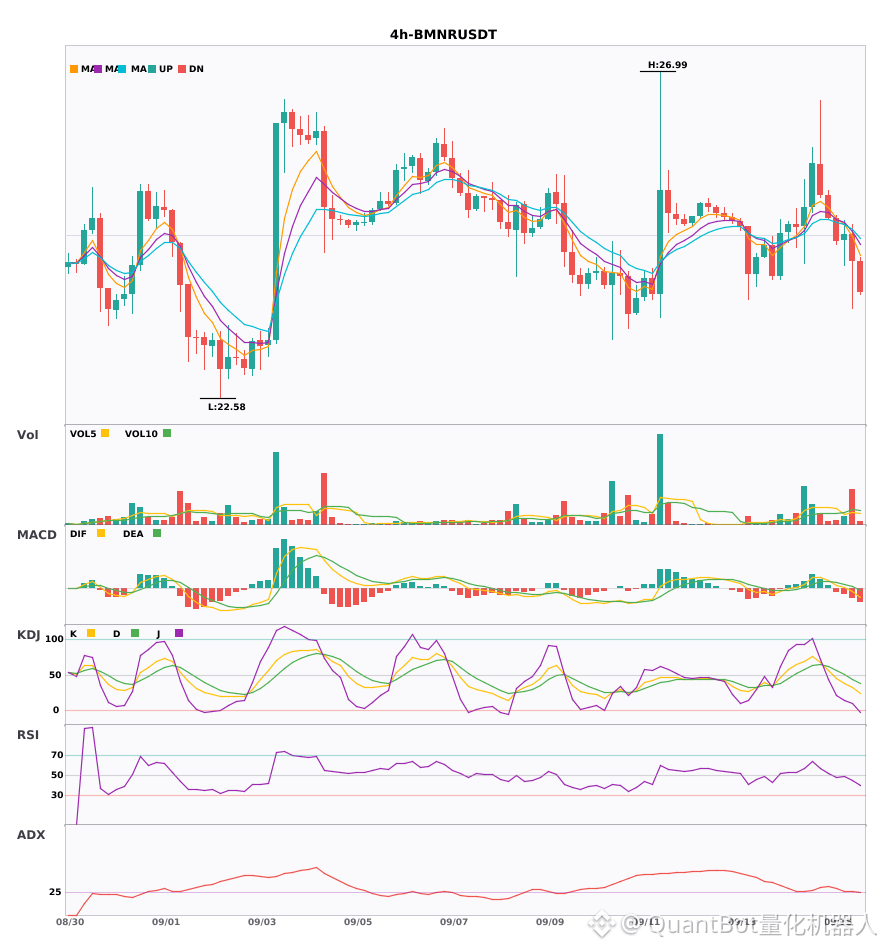
$AAPL/$RONIN/$BMNR 4 hourly-level resonance weakening. Be cautious of downside risk
📉 $AAPL | 4-hour bearish signal
━━━━━━━━━━━━━━━━━━
Technical analysis: ADX (28) indicates a trend is forming; it may be possible to participate | MACD is running bearish; the trend is weak and momentum is strengthening | EMA5 is below EMA8 and EMA13; a bearish alignment | KDJ is running weakly, with bears in control (K is 34.1, D is 43.5) | Volume expands (2.0x)
Price change: -0.5100%
📉 $RONIN | 4-hour bearish signal
━━━━━━━━━━━━━━━━━━
Technical analysis: ADX(53) is a very strong trend (watch for an overheating pullback) | MACDDIF breaks below the zero line, turning the trend bearish | EMA5 crosses below EMA8, turning short-term bearish | Volume spikes (3.5x)
Price change: -11.7600%
📉 $BMNR | 4-hour bearish signal
━━━━━━━━━━━━━━━━━━
Technical analysis: ADX (27) indicates a trend is forming; it may be possible to participate | MACDDIF breaks below the zero line, turning the trend bearish | EMA5 is below EMA8 and EMA13; a bearish alignment | KDJ is running weakly, with bears in control (K is 32.9, D is 44.3) | Volume expands (2.3x)
Price change: -1.4500%
━━━━━━━━━━━━━━━━━━
#技术分析 #AAPL #RONIN #BMNR
📌 The information above is for reference only and does not constitute investment advice
$AAPL /$RONIN /$BMNR 4 hourly-level resonance weakening. Be cautious of downside risk
📉 $AAPL | 4-hour bearish signal
━━━━━━━━━━━━━━━━━━
Technical analysis: ADX (28) indicates a trend is forming; it may be possible to participate | MACD is running bearish; the trend is weak and momentum is strengthening | EMA5 is below EMA8 and EMA13; a bearish alignment | KDJ is running weakly, with bears in control (K is 34.1, D is 43.5) | Volume expands (2.0x)
Price change: -0.5100%
📉 $RONIN | 4-hour bearish signal
━━━━━━━━━━━━━━━━━━
Technical analysis: ADX(53) is a very strong trend (watch for an overheating pullback) | MACDDIF breaks below the zero line, turning the trend bearish | EMA5 crosses below EMA8, turning short-term bearish | Volume spikes (3.5x)
Price change: -11.7600%
📉 $BMNR | 4-hour bearish signal
━━━━━━━━━━━━━━━━━━
Technical analysis: ADX (27) indicates a trend is forming; it may be possible to participate | MACDDIF breaks below the zero line, turning the trend bearish | EMA5 is below EMA8 and EMA13; a bearish alignment | KDJ is running weakly, with bears in control (K is 32.9, D is 44.3) | Volume expands (2.3x)
Price change: -1.4500%
━━━━━━━━━━━━━━━━━━
#技术分析 #AAPL #RONIN #BMNR
📌 The information above is for reference only and does not constitute investment advice
📉 $AAPL | 4-hour bearish signal
━━━━━━━━━━━━━━━━━━
Technical analysis: ADX (28) indicates a trend is forming; it may be possible to participate | MACD is running bearish; the trend is weak and momentum is strengthening | EMA5 is below EMA8 and EMA13; a bearish alignment | KDJ is running weakly, with bears in control (K is 34.1, D is 43.5) | Volume expands (2.0x)
Price change: -0.5100%
📉 $RONIN | 4-hour bearish signal
━━━━━━━━━━━━━━━━━━
Technical analysis: ADX(53) is a very strong trend (watch for an overheating pullback) | MACDDIF breaks below the zero line, turning the trend bearish | EMA5 crosses below EMA8, turning short-term bearish | Volume spikes (3.5x)
Price change: -11.7600%
📉 $BMNR | 4-hour bearish signal
━━━━━━━━━━━━━━━━━━
Technical analysis: ADX (27) indicates a trend is forming; it may be possible to participate | MACDDIF breaks below the zero line, turning the trend bearish | EMA5 is below EMA8 and EMA13; a bearish alignment | KDJ is running weakly, with bears in control (K is 32.9, D is 44.3) | Volume expands (2.3x)
Price change: -1.4500%
━━━━━━━━━━━━━━━━━━
#技术分析 #AAPL #RONIN #BMNR
📌 The information above is for reference only and does not constitute investment advice
74

·
--
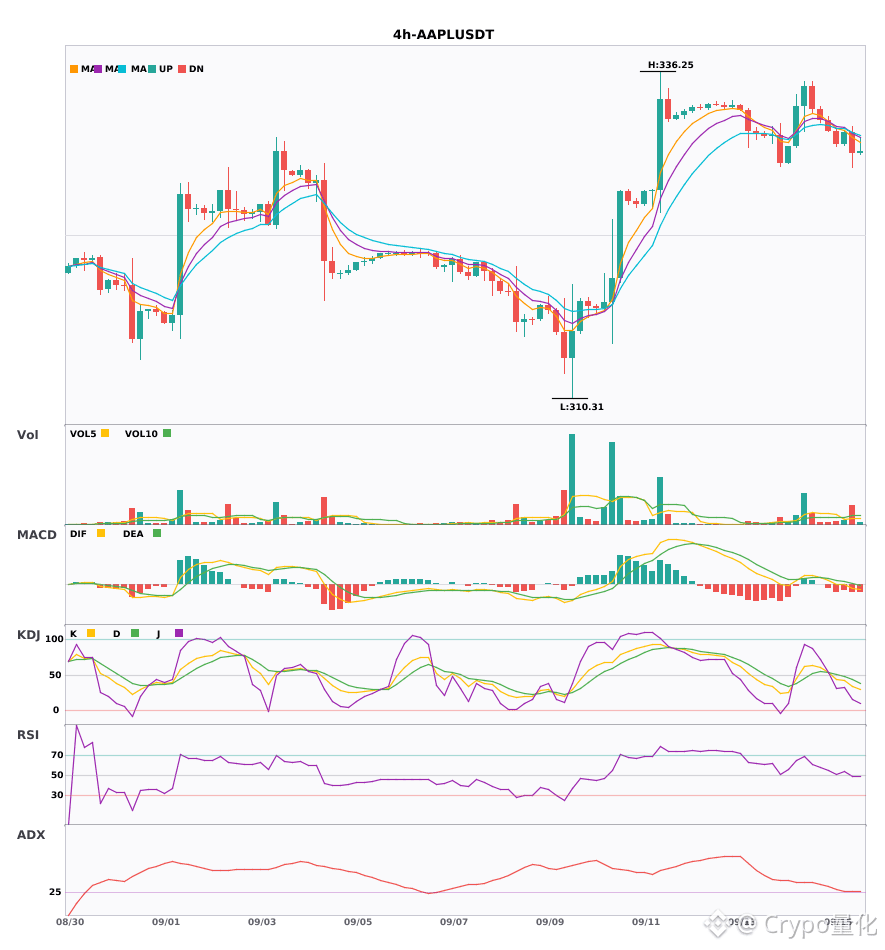
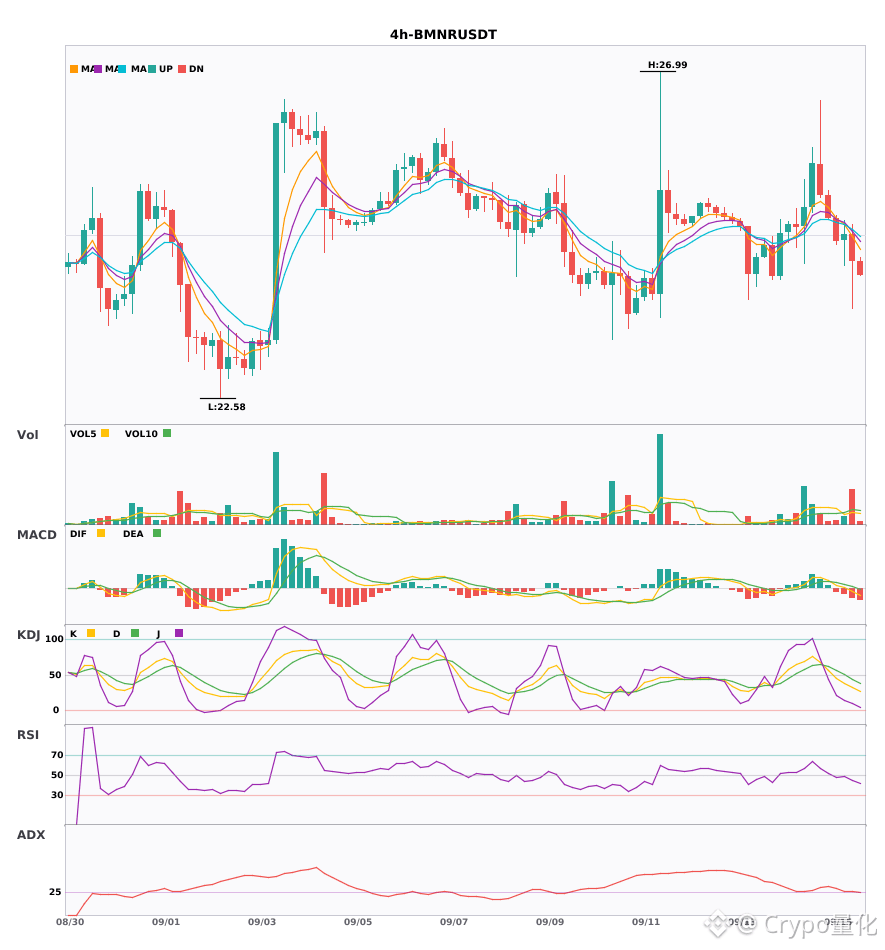
$AAPL / $RONIN / $BMNR 4 hours technical trend synchronization shows weakness—watch out for risks🔥
════════════════════
🟢 $AAPL 4-hour short signal
⚠️ Technicals: The ADX trend has just formed and is suitable for participation. MACD green histogram expands, bearish momentum strengthens. Moving averages are arranged bearishly. KDJ is dominated by bears. Volume is up 2x.
════════════════════
🟢 $RONIN 4-hour short signal
⚠️ Technicals: Although the trend is strong, it’s a bit overheated—be careful of a pullback! The MACD DIF breaks below the zero line and begins turning bearish. EMA5 forms a death cross and drops below EMA8, weakening in the short term. Trading volume surges by 3.5x.
════════════════════
🟢 $BMNR 4-hour short signal
⚠️ Technicals: An ADX27 trend has formed and is suitable for participation. The MACD DIF breaks below the zero line and turns bearish. Moving averages are aligned bearishly. In KDJ, K is below D and slightly weak. Volume expands 2.3x.
════════════════════
🔔 Follow to get first-hand alerts of market anomalies 🔔
#技术分析 #AAPL #RONIN #BMNR
📌 When trading, pay attention to whether the candlestick patterns match
$AAPL / $RONIN / $BMNR 4 hours technical trend synchronization shows weakness—watch out for risks🔥
════════════════════
🟢 $AAPL 4-hour short signal
⚠️ Technicals: The ADX trend has just formed and is suitable for participation. MACD green histogram expands, bearish momentum strengthens. Moving averages are arranged bearishly. KDJ is dominated by bears. Volume is up 2x.
════════════════════
🟢 $RONIN 4-hour short signal
⚠️ Technicals: Although the trend is strong, it’s a bit overheated—be careful of a pullback! The MACD DIF breaks below the zero line and begins turning bearish. EMA5 forms a death cross and drops below EMA8, weakening in the short term. Trading volume surges by 3.5x.
════════════════════
🟢 $BMNR 4-hour short signal
⚠️ Technicals: An ADX27 trend has formed and is suitable for participation. The MACD DIF breaks below the zero line and turns bearish. Moving averages are aligned bearishly. In KDJ, K is below D and slightly weak. Volume expands 2.3x.
════════════════════
🔔 Follow to get first-hand alerts of market anomalies 🔔
#技术分析 #AAPL #RONIN #BMNR
📌 When trading, pay attention to whether the candlestick patterns match
════════════════════
🟢 $AAPL 4-hour short signal
⚠️ Technicals: The ADX trend has just formed and is suitable for participation. MACD green histogram expands, bearish momentum strengthens. Moving averages are arranged bearishly. KDJ is dominated by bears. Volume is up 2x.
════════════════════
🟢 $RONIN 4-hour short signal
⚠️ Technicals: Although the trend is strong, it’s a bit overheated—be careful of a pullback! The MACD DIF breaks below the zero line and begins turning bearish. EMA5 forms a death cross and drops below EMA8, weakening in the short term. Trading volume surges by 3.5x.
════════════════════
🟢 $BMNR 4-hour short signal
⚠️ Technicals: An ADX27 trend has formed and is suitable for participation. The MACD DIF breaks below the zero line and turns bearish. Moving averages are aligned bearishly. In KDJ, K is below D and slightly weak. Volume expands 2.3x.
════════════════════
🔔 Follow to get first-hand alerts of market anomalies 🔔
#技术分析 #AAPL #RONIN #BMNR
📌 When trading, pay attention to whether the candlestick patterns match
53
Log in to explore more content
Join global crypto users on Binance Square
⚡️ Get latest and useful information about crypto.
💬 Trusted by the world’s largest crypto exchange.
👍 Discover real insights from verified creators.
Email / Phone number
Trending Topics
1
#FedRateWatch
1.5M views
6,867 Discussing
2
#ZcashRises6%
61,385 views
709 Discussing
3
#XRPSinks10%
40,593 views
468 Discussing
4
#BitcoinETFsShed$450M
7,864 views
100 Discussing
5
#CircleOpensArcMainnet
18,675 views
305 Discussing
6
#ZcashHoldersBackNU7Upgrade
31,069 views
468 Discussing
7
#MSTRTradingVolumeSurpassesMorganStanley
28,430 views
611 Discussing
8
#BitcoinFalls4%
58,075 views
956 Discussing
9
#SKHynixInTalksToMakeMemoryChipsInUS
22,400 views
372 Discussing
10
#OpenAIDiscussesNewFundingAt$1.2TValuation
6,289 views
61 Discussing