Two Technical Indicators to Gauge Market Trends in Binance Futures
Main Takeaways
The Bollinger Bands and exponential moving average (EMA) are two indicators that can help clarify market trends by smoothing out technical charts to create trend signals.
Traders can use these indicators to anticipate trend reversals in the cryptocurrency market.
Binance Futures offers a wide range of features and tools that allow you to analyze cryptocurrencies’ price action to make the most out of your trades.
Traders often rely on technical indicators to understand when to enter or exit a trade. These tools translate historical price action, volume, and even open interest data into simple, easy-to-read signals that aim to forecast the market’s direction.

Binance Futures offers a wide range of indicators allowing traders to interpret cryptocurrency market data. Our goal is to help our users minimize risk while helping them anticipate trend reversals that can provide possible trading opportunities.
So let’s explore how you can use the Bollinger Bands and exponential moving average (EMA) to gain additional insights into the price action of cryptocurrencies.
1. How to Use the Bollinger Bands
The Bollinger Bands were developed and copyrighted by financial analyst and trader John Bollinger in the early 1980s. This technical indicator helps anticipate periods of high volatility, as well as oversold and overbought conditions.
Although there are 22 rules to follow when using the Bollinger Bands as a trading system, we will focus on some of the most basic applications and limitations.
The squeeze
The squeeze might be one of the most significant reasons traders use the Bollinger Bands. It denotes a period of consolidation that is identifiable when the bands come close together, constricting the price action of a given cryptocurrency. This event can provide possible trading opportunities as it is usually followed by a spike in volatility.
It is worth noting that the squeeze does not determine when volatility will increase or the direction of the potential price move.

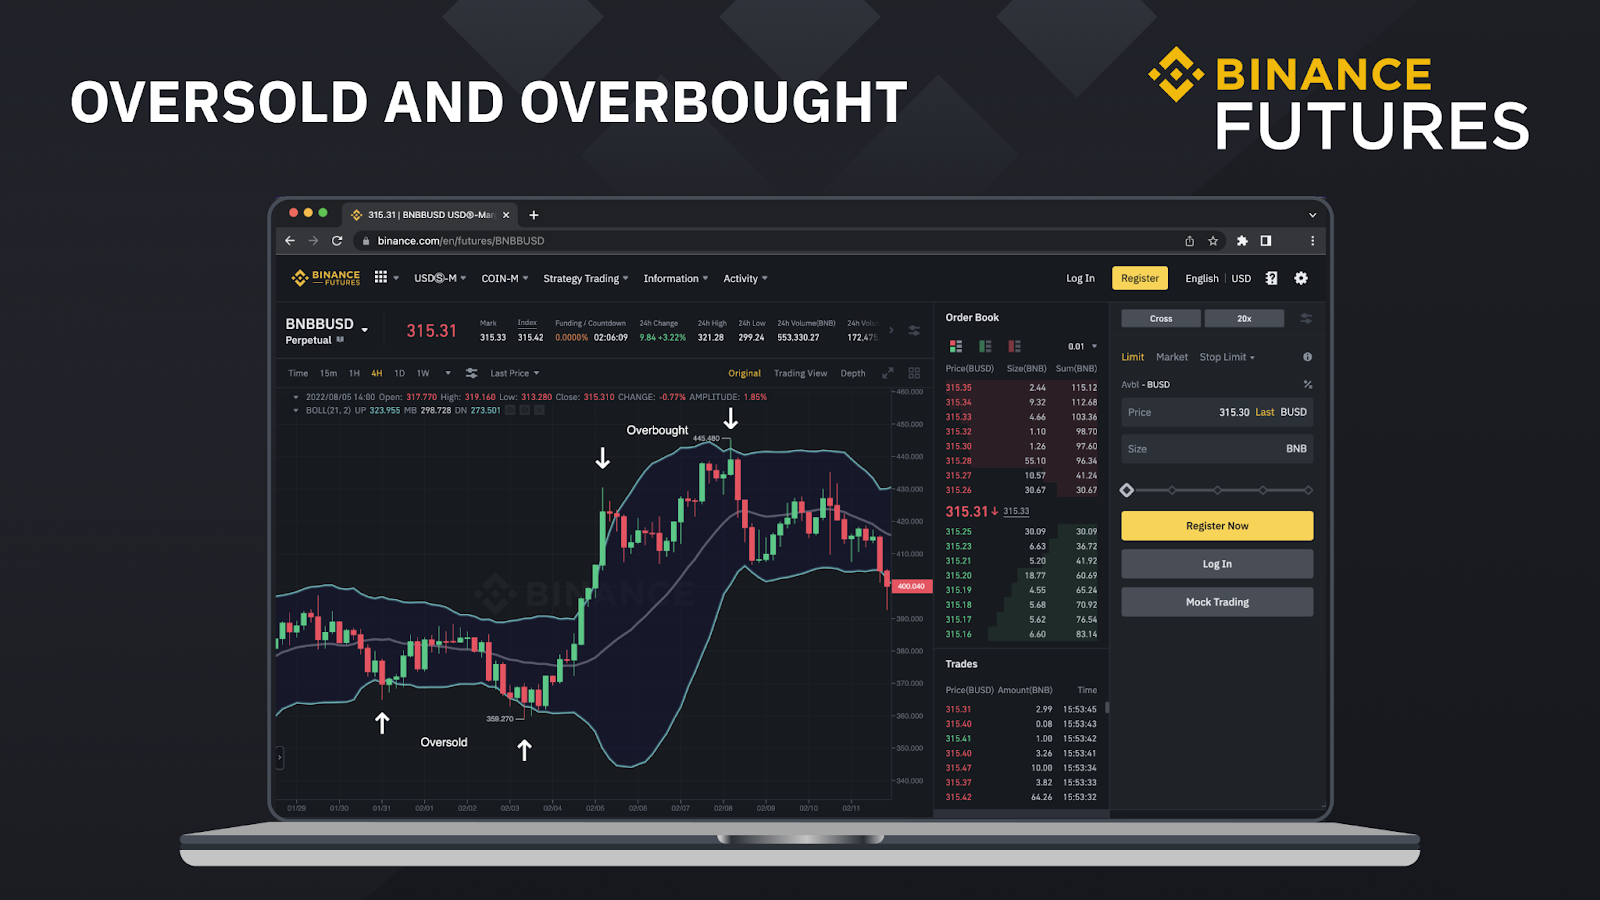
Oversold and overbought conditions
Traders can also use the Bollinger Bands to identify whether a cryptocurrency trades in oversold or overbought conditions. Essentially, when prices move below the lower band, a cryptocurrency has entered the oversold territory, and when prices move above the upper band, a cryptocurrency has entered the overbought territory. These conditions can signal a possible trend reversal.
It is important to note that prices can continue to move further regardless of entering oversold or overbought conditions.
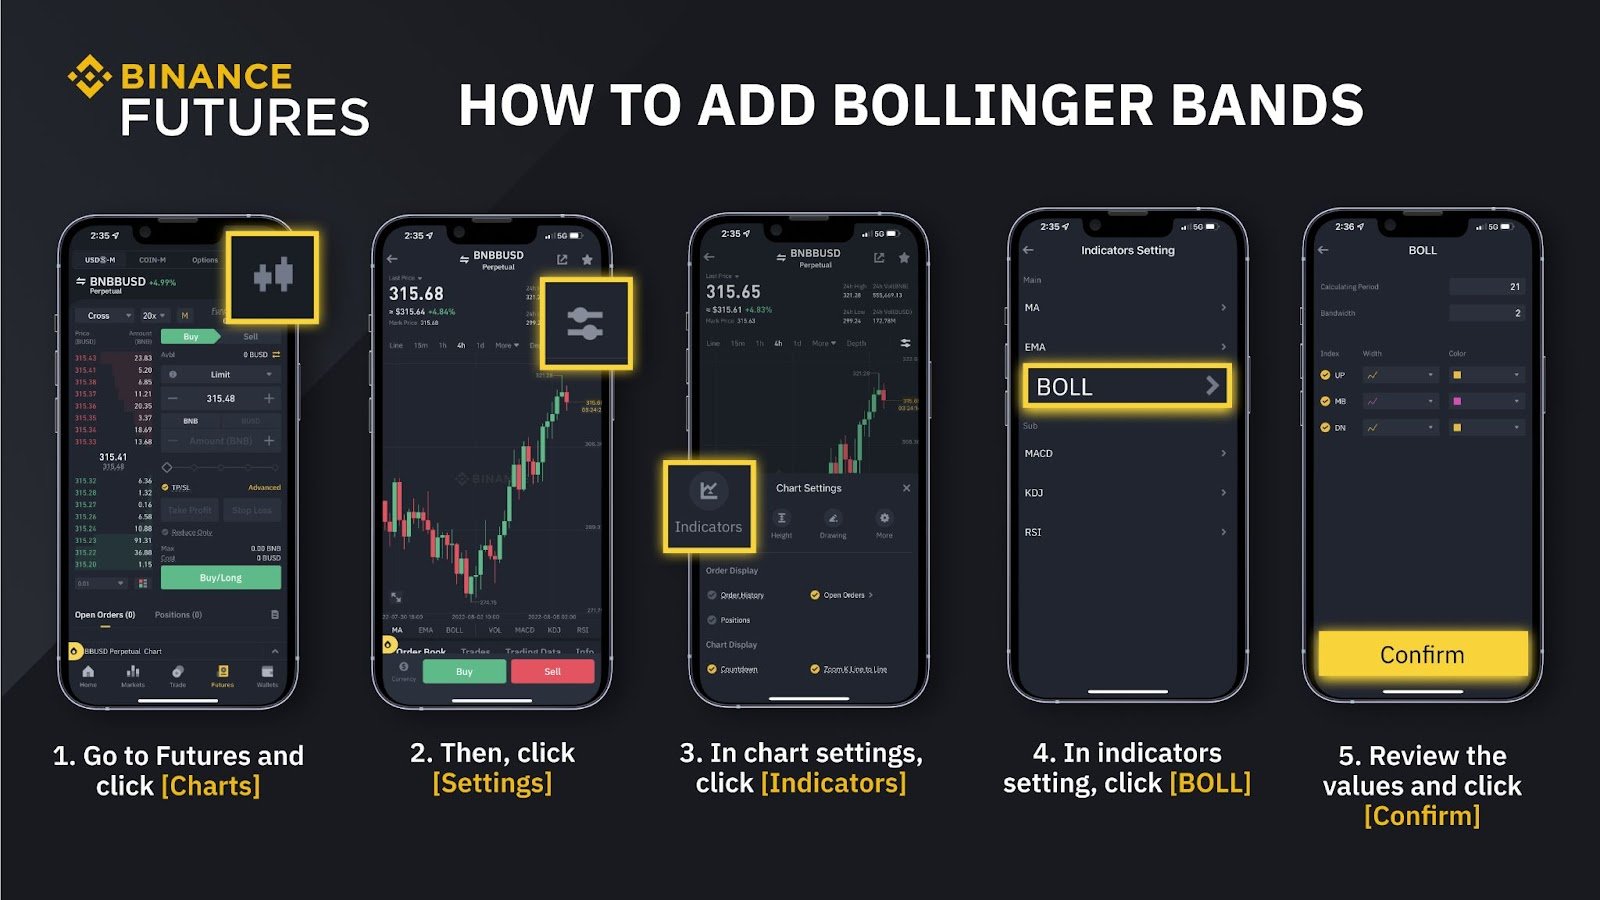
How to add the Bollinger Bands
To add the Bollinger Bands to the price chart in the Binance App, go to [Futures] and select a trading pair of your choice, click [Charts] - [Settings] - [Indicators] - [BOLL] and [Confirm].
2. How to Use the Exponential Moving Average (EMA)
The exponential moving average (EMA) is similar to the simple moving average (SMA) as both measure trend direction over time. Still, the former places more importance on a given cryptocurrency’s most recent price action, following prices more precisely than a corresponding SMA.
Traders can use EMAs to anticipate trend reversals and areas of support and resistance in several ways. Still, we will focus on some of the most basic applications and limitations.
Golden Cross and Death Cross
50 and 200 are the most commonly used values for EMAs. Combined, these EMAs can help determine price strength or weakness.
A golden cross occurs when the 50 EMA crosses above the 200 EMA, which traders usually interpret as a bullish signal. It develops after a prolonged downtrend when selling is depleted and prices start increasing. This event can provide possible trading opportunities as it usually anticipates the beginning of a new uptrend.

On the other hand, a death cross occurs when the 50 EMA crosses below the 200 EMA, which traders usually interpret as a bearish signal. It develops after a prolonged uptrend when profit-taking intensifies and prices start decreasing. This event can provide possible trading opportunities as it usually anticipates the beginning of a new downtrend.

It is worth noting that EMAs are lagging indicators with no predictive power. This means that a golden cross and a death cross typically serve as confirmation of a trend reversal that has already happened – not a reversal that is still underway.
Support and Resistance
Traders often use EMAs as support and resistance levels. They are more dynamic than traditional horizontal support and resistance levels because they constantly change based on a given cryptocurrency’s most recent price action.
It is important to note that prices can also slice through EMAs before a rebound or rejection occurs, just like traditional support and resistance levels.

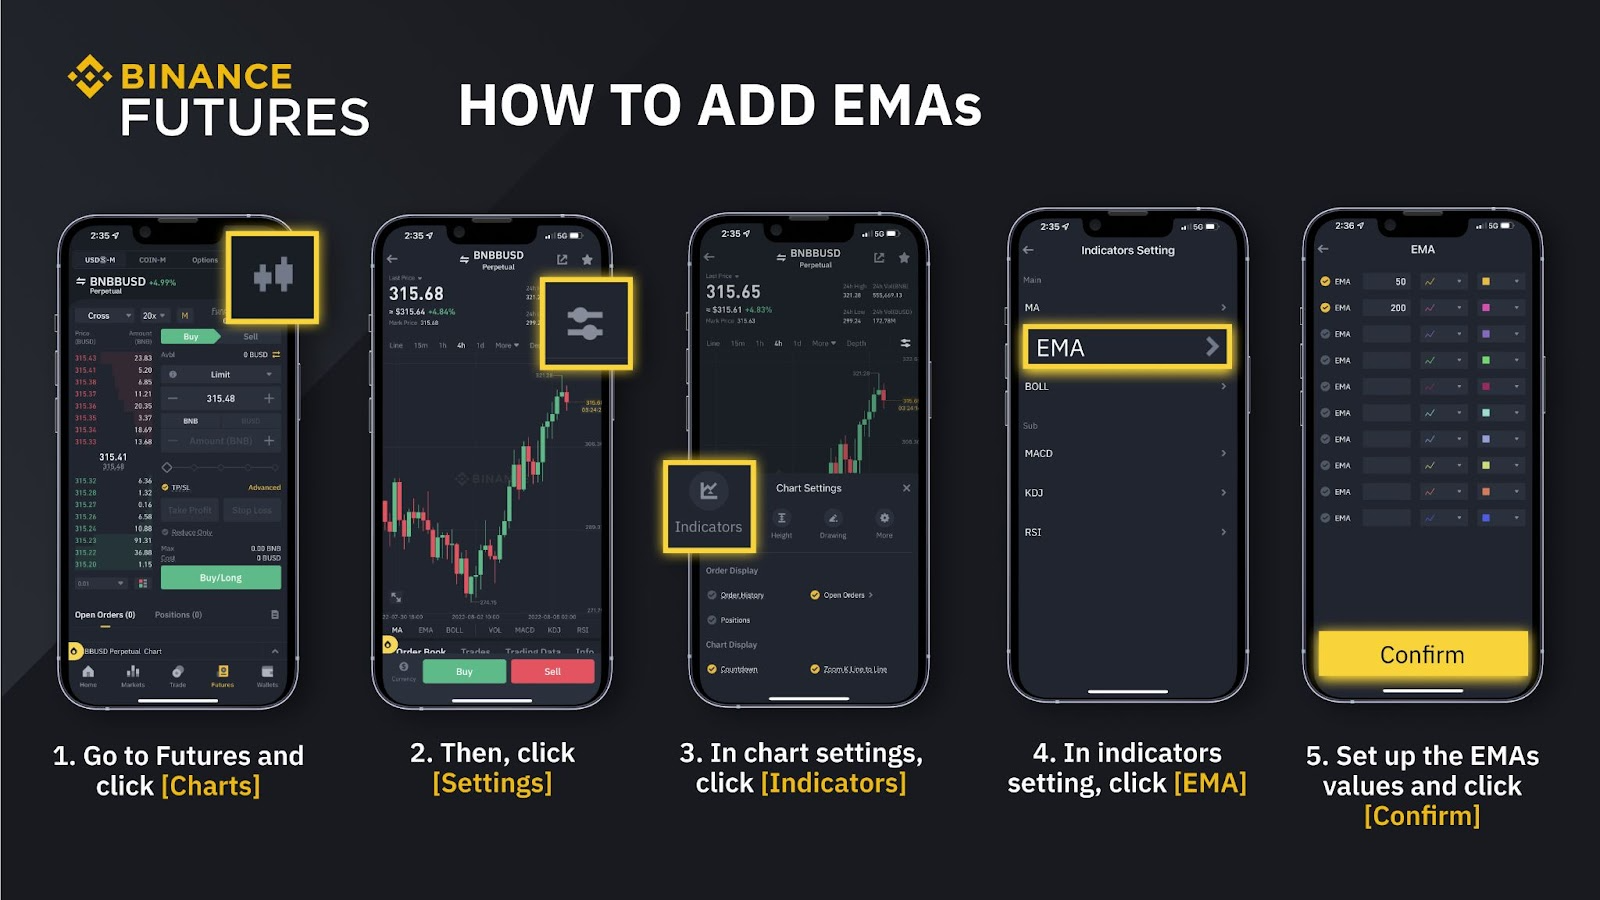
How to add EMAs
To add the EMA indicator to the price chart in the Binance App, go to [Futures] and select a trading pair of your choice, click [Charts] - [Settings] - [Indicators] - [EMA] and [Confirm].
Summary
Binance Futures offers many features and tools to make the most out of the cryptocurrency market. We have introduced multiple mechanisms to help you trade responsibly and manage risk better. We have also developed different knowledge-sharing environments, like the Chat Room, Leaderboard, and Binance Live, to make conversations more profound so that you can feel comfortable speaking your mind while learning from other experienced traders.
If you want to sharpen your trading skills at your own pace with zero risk, don’t forget to check out Binance Futures’ Mock Trading and head out to Binance Academy to learn all things crypto.
Further Reading
Risk Warning: Digital asset prices can be volatile. The value of your investment can go down or up, and you may not get back the amount invested. You are solely responsible for your investment decisions, and Binance is not liable for any losses you may incur. Futures trading, in particular, is subject to high market risk and price volatility. All of your margin balance may be liquidated in the event of adverse price movement. Past performance is not a reliable predictor of future performance. Before trading, you should make an independent assessment of the appropriateness of the transaction in light of your own objectives and circumstances, including the risks and potential benefits. Consult your own advisers where appropriate. This information should not be construed as financial or investment advice. To learn more about how to protect yourself, visit our Responsible Trading page. For more information, see our Terms of Use and Risk Warning.