
#layer1
layer1
5M views
26,287 Discussing
Hot
Latest

·
--
$AVAX is quietly building the infrastructure institutions actually want 🏢⛓️
Custom subnets, institutional compliance frameworks, and real-world asset (RWA) pilot programs make Avalanche a prime candidate for traditional enterprise blockchain integration.
When the broader market looks past the daily noise, enterprise adoption leads the next wave of capital.
Are you bullish on Avalanche subnets for this cycle? Share your outlook on $AVAX! 🚀
#Avalanche #AVAX #Layer1 #Web3
$AVAX is quietly building the infrastructure institutions actually want 🏢⛓️
Custom subnets, institutional compliance frameworks, and real-world asset (RWA) pilot programs make Avalanche a prime candidate for traditional enterprise blockchain integration.
When the broader market looks past the daily noise, enterprise adoption leads the next wave of capital.
Are you bullish on Avalanche subnets for this cycle? Share your outlook on $AVAX ! 🚀
#Avalanche #AVAX #Layer1 #Web3
Custom subnets, institutional compliance frameworks, and real-world asset (RWA) pilot programs make Avalanche a prime candidate for traditional enterprise blockchain integration.
When the broader market looks past the daily noise, enterprise adoption leads the next wave of capital.
Are you bullish on Avalanche subnets for this cycle? Share your outlook on $AVAX ! 🚀
#Avalanche #AVAX #Layer1 #Web3

·
--
If you're still hopping between L1s that only solve half your problems, stop now.
This rotation game has cost traders millions in fees, downtime, and rugs. You FOMO into the fast chain and it congests right when you need to sell, or you pick privacy and can't even swap without jumping through hoops.
We've been here with $ETH turning every transaction into a luxury, $SOL going dark at the worst times, and even $BTC proving that deflationary doesn't mean usable for daily stuff. The usual suspects always force a choice. Privacy or speed. Cheap or secure.
It's tiring watching the same cycle.
One Layer 1 is putting privacy, scalability, usability, spam resistance, and deflationary tokenomics in the same box. No L2s needed, no waiting for the next upgrade cycle. If it actually delivers, the comparison to past cycles gets interesting.
What's your take on whether any chain can pull this off without the classic tradeoffs?
#Layer1 #Privacy #Crypto
If you're still hopping between L1s that only solve half your problems, stop now.
This rotation game has cost traders millions in fees, downtime, and rugs. You FOMO into the fast chain and it congests right when you need to sell, or you pick privacy and can't even swap without jumping through hoops.
We've been here with $ETH turning every transaction into a luxury, $SOL going dark at the worst times, and even $BTC proving that deflationary doesn't mean usable for daily stuff. The usual suspects always force a choice. Privacy or speed. Cheap or secure.
It's tiring watching the same cycle.
One Layer 1 is putting privacy, scalability, usability, spam resistance, and deflationary tokenomics in the same box. No L2s needed, no waiting for the next upgrade cycle. If it actually delivers, the comparison to past cycles gets interesting.
What's your take on whether any chain can pull this off without the classic tradeoffs?
#Layer1 #Privacy #Crypto
This rotation game has cost traders millions in fees, downtime, and rugs. You FOMO into the fast chain and it congests right when you need to sell, or you pick privacy and can't even swap without jumping through hoops.
We've been here with $ETH turning every transaction into a luxury, $SOL going dark at the worst times, and even $BTC proving that deflationary doesn't mean usable for daily stuff. The usual suspects always force a choice. Privacy or speed. Cheap or secure.
It's tiring watching the same cycle.
One Layer 1 is putting privacy, scalability, usability, spam resistance, and deflationary tokenomics in the same box. No L2s needed, no waiting for the next upgrade cycle. If it actually delivers, the comparison to past cycles gets interesting.
What's your take on whether any chain can pull this off without the classic tradeoffs?
#Layer1 #Privacy #Crypto
57

·
--
Here's what happened when every new Layer 1 promised to fix Ethereum and then shipped the same trade-offs.
Most of us have watched portfolios bleed while hopping from a private coin that nobody uses to a fast chain that doxxes every swap. You either miss the entry because the UX is terrible or you get wrecked when spam drives fees through the roof.
$ETH spent a decade proving that general-purpose smart contracts create congestion more than they create usability. $XMR showed that protocol-level privacy actually works, but it never cracked throughput or made wallets feel normal for everyday traders. $SOL went all-in on speed and still has to answer outage and spam questions that keep a lot of capital on the sidelines.
None of them put privacy, scalability, usability, spam resistance, and deflationary tokenomics into one base layer from day one. That is the real case study. Earlier chains treated those properties as features you add later. This approach treats them as the foundation. Execution under load will decide if the market finally stops rotating between specialists.
Where do you think this goes from here?
#Layer1 #Privacy #Tokenomics
Here's what happened when every new Layer 1 promised to fix Ethereum and then shipped the same trade-offs.
Most of us have watched portfolios bleed while hopping from a private coin that nobody uses to a fast chain that doxxes every swap. You either miss the entry because the UX is terrible or you get wrecked when spam drives fees through the roof.
$ETH spent a decade proving that general-purpose smart contracts create congestion more than they create usability. $XMR showed that protocol-level privacy actually works, but it never cracked throughput or made wallets feel normal for everyday traders. $SOL went all-in on speed and still has to answer outage and spam questions that keep a lot of capital on the sidelines.
None of them put privacy, scalability, usability, spam resistance, and deflationary tokenomics into one base layer from day one. That is the real case study. Earlier chains treated those properties as features you add later. This approach treats them as the foundation. Execution under load will decide if the market finally stops rotating between specialists.
Where do you think this goes from here?
#Layer1 #Privacy #Tokenomics
Most of us have watched portfolios bleed while hopping from a private coin that nobody uses to a fast chain that doxxes every swap. You either miss the entry because the UX is terrible or you get wrecked when spam drives fees through the roof.
$ETH spent a decade proving that general-purpose smart contracts create congestion more than they create usability. $XMR showed that protocol-level privacy actually works, but it never cracked throughput or made wallets feel normal for everyday traders. $SOL went all-in on speed and still has to answer outage and spam questions that keep a lot of capital on the sidelines.
None of them put privacy, scalability, usability, spam resistance, and deflationary tokenomics into one base layer from day one. That is the real case study. Earlier chains treated those properties as features you add later. This approach treats them as the foundation. Execution under load will decide if the market finally stops rotating between specialists.
Where do you think this goes from here?
#Layer1 #Privacy #Tokenomics
76

Most traders don't realize that over 95% of Layer 1s force a brutal trade-off between keeping your wealth private and actually being able to use the network without insane fees.
I've watched too many people get wrecked chasing the next big chain only to get sandwiched by bots, pay $80 in gas, or see their holdings diluted by endless inflation. That sting of watching profits vanish to network issues never really leaves you.
Privacy, scalability, usability, spam resistance and deflationary tokenomics rarely live together. Look at $ETH, which has decent usability now and some deflation from burns but treats privacy as an afterthought while spam still clogs it during hype. $SOL scaled like crazy hitting tens of thousands of TPS yet outages and lack of real privacy left holders exposed.
Spam resistance matters more than people think because in past cycles cheap blockspace got flooded with junk driving real users away. Deflationary models like $BTC's halvings create that long-term hope the kind that compounds if you hold through the noise.
Combining all five in a single Layer 1 isn't easy since privacy tech often kills speed or makes things clunky for average users. When a chain actually delivers it feels like the missing piece from 2017 and 2021 cycles.
Have you found an L1 that actually checks all these boxes or are we still waiting?
#Layer1 #Privacy #CryptoTrading
Most traders don't realize that over 95% of Layer 1s force a brutal trade-off between keeping your wealth private and actually being able to use the network without insane fees.
I've watched too many people get wrecked chasing the next big chain only to get sandwiched by bots, pay $80 in gas, or see their holdings diluted by endless inflation. That sting of watching profits vanish to network issues never really leaves you.
Privacy, scalability, usability, spam resistance and deflationary tokenomics rarely live together. Look at $ETH , which has decent usability now and some deflation from burns but treats privacy as an afterthought while spam still clogs it during hype. $SOL scaled like crazy hitting tens of thousands of TPS yet outages and lack of real privacy left holders exposed.
Spam resistance matters more than people think because in past cycles cheap blockspace got flooded with junk driving real users away. Deflationary models like $BTC 's halvings create that long-term hope the kind that compounds if you hold through the noise.
Combining all five in a single Layer 1 isn't easy since privacy tech often kills speed or makes things clunky for average users. When a chain actually delivers it feels like the missing piece from 2017 and 2021 cycles.
Have you found an L1 that actually checks all these boxes or are we still waiting?
#Layer1 #Privacy #CryptoTrading
I've watched too many people get wrecked chasing the next big chain only to get sandwiched by bots, pay $80 in gas, or see their holdings diluted by endless inflation. That sting of watching profits vanish to network issues never really leaves you.
Privacy, scalability, usability, spam resistance and deflationary tokenomics rarely live together. Look at $ETH , which has decent usability now and some deflation from burns but treats privacy as an afterthought while spam still clogs it during hype. $SOL scaled like crazy hitting tens of thousands of TPS yet outages and lack of real privacy left holders exposed.
Spam resistance matters more than people think because in past cycles cheap blockspace got flooded with junk driving real users away. Deflationary models like $BTC 's halvings create that long-term hope the kind that compounds if you hold through the noise.
Combining all five in a single Layer 1 isn't easy since privacy tech often kills speed or makes things clunky for average users. When a chain actually delivers it feels like the missing piece from 2017 and 2021 cycles.
Have you found an L1 that actually checks all these boxes or are we still waiting?
#Layer1 #Privacy #CryptoTrading
20

·
--
everyone thinks a layer 1 has to pick between speed, privacy, and decentralization, but actually chasing hyped chains that ignore the trilemma is how most portfolios get bled dry.
most of us have aped into new tech thinking we caught the bottom, only to watch transactions fail during peak volatility or see our bags diluted into oblivion because the network had zero spam resistance and endless inflation.
i was looking closely at how legacy architectures handle this trade-off, and the case study is pretty brutal. you see chains like $ETH outsource privacy to third-party mixers that get flagged, while high-throughput networks like $SOL occasionally choke under bot spam when fees are too cheap. traders end up paying for those architectural flaws through slippage and stuck funds.
ngl, having native privacy, sub-second scalability, clean usability, hard spam resistance, and deflationary tokenomics baked directly into the base layer fixes the exact structural issues that wrecked previous cycles. when fee burns actually offset emissions and the chain stays fast under heavy load, the token mechanics finally protect holders instead of early venture funds dumping on retail like we saw with $NEAR unlocks.
where do you think the next wave of real L1 adoption actually goes from here?
#Layer1 #Crypto #DeFi
everyone thinks a layer 1 has to pick between speed, privacy, and decentralization, but actually chasing hyped chains that ignore the trilemma is how most portfolios get bled dry.
most of us have aped into new tech thinking we caught the bottom, only to watch transactions fail during peak volatility or see our bags diluted into oblivion because the network had zero spam resistance and endless inflation.
i was looking closely at how legacy architectures handle this trade-off, and the case study is pretty brutal. you see chains like $ETH outsource privacy to third-party mixers that get flagged, while high-throughput networks like $SOL occasionally choke under bot spam when fees are too cheap. traders end up paying for those architectural flaws through slippage and stuck funds.
ngl, having native privacy, sub-second scalability, clean usability, hard spam resistance, and deflationary tokenomics baked directly into the base layer fixes the exact structural issues that wrecked previous cycles. when fee burns actually offset emissions and the chain stays fast under heavy load, the token mechanics finally protect holders instead of early venture funds dumping on retail like we saw with $NEAR unlocks.
where do you think the next wave of real L1 adoption actually goes from here?
#Layer1 #Crypto #DeFi
most of us have aped into new tech thinking we caught the bottom, only to watch transactions fail during peak volatility or see our bags diluted into oblivion because the network had zero spam resistance and endless inflation.
i was looking closely at how legacy architectures handle this trade-off, and the case study is pretty brutal. you see chains like $ETH outsource privacy to third-party mixers that get flagged, while high-throughput networks like $SOL occasionally choke under bot spam when fees are too cheap. traders end up paying for those architectural flaws through slippage and stuck funds.
ngl, having native privacy, sub-second scalability, clean usability, hard spam resistance, and deflationary tokenomics baked directly into the base layer fixes the exact structural issues that wrecked previous cycles. when fee burns actually offset emissions and the chain stays fast under heavy load, the token mechanics finally protect holders instead of early venture funds dumping on retail like we saw with $NEAR unlocks.
where do you think the next wave of real L1 adoption actually goes from here?
#Layer1 #Crypto #DeFi
40

Why is nobody talking about how most Layer 1 chains force you to sacrifice privacy just to get actual scalability?
We have all watched our bags bleed after buying into hyped networks that either grind to a halt under spam or charge insane fees for simple swaps. It is frustrating to hold tokens where unchecked inflation silently drains your upside before you can even plan an exit.
The industry has spent years trapped in a false compromise. Networks like $XMR proved that confidential transfers are essential, yet mainstream usability and scaling suffered. On the other hand, fast ecosystems like $SOL unlocked speed but left users vulnerable to network congestion and complete transaction transparency.
A sustainable Layer 1 has to solve this entire stack simultaneously. When privacy, high throughput, and spam resistance are baked directly into the base layer alongside deflationary burn mechanics, the underlying economics shift dramatically. You no longer need separate patches or complex workarounds to protect user balances while maintaining deflationary pressure on $BNB and other tier-one assets.
Where do you think capital will flow once all-in-one architectures become the new baseline?
#Layer1 #Crypto #Blockchain
Why is nobody talking about how most Layer 1 chains force you to sacrifice privacy just to get actual scalability?
We have all watched our bags bleed after buying into hyped networks that either grind to a halt under spam or charge insane fees for simple swaps. It is frustrating to hold tokens where unchecked inflation silently drains your upside before you can even plan an exit.
The industry has spent years trapped in a false compromise. Networks like $XMR proved that confidential transfers are essential, yet mainstream usability and scaling suffered. On the other hand, fast ecosystems like $SOL unlocked speed but left users vulnerable to network congestion and complete transaction transparency.
A sustainable Layer 1 has to solve this entire stack simultaneously. When privacy, high throughput, and spam resistance are baked directly into the base layer alongside deflationary burn mechanics, the underlying economics shift dramatically. You no longer need separate patches or complex workarounds to protect user balances while maintaining deflationary pressure on $BNB and other tier-one assets.
Where do you think capital will flow once all-in-one architectures become the new baseline?
#Layer1 #Crypto #Blockchain
We have all watched our bags bleed after buying into hyped networks that either grind to a halt under spam or charge insane fees for simple swaps. It is frustrating to hold tokens where unchecked inflation silently drains your upside before you can even plan an exit.
The industry has spent years trapped in a false compromise. Networks like $XMR proved that confidential transfers are essential, yet mainstream usability and scaling suffered. On the other hand, fast ecosystems like $SOL unlocked speed but left users vulnerable to network congestion and complete transaction transparency.
A sustainable Layer 1 has to solve this entire stack simultaneously. When privacy, high throughput, and spam resistance are baked directly into the base layer alongside deflationary burn mechanics, the underlying economics shift dramatically. You no longer need separate patches or complex workarounds to protect user balances while maintaining deflationary pressure on $BNB and other tier-one assets.
Where do you think capital will flow once all-in-one architectures become the new baseline?
#Layer1 #Crypto #Blockchain
73

⚡ $SEI Network ($SEI): Built for Speed
Sub-Second Finality: Delivers lightning-fast ~300ms transaction finality, setting a high standard for Layer 1 speed.
Parallelized EVM: Blends Ethereum’s massive developer ecosystem with high-throughput parallel processing and near-zero gas fees.
DEX-Optimized: Features native order-matching engines and front-running prevention to give DeFi the seamless feel of a centralized exchange.
Ecosystem Momentum: Rapidly rising TVL and expanding institutional partnerships keep $SEI at the forefront of modern Layer 1s.
#Crypto #Layer1 #DeFi #Web3 #CryptoNews
$SEI
{spot}(SEIUSDT)
⚡ $SEI Network ($SEI ): Built for Speed
Sub-Second Finality: Delivers lightning-fast ~300ms transaction finality, setting a high standard for Layer 1 speed.
Parallelized EVM: Blends Ethereum’s massive developer ecosystem with high-throughput parallel processing and near-zero gas fees.
DEX-Optimized: Features native order-matching engines and front-running prevention to give DeFi the seamless feel of a centralized exchange.
Ecosystem Momentum: Rapidly rising TVL and expanding institutional partnerships keep $SEI at the forefront of modern Layer 1s.
#Crypto #Layer1 #DeFi #Web3 #CryptoNews
$SEI
Sub-Second Finality: Delivers lightning-fast ~300ms transaction finality, setting a high standard for Layer 1 speed.
Parallelized EVM: Blends Ethereum’s massive developer ecosystem with high-throughput parallel processing and near-zero gas fees.
DEX-Optimized: Features native order-matching engines and front-running prevention to give DeFi the seamless feel of a centralized exchange.
Ecosystem Momentum: Rapidly rising TVL and expanding institutional partnerships keep $SEI at the forefront of modern Layer 1s.
#Crypto #Layer1 #DeFi #Web3 #CryptoNews
$SEI
183

🔥 L1 TITANS SHOWDOWN: Key Support Retests Across Layer-1 Leaders
Top Layer-1 networks ($SOL , $SUI , $APT ) are experiencing short-term pullbacks toward critical daily moving averages. Here is a direct breakdown of the key technical levels and market structures:
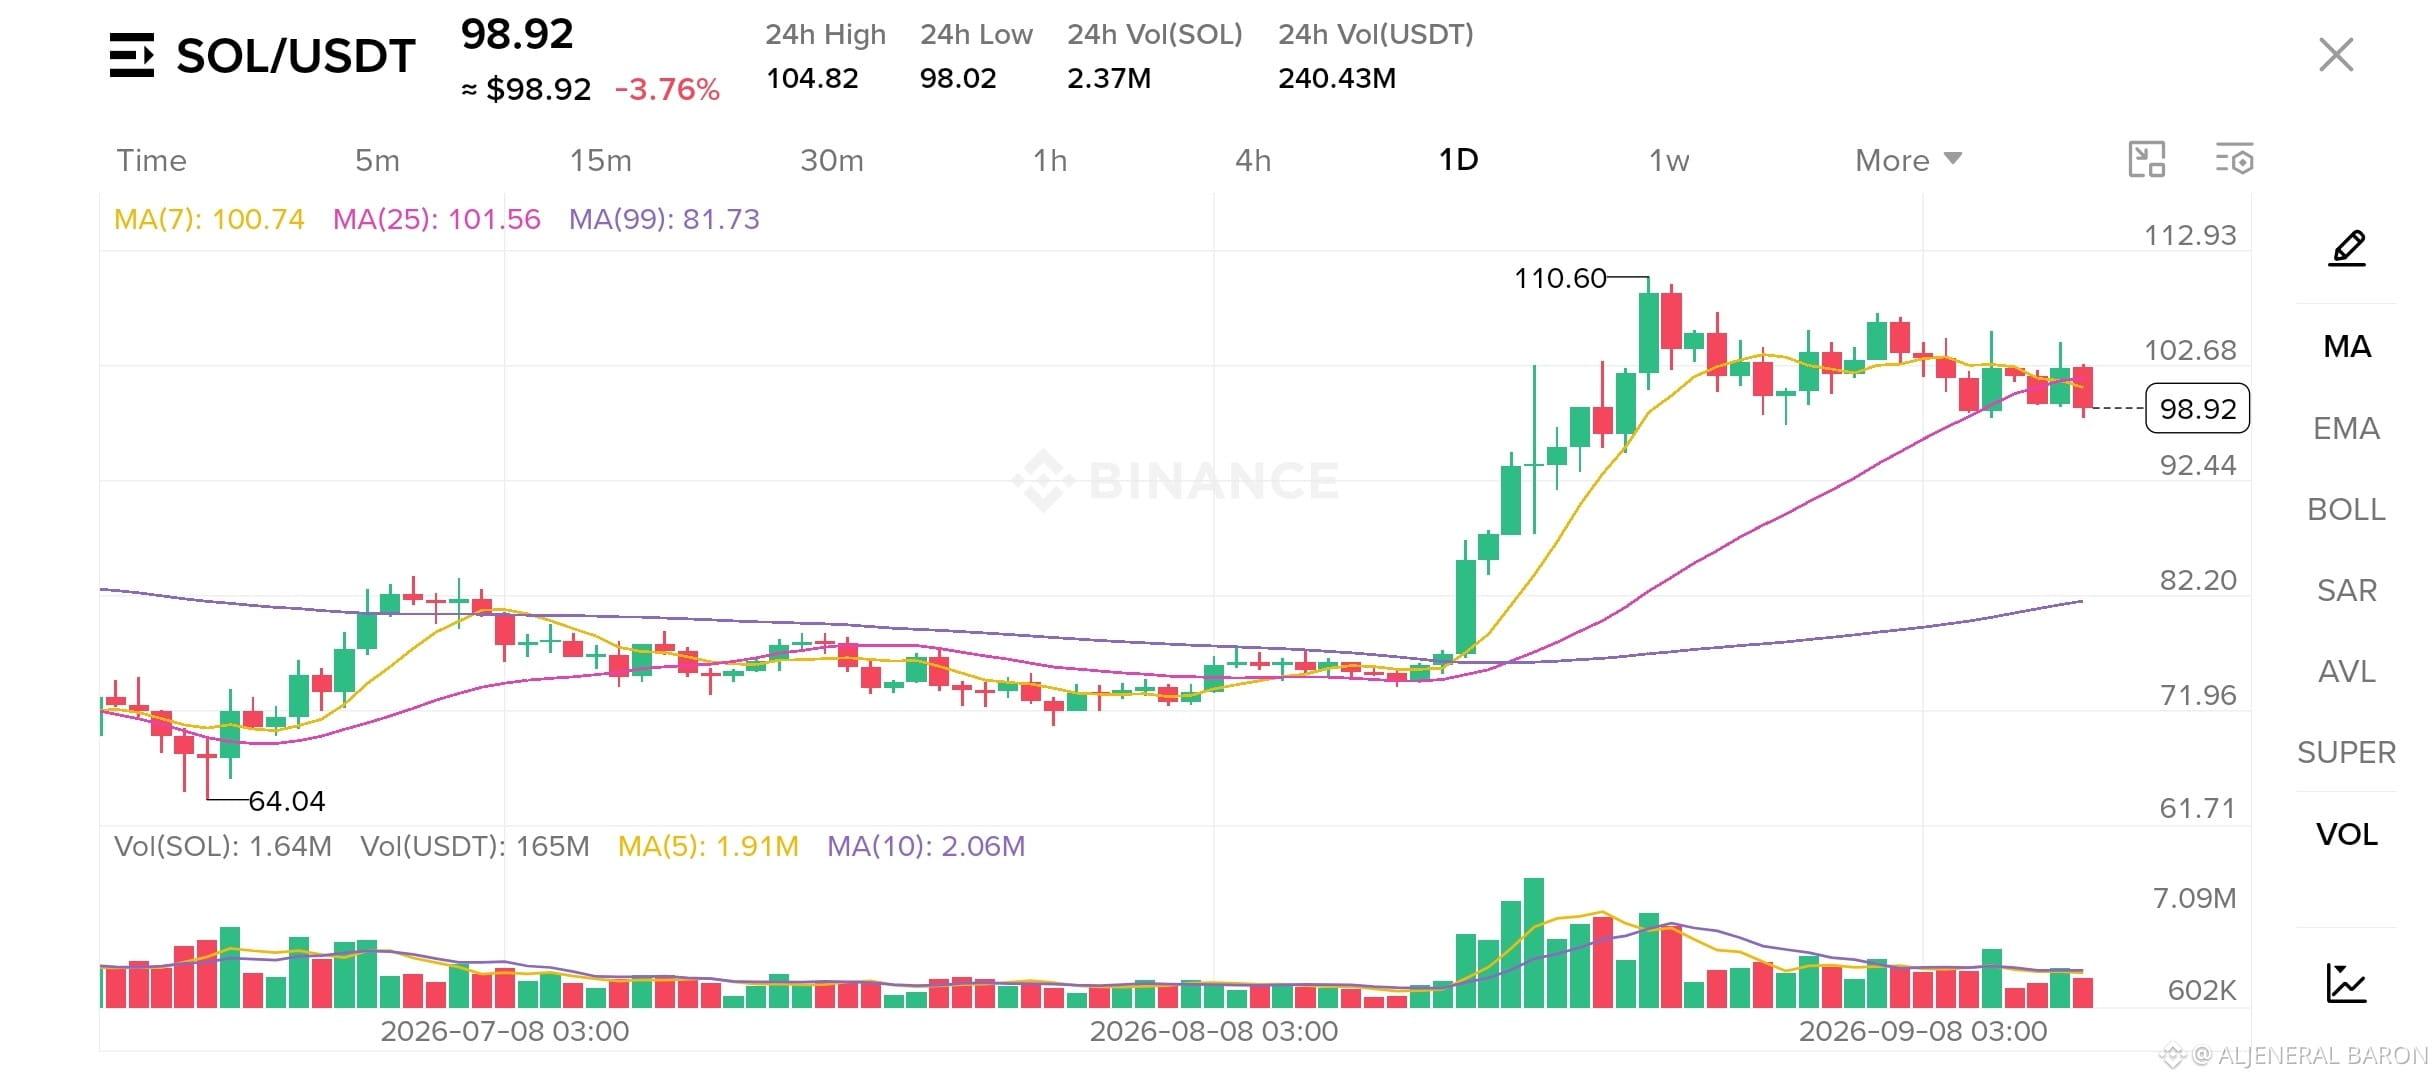
⚡ 1. SOL- Testing the $98 Support Level
• Current Price: $98.92 (-3.76%)
• Resistance: $100.74 (MA7) - $110.60 | Primary Support: $92.44 - $98.00
• Technical Setup: SOL slipped slightly below the $100 psychological level and its MA(25) at $101.56. Buyers are defending the 24h low near $98.02. Reclaiming $100.74 (MA7) is essential for bulls to resume momentum toward the $110 peak.
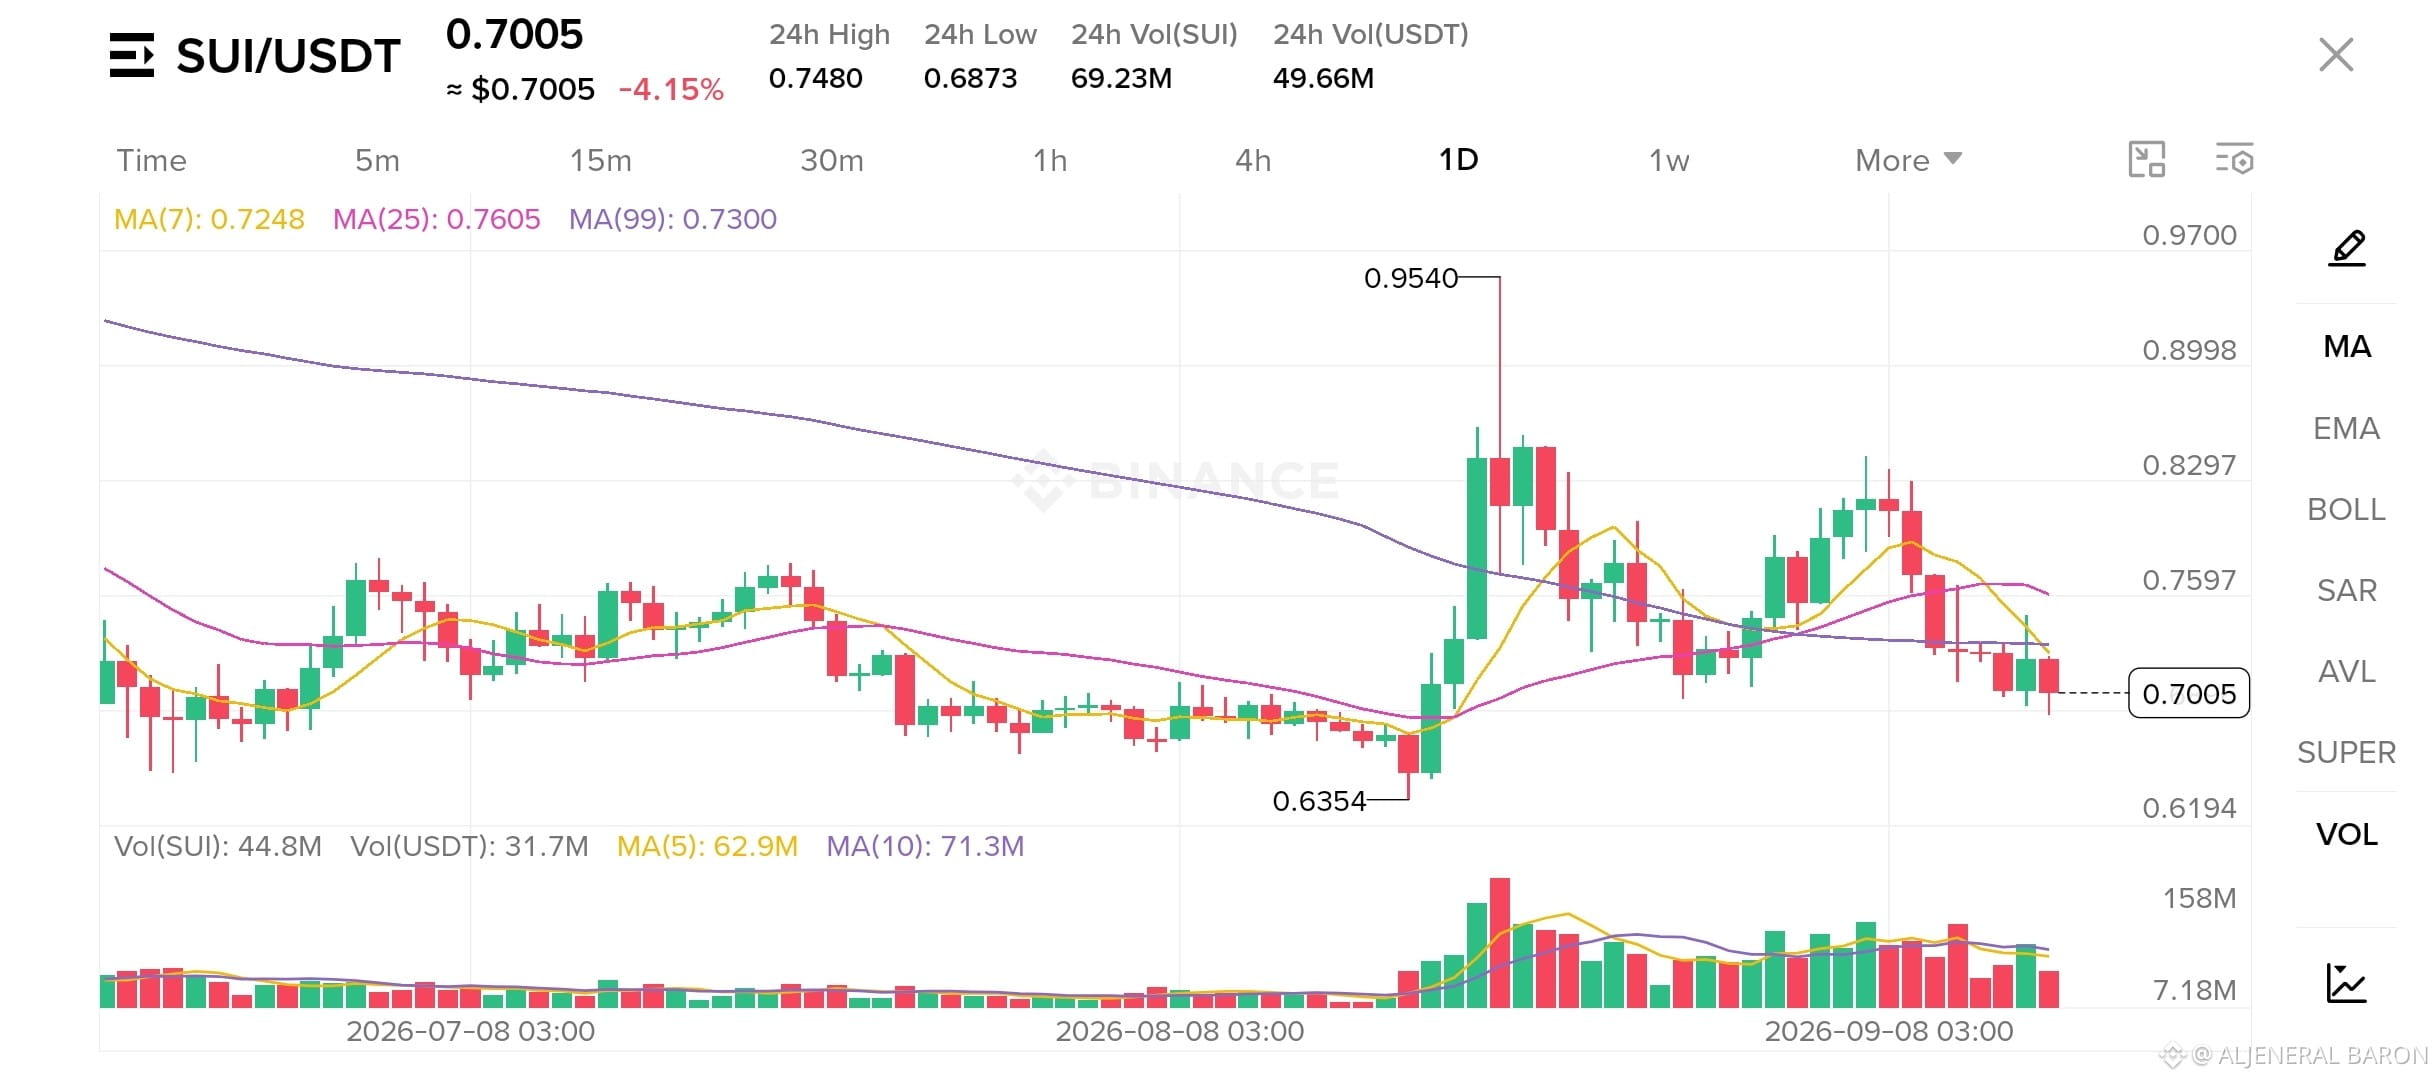
🚀 2. SUI- Holding Near Macro Baseline
• Current Price: $0.7005 (-4.15%)
• Resistance: $0.7248 (MA7) - $0.7605 (MA25) | Base Support: $0.6873 - $0.6354
• Technical Setup: SUI is retesting its critical MA(99) trendline at $0.7300. Lower volume on this pullback indicates selling pressure is weakening. A solid daily close above $0.7000 keeps the setup primed for a potential rebound toward $0.7600.
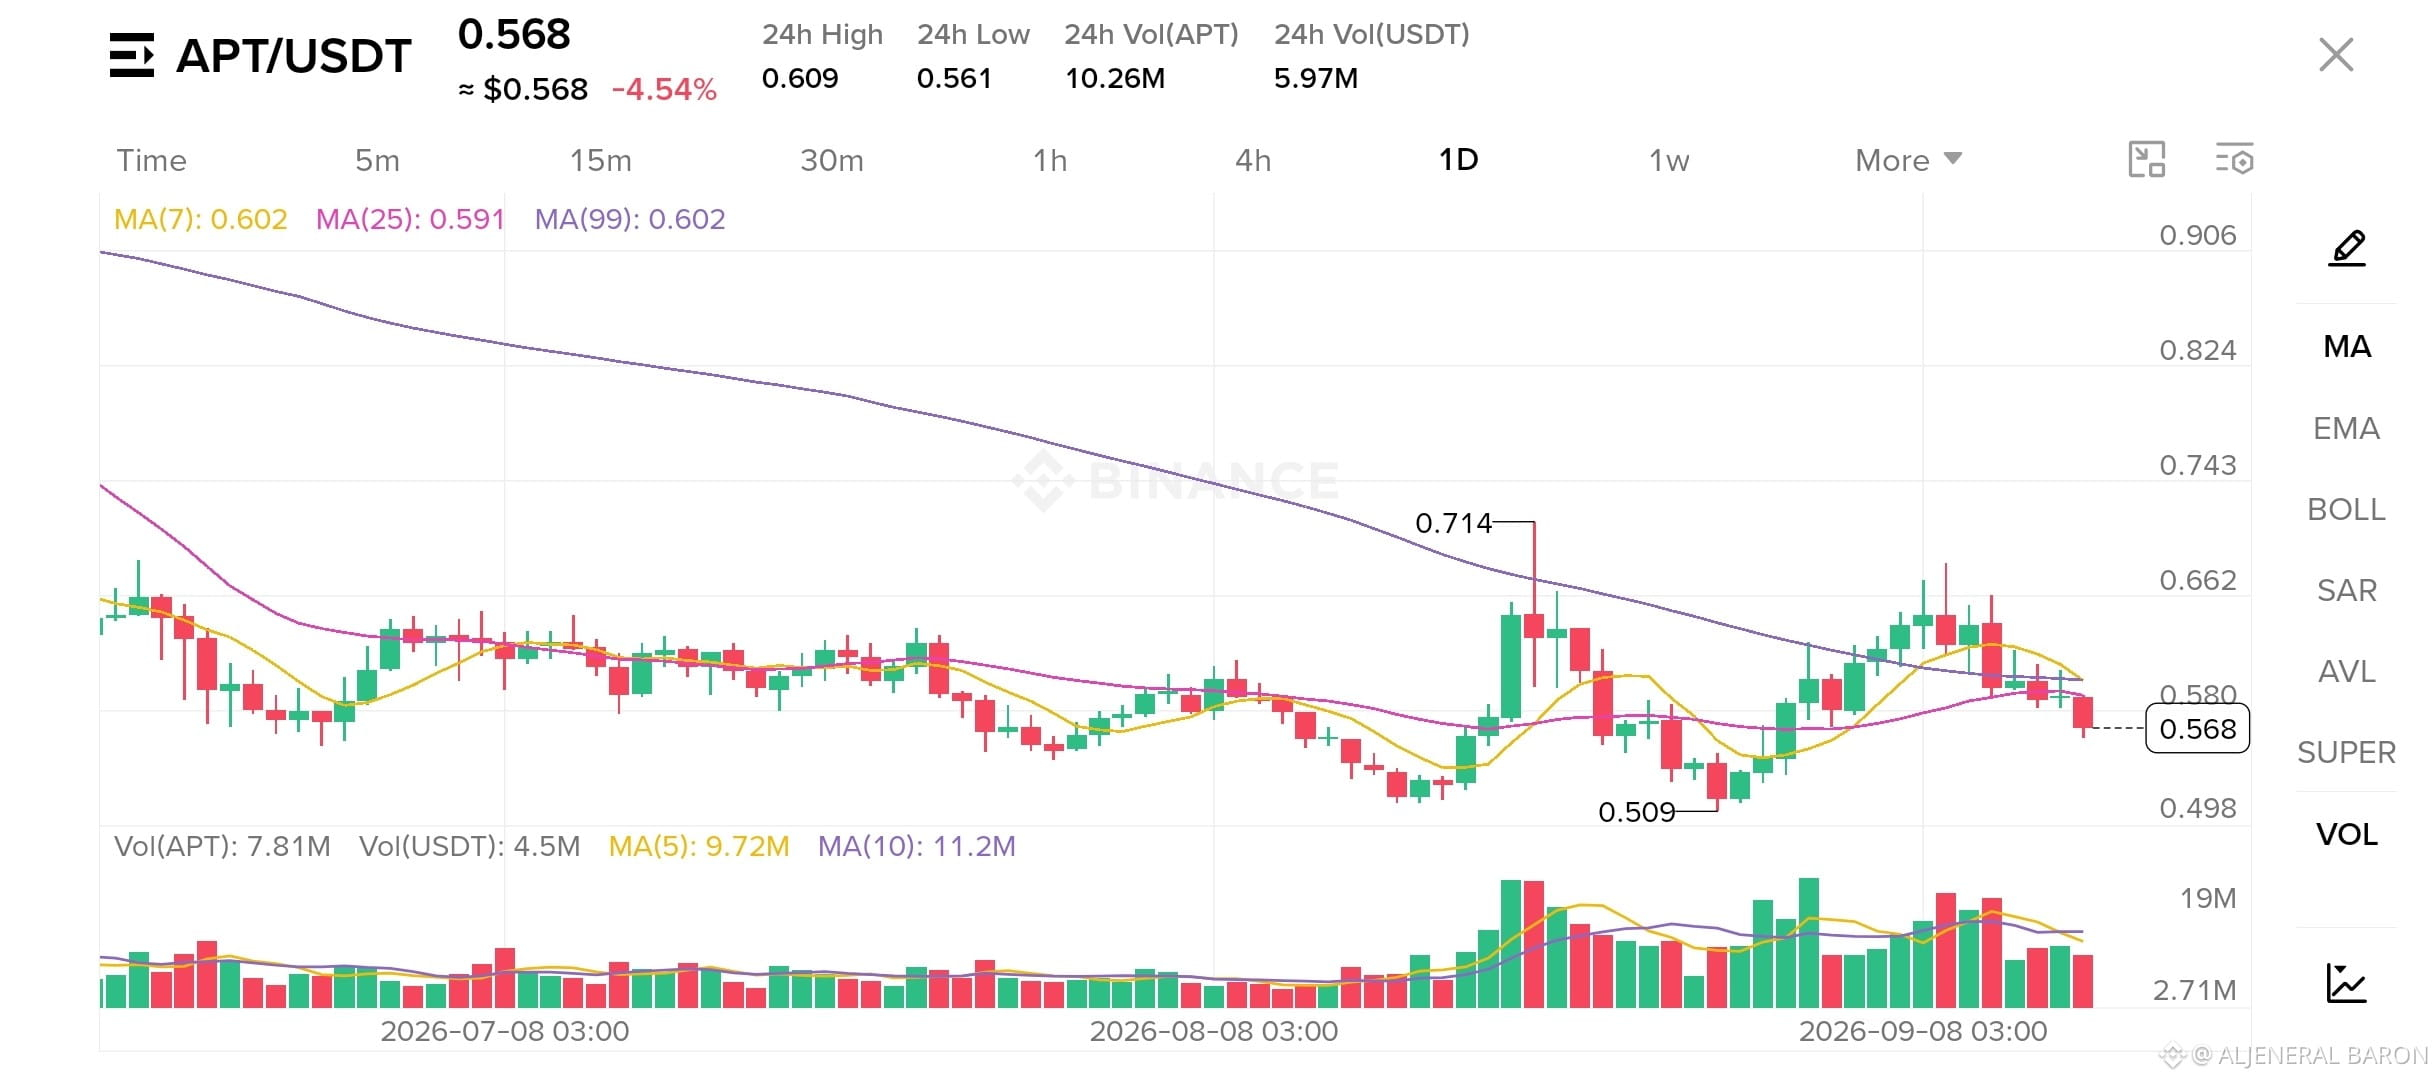
🌐 3. APT - Compression at $0.56 Support
• Current Price: $0.568 (-4.54%)
• Resistance: $0.591 (MA25) - $0.602 (MA7/MA99) | Key Floor: $0.509
• Technical Setup: APT is consolidating after pulling back from its $0.714 local peak. Price action is coiling near the MA(25) and MA(99) cluster. Holding the $0.561 local support zone sets up a clean foundation for a relief bounce.
👇 Which Layer-1 ecosystem looks strongest for the next leg up?
#Solana #SUI #Aptos #Layer1 #BinanceSquare
🔥 L1 TITANS SHOWDOWN: Key Support Retests Across Layer-1 Leaders
Top Layer-1 networks ($SOL , $SUI , $APT ) are experiencing short-term pullbacks toward critical daily moving averages. Here is a direct breakdown of the key technical levels and market structures:
⚡ 1. SOL- Testing the $98 Support Level
• Current Price: $98.92 (-3.76%)
• Resistance: $100.74 (MA7) - $110.60 | Primary Support: $92.44 - $98.00
• Technical Setup: SOL slipped slightly below the $100 psychological level and its MA(25) at $101.56. Buyers are defending the 24h low near $98.02. Reclaiming $100.74 (MA7) is essential for bulls to resume momentum toward the $110 peak.
🚀 2. SUI- Holding Near Macro Baseline
• Current Price: $0.7005 (-4.15%)
• Resistance: $0.7248 (MA7) - $0.7605 (MA25) | Base Support: $0.6873 - $0.6354
• Technical Setup: SUI is retesting its critical MA(99) trendline at $0.7300. Lower volume on this pullback indicates selling pressure is weakening. A solid daily close above $0.7000 keeps the setup primed for a potential rebound toward $0.7600.
🌐 3. APT - Compression at $0.56 Support
• Current Price: $0.568 (-4.54%)
• Resistance: $0.591 (MA25) - $0.602 (MA7/MA99) | Key Floor: $0.509
• Technical Setup: APT is consolidating after pulling back from its $0.714 local peak. Price action is coiling near the MA(25) and MA(99) cluster. Holding the $0.561 local support zone sets up a clean foundation for a relief bounce.
👇 Which Layer-1 ecosystem looks strongest for the next leg up?
#Solana #SUI #Aptos #Layer1 #BinanceSquare
Top Layer-1 networks ($SOL , $SUI , $APT ) are experiencing short-term pullbacks toward critical daily moving averages. Here is a direct breakdown of the key technical levels and market structures:
⚡ 1. SOL- Testing the $98 Support Level
• Current Price: $98.92 (-3.76%)
• Resistance: $100.74 (MA7) - $110.60 | Primary Support: $92.44 - $98.00
• Technical Setup: SOL slipped slightly below the $100 psychological level and its MA(25) at $101.56. Buyers are defending the 24h low near $98.02. Reclaiming $100.74 (MA7) is essential for bulls to resume momentum toward the $110 peak.
🚀 2. SUI- Holding Near Macro Baseline
• Current Price: $0.7005 (-4.15%)
• Resistance: $0.7248 (MA7) - $0.7605 (MA25) | Base Support: $0.6873 - $0.6354
• Technical Setup: SUI is retesting its critical MA(99) trendline at $0.7300. Lower volume on this pullback indicates selling pressure is weakening. A solid daily close above $0.7000 keeps the setup primed for a potential rebound toward $0.7600.
🌐 3. APT - Compression at $0.56 Support
• Current Price: $0.568 (-4.54%)
• Resistance: $0.591 (MA25) - $0.602 (MA7/MA99) | Key Floor: $0.509
• Technical Setup: APT is consolidating after pulling back from its $0.714 local peak. Price action is coiling near the MA(25) and MA(99) cluster. Holding the $0.561 local support zone sets up a clean foundation for a relief bounce.
👇 Which Layer-1 ecosystem looks strongest for the next leg up?
#Solana #SUI #Aptos #Layer1 #BinanceSquare
1
1
506

·
--
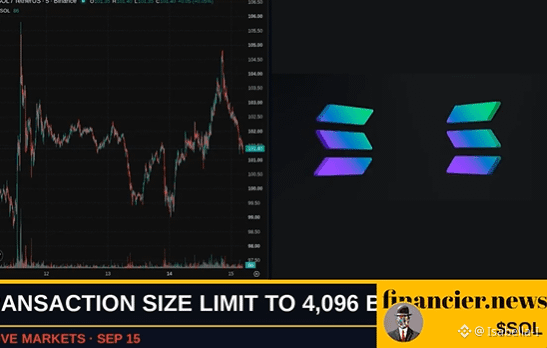
#solanatransactionv1goesliveonmainnet 📈
Solana Raises Transaction
Size Limit 3x To 4,096 Bytes
Solana's Transaction V1 lifts the per-transaction cap to 4,096 bytes from 1,232, letting developers pack multi-step trades, wallet approvals and privacy proofs into one transaction
.
SOL
$SOL #solana #Layer1 #DigitalAssets $PONS $BR
#solanatransactionv1goesliveonmainnet 📈
Solana Raises Transaction
Size Limit 3x To 4,096 Bytes
Solana's Transaction V1 lifts the per-transaction cap to 4,096 bytes from 1,232, letting developers pack multi-step trades, wallet approvals and privacy proofs into one transaction
.
SOL
$SOL #solana #Layer1 #DigitalAssets $PONS $BR
Solana Raises Transaction
Size Limit 3x To 4,096 Bytes
Solana's Transaction V1 lifts the per-transaction cap to 4,096 bytes from 1,232, letting developers pack multi-step trades, wallet approvals and privacy proofs into one transaction
.
SOL
$SOL #solana #Layer1 #DigitalAssets $PONS $BR
16
⚠️ LAYER-1 ALERT: Bull Trap or Golden Entry Ahead?
The Layer-1 giants ($SOL , $AVAX , $SUI ) are all testing critical support zones after their recent expansion moves. Is the market setting up a bull trap, or are we looking at prime discount levels?
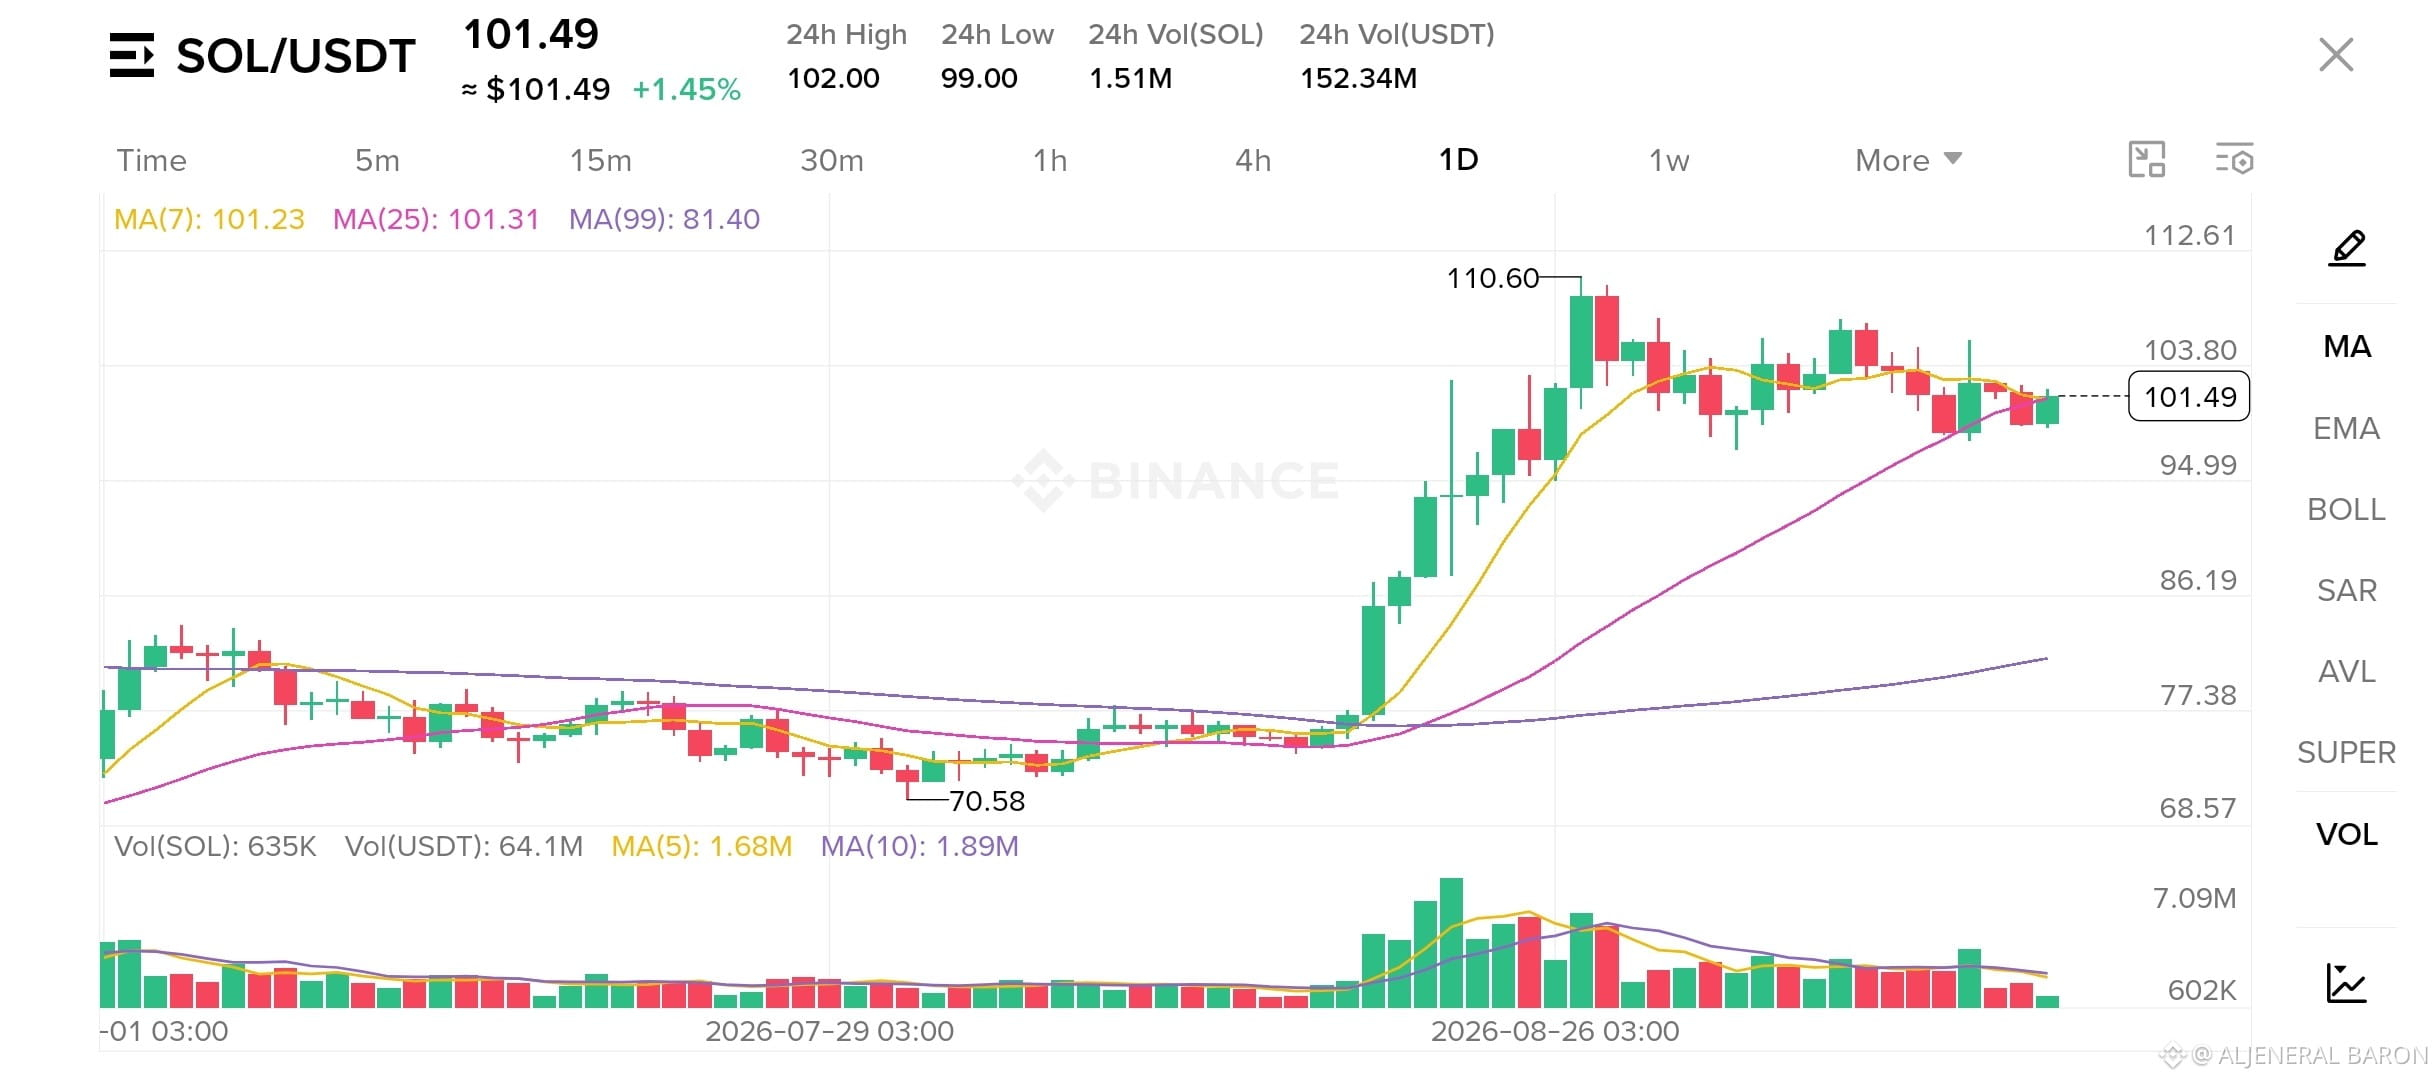
⚠️ 1. SOL - Holding $100 Barrier
• Price: $101.49 (+1.45%)
• Crucial Levels: Resistance at $110.60 | Major Support at $94.99 - $100.00
• The Verdict: SOL is consolidating horizontally above its MA(25) at $101.31 after getting rejected near $110.60. Holding above $100 is key; losing it could test lower liquidity down toward MA(99) at $81.40.
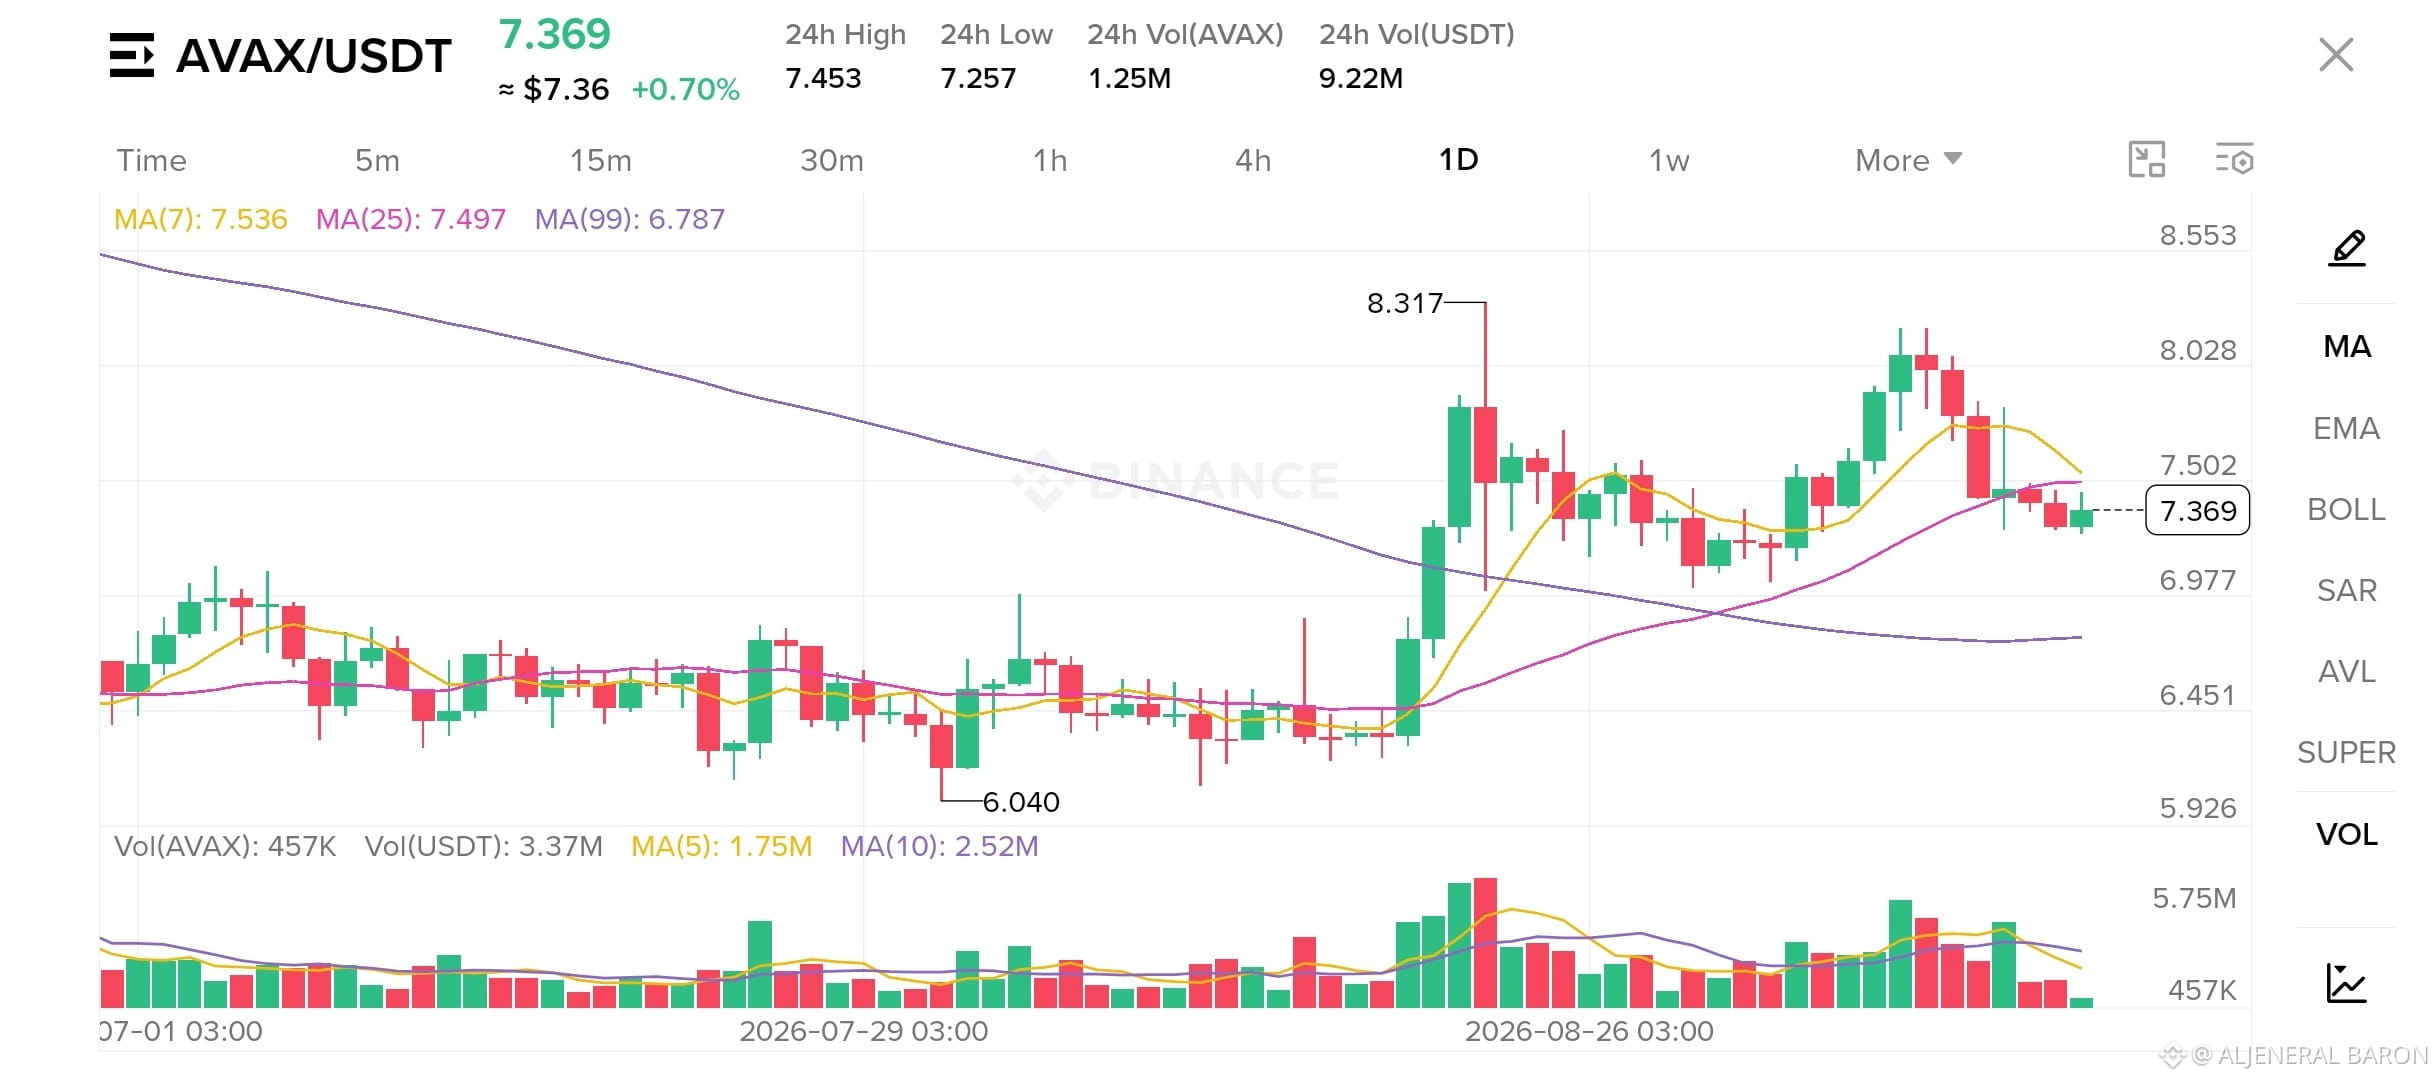
⚠️ 2. AVAX - Cool-Off After Surge
• Price: $7.369 (+0.70%)
• Crucial Levels: Local High at $8.317 | Support Zone at $6.78 - $7.00
• The Verdict: AVAX spiked to $8.317 but quickly lost momentum, pulling back below the MA(7) and MA(25) lines ($7.50). Watch the $6.78 support (MA99) closely—a failure to bounce here invalidates the short-term bullish structure.
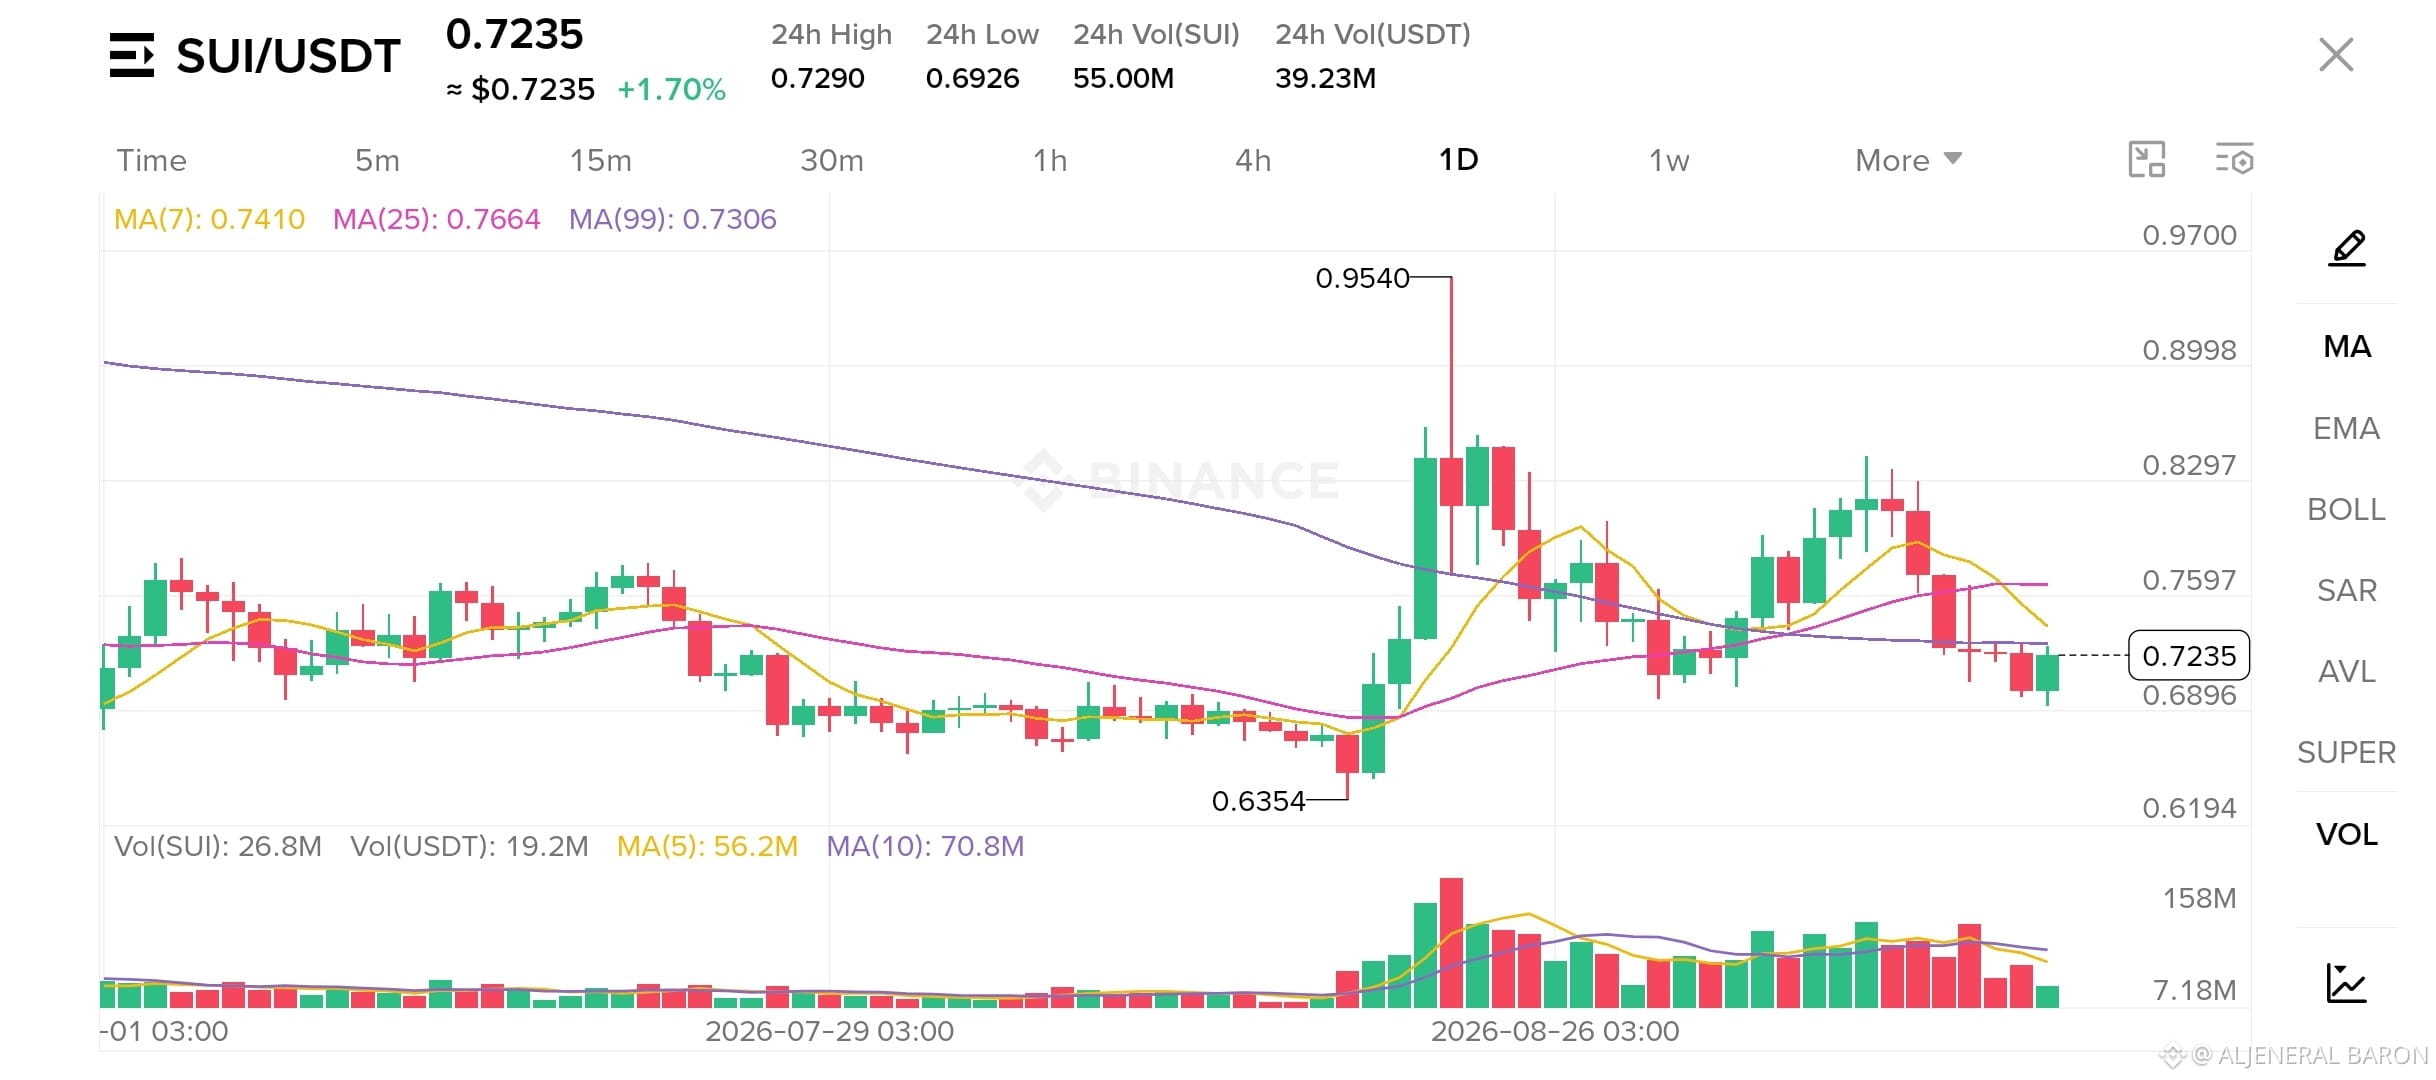
⚠️ 3. SUI - Compression at $0.72
• Price: $0.7235 (+1.70%)
• Crucial Levels: Peak at $0.9540 | Key Support at $0.6896
• The Verdict: SUI is hugging its MA(99) line ($0.7306). Volume has dropped significantly compared to the $0.95 rally. If buyers defend $0.6896, a relief bounce is likely, but breaking down opens the path to $0.6354.
🔥 UNPOPULAR OPINION: One of these three will outperform the rest by 30%+ in the next move.
👇 Which L1 token are you betting on right now?
#Solana #AVAX #SUI #Layer1 #BinanceSquare
⚠️ LAYER-1 ALERT: Bull Trap or Golden Entry Ahead?
The Layer-1 giants ($SOL , $AVAX , $SUI ) are all testing critical support zones after their recent expansion moves. Is the market setting up a bull trap, or are we looking at prime discount levels?
⚠️ 1. SOL - Holding $100 Barrier
• Price: $101.49 (+1.45%)
• Crucial Levels: Resistance at $110.60 | Major Support at $94.99 - $100.00
• The Verdict: SOL is consolidating horizontally above its MA(25) at $101.31 after getting rejected near $110.60. Holding above $100 is key; losing it could test lower liquidity down toward MA(99) at $81.40.
⚠️ 2. AVAX - Cool-Off After Surge
• Price: $7.369 (+0.70%)
• Crucial Levels: Local High at $8.317 | Support Zone at $6.78 - $7.00
• The Verdict: AVAX spiked to $8.317 but quickly lost momentum, pulling back below the MA(7) and MA(25) lines ($7.50). Watch the $6.78 support (MA99) closely—a failure to bounce here invalidates the short-term bullish structure.
⚠️ 3. SUI - Compression at $0.72
• Price: $0.7235 (+1.70%)
• Crucial Levels: Peak at $0.9540 | Key Support at $0.6896
• The Verdict: SUI is hugging its MA(99) line ($0.7306). Volume has dropped significantly compared to the $0.95 rally. If buyers defend $0.6896, a relief bounce is likely, but breaking down opens the path to $0.6354.
🔥 UNPOPULAR OPINION: One of these three will outperform the rest by 30%+ in the next move.
👇 Which L1 token are you betting on right now?
#Solana #AVAX #SUI #Layer1 #BinanceSquare
The Layer-1 giants ($SOL , $AVAX , $SUI ) are all testing critical support zones after their recent expansion moves. Is the market setting up a bull trap, or are we looking at prime discount levels?
⚠️ 1. SOL - Holding $100 Barrier
• Price: $101.49 (+1.45%)
• Crucial Levels: Resistance at $110.60 | Major Support at $94.99 - $100.00
• The Verdict: SOL is consolidating horizontally above its MA(25) at $101.31 after getting rejected near $110.60. Holding above $100 is key; losing it could test lower liquidity down toward MA(99) at $81.40.
⚠️ 2. AVAX - Cool-Off After Surge
• Price: $7.369 (+0.70%)
• Crucial Levels: Local High at $8.317 | Support Zone at $6.78 - $7.00
• The Verdict: AVAX spiked to $8.317 but quickly lost momentum, pulling back below the MA(7) and MA(25) lines ($7.50). Watch the $6.78 support (MA99) closely—a failure to bounce here invalidates the short-term bullish structure.
⚠️ 3. SUI - Compression at $0.72
• Price: $0.7235 (+1.70%)
• Crucial Levels: Peak at $0.9540 | Key Support at $0.6896
• The Verdict: SUI is hugging its MA(99) line ($0.7306). Volume has dropped significantly compared to the $0.95 rally. If buyers defend $0.6896, a relief bounce is likely, but breaking down opens the path to $0.6354.
🔥 UNPOPULAR OPINION: One of these three will outperform the rest by 30%+ in the next move.
👇 Which L1 token are you betting on right now?
#Solana #AVAX #SUI #Layer1 #BinanceSquare
1
1
908

·
--
🚀 NEAR Protocol just pumped 9.14% — and the technical structure says there's more gas in the tank.
📊 The Setup:
Price: $2.543 | RSI(4H): 62.3 | RSI(Daily): 68.2
MACD bullish on both timeframes with expanding histograms.
SMA7 > SMA25 on 4H and daily — clean trend alignment.
Price well above SMA99 ($1.93) — structural bull market for NEAR.
🎯 Trade Plan (LONG):
Entry: $2.507 – $2.579
Stop Loss: $2.397 (below 4H SMA25)
TP1: $2.645 | TP2: $2.746 | TP3: $2.848
Why This Trade?
Daily RSI at 68 has room before overbought territory. MACD histogram expansion on daily (+0.033) shows accelerating momentum. The slight volume dip (0.67x) during a rally is actually bullish — it means sellers aren't showing up.
NEAR has been quietly building a strong chart. When L1 narratives rotate back, this could be a prime beneficiary.
Key invalidation: A break below $2.40 means the short-term trend is broken.
💭 NEAR breaking $3 before month end — too bullish or just right? 👇
#NEAR #Layer1 #DYOR
⚠️ Not financial advice. Always DYOR and manage risk carefully.
🚀 NEAR Protocol just pumped 9.14% — and the technical structure says there's more gas in the tank.
📊 The Setup:
Price: $2.543 | RSI(4H): 62.3 | RSI(Daily): 68.2
MACD bullish on both timeframes with expanding histograms.
SMA7 > SMA25 on 4H and daily — clean trend alignment.
Price well above SMA99 ($1.93) — structural bull market for NEAR.
🎯 Trade Plan (LONG):
Entry: $2.507 – $2.579
Stop Loss: $2.397 (below 4H SMA25)
TP1: $2.645 | TP2: $2.746 | TP3: $2.848
Why This Trade?
Daily RSI at 68 has room before overbought territory. MACD histogram expansion on daily (+0.033) shows accelerating momentum. The slight volume dip (0.67x) during a rally is actually bullish — it means sellers aren't showing up.
NEAR has been quietly building a strong chart. When L1 narratives rotate back, this could be a prime beneficiary.
Key invalidation: A break below $2.40 means the short-term trend is broken.
💭 NEAR breaking $3 before month end — too bullish or just right? 👇
#NEAR #Layer1 #DYOR
⚠️ Not financial advice. Always DYOR and manage risk carefully.
📊 The Setup:
Price: $2.543 | RSI(4H): 62.3 | RSI(Daily): 68.2
MACD bullish on both timeframes with expanding histograms.
SMA7 > SMA25 on 4H and daily — clean trend alignment.
Price well above SMA99 ($1.93) — structural bull market for NEAR.
🎯 Trade Plan (LONG):
Entry: $2.507 – $2.579
Stop Loss: $2.397 (below 4H SMA25)
TP1: $2.645 | TP2: $2.746 | TP3: $2.848
Why This Trade?
Daily RSI at 68 has room before overbought territory. MACD histogram expansion on daily (+0.033) shows accelerating momentum. The slight volume dip (0.67x) during a rally is actually bullish — it means sellers aren't showing up.
NEAR has been quietly building a strong chart. When L1 narratives rotate back, this could be a prime beneficiary.
Key invalidation: A break below $2.40 means the short-term trend is broken.
💭 NEAR breaking $3 before month end — too bullish or just right? 👇
#NEAR #Layer1 #DYOR
⚠️ Not financial advice. Always DYOR and manage risk carefully.
25

·
--
Settlement Finality Is What Institutions Actually Care About
Everyone debates Layer 1s on throughput. TPS charts, gas fees, blob capacity. These matter for users but they are not what institutional players are actually evaluating.
When a bank or a fund chooses which chain to build on, the first question is not how fast — it is when is a transaction truly final.
Economic finality — the point where reverting a transaction costs more than accepting it — is the real institutional moat. $ETH achieves this through staking depth: billions in economic security backing the chain, making reorganization economically irrational. $SOL Alpenglow targets 400ms confirmation, compressing the window between proposal and practical finality to near-instant. $BNB combines validator slashing with fast finality for a hybrid model.
The chains that win institutional flow will not be the fastest. They will be the ones where finality is provable, reversal cost exceeds transaction value, and the security budget scales with adoption. That is the trinity institutional architects are checking — even if they never post about it.
#Layer1 #SettlementFinality #EconomicSecurity #CryptoInfrastructure #InstitutionalAdoption
Settlement Finality Is What Institutions Actually Care About
Everyone debates Layer 1s on throughput. TPS charts, gas fees, blob capacity. These matter for users but they are not what institutional players are actually evaluating.
When a bank or a fund chooses which chain to build on, the first question is not how fast — it is when is a transaction truly final.
Economic finality — the point where reverting a transaction costs more than accepting it — is the real institutional moat. $ETH achieves this through staking depth: billions in economic security backing the chain, making reorganization economically irrational. $SOL Alpenglow targets 400ms confirmation, compressing the window between proposal and practical finality to near-instant. $BNB combines validator slashing with fast finality for a hybrid model.
The chains that win institutional flow will not be the fastest. They will be the ones where finality is provable, reversal cost exceeds transaction value, and the security budget scales with adoption. That is the trinity institutional architects are checking — even if they never post about it.
#Layer1 #SettlementFinality #EconomicSecurity #CryptoInfrastructure #InstitutionalAdoption
Everyone debates Layer 1s on throughput. TPS charts, gas fees, blob capacity. These matter for users but they are not what institutional players are actually evaluating.
When a bank or a fund chooses which chain to build on, the first question is not how fast — it is when is a transaction truly final.
Economic finality — the point where reverting a transaction costs more than accepting it — is the real institutional moat. $ETH achieves this through staking depth: billions in economic security backing the chain, making reorganization economically irrational. $SOL Alpenglow targets 400ms confirmation, compressing the window between proposal and practical finality to near-instant. $BNB combines validator slashing with fast finality for a hybrid model.
The chains that win institutional flow will not be the fastest. They will be the ones where finality is provable, reversal cost exceeds transaction value, and the security budget scales with adoption. That is the trinity institutional architects are checking — even if they never post about it.
#Layer1 #SettlementFinality #EconomicSecurity #CryptoInfrastructure #InstitutionalAdoption
77

·
--
$SOL Four hours of continuous selling—five consecutive bearish candles. From 101.35 all the way down to 95.72, there hasn’t been any decent rebound.
The core signal behind this leg lower is volume. In the penultimate 5th 4-hour candlestick, trading volume was 5.92 million, three times that of the previous one. Then the 4th-from-the-end candle is even more extreme—8.23 million, the largest volume single candle in the past 24 hours. Two volume-spiking candles dump a total of 6 points. This is not something retail traders can smash out.
Now it’s 96.65. After the drop, volume contracts and price goes into sideways consolidation. Over the last three 4-hour candles, volume has fallen from 3.11 million → 1.85 million → 1.87 million, shrinking to near-dead-low. What does that mean? Sellers have stepped away for the moment, but buyers also don’t dare to catch the falling price.
The chart signals are very clear: a breakdown. The 100 whole-number level used to be support, but now it’s resistance. On the 4-hour timeframe, price has fallen from 103, and there hasn’t been a single bullish candle that can stand above the open of the previous candle. The bears are controlling the pace—textbook execution.
Market sentiment is leaning toward panic. Over the last 24 hours, SOL’s total spot+perp volume is $2.27 billion—active for a coin of this size. But the funding rate is -0.0017%, meaning the shorts are effectively paying to push longs. This shows the derivatives market is one-sidedly bearish, and short crowding has already increased. In such conditions, you should actually be more cautious—when shorts are too crowded, a single rebound can squeeze many at once.
Whale activity aligns with price and volume. During the high-volume selloff phase, the mark price and index price difference is nearly zero (96.65 vs 96.71). There’s no premium and no discount; spot and derivatives are dropping in sync. That suggests it isn’t just the futures/perps side getting hit—spot is also selling. Whales are reducing positions, not just doing arbitrage.
In terms of volume-price structure, from the high at 104.81 down to 96.65, the drawdown is close to 8%. The key level at 95.72 is this round’s low, also the lowest in the past 24 hours. If this level can’t be held, the next support is likely in the 93–94 range. On the other hand, between 95.72 and 96.33, a short-term dense trading zone has already formed—essentially a minor support in front of us.
Candlestick details. The most recent 4-hour candle is a doji: open 96.91, high 96.92, low 96.33, close 96.65. The real body is extremely small, and the upper and lower wicks aren’t long. Bulls and bears are temporarily deadlocked at this spot. But in the context of a continuous selloff, a doji looks more like a continuation pattern than a reversal. To confirm a reversal, you’d want a high-volume bullish candle reclaiming above 98. We don’t have that yet.
I won’t go deep on Solana’s ecosystem here. It’s a high-performance L1 with an active ecosystem—the main battleground of the Memecoin hype. There hasn’t been any major bearish fundamental shock on-chain; this drop is mostly broader-market drag plus profit-taking after the prior run up to 104.
Nini’s plan:
Current price: 96.65. Bias is bearish in the short term. If 95.72 breaks, look directly at 93. Don’t catch. If 95.72 holds and the 4-hour candle closes back above 98, you can consider a small long with tight risk control, stop-loss at 95. I’m inclined to wait. Shorts are crowded, but until the trend actually reverses, I won’t reach for the falling knife.
If you need a tailored strategy, you can find Nini.
#$SOL #Layer1 #DeFi
$SOL Four hours of continuous selling—five consecutive bearish candles. From 101.35 all the way down to 95.72, there hasn’t been any decent rebound.
The core signal behind this leg lower is volume. In the penultimate 5th 4-hour candlestick, trading volume was 5.92 million, three times that of the previous one. Then the 4th-from-the-end candle is even more extreme—8.23 million, the largest volume single candle in the past 24 hours. Two volume-spiking candles dump a total of 6 points. This is not something retail traders can smash out.
Now it’s 96.65. After the drop, volume contracts and price goes into sideways consolidation. Over the last three 4-hour candles, volume has fallen from 3.11 million → 1.85 million → 1.87 million, shrinking to near-dead-low. What does that mean? Sellers have stepped away for the moment, but buyers also don’t dare to catch the falling price.
The chart signals are very clear: a breakdown. The 100 whole-number level used to be support, but now it’s resistance. On the 4-hour timeframe, price has fallen from 103, and there hasn’t been a single bullish candle that can stand above the open of the previous candle. The bears are controlling the pace—textbook execution.
Market sentiment is leaning toward panic. Over the last 24 hours, SOL’s total spot+perp volume is $2.27 billion—active for a coin of this size. But the funding rate is -0.0017%, meaning the shorts are effectively paying to push longs. This shows the derivatives market is one-sidedly bearish, and short crowding has already increased. In such conditions, you should actually be more cautious—when shorts are too crowded, a single rebound can squeeze many at once.
Whale activity aligns with price and volume. During the high-volume selloff phase, the mark price and index price difference is nearly zero (96.65 vs 96.71). There’s no premium and no discount; spot and derivatives are dropping in sync. That suggests it isn’t just the futures/perps side getting hit—spot is also selling. Whales are reducing positions, not just doing arbitrage.
In terms of volume-price structure, from the high at 104.81 down to 96.65, the drawdown is close to 8%. The key level at 95.72 is this round’s low, also the lowest in the past 24 hours. If this level can’t be held, the next support is likely in the 93–94 range. On the other hand, between 95.72 and 96.33, a short-term dense trading zone has already formed—essentially a minor support in front of us.
Candlestick details. The most recent 4-hour candle is a doji: open 96.91, high 96.92, low 96.33, close 96.65. The real body is extremely small, and the upper and lower wicks aren’t long. Bulls and bears are temporarily deadlocked at this spot. But in the context of a continuous selloff, a doji looks more like a continuation pattern than a reversal. To confirm a reversal, you’d want a high-volume bullish candle reclaiming above 98. We don’t have that yet.
I won’t go deep on Solana’s ecosystem here. It’s a high-performance L1 with an active ecosystem—the main battleground of the Memecoin hype. There hasn’t been any major bearish fundamental shock on-chain; this drop is mostly broader-market drag plus profit-taking after the prior run up to 104.
Nini’s plan:
Current price: 96.65. Bias is bearish in the short term. If 95.72 breaks, look directly at 93. Don’t catch. If 95.72 holds and the 4-hour candle closes back above 98, you can consider a small long with tight risk control, stop-loss at 95. I’m inclined to wait. Shorts are crowded, but until the trend actually reverses, I won’t reach for the falling knife.
If you need a tailored strategy, you can find Nini.
#$SOL #Layer1 #DeFi
The core signal behind this leg lower is volume. In the penultimate 5th 4-hour candlestick, trading volume was 5.92 million, three times that of the previous one. Then the 4th-from-the-end candle is even more extreme—8.23 million, the largest volume single candle in the past 24 hours. Two volume-spiking candles dump a total of 6 points. This is not something retail traders can smash out.
Now it’s 96.65. After the drop, volume contracts and price goes into sideways consolidation. Over the last three 4-hour candles, volume has fallen from 3.11 million → 1.85 million → 1.87 million, shrinking to near-dead-low. What does that mean? Sellers have stepped away for the moment, but buyers also don’t dare to catch the falling price.
The chart signals are very clear: a breakdown. The 100 whole-number level used to be support, but now it’s resistance. On the 4-hour timeframe, price has fallen from 103, and there hasn’t been a single bullish candle that can stand above the open of the previous candle. The bears are controlling the pace—textbook execution.
Market sentiment is leaning toward panic. Over the last 24 hours, SOL’s total spot+perp volume is $2.27 billion—active for a coin of this size. But the funding rate is -0.0017%, meaning the shorts are effectively paying to push longs. This shows the derivatives market is one-sidedly bearish, and short crowding has already increased. In such conditions, you should actually be more cautious—when shorts are too crowded, a single rebound can squeeze many at once.
Whale activity aligns with price and volume. During the high-volume selloff phase, the mark price and index price difference is nearly zero (96.65 vs 96.71). There’s no premium and no discount; spot and derivatives are dropping in sync. That suggests it isn’t just the futures/perps side getting hit—spot is also selling. Whales are reducing positions, not just doing arbitrage.
In terms of volume-price structure, from the high at 104.81 down to 96.65, the drawdown is close to 8%. The key level at 95.72 is this round’s low, also the lowest in the past 24 hours. If this level can’t be held, the next support is likely in the 93–94 range. On the other hand, between 95.72 and 96.33, a short-term dense trading zone has already formed—essentially a minor support in front of us.
Candlestick details. The most recent 4-hour candle is a doji: open 96.91, high 96.92, low 96.33, close 96.65. The real body is extremely small, and the upper and lower wicks aren’t long. Bulls and bears are temporarily deadlocked at this spot. But in the context of a continuous selloff, a doji looks more like a continuation pattern than a reversal. To confirm a reversal, you’d want a high-volume bullish candle reclaiming above 98. We don’t have that yet.
I won’t go deep on Solana’s ecosystem here. It’s a high-performance L1 with an active ecosystem—the main battleground of the Memecoin hype. There hasn’t been any major bearish fundamental shock on-chain; this drop is mostly broader-market drag plus profit-taking after the prior run up to 104.
Nini’s plan:
Current price: 96.65. Bias is bearish in the short term. If 95.72 breaks, look directly at 93. Don’t catch. If 95.72 holds and the 4-hour candle closes back above 98, you can consider a small long with tight risk control, stop-loss at 95. I’m inclined to wait. Shorts are crowded, but until the trend actually reverses, I won’t reach for the falling knife.
If you need a tailored strategy, you can find Nini.
#$SOL #Layer1 #DeFi
26

·
--
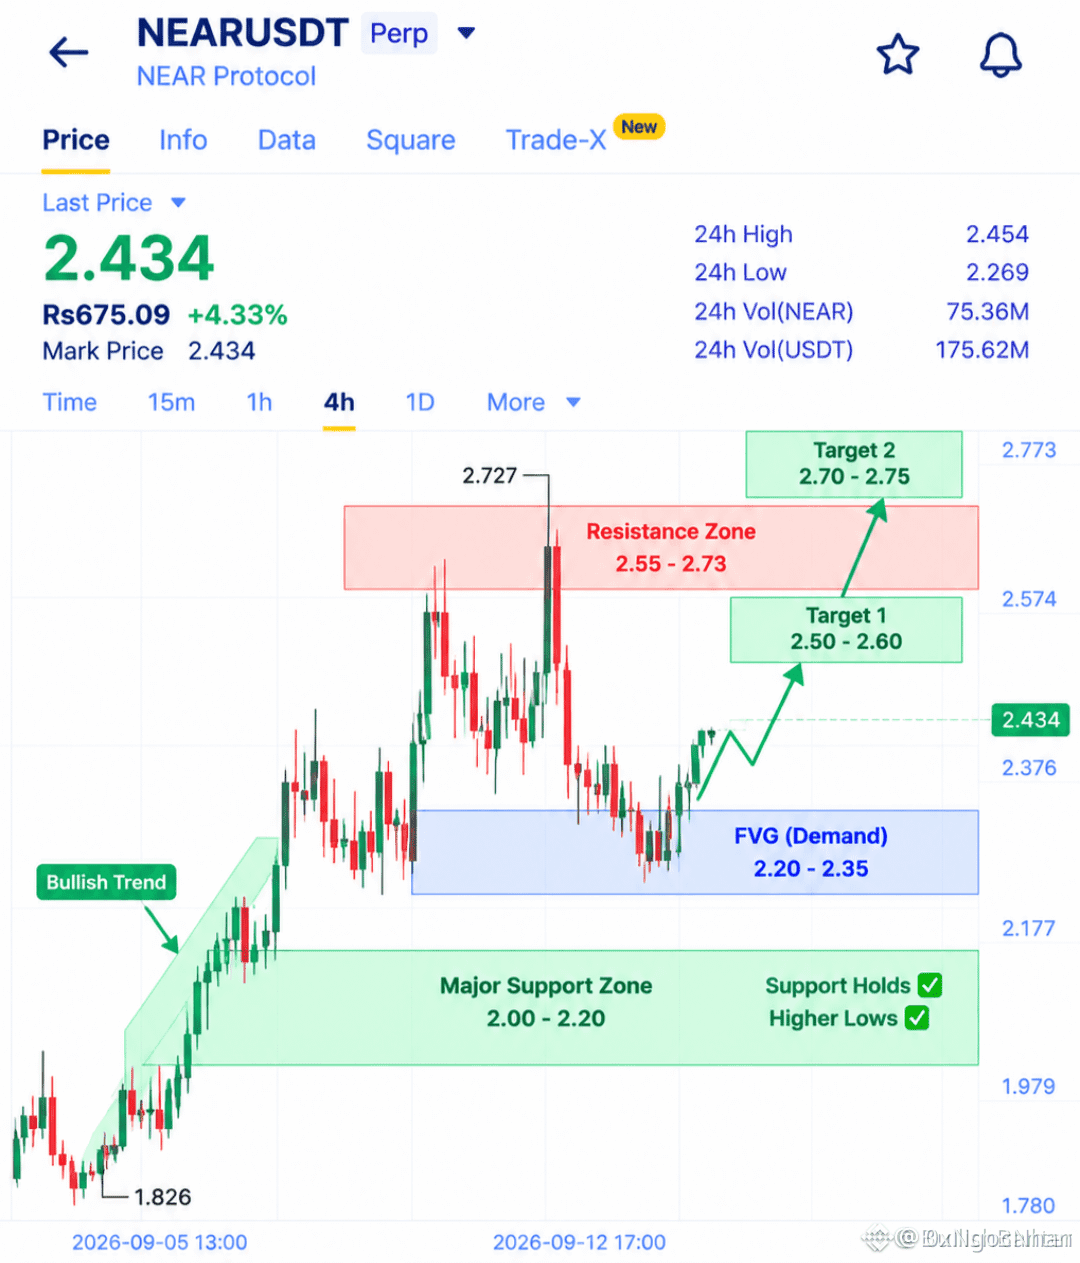
$ADA is still defending the key $0.200–$0.205 area, and that keeps the higher-low setup alive. At $0.2112, price sits above the 20D and 50D moving averages, with RSI at 54 showing room before momentum gets overheated. A clean push through $0.215 could open $0.220, then $0.230. Volume is only 0.7x the 20D average, so bulls need confirmation rather than chasing. Funding is mildly positive at 0.005%. #ADA 📈 #Crypto #Layer1
Inspired by BullishBanter on Binance Square.
$ADA is still defending the key $0.200–$0.205 area, and that keeps the higher-low setup alive. At $0.2112, price sits above the 20D and 50D moving averages, with RSI at 54 showing room before momentum gets overheated. A clean push through $0.215 could open $0.220, then $0.230. Volume is only 0.7x the 20D average, so bulls need confirmation rather than chasing. Funding is mildly positive at 0.005%. #ADA 📈 #Crypto #Layer1
Inspired by BullishBanter on Binance Square.
Inspired by BullishBanter on Binance Square.
203

·
--
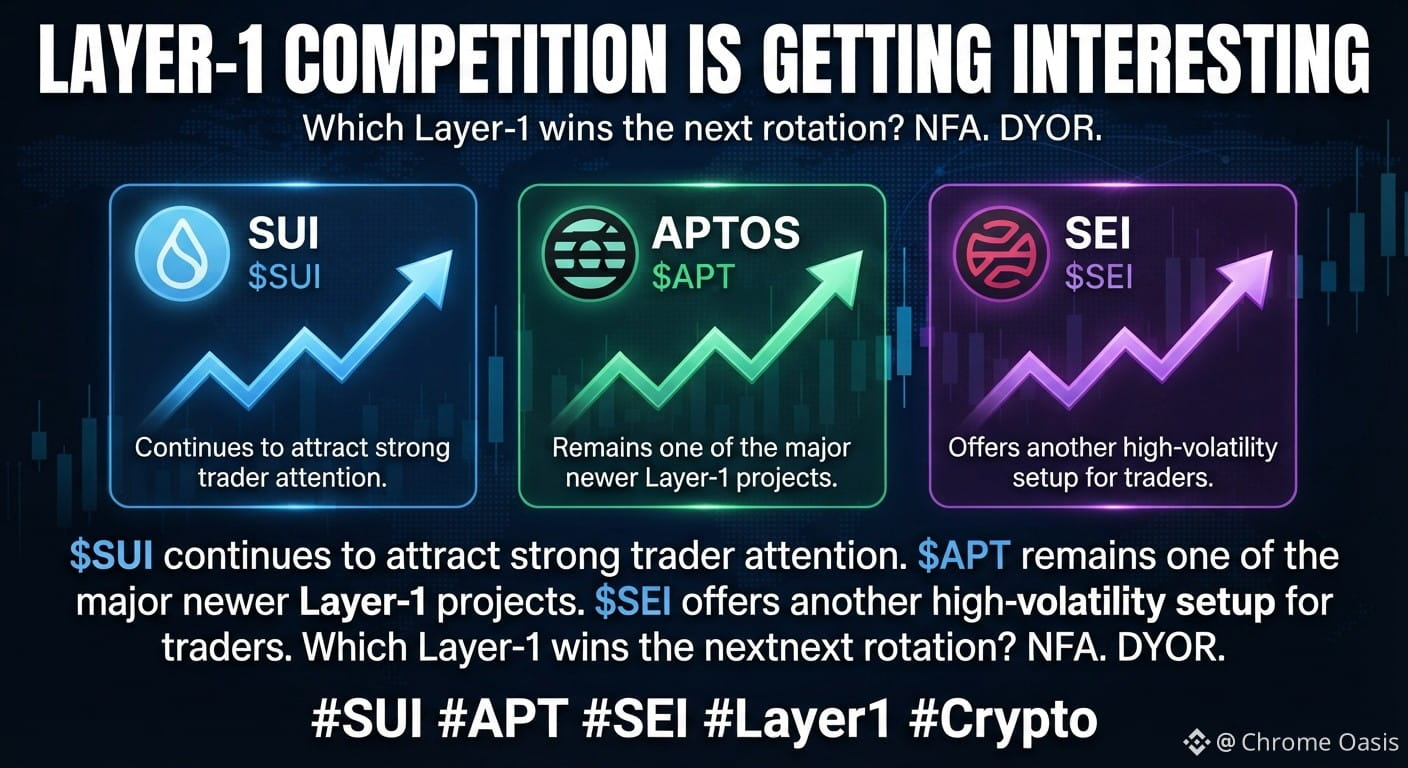
LAYER-1 COMPETITION IS GETTING INTERESTING
$SUI continues to attract strong trader attention.
$APT remains one of the major newer Layer-1 projects.
$SEI offers another high-volatility setup for traders.
Which Layer-1 wins the next rotation?
NFA. DYOR.
#SUI #APT #SEI #Layer1 #CryptoTrading
LAYER-1 COMPETITION IS GETTING INTERESTING
$SUI continues to attract strong trader attention.
$APT remains one of the major newer Layer-1 projects.
$SEI offers another high-volatility setup for traders.
Which Layer-1 wins the next rotation?
NFA. DYOR.
#SUI #APT #SEI #Layer1 #CryptoTrading
$SUI continues to attract strong trader attention.
$APT remains one of the major newer Layer-1 projects.
$SEI offers another high-volatility setup for traders.
Which Layer-1 wins the next rotation?
NFA. DYOR.
#SUI #APT #SEI #Layer1 #CryptoTrading
2
401
·
--
$SOL is being sent back again.
The 4-hour chart is very clear—pushed up to 104.81, then a long upper wick smashed back to 101.45. This isn’t the first time. A few days ago it was even more extreme: it surged from 99.43 to 105.77; the 4h candle’s single-day volume hit 11.94 million 4h K-lines, and the close was immediately slammed back to 101.55. Two attempts at topping—two times getting knocked down. The bulls aren’t lacking effort; it’s just that there really are sellers up there.
On this Solana chain, after the FTX collapse, repeated network outages, and the ecosystem nearly going to zero, it still managed to climb back up and return to the top 3 as a Layer 1. It didn’t rely on storytelling—it was because TPS can truly run, fees are truly cheap, and developers are truly using it. But strong fundamentals don’t mean the price won’t grind.
Right now, the integer level at 100 is the main battlefield of bulls vs. bears, with constant back-and-forth.
Chart signals: bearish leaning.
After being pushed back twice in the 103–105 range, the upper wicks get longer one by one. Support is around 101 for now, but each rebound is losing strength. The first push to 105 failed on expanding volume; the second attempt to 104.8 was a low-volume probe. The bulls are running out of steam.
Market sentiment: cautious and a bit cold.
The funding rate is 0.0047%, nearly zero. That suggests leveraged positions have no interest—neither side is willing to place big bets. In such a low-fee-rate environment, the market tends to trade in a choppy, grinding range; it won’t give you a comfortable, straightforward move. 24h volume is $1.75 billion. For a coin in the top ranks by market cap, that’s not very active. There are more observers than doers.
Whales: distributing (selling off).
Look at that massive-volume candle—the 4h traded 11.7 million SOL and closed with a long upper wick. This kind of move isn’t something retail can do. Someone placed a big order near 105, harvesting the bulls’ momentum in one shot. Over the next few days, price fluctuated narrowly between 100 and 103, and volume shrank to the 1–2 million level. Big funds don’t seem interested in adding more; it feels more like high-level distribution is finished, and now they’re waiting for retail to take the bag.
Volume-price structure: volume down, price flat.
In the most recent 12 4h candles, volume has dropped from 11.7 million to 1.9 million, but price has been ranging around 100–103. That’s the classic pattern of shrinking volume with price stagnating. After a structure like this, it usually breaks out with a big bullish or bearish candle to choose direction. Given the pressure from the two failed attempts on top, I lean toward a higher probability of breaking downward.
K-line details:
In the most recent 4h candle: open 102.50, high 102.83, low 101.18, close 101.45. The real body isn’t large; the lower wick is short, and the upper wick is also short. A hesitation candle. Looking ahead to the previous candles: 103.23 → 102.51 → 101.45—three consecutive bearish candles, and the overall center of gravity is shifting downward. The short-term moving averages are flattening, even slightly turning. If the next 4h candle breaks below 100.60 (the 24h low), then the 100 psychological level is likely in jeopardy.
Support levels: 99.4 and 98.9. These were tested repeatedly as bottoms over the past few days; if they break and can’t hold, then you may need to look at the “pin” bottom around 97.36.
Resistance levels: 103.88 and 104.81. No need to explain—these are the two times it got smashed.
Nini’s plan:
Current price: 101.46. I’m not in a hurry. This level isn’t “up” or “down”; chasing longs makes no sense, and chasing shorts is also not quite right. I’m waiting for two signals—either a high-volume break below 99.4, in which case I’ll take a short with a target around 98; or a solid hold above 103 with volume, and then I’ll consider going long. For now, I’m just watching. Solana’s ecosystem isn’t bad, but the price action is like this—short term, I won’t stand with the bulls.
Plans and strategy need customization—you can find Nini for that.
#$SOL #Layer1 #Solana
$SOL is being sent back again.
The 4-hour chart is very clear—pushed up to 104.81, then a long upper wick smashed back to 101.45. This isn’t the first time. A few days ago it was even more extreme: it surged from 99.43 to 105.77; the 4h candle’s single-day volume hit 11.94 million 4h K-lines, and the close was immediately slammed back to 101.55. Two attempts at topping—two times getting knocked down. The bulls aren’t lacking effort; it’s just that there really are sellers up there.
On this Solana chain, after the FTX collapse, repeated network outages, and the ecosystem nearly going to zero, it still managed to climb back up and return to the top 3 as a Layer 1. It didn’t rely on storytelling—it was because TPS can truly run, fees are truly cheap, and developers are truly using it. But strong fundamentals don’t mean the price won’t grind.
Right now, the integer level at 100 is the main battlefield of bulls vs. bears, with constant back-and-forth.
Chart signals: bearish leaning.
After being pushed back twice in the 103–105 range, the upper wicks get longer one by one. Support is around 101 for now, but each rebound is losing strength. The first push to 105 failed on expanding volume; the second attempt to 104.8 was a low-volume probe. The bulls are running out of steam.
Market sentiment: cautious and a bit cold.
The funding rate is 0.0047%, nearly zero. That suggests leveraged positions have no interest—neither side is willing to place big bets. In such a low-fee-rate environment, the market tends to trade in a choppy, grinding range; it won’t give you a comfortable, straightforward move. 24h volume is $1.75 billion. For a coin in the top ranks by market cap, that’s not very active. There are more observers than doers.
Whales: distributing (selling off).
Look at that massive-volume candle—the 4h traded 11.7 million SOL and closed with a long upper wick. This kind of move isn’t something retail can do. Someone placed a big order near 105, harvesting the bulls’ momentum in one shot. Over the next few days, price fluctuated narrowly between 100 and 103, and volume shrank to the 1–2 million level. Big funds don’t seem interested in adding more; it feels more like high-level distribution is finished, and now they’re waiting for retail to take the bag.
Volume-price structure: volume down, price flat.
In the most recent 12 4h candles, volume has dropped from 11.7 million to 1.9 million, but price has been ranging around 100–103. That’s the classic pattern of shrinking volume with price stagnating. After a structure like this, it usually breaks out with a big bullish or bearish candle to choose direction. Given the pressure from the two failed attempts on top, I lean toward a higher probability of breaking downward.
K-line details:
In the most recent 4h candle: open 102.50, high 102.83, low 101.18, close 101.45. The real body isn’t large; the lower wick is short, and the upper wick is also short. A hesitation candle. Looking ahead to the previous candles: 103.23 → 102.51 → 101.45—three consecutive bearish candles, and the overall center of gravity is shifting downward. The short-term moving averages are flattening, even slightly turning. If the next 4h candle breaks below 100.60 (the 24h low), then the 100 psychological level is likely in jeopardy.
Support levels: 99.4 and 98.9. These were tested repeatedly as bottoms over the past few days; if they break and can’t hold, then you may need to look at the “pin” bottom around 97.36.
Resistance levels: 103.88 and 104.81. No need to explain—these are the two times it got smashed.
Nini’s plan:
Current price: 101.46. I’m not in a hurry. This level isn’t “up” or “down”; chasing longs makes no sense, and chasing shorts is also not quite right. I’m waiting for two signals—either a high-volume break below 99.4, in which case I’ll take a short with a target around 98; or a solid hold above 103 with volume, and then I’ll consider going long. For now, I’m just watching. Solana’s ecosystem isn’t bad, but the price action is like this—short term, I won’t stand with the bulls.
Plans and strategy need customization—you can find Nini for that.
#$SOL #Layer1 #Solana
The 4-hour chart is very clear—pushed up to 104.81, then a long upper wick smashed back to 101.45. This isn’t the first time. A few days ago it was even more extreme: it surged from 99.43 to 105.77; the 4h candle’s single-day volume hit 11.94 million 4h K-lines, and the close was immediately slammed back to 101.55. Two attempts at topping—two times getting knocked down. The bulls aren’t lacking effort; it’s just that there really are sellers up there.
On this Solana chain, after the FTX collapse, repeated network outages, and the ecosystem nearly going to zero, it still managed to climb back up and return to the top 3 as a Layer 1. It didn’t rely on storytelling—it was because TPS can truly run, fees are truly cheap, and developers are truly using it. But strong fundamentals don’t mean the price won’t grind.
Right now, the integer level at 100 is the main battlefield of bulls vs. bears, with constant back-and-forth.
Chart signals: bearish leaning.
After being pushed back twice in the 103–105 range, the upper wicks get longer one by one. Support is around 101 for now, but each rebound is losing strength. The first push to 105 failed on expanding volume; the second attempt to 104.8 was a low-volume probe. The bulls are running out of steam.
Market sentiment: cautious and a bit cold.
The funding rate is 0.0047%, nearly zero. That suggests leveraged positions have no interest—neither side is willing to place big bets. In such a low-fee-rate environment, the market tends to trade in a choppy, grinding range; it won’t give you a comfortable, straightforward move. 24h volume is $1.75 billion. For a coin in the top ranks by market cap, that’s not very active. There are more observers than doers.
Whales: distributing (selling off).
Look at that massive-volume candle—the 4h traded 11.7 million SOL and closed with a long upper wick. This kind of move isn’t something retail can do. Someone placed a big order near 105, harvesting the bulls’ momentum in one shot. Over the next few days, price fluctuated narrowly between 100 and 103, and volume shrank to the 1–2 million level. Big funds don’t seem interested in adding more; it feels more like high-level distribution is finished, and now they’re waiting for retail to take the bag.
Volume-price structure: volume down, price flat.
In the most recent 12 4h candles, volume has dropped from 11.7 million to 1.9 million, but price has been ranging around 100–103. That’s the classic pattern of shrinking volume with price stagnating. After a structure like this, it usually breaks out with a big bullish or bearish candle to choose direction. Given the pressure from the two failed attempts on top, I lean toward a higher probability of breaking downward.
K-line details:
In the most recent 4h candle: open 102.50, high 102.83, low 101.18, close 101.45. The real body isn’t large; the lower wick is short, and the upper wick is also short. A hesitation candle. Looking ahead to the previous candles: 103.23 → 102.51 → 101.45—three consecutive bearish candles, and the overall center of gravity is shifting downward. The short-term moving averages are flattening, even slightly turning. If the next 4h candle breaks below 100.60 (the 24h low), then the 100 psychological level is likely in jeopardy.
Support levels: 99.4 and 98.9. These were tested repeatedly as bottoms over the past few days; if they break and can’t hold, then you may need to look at the “pin” bottom around 97.36.
Resistance levels: 103.88 and 104.81. No need to explain—these are the two times it got smashed.
Nini’s plan:
Current price: 101.46. I’m not in a hurry. This level isn’t “up” or “down”; chasing longs makes no sense, and chasing shorts is also not quite right. I’m waiting for two signals—either a high-volume break below 99.4, in which case I’ll take a short with a target around 98; or a solid hold above 103 with volume, and then I’ll consider going long. For now, I’m just watching. Solana’s ecosystem isn’t bad, but the price action is like this—short term, I won’t stand with the bulls.
Plans and strategy need customization—you can find Nini for that.
#$SOL #Layer1 #Solana
97

·
--
🚨 $SUI
{future}(SUIUSDT)
Just Broke the Silence — Volume Speaks Louder Than Price!
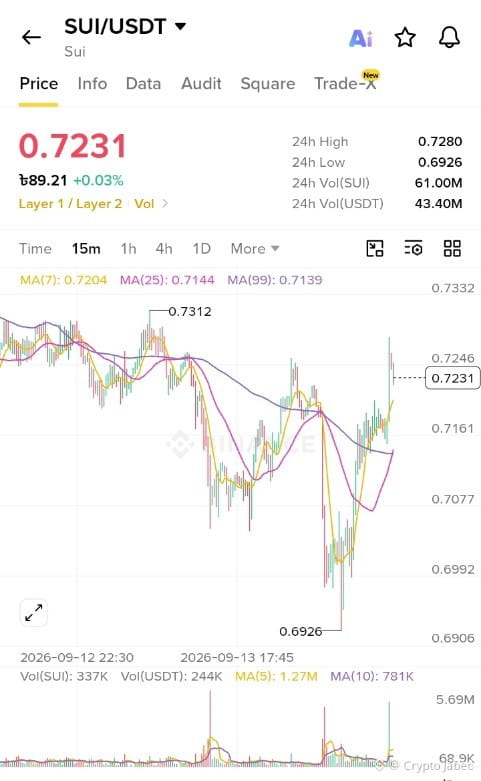
After a sharp drop to 0.6926, SUI/USDT is quietly climbing back — now sitting at 0.7231.
📊 3 Signals You Can't Ignore:
• MA(7) and MA(25) are inches away from a bullish crossover
• Volume spiked to 1.27M — big players are moving
• Price is testing the 0.7312 resistance zone
Layer 1 sentiment is shifting. The chart isn't screaming — it's whispering.
The real question: Is this the calm before the next move? 👀
#SUI #CryptoAlert #Layer1
🚨 $SUI
Just Broke the Silence — Volume Speaks Louder Than Price!
After a sharp drop to 0.6926, SUI/USDT is quietly climbing back — now sitting at 0.7231.
📊 3 Signals You Can't Ignore:
• MA(7) and MA(25) are inches away from a bullish crossover
• Volume spiked to 1.27M — big players are moving
• Price is testing the 0.7312 resistance zone
Layer 1 sentiment is shifting. The chart isn't screaming — it's whispering.
The real question: Is this the calm before the next move? 👀
#SUI #CryptoAlert #Layer1
Just Broke the Silence — Volume Speaks Louder Than Price!
After a sharp drop to 0.6926, SUI/USDT is quietly climbing back — now sitting at 0.7231.
📊 3 Signals You Can't Ignore:
• MA(7) and MA(25) are inches away from a bullish crossover
• Volume spiked to 1.27M — big players are moving
• Price is testing the 0.7312 resistance zone
Layer 1 sentiment is shifting. The chart isn't screaming — it's whispering.
The real question: Is this the calm before the next move? 👀
#SUI #CryptoAlert #Layer1
34
·
--
Can $SUI challenge the top Layer-1 networks this cycle? ⚡
Sui’s object-centric model and lightning-fast finality have attracted serious developer attention and fresh DeFi liquidity. On-chain volume has seen massive surges over recent months.
💡 Key takeaway: Fast chains fight for market share, but holding total value locked (TVL) during corrections is the true test.
Are you Bullish on $SUI or holding alternative Layer-1s? Let me know your top pick! 📊
#SuiNetwork #Layer1 #defi
Can $SUI challenge the top Layer-1 networks this cycle? ⚡
Sui’s object-centric model and lightning-fast finality have attracted serious developer attention and fresh DeFi liquidity. On-chain volume has seen massive surges over recent months.
💡 Key takeaway: Fast chains fight for market share, but holding total value locked (TVL) during corrections is the true test.
Are you Bullish on $SUI or holding alternative Layer-1s? Let me know your top pick! 📊
#SuiNetwork #Layer1 #defi
Sui’s object-centric model and lightning-fast finality have attracted serious developer attention and fresh DeFi liquidity. On-chain volume has seen massive surges over recent months.
💡 Key takeaway: Fast chains fight for market share, but holding total value locked (TVL) during corrections is the true test.
Are you Bullish on $SUI or holding alternative Layer-1s? Let me know your top pick! 📊
#SuiNetwork #Layer1 #defi
77

PORTAL & NEO: Monitoring and Layer 1/Layer 2 Intraday Momentum
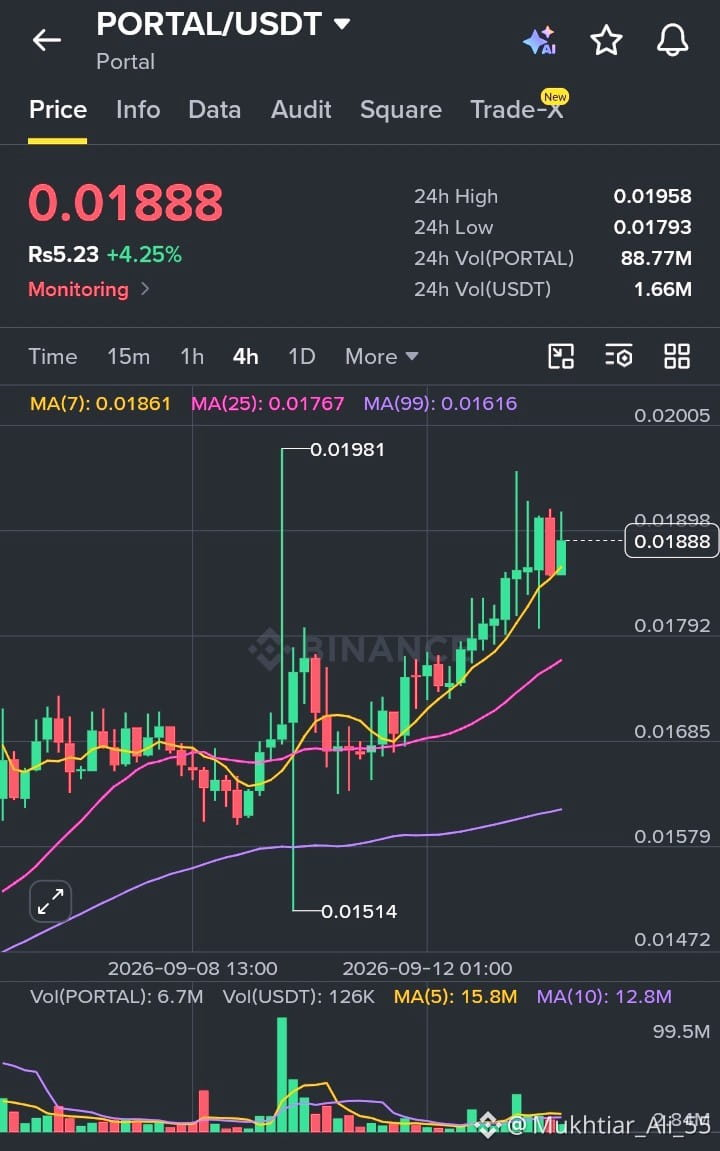
PORTAL is trading at $0.01888, up approximately +4.25% over the latest 24-hour session. The token reached a high of $0.01958 and a low of $0.01793, with around 1.66M USDT in quoted trading volume (88.77M PORTAL). This upward movement signals strong short-term participation, while the daily range highlights ongoing volatility near the current price area.
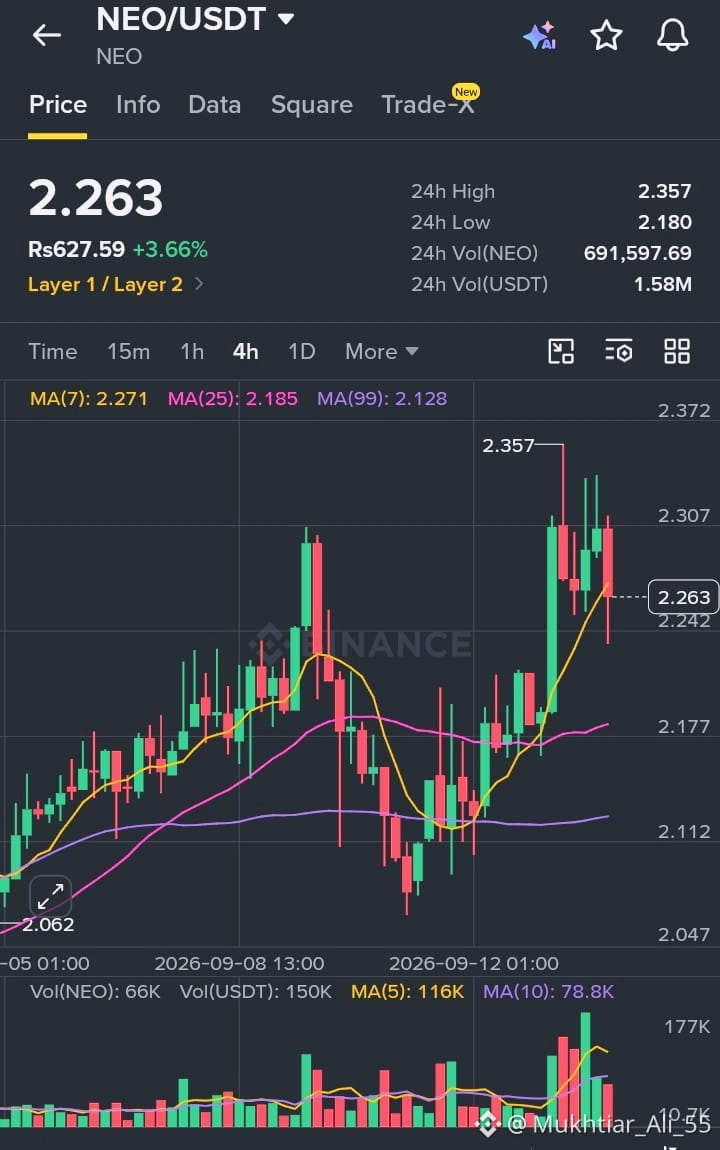
NEO is trading near $2.263, up approximately +3.66% over the latest 24 hours. The Layer 1 / Layer 2 token moved between a high of $2.357 and a low of $2.180, while quoted volume reached roughly 1.58M USDT (691,597.69 NEO). NEO’s advance stands out for its steady recovery from session lows, showing renewed interest; however, the pullback from the intraday high suggests traders are still testing whether momentum can sustain.
Across both assets, PORTAL has shown active momentum within its monitoring category, while NEO has posted a notable recovery profile in the Layer 1 / Layer 2 sector. The common theme is rising participation, but each asset remains exposed to rapid sentiment shifts and broader crypto-market conditions.
#CryptoTrading #PORTAL #NEO #Layer1 #MarketUpdate
$PORTAL
{spot}(PORTALUSDT)
$NEO
{spot}(NEOUSDT)
PORTAL & NEO: Monitoring and Layer 1/Layer 2 Intraday Momentum
PORTAL is trading at $0.01888, up approximately +4.25% over the latest 24-hour session. The token reached a high of $0.01958 and a low of $0.01793, with around 1.66M USDT in quoted trading volume (88.77M PORTAL). This upward movement signals strong short-term participation, while the daily range highlights ongoing volatility near the current price area.
NEO is trading near $2.263, up approximately +3.66% over the latest 24 hours. The Layer 1 / Layer 2 token moved between a high of $2.357 and a low of $2.180, while quoted volume reached roughly 1.58M USDT (691,597.69 NEO). NEO’s advance stands out for its steady recovery from session lows, showing renewed interest; however, the pullback from the intraday high suggests traders are still testing whether momentum can sustain.
Across both assets, PORTAL has shown active momentum within its monitoring category, while NEO has posted a notable recovery profile in the Layer 1 / Layer 2 sector. The common theme is rising participation, but each asset remains exposed to rapid sentiment shifts and broader crypto-market conditions.
#CryptoTrading #PORTAL #NEO #Layer1 #MarketUpdate
$PORTAL
$NEO
PORTAL is trading at $0.01888, up approximately +4.25% over the latest 24-hour session. The token reached a high of $0.01958 and a low of $0.01793, with around 1.66M USDT in quoted trading volume (88.77M PORTAL). This upward movement signals strong short-term participation, while the daily range highlights ongoing volatility near the current price area.
NEO is trading near $2.263, up approximately +3.66% over the latest 24 hours. The Layer 1 / Layer 2 token moved between a high of $2.357 and a low of $2.180, while quoted volume reached roughly 1.58M USDT (691,597.69 NEO). NEO’s advance stands out for its steady recovery from session lows, showing renewed interest; however, the pullback from the intraday high suggests traders are still testing whether momentum can sustain.
Across both assets, PORTAL has shown active momentum within its monitoring category, while NEO has posted a notable recovery profile in the Layer 1 / Layer 2 sector. The common theme is rising participation, but each asset remains exposed to rapid sentiment shifts and broader crypto-market conditions.
#CryptoTrading #PORTAL #NEO #Layer1 #MarketUpdate
$PORTAL
$NEO
98
·
--
NEAR at $2.34 is still above its 20D and 50D moving averages, even as it slips 0.93% today on $31.71M volume. The bigger thesis remains the Jan 2027 target: a projected $1,000 position becoming $2,166.40, or 116.64% ROI. Forecasts point to an average near $3.98 in 2026, $4.52 in 2027, and $7.43 by 2029. Near-term momentum is calmer: 4H RSI sits at 47 and volume is only 0.6x its 20D average. Longs are paying 0.010% funding, so patience matters. $NEAR #NEAR #Altcoin #Layer1 🚀📈
Inspired by syed ali ahmed on Binance Square.
NEAR at $2.34 is still above its 20D and 50D moving averages, even as it slips 0.93% today on $31.71M volume. The bigger thesis remains the Jan 2027 target: a projected $1,000 position becoming $2,166.40, or 116.64% ROI. Forecasts point to an average near $3.98 in 2026, $4.52 in 2027, and $7.43 by 2029. Near-term momentum is calmer: 4H RSI sits at 47 and volume is only 0.6x its 20D average. Longs are paying 0.010% funding, so patience matters. $NEAR #NEAR #Altcoin #Layer1 🚀📈
Inspired by syed ali ahmed on Binance Square.
Inspired by syed ali ahmed on Binance Square.

111
Log in to explore more content
Join global crypto users on Binance Square
⚡️ Get latest and useful information about crypto.
💬 Trusted by the world’s largest crypto exchange.
👍 Discover real insights from verified creators.
Email / Phone number
Trending Topics
1
#FedRateWatch
1.1M views
5,184 Discussing
2
#ZcashRises6%
194 views
10 Discussing
3
#XRPSinks10%
14 views
6 Discussing
4
#CircleOpensArcMainnet
0 views
2 Discussing
5
#ZcashHoldersBackNU7Upgrade
6,054 views
176 Discussing
6
#MSTRTradingVolumeSurpassesMorganStanley
10,902 views
372 Discussing
7
#BitcoinFalls4%
25,707 views
626 Discussing
8
#SKHynixInTalksToMakeMemoryChipsInUS
12,130 views
273 Discussing
9
#OpenAIDiscussesNewFundingAt$1.2TValuation
2,659 views
46 Discussing
10
#ArgentinaCommitsToOECDCryptoReportingBy2029
20,294 views
425 Discussing