

#sei
sei
8.3M views
13,920 Discussing
Hot
Latest

Dear Binancian, here #CoinVahini presents $SEI Market Metrics & Valuation👇
Sei is currently positioned at rank No. 89 globally, backed by a market capitalization of $370.97 million and a fully diluted market cap of $481.8 million.
Watch now price then continue...
{spot}(SEIUSDT)
Can you find if a partial accumulation zone is going on, on the chart?
Okay.. we need to go a little deeper!
💡Circulating supply stands at 7.7 billion SEI against a total and maximum supply of 10 billion SEI, leaving roughly 2.3 billion tokens subject to future dilution or unlock schedules.
💡Daily trading volume reached $32.95 million, yielding a volume-to-market cap ratio of 8.88%, indicating moderate liquidity relative to its valuation.
💡The asset touched an all-time high of $1.1417 on March 16, 2024, and an all-time low of $0.00799 on August 15, 2023.
For crypto traders and active investors, monitoring unlock cliffs and volume-to-market cap ratios remains vital for assessing structural risk in Layer 1 assets. Notable events and facts to be updated here. keep a touch with me to get those details 😊
#Sei #Layer1 #TokenLearning #Tokenomics
Dear Binancian, here #CoinVahini presents $SEI Market Metrics & Valuation👇
Sei is currently positioned at rank No. 89 globally, backed by a market capitalization of $370.97 million and a fully diluted market cap of $481.8 million.
Watch now price then continue...
Can you find if a partial accumulation zone is going on, on the chart?
Okay.. we need to go a little deeper!
💡Circulating supply stands at 7.7 billion SEI against a total and maximum supply of 10 billion SEI, leaving roughly 2.3 billion tokens subject to future dilution or unlock schedules.
💡Daily trading volume reached $32.95 million, yielding a volume-to-market cap ratio of 8.88%, indicating moderate liquidity relative to its valuation.
💡The asset touched an all-time high of $1.1417 on March 16, 2024, and an all-time low of $0.00799 on August 15, 2023.
For crypto traders and active investors, monitoring unlock cliffs and volume-to-market cap ratios remains vital for assessing structural risk in Layer 1 assets. Notable events and facts to be updated here. keep a touch with me to get those details 😊
#Sei #Layer1 #TokenLearning #Tokenomics
13


$SEI: SEI: How Liquidity Shapes a Simple Upward Move
When a chart shows an hourly up direction while volume sits above baseline, the first question is not just "is price rising?" but "what does the market depth allow?" Liquidity, the ease of turning a token into cash without moving the price dramatically, acts like water flowing through a pipe. A wide pipe (high liquidity) lets a large amount of water pass with little change in pressure, while a narrow pipe (low liquidity) creates a splash that quickly raises the water level.
In practical terms, the observed rise in $SEI suggests buyers are finding enough sell orders close to the current price to fill their demand. If the order book were thin, even a modest purchase would push the price far above the recent range, creating a spike that often reverses quickly. The relative volume metric 6.05638 hints at how much trading activity is occurring compared to a typical period, while the quote volume 508761 shows the total dollar flow. Together they give a sense of how deep the market is.
To reassess the move, compare the price change 0.188877 with the spread between the best bid and ask. A narrow spread alongside rising volume supports the view that liquidity is healthy and the up trend may sustain. Conversely, a widening spread would signal that the price rise is being driven by a few aggressive orders, raising the risk of a short‑term reversal.
Think of it as testing a bridge: many small cars crossing smoothly indicate a sturdy structure, while a single heavy truck causing the deck to shake suggests a weakness. Applying this analogy helps separate a genuine liquidity‑backed move from a temporary price distortion.
Probabilistic market research, not a recommendation or guaranteed return.
Which crypto concept becomes clearer when you look at an actual chart?
#SEI #CryptoEducation #CryptoLearning
$SEI : SEI: How Liquidity Shapes a Simple Upward Move
When a chart shows an hourly up direction while volume sits above baseline, the first question is not just "is price rising?" but "what does the market depth allow?" Liquidity, the ease of turning a token into cash without moving the price dramatically, acts like water flowing through a pipe. A wide pipe (high liquidity) lets a large amount of water pass with little change in pressure, while a narrow pipe (low liquidity) creates a splash that quickly raises the water level.
In practical terms, the observed rise in $SEI suggests buyers are finding enough sell orders close to the current price to fill their demand. If the order book were thin, even a modest purchase would push the price far above the recent range, creating a spike that often reverses quickly. The relative volume metric 6.05638 hints at how much trading activity is occurring compared to a typical period, while the quote volume 508761 shows the total dollar flow. Together they give a sense of how deep the market is.
To reassess the move, compare the price change 0.188877 with the spread between the best bid and ask. A narrow spread alongside rising volume supports the view that liquidity is healthy and the up trend may sustain. Conversely, a widening spread would signal that the price rise is being driven by a few aggressive orders, raising the risk of a short‑term reversal.
Think of it as testing a bridge: many small cars crossing smoothly indicate a sturdy structure, while a single heavy truck causing the deck to shake suggests a weakness. Applying this analogy helps separate a genuine liquidity‑backed move from a temporary price distortion.
Probabilistic market research, not a recommendation or guaranteed return.
Which crypto concept becomes clearer when you look at an actual chart?
#SEI #CryptoEducation #CryptoLearning
49

·
--
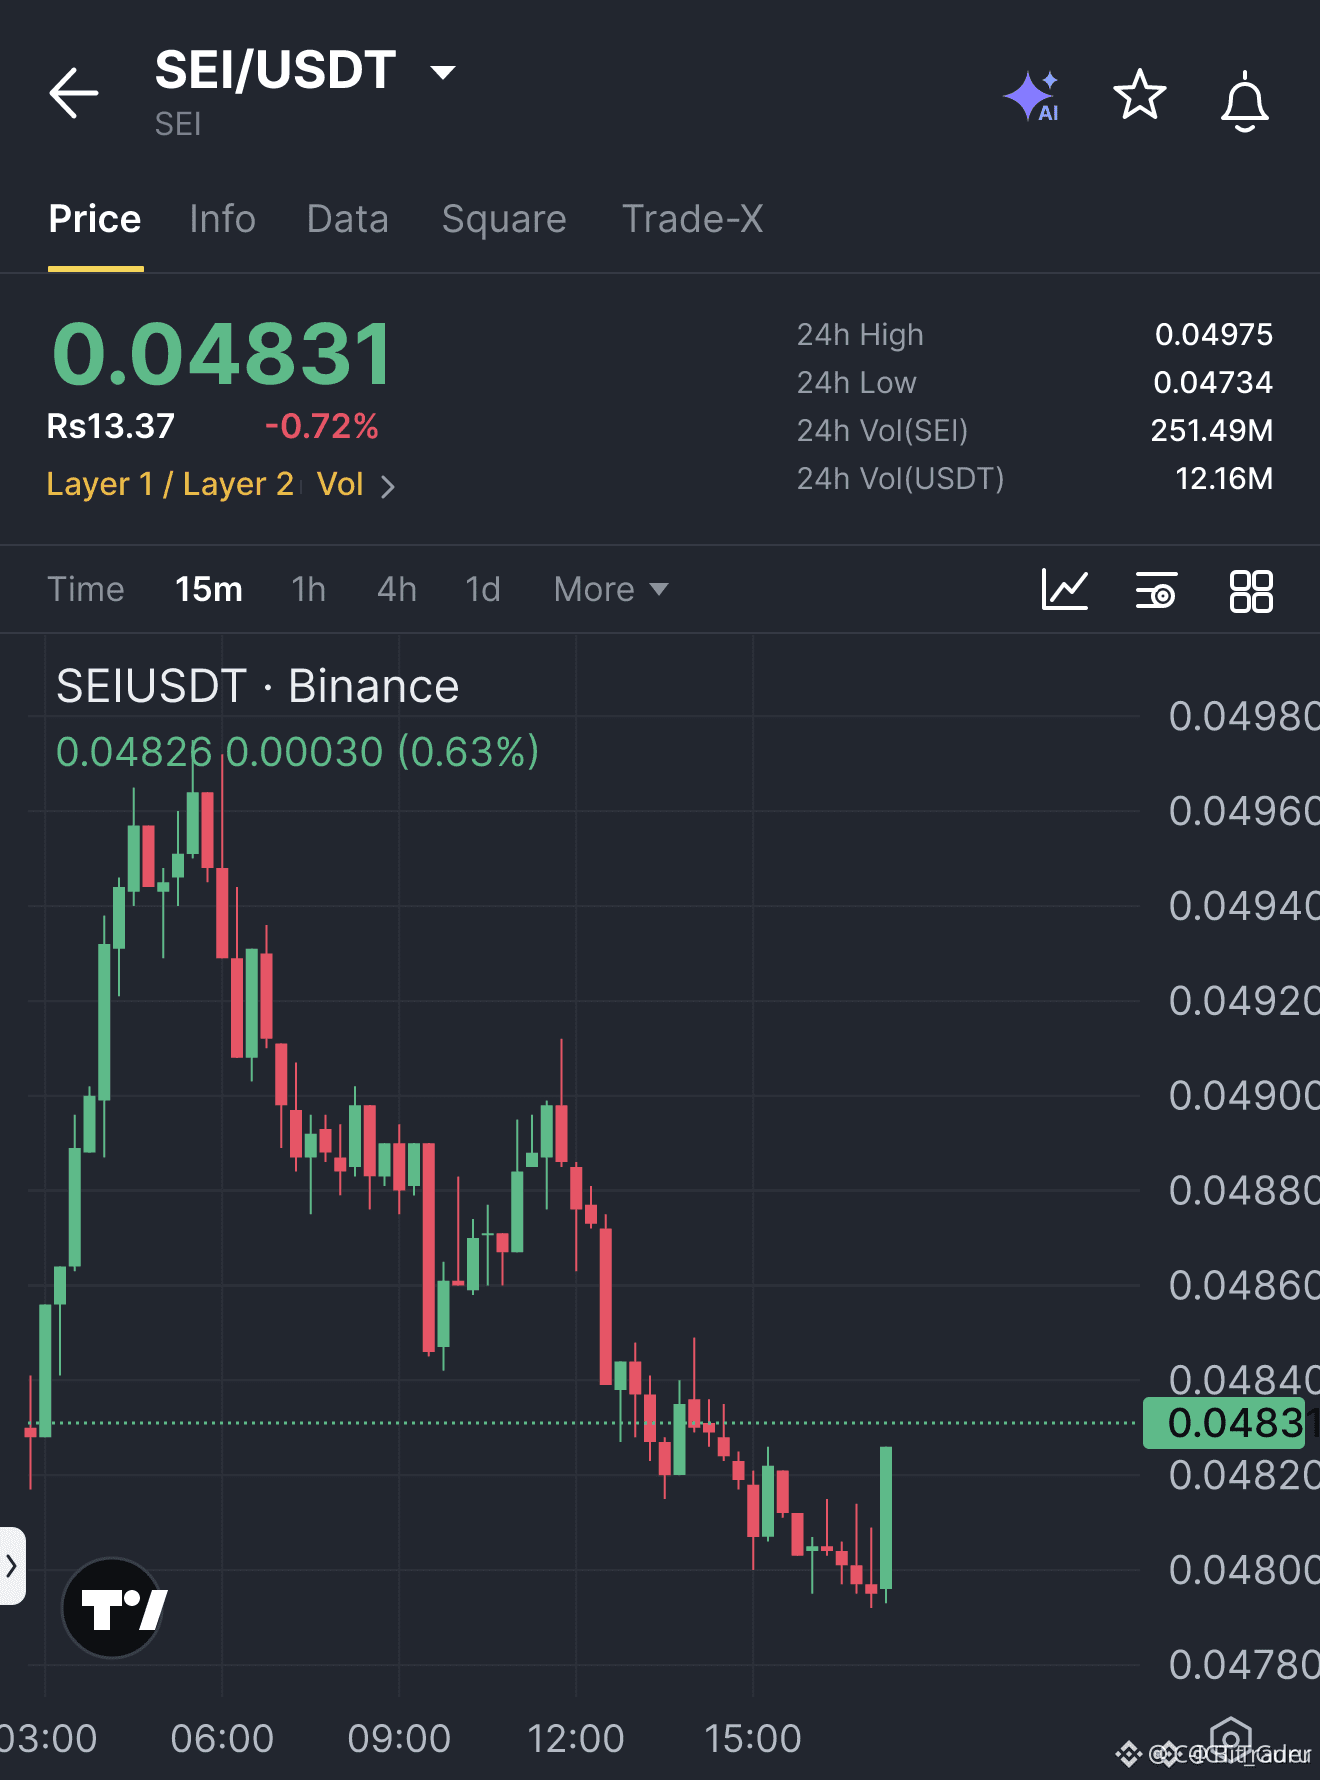
🦈 $SEI RECLAIMS KEY INTRADAY HIGH AFTER EXTENDED LIQUIDITY PURGE! ⚡
Entry: 0.04828 ⚡
Target: 0.04885 🎯
Stop Loss: 0.0479 ⚠️
🔍 After an extended markdown phase sweeping sell-side liquidity, $SEI has printed an immediate change of character by taking out the previous candle high. 🌊 This reclaim reflects responsive institutional demand stepping in to absorb market sell pressure at discounted levels.
💡 Market structure favors a systematic mean reversion toward overhead inefficiencies, with immediate liquidity resting at 0.04885 before higher levels are tested. 💬 Are you positioning on this structural trigger or waiting for a secondary retest? 👇
⚠️ Not financial advice. Always manage your risk. 🛡️
🏷️ #SEI #Altcoins #TradingSetup #MarketStructure
🎯 🦈
19

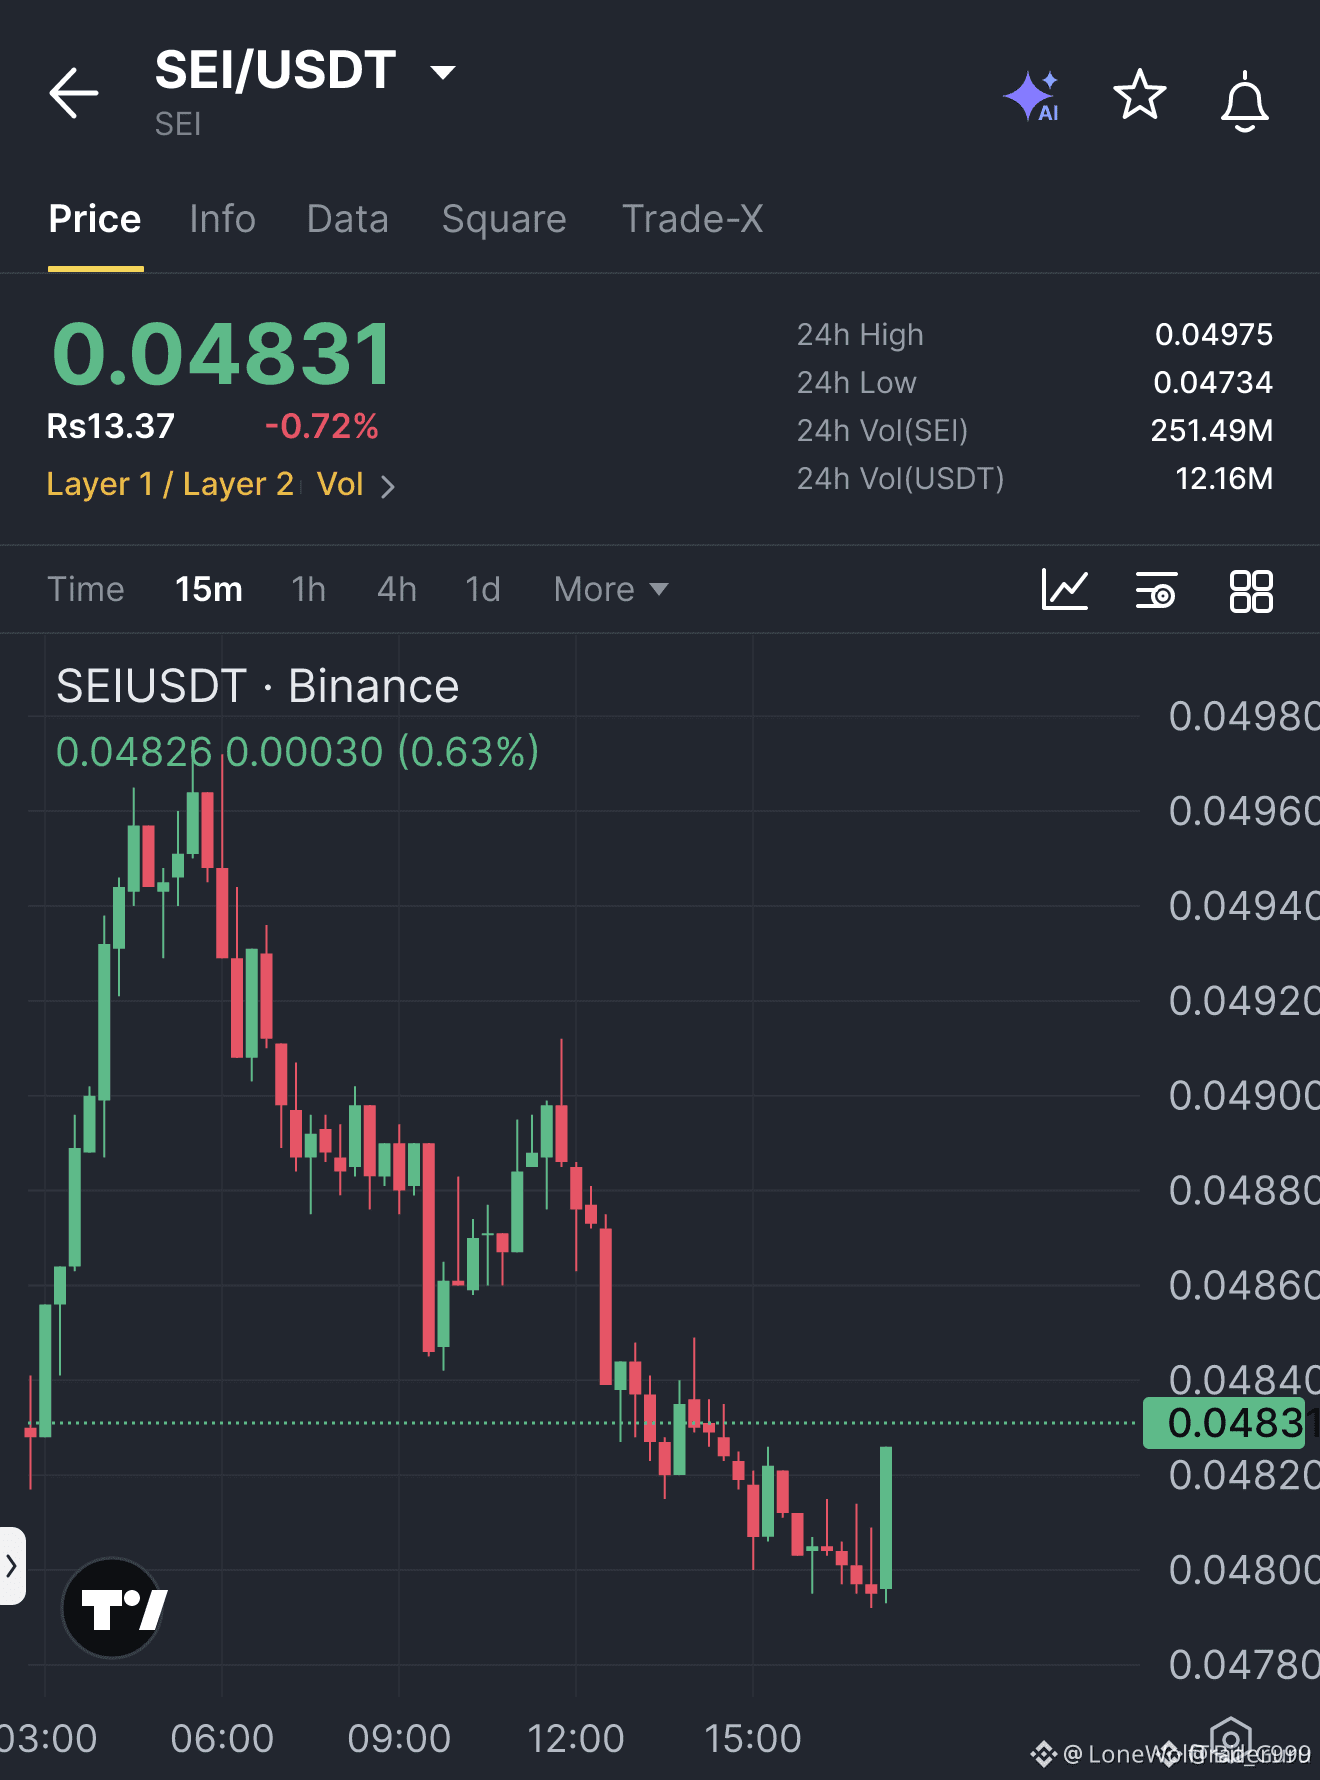
⚡ $SEI RECLAIMS MOMENTUM AS BUYERS BREAK HIGHS AFTER EXTENDED BLEED! 📈
Entry: 0.04828 ⚡
Target: 0.04885 🎯
Stop Loss: 0.0479 ⚠️
📌 Sellers ran out of gas after an extended bleed, and aggressive bids just reclaimed momentum by taking out the previous candle high. ⚡ This structural shift confirms responsive buyers stepping into the order book to defend the lows.
💡 The tactical play here is locking gains into the immediate 0.04885 level while letting secondary runners hunt 0.04923 and 0.0498. 📊 With risk strictly anchored below 0.0479, the setup offers clean asymmetry for patient execution.
💬 Are you taking the recovery trigger here, or waiting for higher confirmation above 0.049? 👇
⚠️ Not financial advice. Always manage your risk. 🛡️
🏷️ #SEI #LongSetup #Trading #Altcoins #Crypto
⚡ 🎯
16

·
--
$SEI moves 1.0 percent an hour and most people size it like a stablecoin
That hourly ATR is your natural yardstick for risk control
Say your account holds 1000 dollars total
You want to risk exactly 1 percent which is 10 dollars
With the hourly ATR at 0.00048 dollars a stop at that distance costs 10 dollars if you buy about 20687 units of $SEI
Position size is just math dividing your risk by the distance to your stop
Always calculate your size before you enter instead of guessing
What risk percentage do you use on each trade
#SEI #TradingTips
7

·
--
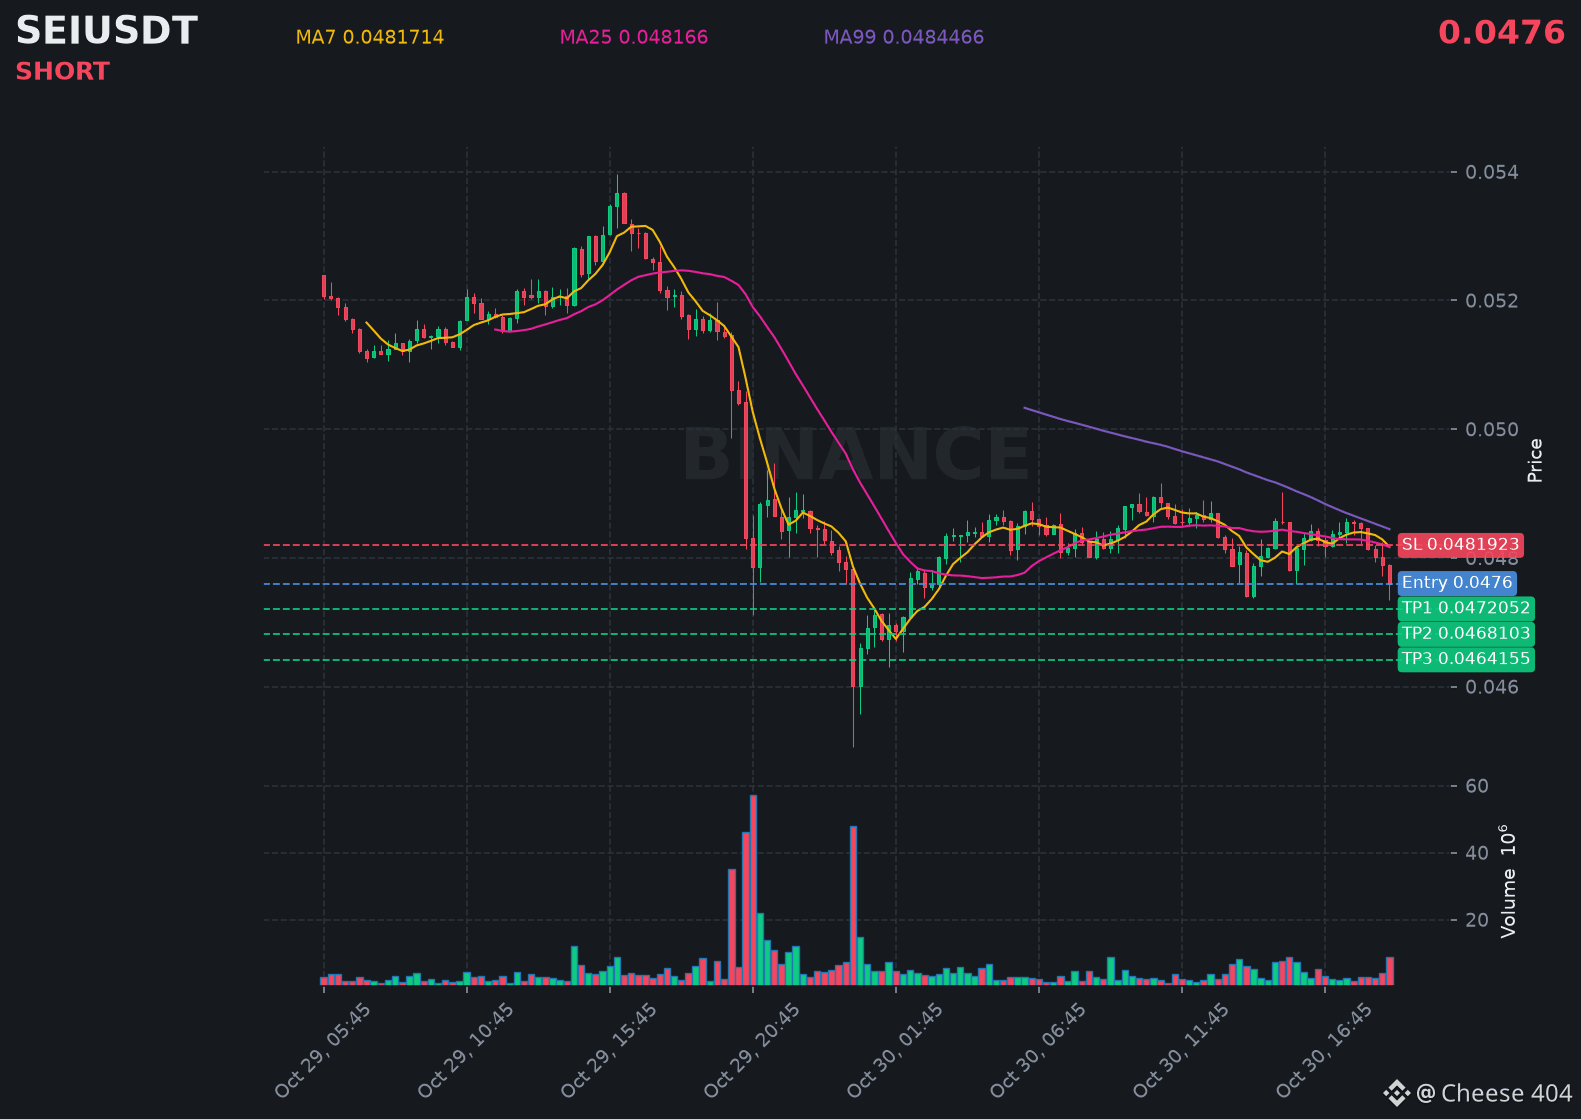
$SEI looks primed to keep falling, with bears firmly in control of the trend.
📍 @ 0.0476 | Volume: 0.43M USD
RSI 37 | EMA20: 0.0481938 USD
📈 Trade Plan:
📈 Entry: 0.0474815 – 0.0477185
🛑 Stop Loss: 0.0481923
🎯 TP1: 0.0472052
🎯 TP2: 0.0468103
🎯 TP3: 0.0464155
Waiting for confirmation, then riding the downtrend.
👉 $SEI 👈 Catch it
#SEI
📍 @ 0.0476 | Volume: 0.43M USD
RSI 37 | EMA20: 0.0481938 USD
📈 Trade Plan:
📈 Entry: 0.0474815 – 0.0477185
🛑 Stop Loss: 0.0481923
🎯 TP1: 0.0472052
🎯 TP2: 0.0468103
🎯 TP3: 0.0464155
Waiting for confirmation, then riding the downtrend.
👉 $SEI 👈 Catch it
#SEI
103

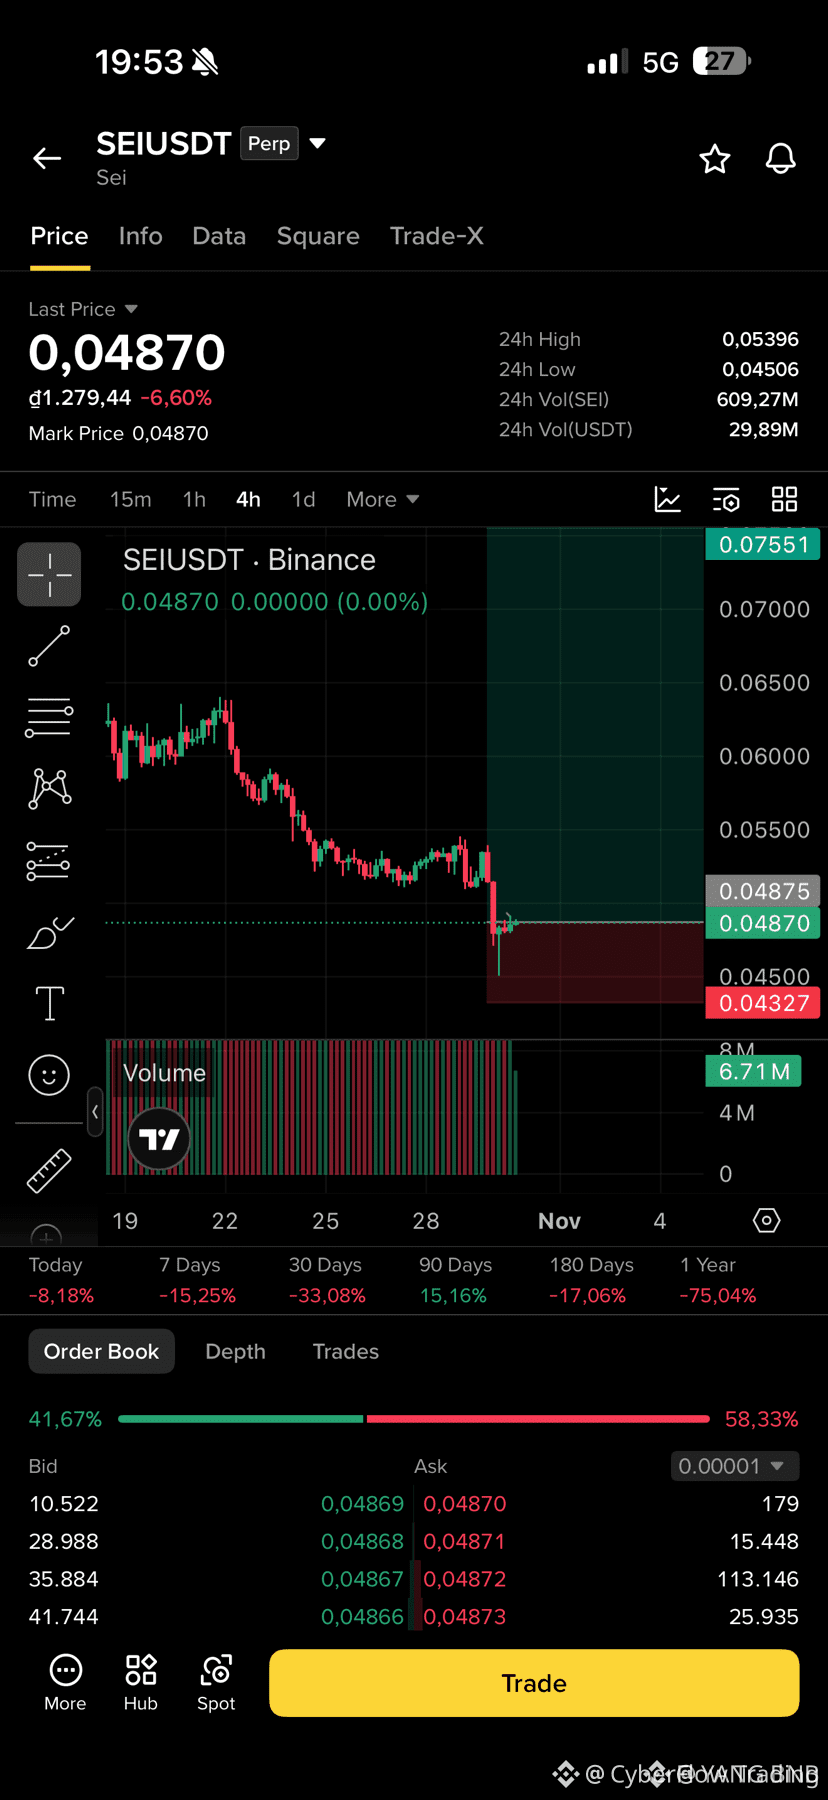
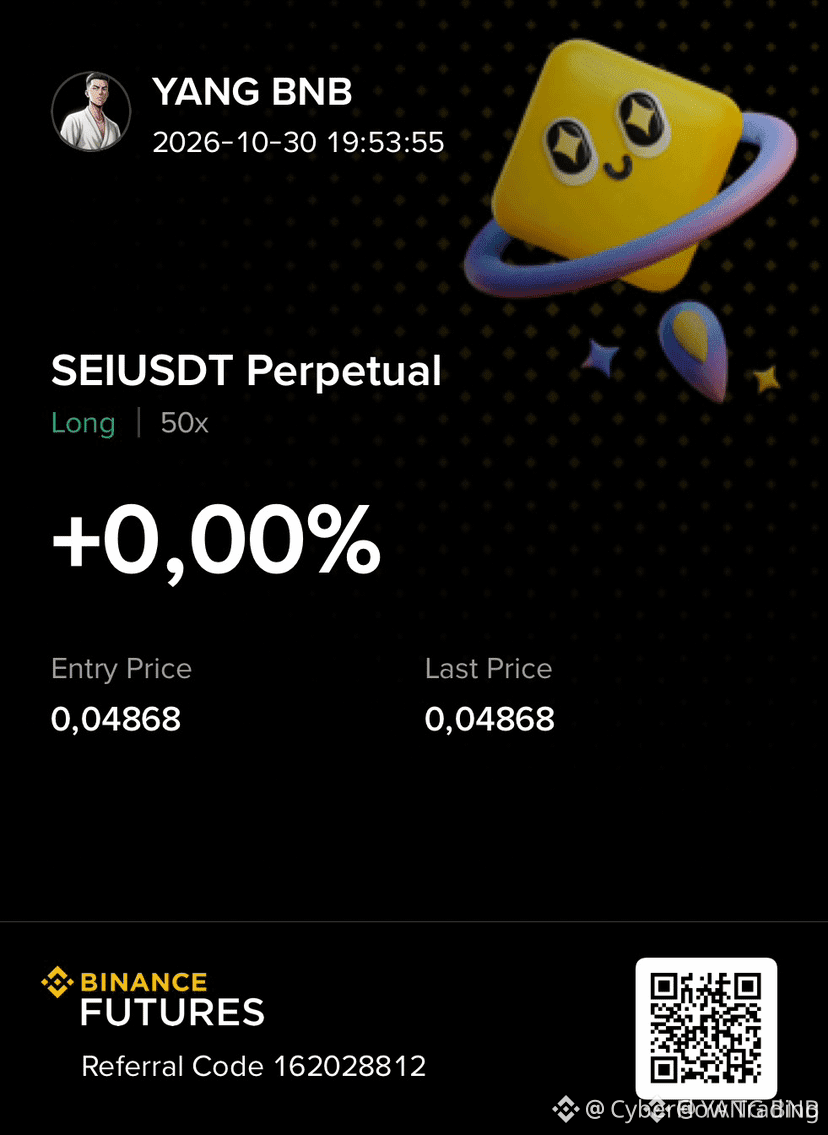
$SEI DEFENDING CRITICAL DEMAND AS AGGRESSIVE BUYERS PREPARE FOR A POWERFUL REVERSAL! ⚡ 🐂
Entry: 0.04850 - 0.04900 ⚡
Target: 0.05100 - 0.06000 🚀
Stop Loss: 0.04327 ⚠️
After a punishing drawdown, the tape is finally flipping as aggressive bids absorb selling pressure right above the 0.04500 structural floor. 🌊
Smart money is quietly positioning around this base, and with momentum curling back upward, the path of least resistance points toward an explosive expansion into overhead liquidity. ⚡
The risk-to-reward ratio here gives buyers solid asymmetric positioning against clean invalidation. 💬 Are you taking the bid on this reclaim, or waiting for higher confirmation before stepping in? 👇
⚠️ Not financial advice. Always manage your risk. 🛡️
🏷️ #SEI #Altcoins #LongSetup #Trading #Crypto
🎯 🦈
30

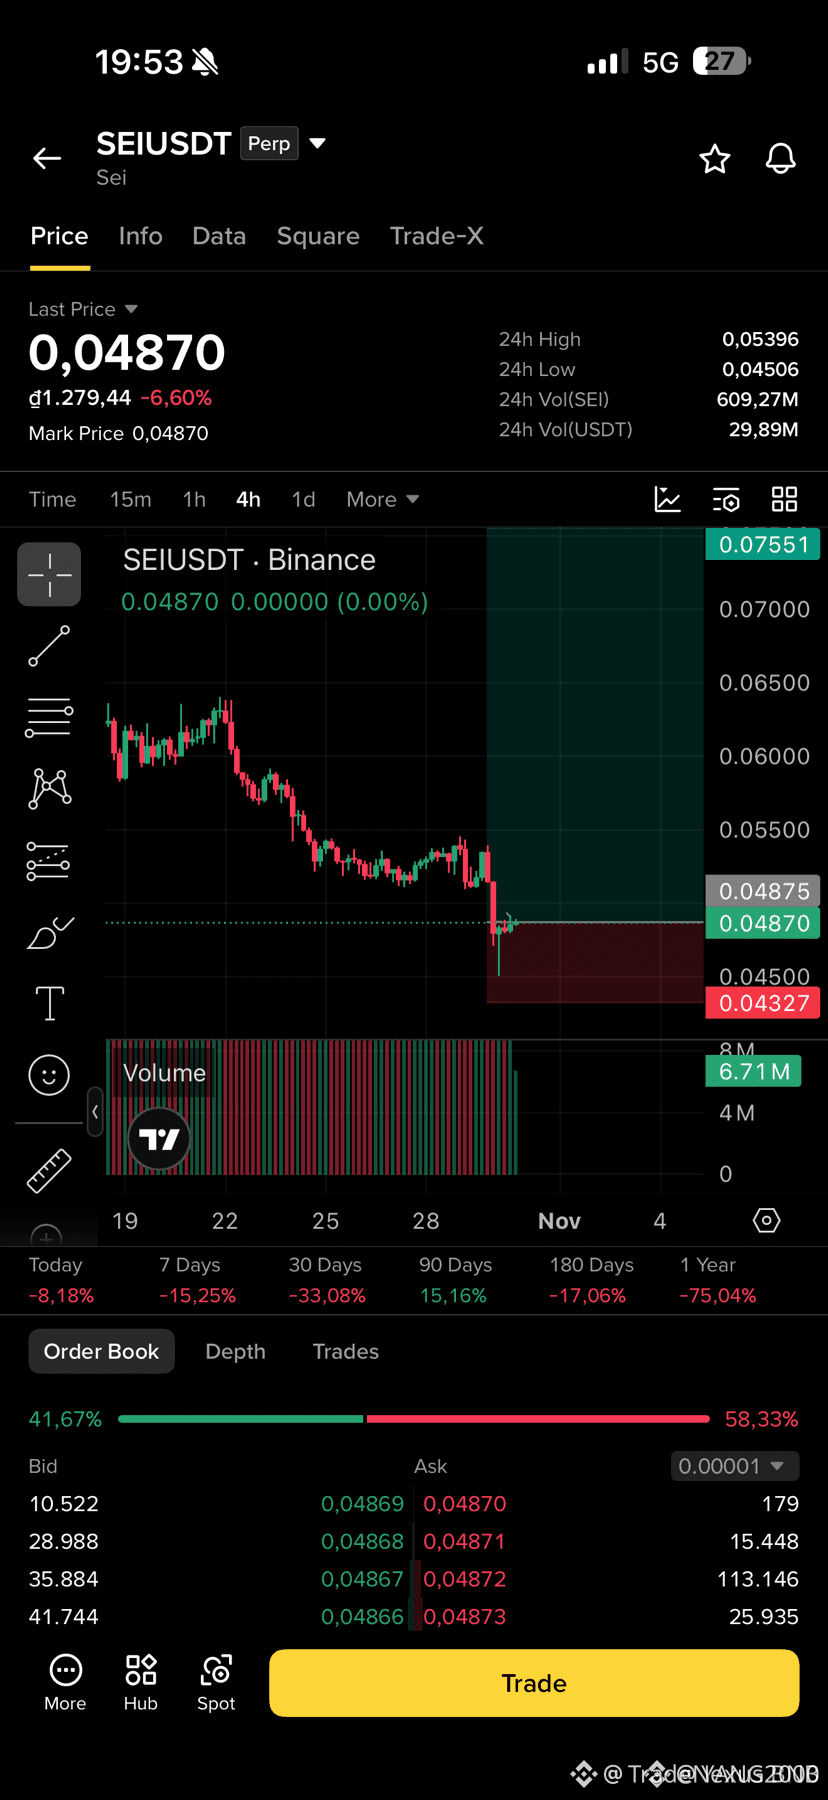
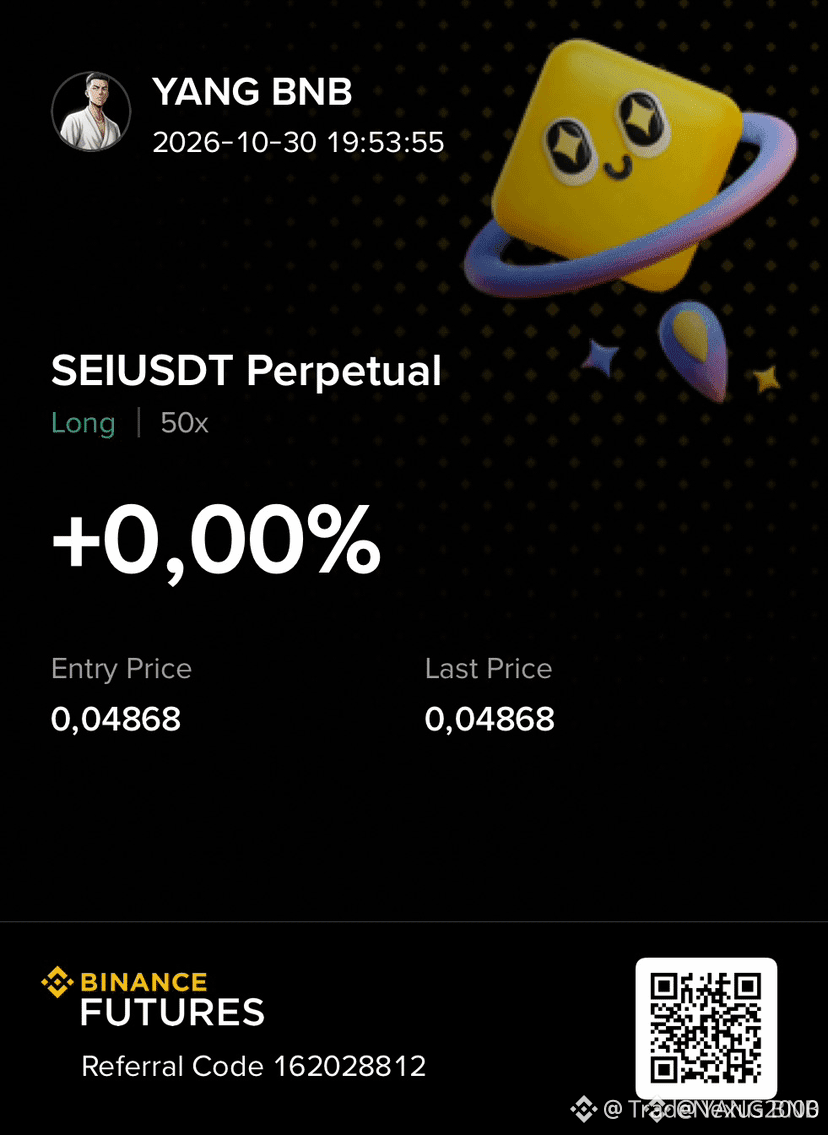
🦈 $SEI DEFENDS KEY DEMAND AFTER SWEEPING LIQUIDITY TOWARD 0.04500 SUPPORT! ⚡
Entry: 0.04850 – 0.04900 ⚡
Target: 0.05100, 0.05500, 0.06000 🎯
Stop Loss: 0.04327 ⚠️
Institutional order flow is showing clear signs of absorption around the 0.04500 base following an extended corrective phase. 🌊 Buyers stepped in decisively to defend this lower boundary, stabilizing price action near 0.04870 as demand begins to neutralize selling pressure. 📌
If market structure holds above our entry corridor, momentum should expand systematically toward overhead inefficiencies at 0.05500 and 0.06000. 📊 The invalidation level placed below 0.04327 offers a clear structural buffer against any deeper liquidity sweeps.
🤔 Are you positioning inside this accumulation zone, or waiting for higher timeframe confirmation above 0.05100? 👇
⚠️ Not financial advice. Always manage your risk. 🛡️
🏷️ #SEI #MarketStructure #CryptoAnalysis #TradingSetup
🎯 🦈
37
·
--
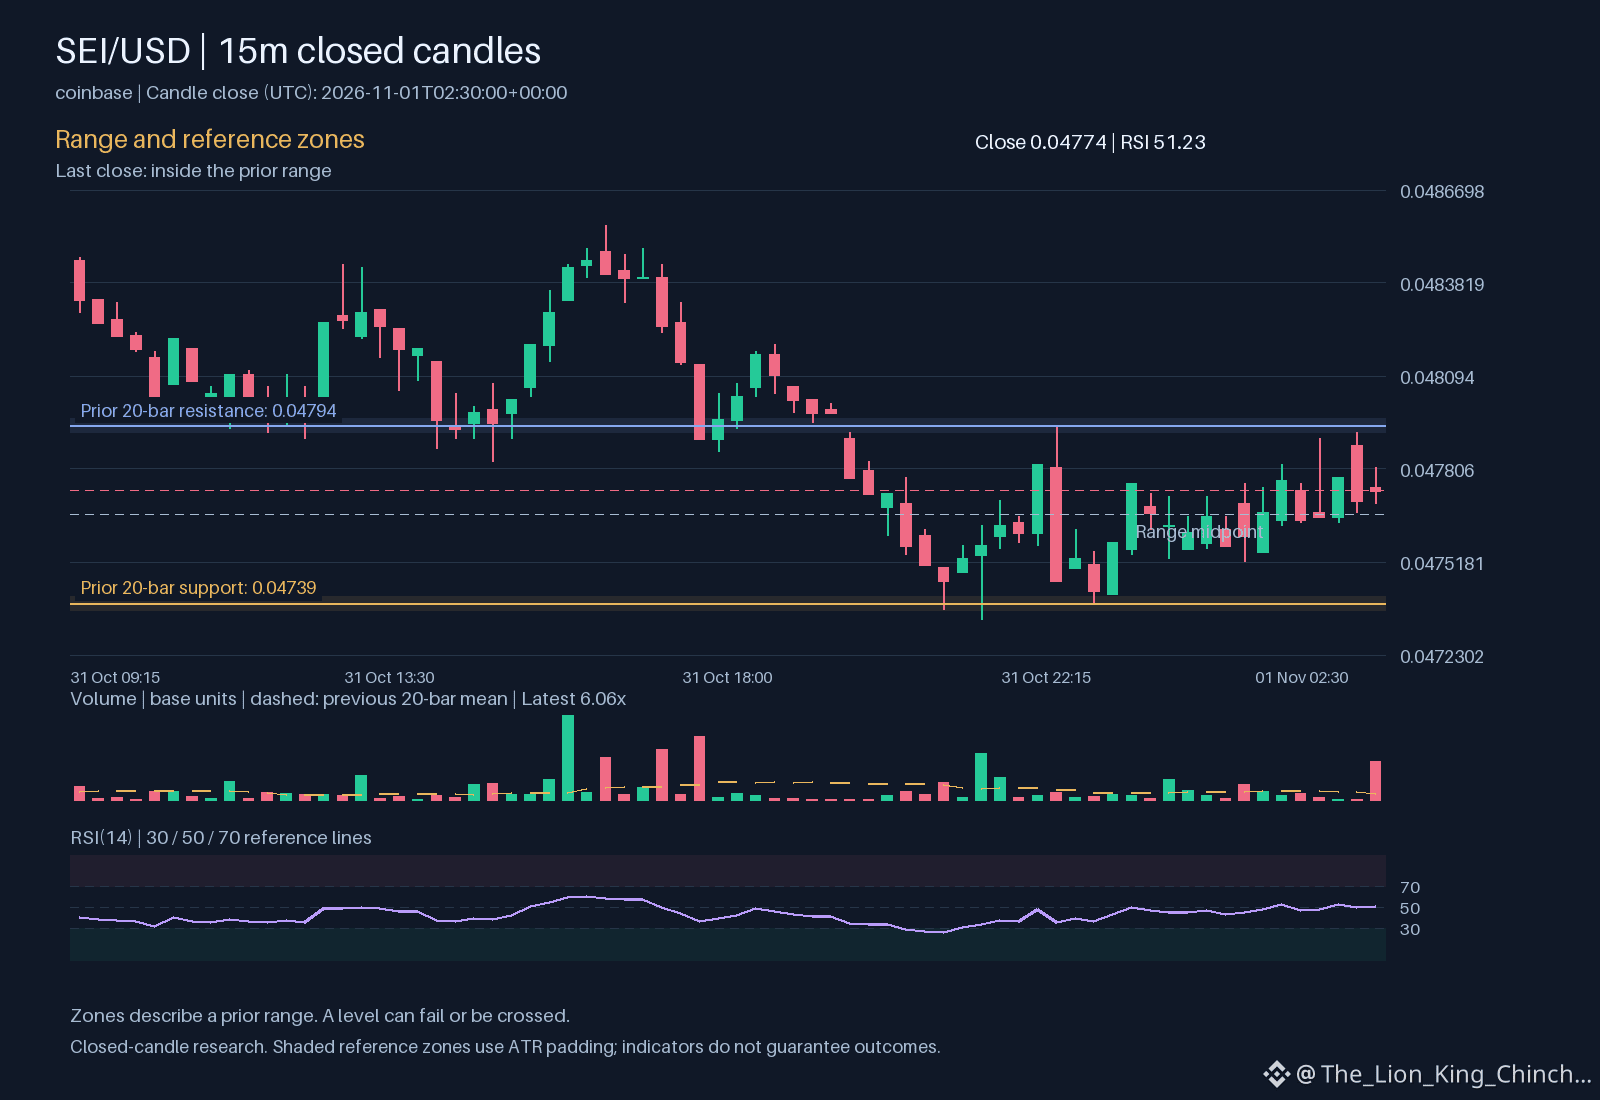
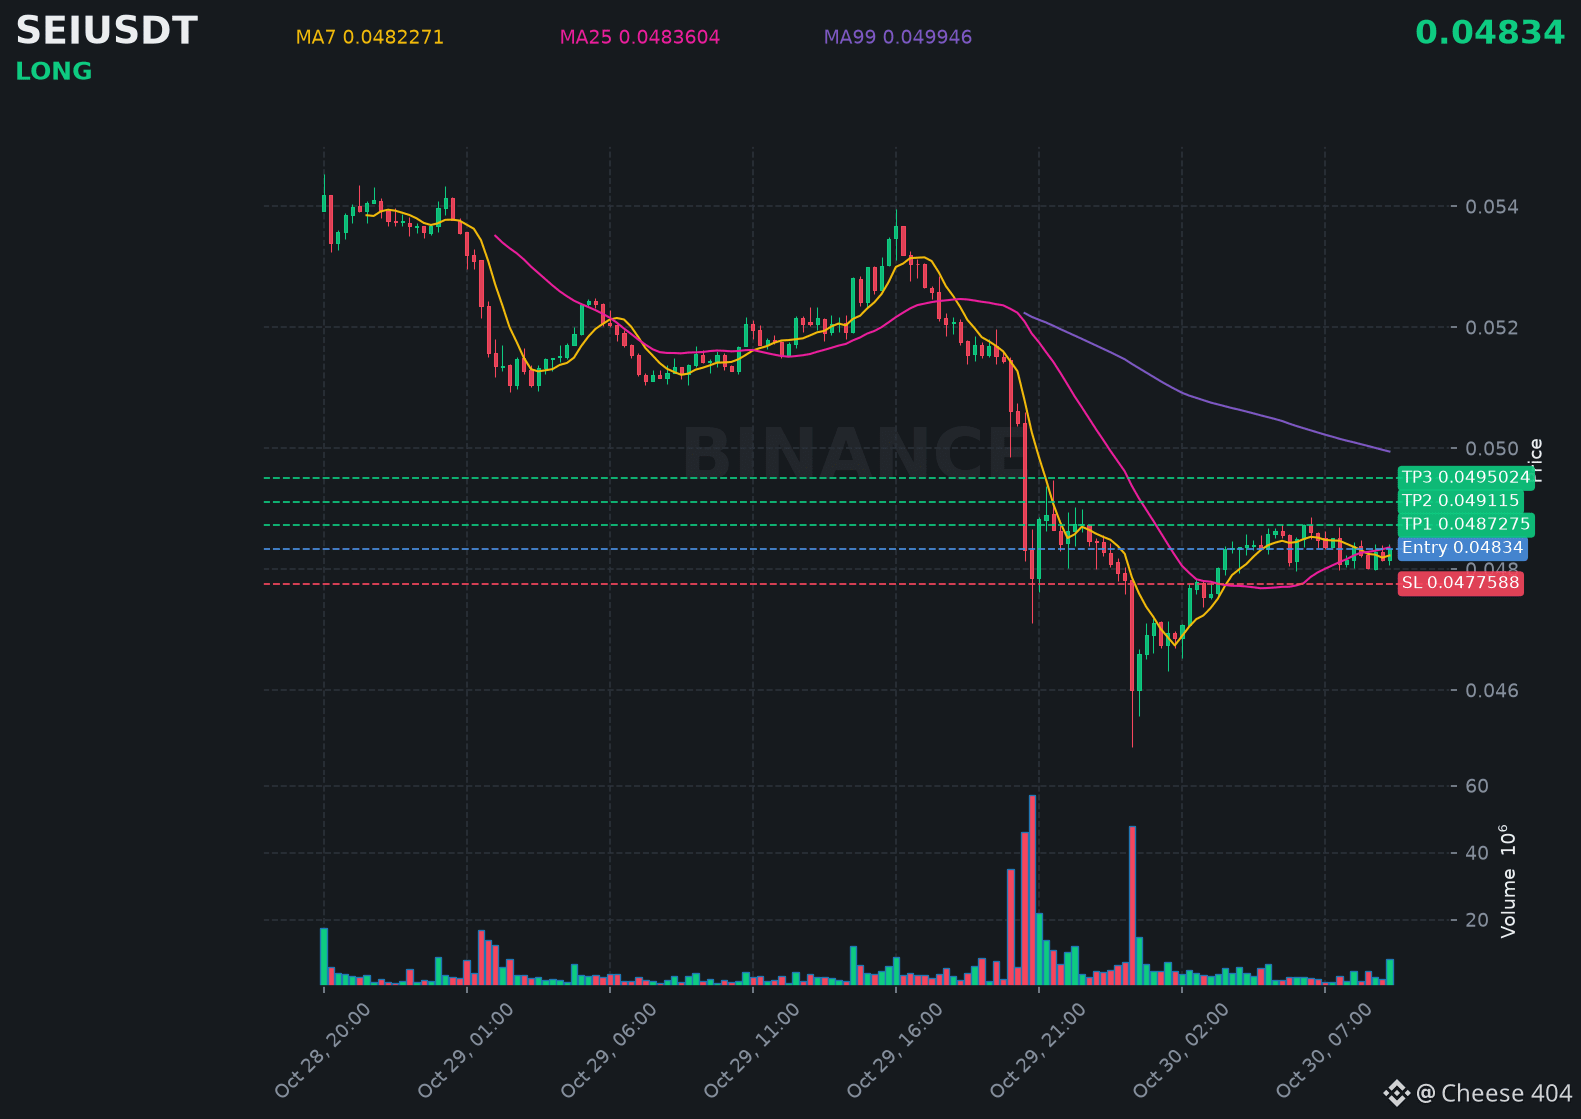
$SEI is holding steady above support, hinting at another leg up in the coming hours.
📍 @ 0.04834 | Volume: 0.39M USD
RSI 51 | EMA20: 0.0482734 USD
📈 Trade Plan:
📈 Entry: 0.0482238 – 0.0484562
🛑 Stop Loss: 0.0477588
🎯 TP1: 0.0487275
🎯 TP2: 0.049115
🎯 TP3: 0.0495024
Waiting for a retest, then riding the uptrend.
👉 $SEI 👈 Catch it
#SEI
📍 @ 0.04834 | Volume: 0.39M USD
RSI 51 | EMA20: 0.0482734 USD
📈 Trade Plan:
📈 Entry: 0.0482238 – 0.0484562
🛑 Stop Loss: 0.0477588
🎯 TP1: 0.0487275
🎯 TP2: 0.049115
🎯 TP3: 0.0495024
Waiting for a retest, then riding the uptrend.
👉 $SEI 👈 Catch it
#SEI
172

·
--
$SEI #SEI
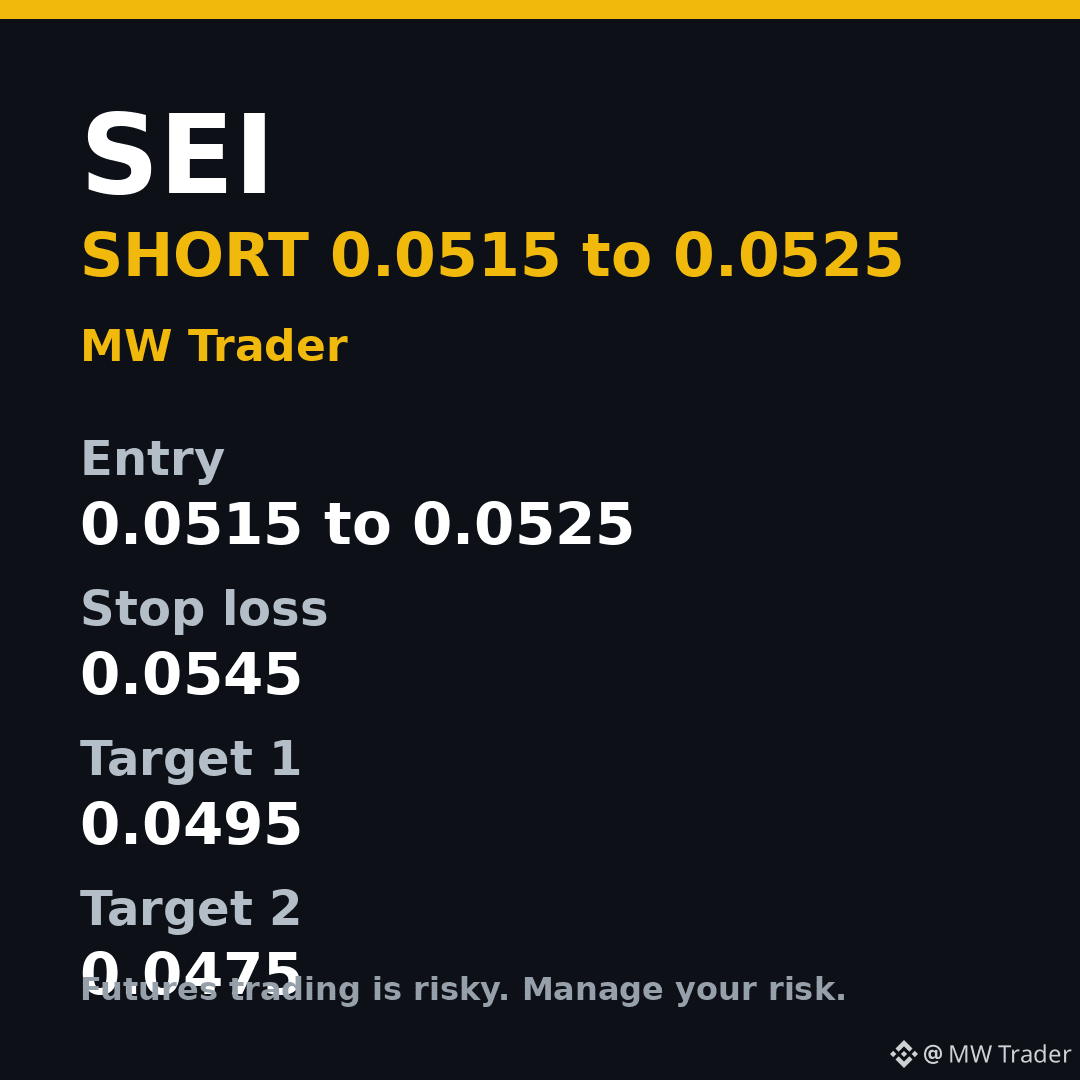
SHORT idea, fresh setup for 29 October evening
Entry: 0.0515 to 0.0525
Stop loss: 0.0545
Target 1: 0.0495
Target 2: 0.0475
Sei is near 0.0519, down about 0.64 percent over 24 hours on about 49 million dollars of volume, drifting lower with no buying interest showing up. In a flat Bitcoin market, coins already slipping tend to keep slipping. A short on a bounce toward 0.0515 to 0.0525 favours a move toward 0.0495. Above 0.0545, exit.
Futures trading is risky, trade small, manage your risk, and do your own research.
#Sei #Crypto #FuturesTrading #TradingSignals
Follow for more trades.
13
·
--
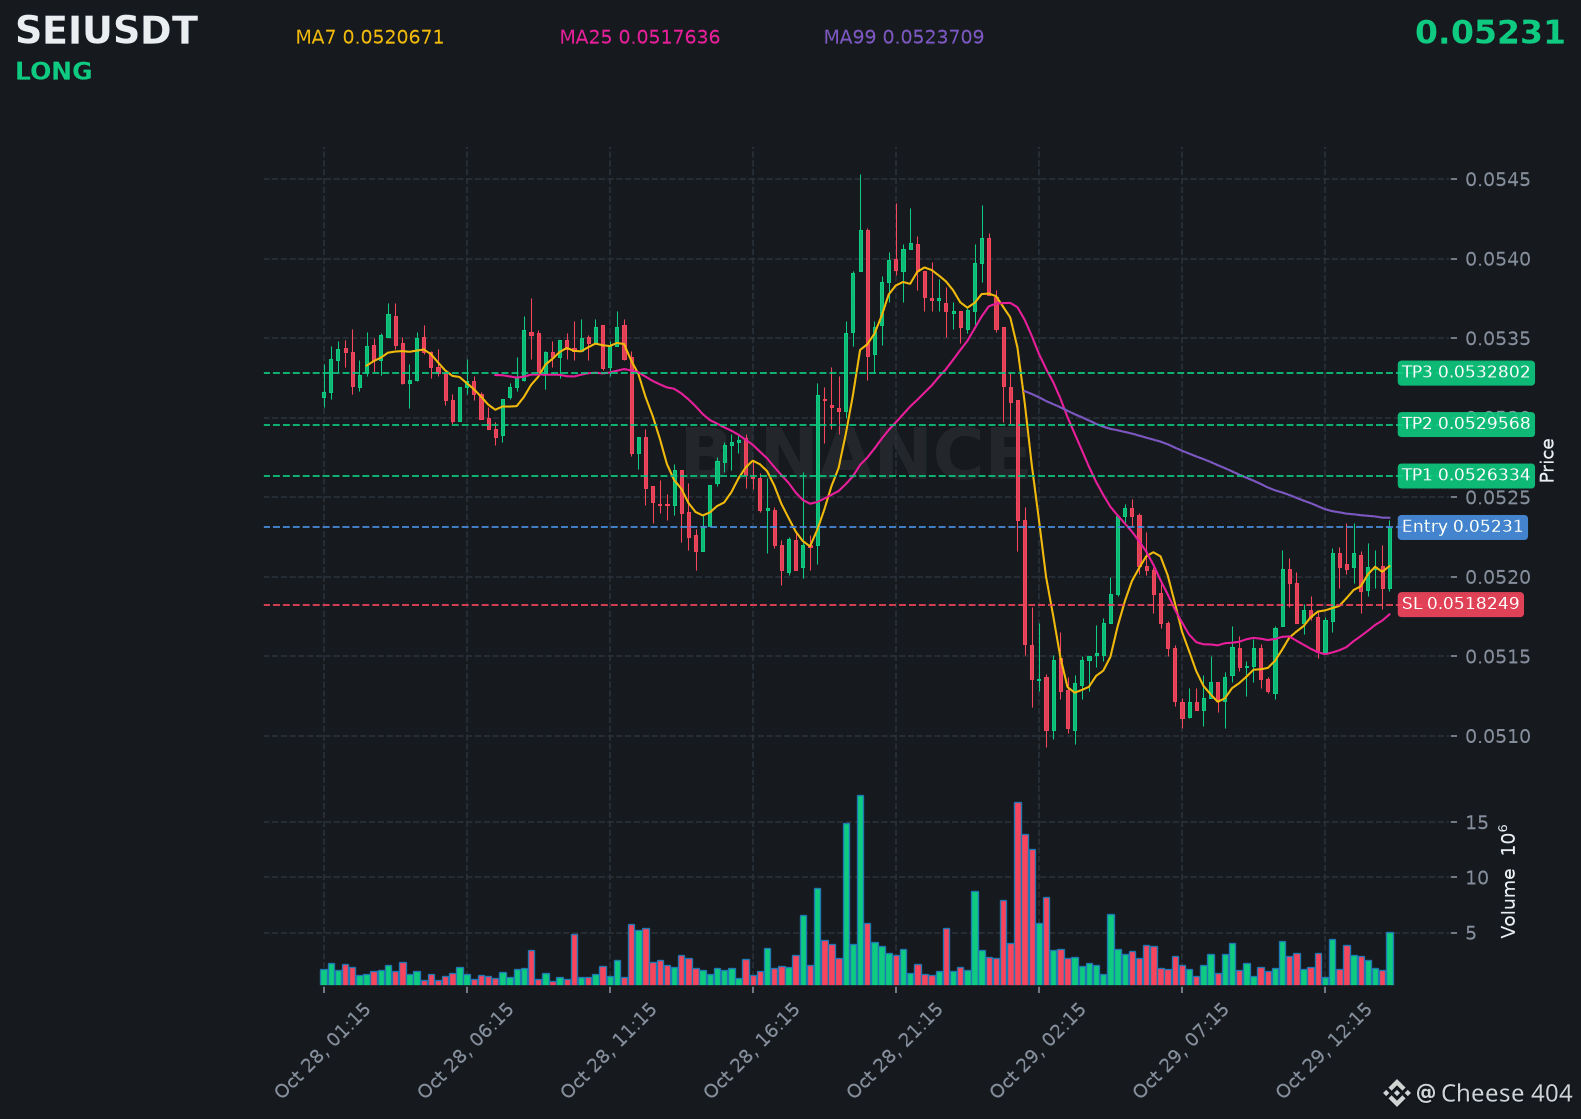
$SEI just printed a strong bullish candle, signaling more upside pressure building right now.
📍 @ 0.05231 | Volume: 0.26M USD
RSI 60 | EMA20: 0.0519039 USD
📈 Trade Plan:
📈 Entry: 0.052213 – 0.052407
🛑 Stop Loss: 0.0518249
🎯 TP1: 0.0526334
🎯 TP2: 0.0529568
🎯 TP3: 0.0532802
Waiting for a retest, then riding the uptrend.
👉 $SEI 👈 Catch it
#SEI
📍 @ 0.05231 | Volume: 0.26M USD
RSI 60 | EMA20: 0.0519039 USD
📈 Trade Plan:
📈 Entry: 0.052213 – 0.052407
🛑 Stop Loss: 0.0518249
🎯 TP1: 0.0526334
🎯 TP2: 0.0529568
🎯 TP3: 0.0532802
Waiting for a retest, then riding the uptrend.
👉 $SEI 👈 Catch it
#SEI
68

·
--
Verified
Sei’s Biggest Upgrade Proposal Just Dropped — Is $SEI Ready for a Breakout? ⚡
CONFIRMED: On October 28, Sei published SIP-6, a draft proposal to replace its current consensus system with Autobahn as part of the Giga upgrade.
WHY IT MATTERS: The design targets up to 200,000 transactions per second and 250ms finality, aiming to make onchain trading faster and reduce reliance on a single block proposer.
THE CATCH: SIP-6 is still a draft. Public testnet testing, independent security audits and governance approval are still required. These performance targets have not been achieved on mainnet.
Click the $SEI widget below and check the latest developments.
$SEI
{future}(SEIUSDT)
.
.
.
#Sei #Crypto #write2earn
Not financial advice. DYOR.
Sei’s Biggest Upgrade Proposal Just Dropped — Is $SEI Ready for a Breakout? ⚡
CONFIRMED: On October 28, Sei published SIP-6, a draft proposal to replace its current consensus system with Autobahn as part of the Giga upgrade.
WHY IT MATTERS: The design targets up to 200,000 transactions per second and 250ms finality, aiming to make onchain trading faster and reduce reliance on a single block proposer.
THE CATCH: SIP-6 is still a draft. Public testnet testing, independent security audits and governance approval are still required. These performance targets have not been achieved on mainnet.
Click the $SEI widget below and check the latest developments.
$SEI
.
.
.
#Sei #Crypto #write2earn
Not financial advice. DYOR.
Fumando altcoins:
lixo de tokem quase uma Mantra da vida.
1
5
2.7k

·
--
Bullish
$SEI
{spot}(SEIUSDT)
(Crypto / Blockchain)
SEI is a high-speed Layer 1 blockchain built specifically for crypto trading. It features lightning-fast transaction finality, parallel processing, and a built-in order-matching engine. The native SEI token is used for gas fees, staking, and network governance.
2. SEI (Software Engineering Institute)
The Software Engineering Institute (SEI), run by Carnegie Mellon University, is a global research center famous for developing software quality standards and frameworks like CMMI to help organizations improve their software systems.#Sei #CanGoogleDefindItsCore #EarningsSeason
$SEI
(Crypto / Blockchain)
SEI is a high-speed Layer 1 blockchain built specifically for crypto trading. It features lightning-fast transaction finality, parallel processing, and a built-in order-matching engine. The native SEI token is used for gas fees, staking, and network governance.
2. SEI (Software Engineering Institute)
The Software Engineering Institute (SEI), run by Carnegie Mellon University, is a global research center famous for developing software quality standards and frameworks like CMMI to help organizations improve their software systems.#Sei #CanGoogleDefindItsCore #EarningsSeason
cheikh1993:
What is your prediction for the future of this digital currency?
2
9
2k

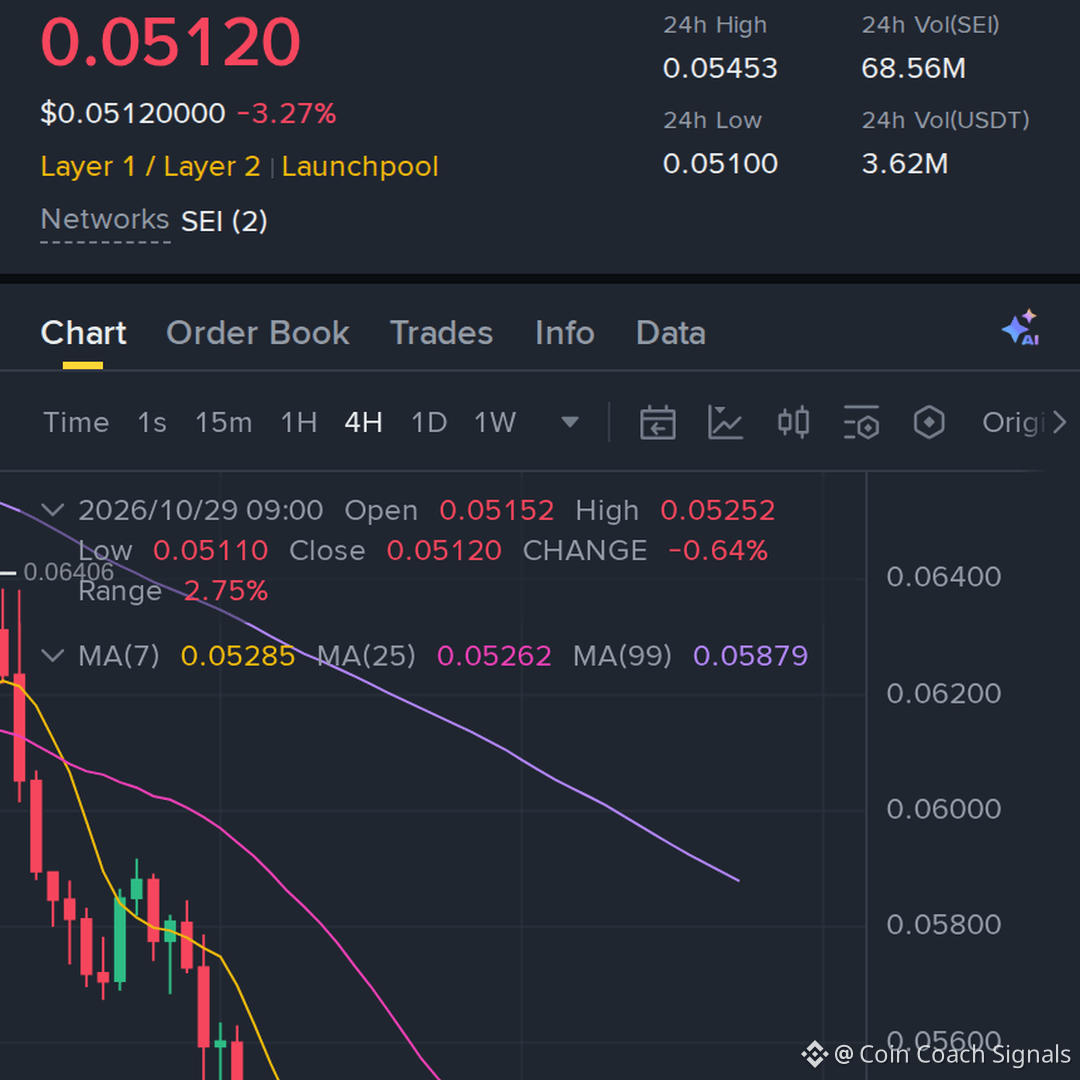
guys, $SEI keeps rejecting the same area, so the short side is worth watching
Entry: 0.05113–0.05157 | Stop Loss: 0.05485
TP1: 0.04878 / TP2: 0.04647 / TP3: 0.04416
#SEI #Binance #Write2Earn #Crypto
guys, $SEI keeps rejecting the same area, so the short side is worth watching
Entry: 0.05113–0.05157 | Stop Loss: 0.05485
TP1: 0.04878 / TP2: 0.04647 / TP3: 0.04416
#SEI #Binance #Write2Earn #Crypto
Entry: 0.05113–0.05157 | Stop Loss: 0.05485
TP1: 0.04878 / TP2: 0.04647 / TP3: 0.04416
#SEI #Binance #Write2Earn #Crypto
145
·
--
【24h Top 3 Gainers】
🥇 $OP +78.5%
$0.115
🥈 $SEI +65.2%
$0.05
🥉 $APT +54.3%
$0.64
This rally is a sure thing! $OP, $SEI, and $APT are all in a major uptrend—miss out and you'll kick yourself! $OP target: $0.2, $SEI aiming for $0.07, $APT targeting $1! Get in now, don't hesitate to take profits. Stop-loss levels: $0.1 for $SEI, $0.55 for APT, and $0.08 for $OP! Plenty of gains to be made!🚀
$OP #Optimism $SEI #Sei $APT #Aptos #SuccessfulAccumulation
Hurry and get on board—miss this one and you'll have to wait another year! Trade now and seize the gains from this massive surge!
【24h Top 3 Gainers】
🥇 $OP +78.5%
$0.115
🥈 $SEI +65.2%
$0.05
🥉 $APT +54.3%
$0.64
This rally is a sure thing! $OP , $SEI , and $APT are all in a major uptrend—miss out and you'll kick yourself! $OP target: $0.2, $SEI aiming for $0.07, $APT targeting $1! Get in now, don't hesitate to take profits. Stop-loss levels: $0.1 for $SEI , $0.55 for APT, and $0.08 for $OP ! Plenty of gains to be made!🚀
$OP #Optimism $SEI #Sei $APT #Aptos #SuccessfulAccumulation
Hurry and get on board—miss this one and you'll have to wait another year! Trade now and seize the gains from this massive surge!
2

🚀 MONACO MAINNET IS LIVE ON SEI!
@MonacoTrading has officially opened its invite-only mainnet on @SeiFoundation Network ($SEI ), bringing real funds and real leverage to its trading platform.
🔥 Early access rewards the testnet pioneers: ✅ Public testnet traders get immediate access. 🎟️ One invite code to bring a friend. 💰 An additional invite for every 250,000 $USDC in trading volume. 📲 Others can request access through Monaco’s Telegram community.
Built by a team incubated by @Sei_Labs, Monaco is developing an order book trading layer for spot markets, perpetuals, and prediction markets.
With talent from Goldman Sachs, GSR, Hudson River Trading, Jump Crypto, Robinhood, and Point72, the team brings serious traditional and crypto trading experience.
The next chapter of on-chain trading is taking shape on Sei. 👀
Will Monaco become a major player in the on-chain trading space?
#Sei #SEI #DeFi #Crypto
{future}(SEIUSDT)
🚀 MONACO MAINNET IS LIVE ON SEI!
@MonacoTrading has officially opened its invite-only mainnet on @Sei Official Network ($SEI ), bringing real funds and real leverage to its trading platform.
🔥 Early access rewards the testnet pioneers: ✅ Public testnet traders get immediate access. 🎟️ One invite code to bring a friend. 💰 An additional invite for every 250,000 $USDC in trading volume. 📲 Others can request access through Monaco’s Telegram community.
Built by a team incubated by @Sei_Labs, Monaco is developing an order book trading layer for spot markets, perpetuals, and prediction markets.
With talent from Goldman Sachs, GSR, Hudson River Trading, Jump Crypto, Robinhood, and Point72, the team brings serious traditional and crypto trading experience.
The next chapter of on-chain trading is taking shape on Sei. 👀
Will Monaco become a major player in the on-chain trading space?
#Sei #SEI #DeFi #Crypto


3
208

·
--
No way!
$SEI A new high! It just broke straight through the 24-hour high.
Current price: 0.04944. The previous high of 0.04916 is now in the rearview mirror.
Selling pressure near the previous high overhead is the first test ahead. Did you catch this move?
#SEI
No way!
$SEI A new high! It just broke straight through the 24-hour high.
Current price: 0.04944. The previous high of 0.04916 is now in the rearview mirror.
Selling pressure near the previous high overhead is the first test ahead. Did you catch this move?
#SEI
$SEI A new high! It just broke straight through the 24-hour high.
Current price: 0.04944. The previous high of 0.04916 is now in the rearview mirror.
Selling pressure near the previous high overhead is the first test ahead. Did you catch this move?
#SEI
7

Partly True
---
*SEI at $0.07 = The Ultimate Bottom? Giga is Coming! 🚀*
Everyone forgot SEI, but I didn't.
*Why I'm still bullish:*
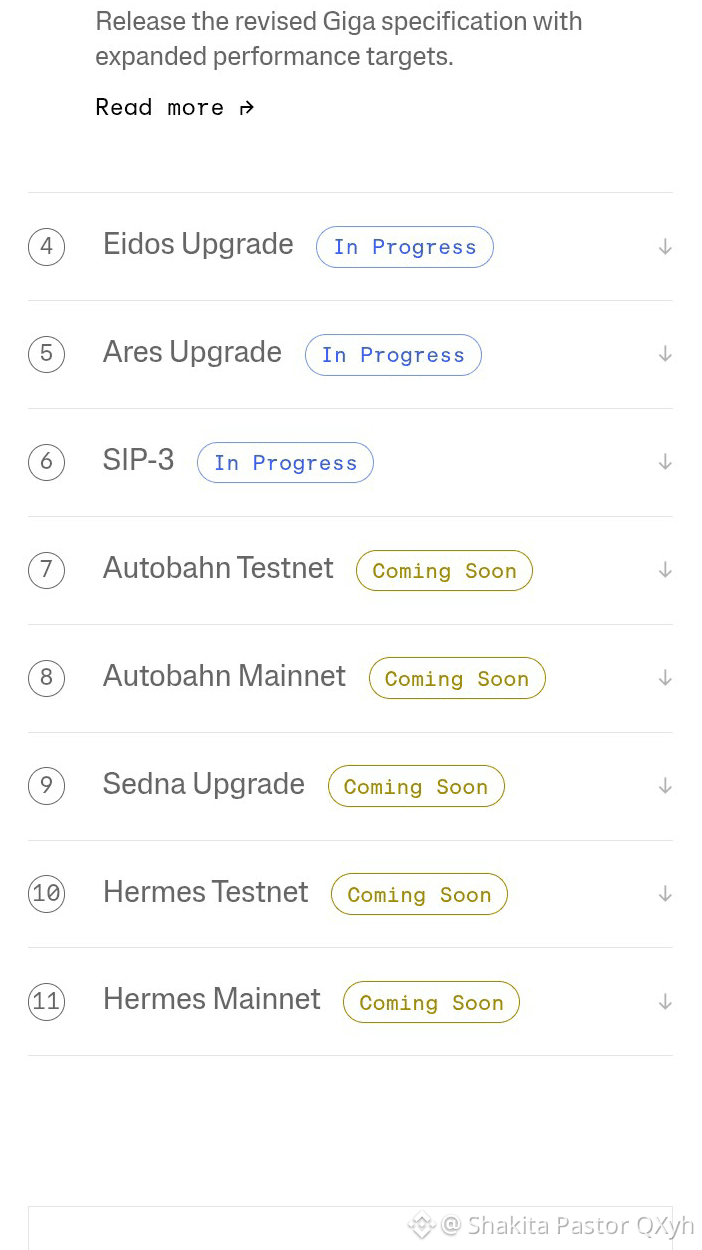
Giga Roadmap update from http://giga.seilabs.io:
✅ 3 DONE: Devnet (200k TPS tested), Whitepaper v1 & v2
🔵 3 IN PROGRESS: Eidos + Ares + SIP-3 (EVM-only upgrade)
🟡 5 COMING SOON: Autobahn Testnet & Mainnet
Autobahn is the game changer - SEI will go from 5k TPS to 200k TPS. That's 10x faster than Solana!
*My Strategy:*
Accumulating at $0.07 base price and holding in Flexible Earn.
Testnet news = first pump. Mainnet launch = $0.20+ is easy.
TVL already pumped from $25M to $540M. Big money is entering.
Do you think SEI can hit $0.50 after Giga Mainnet?
#SEI #Giga #Autobahn #Crypto #Altcoins
---
---
*SEI at $0.07 = The Ultimate Bottom? Giga is Coming! 🚀*
Everyone forgot SEI, but I didn't.
*Why I'm still bullish:*
Giga Roadmap update from http://giga.seilabs.io:
✅ 3 DONE: Devnet (200k TPS tested), Whitepaper v1 & v2
🔵 3 IN PROGRESS: Eidos + Ares + SIP-3 (EVM-only upgrade)
🟡 5 COMING SOON: Autobahn Testnet & Mainnet
Autobahn is the game changer - SEI will go from 5k TPS to 200k TPS. That's 10x faster than Solana!
*My Strategy:*
Accumulating at $0.07 base price and holding in Flexible Earn.
Testnet news = first pump. Mainnet launch = $0.20+ is easy.
TVL already pumped from $25M to $540M. Big money is entering.
Do you think SEI can hit $0.50 after Giga Mainnet?
#SEI #Giga #Autobahn #Crypto #Altcoins
---
1
791

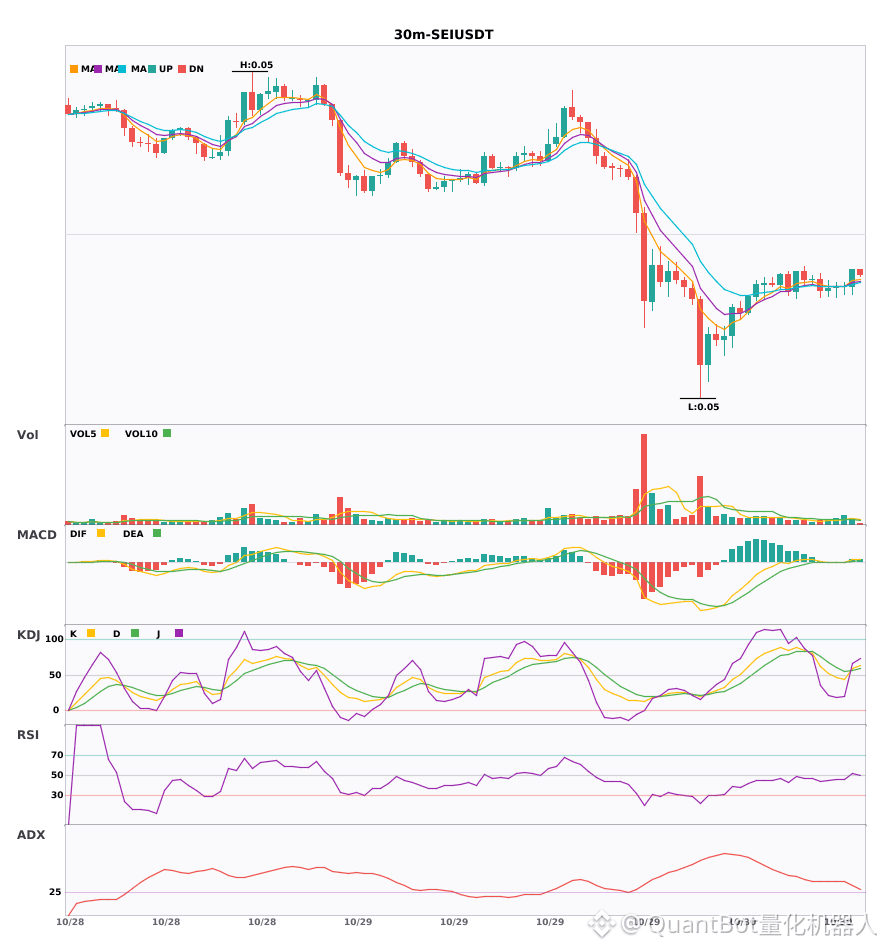
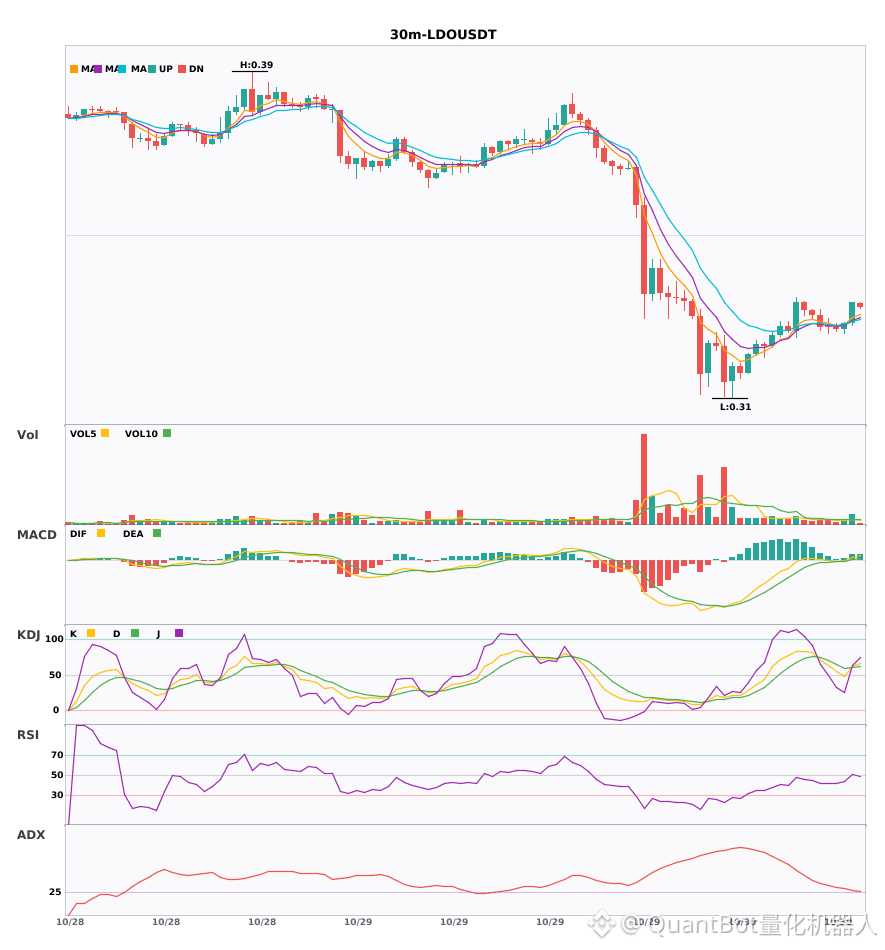
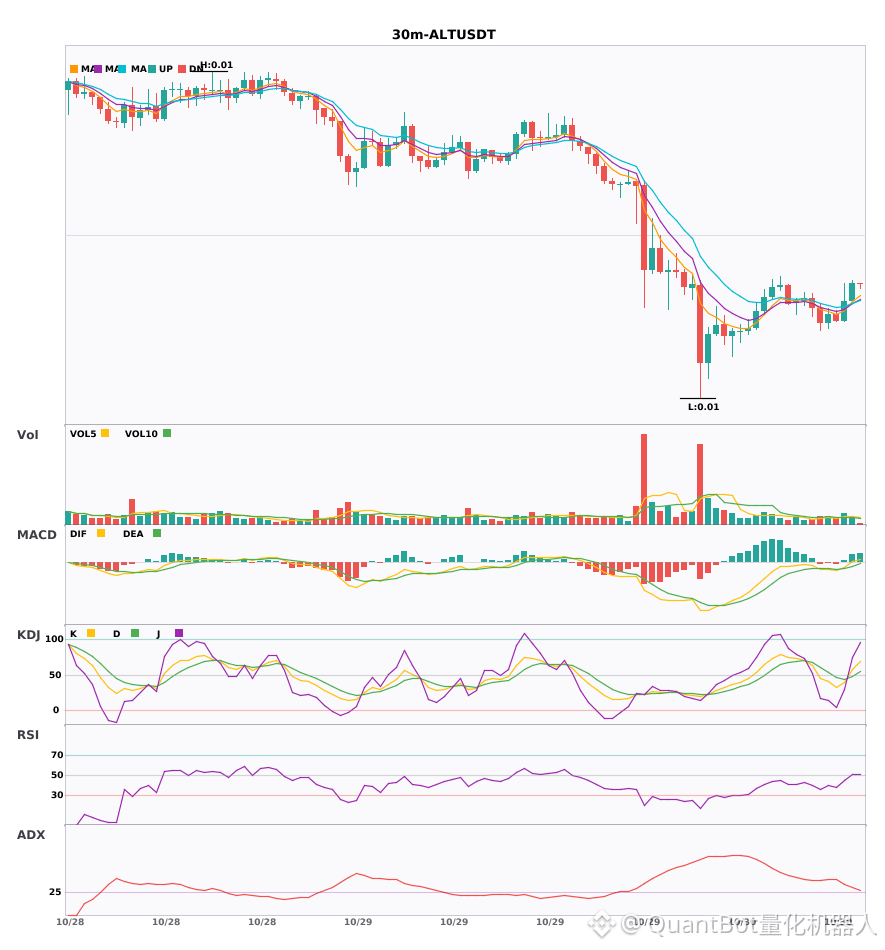
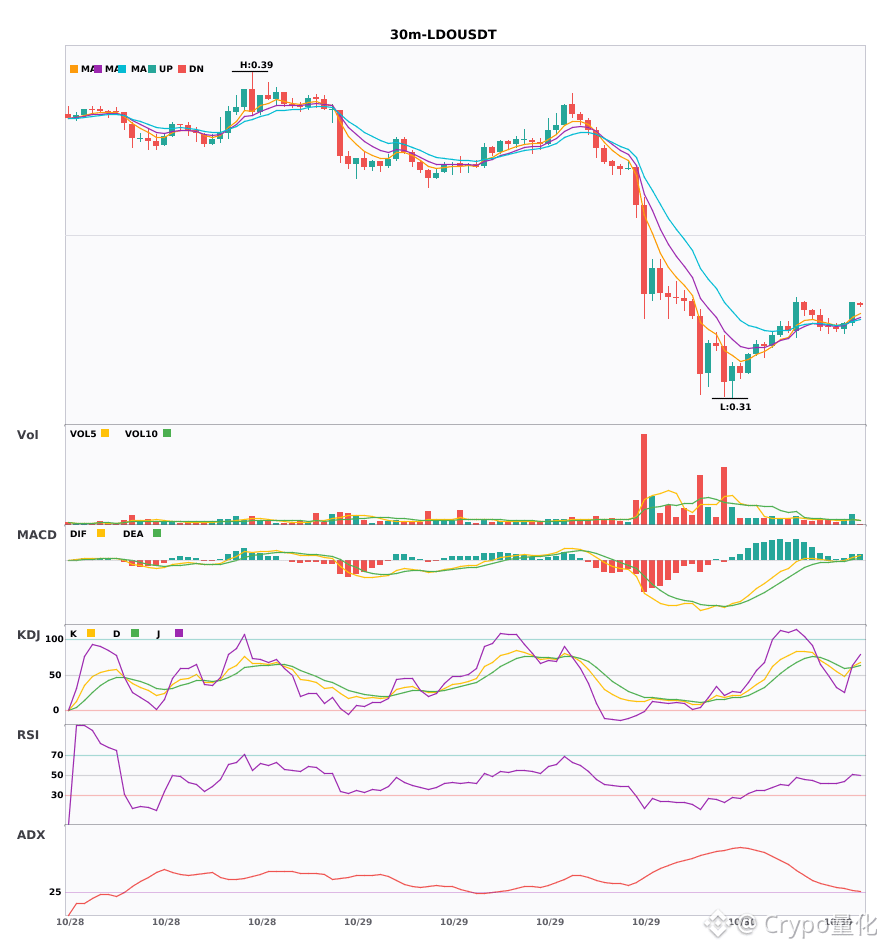
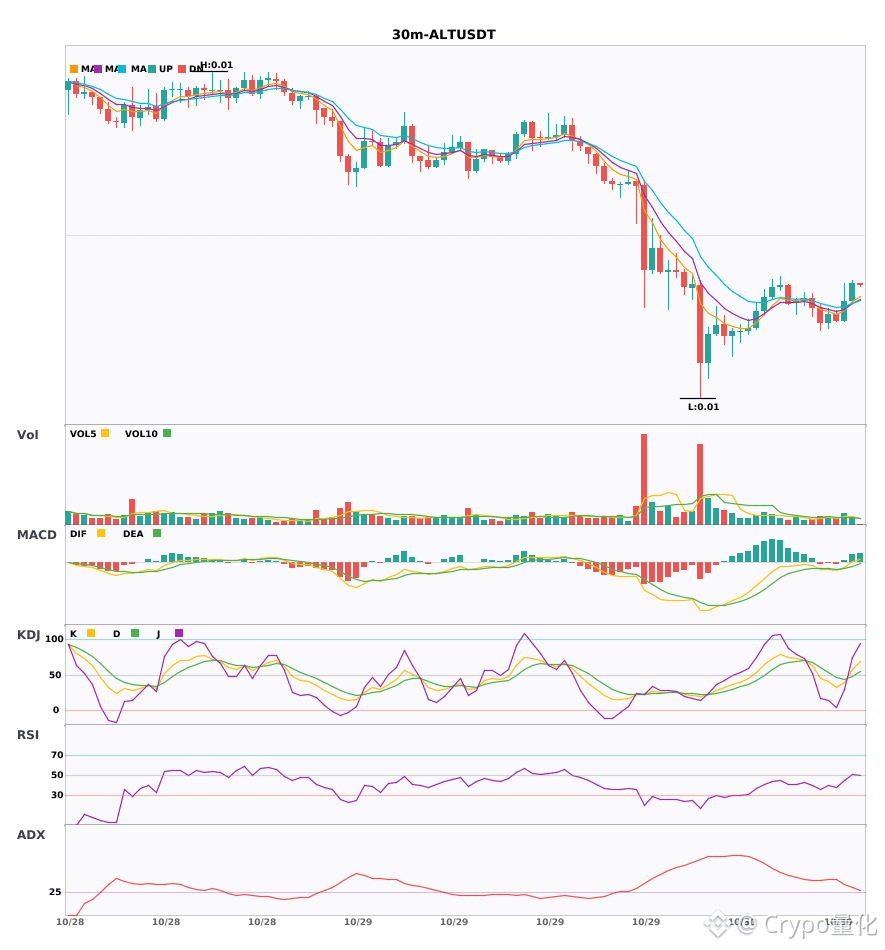
$SEI / $LDO / $ALT 30-minute technical indicators are strengthening in sync—who has greater explosive potential?
📈 $SEI | 30-minute bullish signal
━━━━━━━━━━━━━━━━━━
Technical analysis: ADX (29): Trend is forming; opportunity to participate | MACD golden cross above zero; bullish momentum is building | EMA5 > EMA8 > EMA13: bullish alignment | KDJ golden cross; short-term outlook is bullish (K: 59.6, D: 56.5) | Volume increased (1.7x)
Price change: 1.0400%
📈 $LDO | 30-minute bullish signal
━━━━━━━━━━━━━━━━━━
Technical analysis: ADX (25): Trend is forming; opportunity to participate | MACD DIF crossed above zero; trend has turned bullish | EMA5 > EMA8 > EMA13: bullish alignment | KDJ golden cross; short-term outlook is bullish (K: 61.3, D: 60.2) | Volume increased (1.8x)
Price change: 1.4700%
📈 $ALT | 30-minute bullish signal
━━━━━━━━━━━━━━━━━━
Technical analysis: ADX (28): Trend is forming; opportunity to participate | MACD DIF crossed above zero; trend has turned bullish | EMA5 crossed above EMA8; short-term outlook has turned bullish | KDJ golden cross; short-term outlook is bullish (K: 57.4, D: 48.6) | Volume increased (1.5x)
Price change: 1.0600%
━━━━━━━━━━━━━━━━━━
#技术分析 #SEI #LDO #ALT
📌 The above is for reference only and does not constitute investment advice
28

·
--
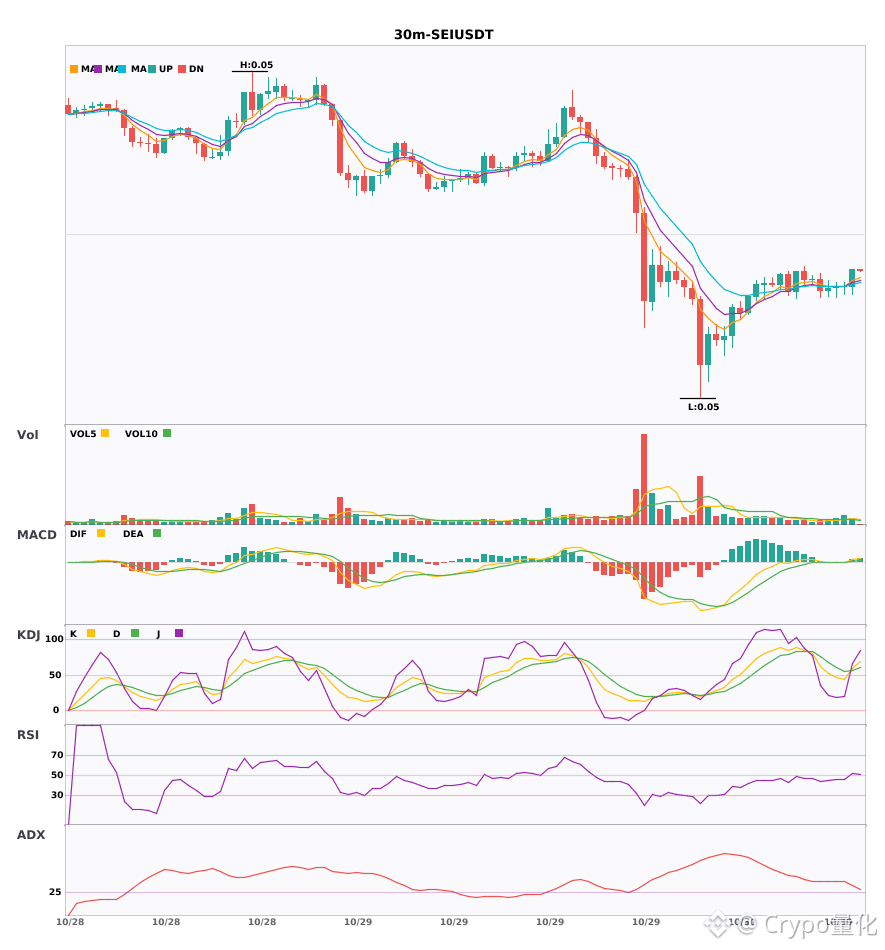
$SEI / $LDO / $ALT 30-minute bullish signals, short-term confluence opportunity 🔥
════════════════════
🔴 $SEI 30-minute bullish signal
⚠️Technical analysis: ADX(29): trend is forming; opportunity to participate | MACD golden cross above zero, bullish momentum released | EMA5 > EMA8 > EMA13, bullish alignment | KDJ golden cross, short-term outlook bullish (K: 59.6, D: 56.5) | Volume increased (1.7x)
════════════════════
🔴 $LDO 30-minute bullish signal
⚠️Technical analysis: ADX(25): trend is forming; opportunity to participate | MACD DIF broke above the zero line, trend turns bullish | EMA5 > EMA8 > EMA13, bullish alignment | KDJ golden cross, short-term outlook bullish (K: 61.3, D: 60.2) | Volume increased (1.8x)
════════════════════
🔴 $ALT 30-minute bullish signal
⚠️Technical analysis: ADX(28): trend is forming; opportunity to participate | MACD DIF broke above the zero line, trend turns bullish | EMA5 crossed above EMA8, short-term outlook turns bullish | KDJ golden cross, short-term outlook bullish (K: 57.4, D: 48.6) | Volume increased (1.5x)
════════════════════
🔔 Follow for first-hand market alerts 🔔
#技术分析 #SEI #LDO #ALT
📌 When trading, pay attention to whether the candlestick pattern confirms the signal
════════════════════
🔴 $SEI 30-minute bullish signal
⚠️Technical analysis: ADX(29): trend is forming; opportunity to participate | MACD golden cross above zero, bullish momentum released | EMA5 > EMA8 > EMA13, bullish alignment | KDJ golden cross, short-term outlook bullish (K: 59.6, D: 56.5) | Volume increased (1.7x)
════════════════════
🔴 $LDO 30-minute bullish signal
⚠️Technical analysis: ADX(25): trend is forming; opportunity to participate | MACD DIF broke above the zero line, trend turns bullish | EMA5 > EMA8 > EMA13, bullish alignment | KDJ golden cross, short-term outlook bullish (K: 61.3, D: 60.2) | Volume increased (1.8x)
════════════════════
🔴 $ALT 30-minute bullish signal
⚠️Technical analysis: ADX(28): trend is forming; opportunity to participate | MACD DIF broke above the zero line, trend turns bullish | EMA5 crossed above EMA8, short-term outlook turns bullish | KDJ golden cross, short-term outlook bullish (K: 57.4, D: 48.6) | Volume increased (1.5x)
════════════════════
🔔 Follow for first-hand market alerts 🔔
#技术分析 #SEI #LDO #ALT
📌 When trading, pay attention to whether the candlestick pattern confirms the signal
11
Log in to explore more content
Join global crypto users on Binance Square
⚡️ Get latest and useful information about crypto.
💬 Trusted by the world’s largest crypto exchange.
👍 Discover real insights from verified creators.
Email / Phone number
Trending Topics
1
#BinanceHadAlreadyCovered$6BofHackLoss
235 views
4 Discussing
2
#FBIConfirmsNorthKoreaIsResponsibleForBinanceCryptoHack
738 views
19 Discussing
3
#BinanceSAFUFundTransferCompleted7499BTC
54,825 views
1,012 Discussing
4
#BinanceRecovery90% of stolen assets
167,265 views
193 Discussing
5
#YiHe:ProofOfReserves:10TokensAt100%Backing
155,731 views
889 Discussing
6
#BackedNotBroken:RichardTengSaysUsersBearNoLoss
52,870 views
567 Discussing
7
#B14gReportsUnauthorizedTransferOfAbout97MCORE
1,430 views
57 Discussing
8
#USSpotETHETFsPost23StraightDaysOfNetOutflows
1,507 views
59 Discussing
9
#CZSaysCompensationIsinPlaceUsersAreProtected
142,566 views
1,465 Discussing
10
#IntelHasItsWorstDaySince1974
56,884 views
755 Discussing