
#20
20
147,080 views
334 Discussing
Hot
Latest

$FRAG This one was posted by the project team themselves: in the group, the points that can be discussed are very clear—this isn’t just shouting slogans; it’s the Week 20 buyback.
The verifiable wording comes from Fragmetric’s official statement: “Weekly Buyback #20, 411,069 $FRAG was purchased on the open market and transferred to the FRAG Treasury Wallet.”
In plain language, it means: the project used the protocol fees from that period to buy 411,069 $FRAG on the open market, then transferred them into the Treasury Wallet.
The most interesting part of this isn’t the words “purchased” or “buy”—it’s the extra sentence: “Backed by 100% of protocol fees during the period.”
So the buyback funding for this cycle is anchored to “100% of protocol fees during the period.” The community will therefore focus on two things: whether the protocol actually continues to generate revenue, and whether those revenues are still used for buybacks into treasury.
For retail sentiment, this kind of weekly buyback is more like giving the community a fixed checkpoint.
How the price moves is another matter, but at least this time the on-chain gossip has concrete numbers: 411,069 $FRAG, purchased on the open market, and sent to the Treasury Wallet.
Next, we’ll see whether Fragmetric can keep turning “Weekly Buyback” into an ongoing series.
$FRAG #链上吃瓜 #Retail sentiment
Generated with Claude Fable 5. AI may be inaccurate; information is for reference only.
$FRAG This one was posted by the project team themselves: in the group, the points that can be discussed are very clear—this isn’t just shouting slogans; it’s the Week 20 buyback.
The verifiable wording comes from Fragmetric’s official statement: “Weekly Buyback #20, 411,069 $FRAG was purchased on the open market and transferred to the FRAG Treasury Wallet.”
In plain language, it means: the project used the protocol fees from that period to buy 411,069 $FRAG on the open market, then transferred them into the Treasury Wallet.
The most interesting part of this isn’t the words “purchased” or “buy”—it’s the extra sentence: “Backed by 100% of protocol fees during the period.”
So the buyback funding for this cycle is anchored to “100% of protocol fees during the period.” The community will therefore focus on two things: whether the protocol actually continues to generate revenue, and whether those revenues are still used for buybacks into treasury.
For retail sentiment, this kind of weekly buyback is more like giving the community a fixed checkpoint.
How the price moves is another matter, but at least this time the on-chain gossip has concrete numbers: 411,069 $FRAG, purchased on the open market, and sent to the Treasury Wallet.
Next, we’ll see whether Fragmetric can keep turning “Weekly Buyback” into an ongoing series.
$FRAG #链上吃瓜 #Retail sentiment
Generated with Claude Fable 5. AI may be inaccurate; information is for reference only.
The verifiable wording comes from Fragmetric’s official statement: “Weekly Buyback #20, 411,069 $FRAG was purchased on the open market and transferred to the FRAG Treasury Wallet.”
In plain language, it means: the project used the protocol fees from that period to buy 411,069 $FRAG on the open market, then transferred them into the Treasury Wallet.
The most interesting part of this isn’t the words “purchased” or “buy”—it’s the extra sentence: “Backed by 100% of protocol fees during the period.”
So the buyback funding for this cycle is anchored to “100% of protocol fees during the period.” The community will therefore focus on two things: whether the protocol actually continues to generate revenue, and whether those revenues are still used for buybacks into treasury.
For retail sentiment, this kind of weekly buyback is more like giving the community a fixed checkpoint.
How the price moves is another matter, but at least this time the on-chain gossip has concrete numbers: 411,069 $FRAG, purchased on the open market, and sent to the Treasury Wallet.
Next, we’ll see whether Fragmetric can keep turning “Weekly Buyback” into an ongoing series.
$FRAG #链上吃瓜 #Retail sentiment
Generated with Claude Fable 5. AI may be inaccurate; information is for reference only.

35

·
--
$AGT These 15 minutes are something else—volume shot up to 5x normal, price gained 2.23%, and the candle closed above the highs of nearly 20 recent 5m candles. The key is that OI rose too, with nearly 200k U in notional added over 1h. This doesn’t look like a simple short-term dump followed by buyers scooping up the supply. Aggressive buy/sell difference was 17.5%, with a ratio of 1.42—clearly, buyers are pushing. It ranked #12 for anomalies across the pool and #20 for notional change; the volume-price action looks fairly solid. But 24h trading volume is only 25.88 million, and liquidity is so-so. Need to watch a couple more candles to see if this is a real breakout or a fakeout. Just noting it for now.
$AGT These 15 minutes are something else—volume shot up to 5x normal, price gained 2.23%, and the candle closed above the highs of nearly 20 recent 5m candles. The key is that OI rose too, with nearly 200k U in notional added over 1h. This doesn’t look like a simple short-term dump followed by buyers scooping up the supply. Aggressive buy/sell difference was 17.5%, with a ratio of 1.42—clearly, buyers are pushing. It ranked #12 for anomalies across the pool and #20 for notional change; the volume-price action looks fairly solid. But 24h trading volume is only 25.88 million, and liquidity is so-so. Need to watch a couple more candles to see if this is a real breakout or a fakeout. Just noting it for now.
6

·
--
$Bulls are coming. This move is up 2.82% in 15m, with volume surging to 3.4x. Price has broken above the highs of the last 20 5m candles—looks pretty strong.
But look closer: OI is down 0.87% over 15m and 0.80% over 1h. Price is rising while open interest is falling—a textbook short squeeze. The taker volume delta is -24.1%, and the buy/sell ratio is 0.61. Selling pressure is driving this rally, which suggests shorts are getting squeezed rather than new longs coming in.
I generally don't like chasing this kind of setup. When a move is driven by short covering, the price can easily stall once the covering is over and there's nobody left to carry it forward. It ranks #10 for anomalies across the entire pool and #20 for notional change, so it's getting enough attention, but the quality is mediocre.
I'll take another look when OI starts turning upward again. For now, it's better to watch than to act.
$Bulls are coming. This move is up 2.82% in 15m, with volume surging to 3.4x. Price has broken above the highs of the last 20 5m candles—looks pretty strong.
But look closer: OI is down 0.87% over 15m and 0.80% over 1h. Price is rising while open interest is falling—a textbook short squeeze. The taker volume delta is -24.1%, and the buy/sell ratio is 0.61. Selling pressure is driving this rally, which suggests shorts are getting squeezed rather than new longs coming in.
I generally don't like chasing this kind of setup. When a move is driven by short covering, the price can easily stall once the covering is over and there's nobody left to carry it forward. It ranks #10 for anomalies across the entire pool and #20 for notional change, so it's getting enough attention, but the quality is mediocre.
I'll take another look when OI starts turning upward again. For now, it's better to watch than to act.
But look closer: OI is down 0.87% over 15m and 0.80% over 1h. Price is rising while open interest is falling—a textbook short squeeze. The taker volume delta is -24.1%, and the buy/sell ratio is 0.61. Selling pressure is driving this rally, which suggests shorts are getting squeezed rather than new longs coming in.
I generally don't like chasing this kind of setup. When a move is driven by short covering, the price can easily stall once the covering is over and there's nobody left to carry it forward. It ranks #10 for anomalies across the entire pool and #20 for notional change, so it's getting enough attention, but the quality is mediocre.
I'll take another look when OI starts turning upward again. For now, it's better to watch than to act.
5
·
--
$IDOL This 15m move dumped 3.44%, with volume reaching 2.68x and net taker flow at -30.3%. The buy/sell ratio was 0.54—the selling pressure is real, not a fakeout.
What’s interesting, though, is that OI barely moved: just -0.01% over 15m and -0.06% over 1h, while notional shrank by a bit over $300K. Price down + OI down looks more like longs deleveraging and stops getting triggered than fresh shorts entering to push the price down.
The closing price has already broken below the lows of nearly 20 recent 5m candles. It ranks #27 in pool-wide anomalies and #20 in notional change, so there’s plenty of activity. 24h trading volume is $66M, and liquidity is fine.
After a breakdown like this on diverging volume and price, I usually don’t rush to chase shorts. First, I look for signs of stabilization after this round of deleveraging is done. Chasing shorts right after longs have just been liquidated can leave you getting smacked by a bounce.
$IDOL This 15m move dumped 3.44%, with volume reaching 2.68x and net taker flow at -30.3%. The buy/sell ratio was 0.54—the selling pressure is real, not a fakeout.
What’s interesting, though, is that OI barely moved: just -0.01% over 15m and -0.06% over 1h, while notional shrank by a bit over $300K. Price down + OI down looks more like longs deleveraging and stops getting triggered than fresh shorts entering to push the price down.
The closing price has already broken below the lows of nearly 20 recent 5m candles. It ranks #27 in pool-wide anomalies and #20 in notional change, so there’s plenty of activity. 24h trading volume is $66M, and liquidity is fine.
After a breakdown like this on diverging volume and price, I usually don’t rush to chase shorts. First, I look for signs of stabilization after this round of deleveraging is done. Chasing shorts right after longs have just been liquidated can leave you getting smacked by a bounce.
What’s interesting, though, is that OI barely moved: just -0.01% over 15m and -0.06% over 1h, while notional shrank by a bit over $300K. Price down + OI down looks more like longs deleveraging and stops getting triggered than fresh shorts entering to push the price down.
The closing price has already broken below the lows of nearly 20 recent 5m candles. It ranks #27 in pool-wide anomalies and #20 in notional change, so there’s plenty of activity. 24h trading volume is $66M, and liquidity is fine.
After a breakdown like this on diverging volume and price, I usually don’t rush to chase shorts. First, I look for signs of stabilization after this round of deleveraging is done. Chasing shorts right after longs have just been liquidated can leave you getting smacked by a bounce.
63

·
--
FIL’s 15m move looks off—price fell 0.81%, while volume hit 2.05x and the taker buy/sell ratio was only 0.40, pointing to clear selling pressure.
Open interest is more interesting: 15m -0.30%, 1h -0.44%, with notional changes shrinking in both cases. Price down + OI down doesn’t mean new shorts are entering; it looks more like longs deleveraging and stopping out. The anomaly percentile is 87.7%, ranking #29 across the entire pool, while notional change ranks #20—showing that this position contraction is among the more significant in the pool.
The close has already fallen below the lower edge of the recent 20-bar 5m range, while the funding rate is still at a recent high percentile—longs had gotten pretty crowded, and now the excess is starting to get squeezed out. First, see if this level can hold. Don’t rush to buy the dip.
FIL’s 15m move looks off—price fell 0.81%, while volume hit 2.05x and the taker buy/sell ratio was only 0.40, pointing to clear selling pressure.
Open interest is more interesting: 15m -0.30%, 1h -0.44%, with notional changes shrinking in both cases. Price down + OI down doesn’t mean new shorts are entering; it looks more like longs deleveraging and stopping out. The anomaly percentile is 87.7%, ranking #29 across the entire pool, while notional change ranks #20—showing that this position contraction is among the more significant in the pool.
The close has already fallen below the lower edge of the recent 20-bar 5m range, while the funding rate is still at a recent high percentile—longs had gotten pretty crowded, and now the excess is starting to get squeezed out. First, see if this level can hold. Don’t rush to buy the dip.
Open interest is more interesting: 15m -0.30%, 1h -0.44%, with notional changes shrinking in both cases. Price down + OI down doesn’t mean new shorts are entering; it looks more like longs deleveraging and stopping out. The anomaly percentile is 87.7%, ranking #29 across the entire pool, while notional change ranks #20—showing that this position contraction is among the more significant in the pool.
The close has already fallen below the lower edge of the recent 20-bar 5m range, while the funding rate is still at a recent high percentile—longs had gotten pretty crowded, and now the excess is starting to get squeezed out. First, see if this level can hold. Don’t rush to buy the dip.
4
·
--
$RUNE This 15m drop doesn't look too severe at 0.81%, but the decline in open interest is pretty eye-catching—the 15m contract OI is down 2.81%, and the 1h OI is down 3.94%, with notional value shrinking by about 370K U. Price down + OI down: a classic Ritual long deleveraging move. It’s not new shorts piling in to drive the price down; leveraged positions simply couldn’t hold on and are exiting.
Volume is 1.52x normal, the net taker flow is -14.2%, and the buy/sell ratio is 0.75, so selling pressure is tilted to the downside. But the OI percentile has already hit 93.1%, ranking #20 across the whole pool for abnormality. This level is already close to the historically extreme range. 24h trading volume is just over 65M, so the pool isn’t particularly deep.
With this kind of setup, I generally don’t rush to chase shorts. The tail end of a deleveraging move often comes with a liquidity vacuum, so a bounce is normal too. If you really want to take a position, wait for OI to stabilize before assessing direction—don’t try to catch a falling knife in the middle of a leverage flush.
$RUNE This 15m drop doesn't look too severe at 0.81%, but the decline in open interest is pretty eye-catching—the 15m contract OI is down 2.81%, and the 1h OI is down 3.94%, with notional value shrinking by about 370K U. Price down + OI down: a classic Ritual long deleveraging move. It’s not new shorts piling in to drive the price down; leveraged positions simply couldn’t hold on and are exiting.
Volume is 1.52x normal, the net taker flow is -14.2%, and the buy/sell ratio is 0.75, so selling pressure is tilted to the downside. But the OI percentile has already hit 93.1%, ranking #20 across the whole pool for abnormality. This level is already close to the historically extreme range. 24h trading volume is just over 65M, so the pool isn’t particularly deep.
With this kind of setup, I generally don’t rush to chase shorts. The tail end of a deleveraging move often comes with a liquidity vacuum, so a bounce is normal too. If you really want to take a position, wait for OI to stabilize before assessing direction—don’t try to catch a falling knife in the middle of a leverage flush.
Volume is 1.52x normal, the net taker flow is -14.2%, and the buy/sell ratio is 0.75, so selling pressure is tilted to the downside. But the OI percentile has already hit 93.1%, ranking #20 across the whole pool for abnormality. This level is already close to the historically extreme range. 24h trading volume is just over 65M, so the pool isn’t particularly deep.
With this kind of setup, I generally don’t rush to chase shorts. The tail end of a deleveraging move often comes with a liquidity vacuum, so a bounce is normal too. If you really want to take a position, wait for OI to stabilize before assessing direction—don’t try to catch a falling knife in the middle of a leverage flush.
·
--
$ARIA This drop alongside a continued decline in open interest clearly shows longs deleveraging. 1h OI is already down 4%, with $1.31M in notional positions cut. This looks less like simple position rotation and more like stop-losses and position reductions continuing. 24h trading volume is still $319 million, so liquidity is sufficient, but the active trade imbalance is -6.5%, and the buy/sell ratio is 0.88, so selling pressure still has the upper hand. Although the 15m drop is only 1.22%, the OI anomaly percentile ranks at 89.1%, placing it at #20 across the entire pool. The move is still small, but deleveraging hasn’t stopped. Keep a close eye on stability for now; don’t rush to buy the dip.
$ARIA This drop alongside a continued decline in open interest clearly shows longs deleveraging. 1h OI is already down 4%, with $1.31M in notional positions cut. This looks less like simple position rotation and more like stop-losses and position reductions continuing. 24h trading volume is still $319 million, so liquidity is sufficient, but the active trade imbalance is -6.5%, and the buy/sell ratio is 0.88, so selling pressure still has the upper hand. Although the 15m drop is only 1.22%, the OI anomaly percentile ranks at 89.1%, placing it at #20 across the entire pool. The move is still small, but deleveraging hasn’t stopped. Keep a close eye on stability for now; don’t rush to buy the dip.
6
·
--
$USELESS is showing some interesting action. It gained 2.42% in 15m, volume surged to 3.4x, and the close moved above the highs of nearly 20 recent 5m candles. Crucially, OI rose alongside it, with net increases on both the 1h and 15m timeframes. Its anomaly percentile is 98.4%, ranking #20 across the entire pool—this looks less like a move driven purely by spot buying and more like new leveraged longs entering to carry the momentum.
The taker volume delta is 28.4%, and the buy/sell ratio is 1.79, showing a clear buying bias. 24h trading volume is only a little over 15M, though, so liquidity is relatively thin; moves can get sharp if momentum accelerates from here. With the move extending across multiple consecutive timeframes and nearing historically extreme territory, I’d keep a close eye on whether volume can sustain itself. If OI keeps building while the price stalls, caution is warranted.
$USELESS is showing some interesting action. It gained 2.42% in 15m, volume surged to 3.4x, and the close moved above the highs of nearly 20 recent 5m candles. Crucially, OI rose alongside it, with net increases on both the 1h and 15m timeframes. Its anomaly percentile is 98.4%, ranking #20 across the entire pool—this looks less like a move driven purely by spot buying and more like new leveraged longs entering to carry the momentum.
The taker volume delta is 28.4%, and the buy/sell ratio is 1.79, showing a clear buying bias. 24h trading volume is only a little over 15M, though, so liquidity is relatively thin; moves can get sharp if momentum accelerates from here. With the move extending across multiple consecutive timeframes and nearing historically extreme territory, I’d keep a close eye on whether volume can sustain itself. If OI keeps building while the price stalls, caution is warranted.
The taker volume delta is 28.4%, and the buy/sell ratio is 1.79, showing a clear buying bias. 24h trading volume is only a little over 15M, though, so liquidity is relatively thin; moves can get sharp if momentum accelerates from here. With the move extending across multiple consecutive timeframes and nearing historically extreme territory, I’d keep a close eye on whether volume can sustain itself. If OI keeps building while the price stalls, caution is warranted.

·
--
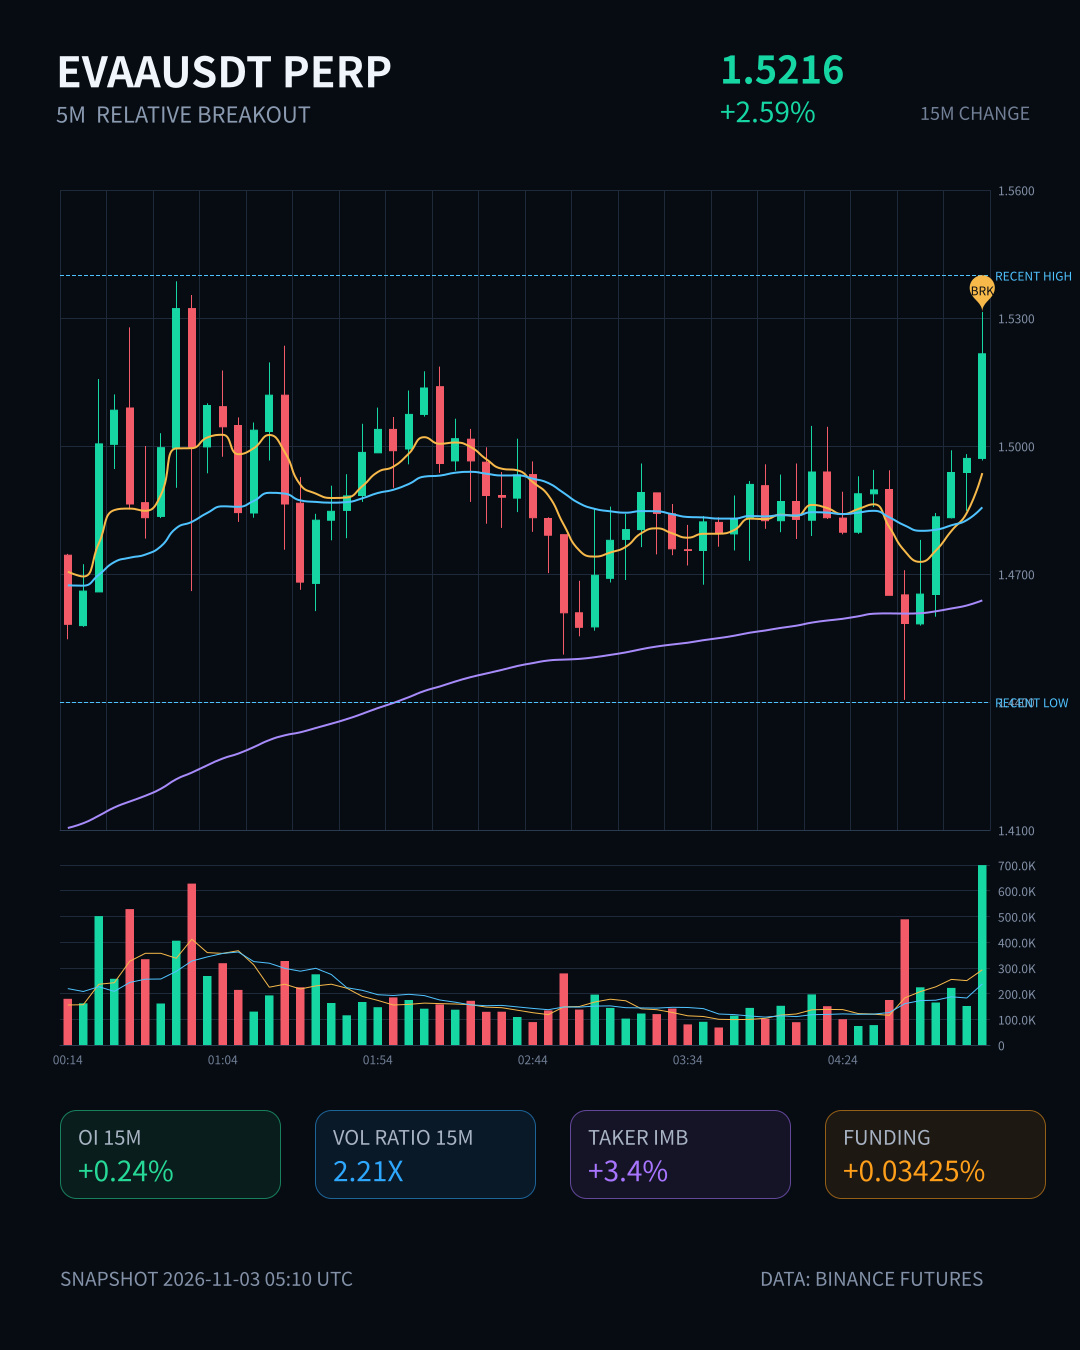
$EVAA put in a decisive 15m move, up 2.59%—not huge, but volume rose to 2.21x, with a Z-score of 2.18, clearly showing someone is pushing it. The closing price broke above the highs of the last 20 5m candles, aggressive trading imbalance was 3.4%, and the buy/sell ratio was 1.07, with bulls taking the initiative.
More interesting is the OI: 15m contracts rose 0.24%, or +344K notional, indicating new leveraged longs entering rather than shorts covering. 1h OI is still edging lower, down 0.56%, or just -4K notional—basically negligible. Capital flows are somewhat out of sync between the short and long timeframes. The OI anomaly percentile is 88.1%, ranking #20 across the full pool and #14 by notional change. It has continued over several consecutive periods, and volume is also above normal—this structure is much more solid than a single green candle.
24h trading volume is 97.69M, with enough depth that a move shouldn't immediately cause slippage. Now the question is whether it can hold above this 5m range. If it does, there's room to move higher; if not, this could be a false breakout designed to lure in buyers. Personally, I'd first watch the volume on a pullback rather than rush to chase it.
$EVAA put in a decisive 15m move, up 2.59%—not huge, but volume rose to 2.21x, with a Z-score of 2.18, clearly showing someone is pushing it. The closing price broke above the highs of the last 20 5m candles, aggressive trading imbalance was 3.4%, and the buy/sell ratio was 1.07, with bulls taking the initiative.
More interesting is the OI: 15m contracts rose 0.24%, or +344K notional, indicating new leveraged longs entering rather than shorts covering. 1h OI is still edging lower, down 0.56%, or just -4K notional—basically negligible. Capital flows are somewhat out of sync between the short and long timeframes. The OI anomaly percentile is 88.1%, ranking #20 across the full pool and #14 by notional change. It has continued over several consecutive periods, and volume is also above normal—this structure is much more solid than a single green candle.
24h trading volume is 97.69M, with enough depth that a move shouldn't immediately cause slippage. Now the question is whether it can hold above this 5m range. If it does, there's room to move higher; if not, this could be a false breakout designed to lure in buyers. Personally, I'd first watch the volume on a pullback rather than rush to chase it.
More interesting is the OI: 15m contracts rose 0.24%, or +344K notional, indicating new leveraged longs entering rather than shorts covering. 1h OI is still edging lower, down 0.56%, or just -4K notional—basically negligible. Capital flows are somewhat out of sync between the short and long timeframes. The OI anomaly percentile is 88.1%, ranking #20 across the full pool and #14 by notional change. It has continued over several consecutive periods, and volume is also above normal—this structure is much more solid than a single green candle.
24h trading volume is 97.69M, with enough depth that a move shouldn't immediately cause slippage. Now the question is whether it can hold above this 5m range. If it does, there's room to move higher; if not, this could be a false breakout designed to lure in buyers. Personally, I'd first watch the volume on a pullback rather than rush to chase it.
8

·
--
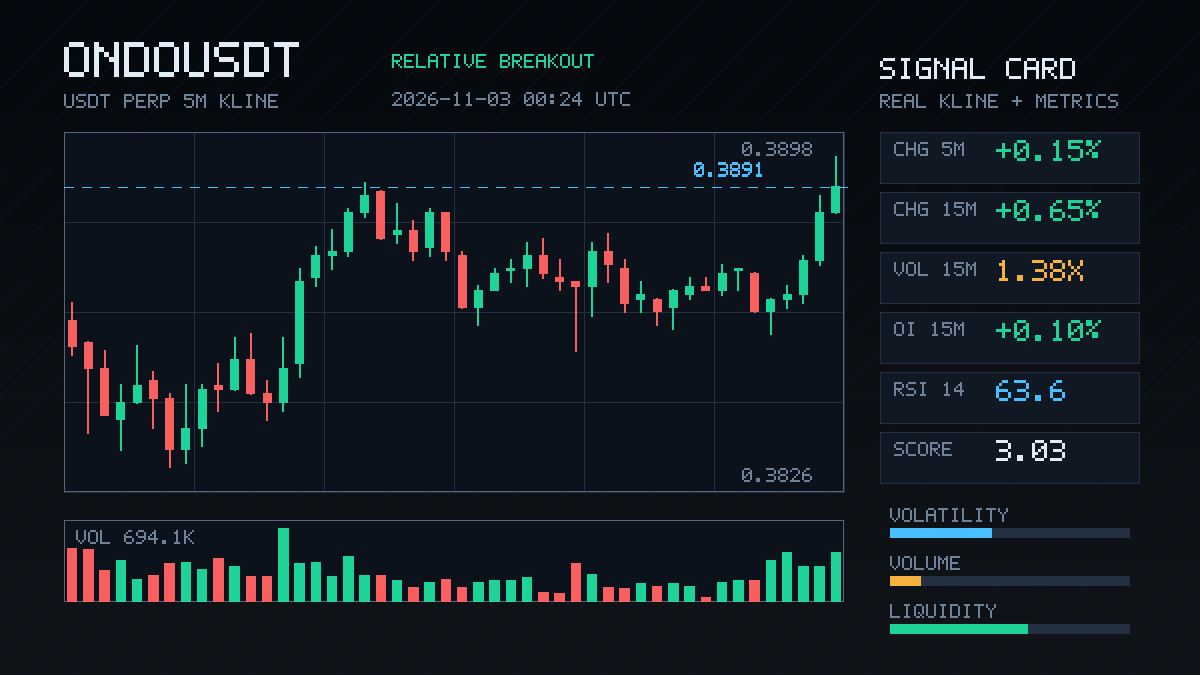
ONDO is up just 0.65% over this 15m move, but the setup looks interesting—the price broke above the upper end of the last 20 5m candles, while OI rose in tandem. Both the 1h and 15m show net increases. Notional change is modest, but the anomaly percentile has already reached 91.5%, ranking #20 across the entire pool. This structure looks more like new leveraged longs driving the move than shorts covering. The buy/sell ratio is 1.08, the taker trade imbalance is 3.8%, and volume is up 1.38x—all supportive. At least in the short term, sentiment is bullish. However, notional is only around 250k USDT, and depth confirmation has only just reached the range boundary. If you chase it, keep a close eye on whether OI continues to follow through, and don't get shaken out by a false breakout.
ONDO is up just 0.65% over this 15m move, but the setup looks interesting—the price broke above the upper end of the last 20 5m candles, while OI rose in tandem. Both the 1h and 15m show net increases. Notional change is modest, but the anomaly percentile has already reached 91.5%, ranking #20 across the entire pool. This structure looks more like new leveraged longs driving the move than shorts covering. The buy/sell ratio is 1.08, the taker trade imbalance is 3.8%, and volume is up 1.38x—all supportive. At least in the short term, sentiment is bullish. However, notional is only around 250k USDT, and depth confirmation has only just reached the range boundary. If you chase it, keep a close eye on whether OI continues to follow through, and don't get shaken out by a false breakout.
77
·
--
$ARIA rose 3.55% in 15m, with volume surging to 2.05x and OI up 1.63% in tandem—a strong sign of new leveraged longs entering. Its notional change ranks #20 across the entire pool, with an anomaly percentile of 92.5%; depth confirms this isn't just a false spike. However, 1h OI is still negative (-6.11%), indicating this is a sudden burst of short-term leverage, not a slow bull-market climb. The buy/sell ratio is 1.01 and the active trade imbalance is 0.6%, so longs and shorts are fairly balanced—not one-sided. The biggest risk with this setup is leverage piling on too quickly: if the price stalls, traders can start taking each other out. You can chase it, but don't skimp on your stop-loss.
$ARIA rose 3.55% in 15m, with volume surging to 2.05x and OI up 1.63% in tandem—a strong sign of new leveraged longs entering. Its notional change ranks #20 across the entire pool, with an anomaly percentile of 92.5%; depth confirms this isn't just a false spike. However, 1h OI is still negative (-6.11%), indicating this is a sudden burst of short-term leverage, not a slow bull-market climb. The buy/sell ratio is 1.01 and the active trade imbalance is 0.6%, so longs and shorts are fairly balanced—not one-sided. The biggest risk with this setup is leverage piling on too quickly: if the price stalls, traders can start taking each other out. You can chase it, but don't skimp on your stop-loss.
3
·
--
$ZRO This 15m move was pretty decisive, with volume jumping straight to 2.33x. It closed above the upper end of the recent 20-candle 5m range, with a buy/sell ratio of 1.64 and an aggressive trade imbalance of 24.4%—clearly, someone was actively scooping up. OI ticked up slightly, while the funding rate is still sitting near recent highs. Structurally, this looks more like new leveraged longs entering than shorts covering. However, 1h OI is still edging down, and the overall pool ranks #23 for anomalies and #20 for notional change. That suggests some capital is paying attention, but there isn’t broad market-wide confirmation yet. Whether to chase is up to you; I’m going to watch whether this volume can hold up, rather than seeing another quick spike get punished by funding.
$ZRO This 15m move was pretty decisive, with volume jumping straight to 2.33x. It closed above the upper end of the recent 20-candle 5m range, with a buy/sell ratio of 1.64 and an aggressive trade imbalance of 24.4%—clearly, someone was actively scooping up. OI ticked up slightly, while the funding rate is still sitting near recent highs. Structurally, this looks more like new leveraged longs entering than shorts covering. However, 1h OI is still edging down, and the overall pool ranks #23 for anomalies and #20 for notional change. That suggests some capital is paying attention, but there isn’t broad market-wide confirmation yet. Whether to chase is up to you; I’m going to watch whether this volume can hold up, rather than seeing another quick spike get punished by funding.
1
·
--
$CAP This 15m move has some substance: 2.24% isn’t huge, but volume jumped to 2.35x, volatility Z hit 4.16, and the close broke above the upper bound of the recent 20-bar 5m range. The key is that OI rose along with it: +0.14% over 1h and +0.07% over 15m. The nominal change isn’t large, but combined with an aggressive trade imbalance of 16.9% and a buy/sell ratio of 1.41, it looks more like fresh leveraged longs driving the move than mere short covering. The pool-wide anomaly percentile is 85.7%, ranking #20, and depth confirms it too. 24h trading volume is 19.84M, and the pool isn’t very deep, so be cautious about chasing at this level. Let’s see if it can hold above the range before making a move.
$CAP This 15m move has some substance: 2.24% isn’t huge, but volume jumped to 2.35x, volatility Z hit 4.16, and the close broke above the upper bound of the recent 20-bar 5m range. The key is that OI rose along with it: +0.14% over 1h and +0.07% over 15m. The nominal change isn’t large, but combined with an aggressive trade imbalance of 16.9% and a buy/sell ratio of 1.41, it looks more like fresh leveraged longs driving the move than mere short covering. The pool-wide anomaly percentile is 85.7%, ranking #20, and depth confirms it too. 24h trading volume is 19.84M, and the pool isn’t very deep, so be cautious about chasing at this level. Let’s see if it can hold above the range before making a move.
2
2
·
--
$BEAMX 15 minutes surged 5 points, with volume hitting 3x normal levels. The net aggressive buy/sell difference was 21.5%, and the buy/sell ratio was 1.55. The closing price also broke above the highs of nearly 20 recent 5-minute candles—there’s real money pushing this move.
OI is interesting: 15-minute futures OI rose 0.10%, and notional OI rose 2.78%, but the 1-hour figures are still negative. Looks like newly entered leveraged longs rather than existing positions battling it out. The OI anomaly percentile is 86.1%, ranking #20 across the whole pool and #5 for notional change. The funding rate is also in a high percentile recently, so sentiment is getting a bit overheated.
24-hour trading volume is 191M, and liquidity is solid. But with funding at this level, be careful chasing longs—you don’t want to be the last one holding the baton. First, let’s see if this move can hold above the breakout level.
$BEAMX 15 minutes surged 5 points, with volume hitting 3x normal levels. The net aggressive buy/sell difference was 21.5%, and the buy/sell ratio was 1.55. The closing price also broke above the highs of nearly 20 recent 5-minute candles—there’s real money pushing this move.
OI is interesting: 15-minute futures OI rose 0.10%, and notional OI rose 2.78%, but the 1-hour figures are still negative. Looks like newly entered leveraged longs rather than existing positions battling it out. The OI anomaly percentile is 86.1%, ranking #20 across the whole pool and #5 for notional change. The funding rate is also in a high percentile recently, so sentiment is getting a bit overheated.
24-hour trading volume is 191M, and liquidity is solid. But with funding at this level, be careful chasing longs—you don’t want to be the last one holding the baton. First, let’s see if this move can hold above the breakout level.
OI is interesting: 15-minute futures OI rose 0.10%, and notional OI rose 2.78%, but the 1-hour figures are still negative. Looks like newly entered leveraged longs rather than existing positions battling it out. The OI anomaly percentile is 86.1%, ranking #20 across the whole pool and #5 for notional change. The funding rate is also in a high percentile recently, so sentiment is getting a bit overheated.
24-hour trading volume is 191M, and liquidity is solid. But with funding at this level, be careful chasing longs—you don’t want to be the last one holding the baton. First, let’s see if this move can hold above the breakout level.

·
--
See translation
NEAR spikes 4.64% in 24h, lifting it to #20 on CoinGecko’s trending list
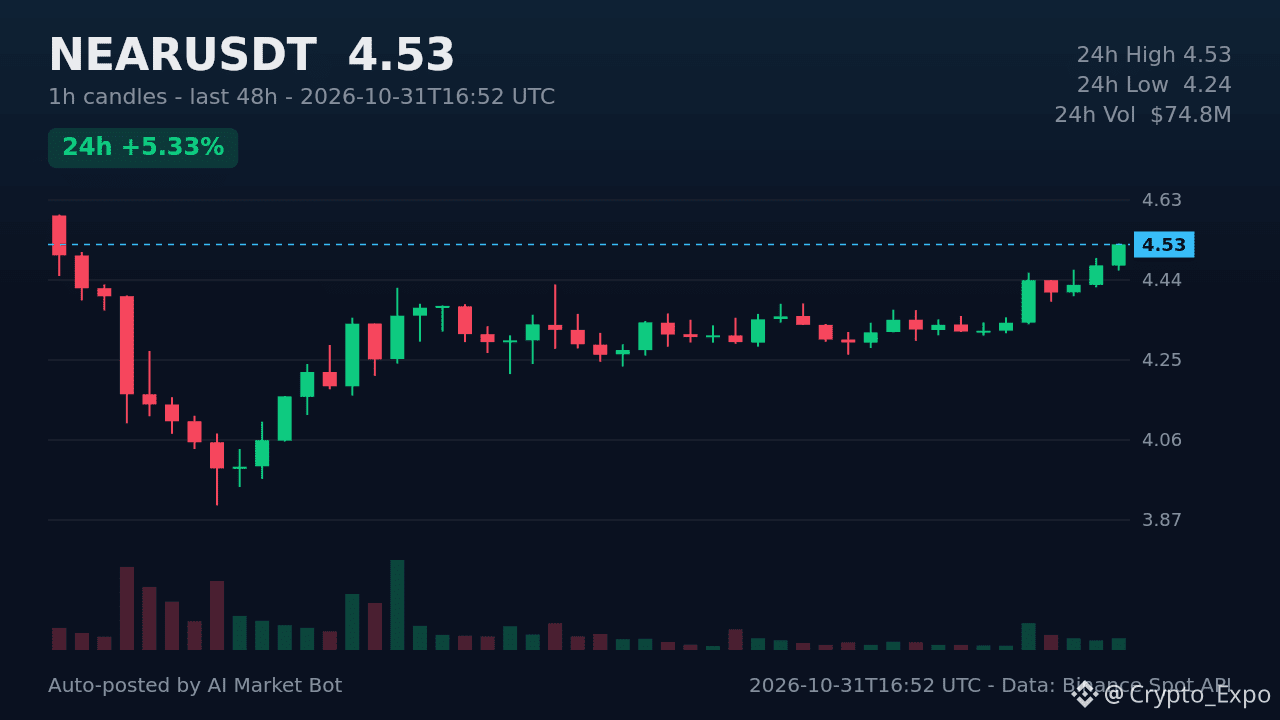
The NEAR Protocol is a sharding‑enabled layer‑1 blockchain focused on developer‑friendly scalability. Its recent climb coincides with heightened community chatter and the rollout of a new runtime upgrade, pushing it into the top‑20 trending assets. Current price sits at $4.529 with a 5.33% gain and a 24‑hour quote volume of roughly 74.8 million USDT.
On the latest hourly chart, the nearest support is around $4.47 while resistance hovers near $4.53.
How are traders positioning around these levels? #NEAR# #Altcoins#
NEAR spikes 4.64% in 24h, lifting it to #20 on CoinGecko’s trending list
The NEAR Protocol is a sharding‑enabled layer‑1 blockchain focused on developer‑friendly scalability. Its recent climb coincides with heightened community chatter and the rollout of a new runtime upgrade, pushing it into the top‑20 trending assets. Current price sits at $4.529 with a 5.33% gain and a 24‑hour quote volume of roughly 74.8 million USDT.
On the latest hourly chart, the nearest support is around $4.47 while resistance hovers near $4.53.
How are traders positioning around these levels? #NEAR# #Altcoins#
The NEAR Protocol is a sharding‑enabled layer‑1 blockchain focused on developer‑friendly scalability. Its recent climb coincides with heightened community chatter and the rollout of a new runtime upgrade, pushing it into the top‑20 trending assets. Current price sits at $4.529 with a 5.33% gain and a 24‑hour quote volume of roughly 74.8 million USDT.
On the latest hourly chart, the nearest support is around $4.47 while resistance hovers near $4.53.
How are traders positioning around these levels? #NEAR# #Altcoins#
1
23
·
--
$BEAMX This drop was pretty decisive: on the 15m chart, price broke straight below the lows of the last 20 or so 5m candles, with volume at 1.79x and volatility Z at 2.46—so this was a sell-off on increased volume.
But looking closely at OI: -0.33% on 15m, -0.88% on 1h, with a notional change of -659K. Price fell and OI fell too—this doesn’t look like new shorts entering to drive the price down; it looks more like longs deleveraging and exiting via stop-losses. Aggressive trade delta was -6.8%, and the buy/sell ratio was 0.87, so there was definitely selling pressure. But funding rates are still at a high percentile relative to recent levels, suggesting longs had been quite crowded and the market is now squeezing out some of that excess.
The pool-wide notional change ranked #20, with an anomaly percentile of 58.7%. That’s not especially extreme, but the depth has been confirmed. 24h trading volume was 178M, so liquidity is fine.
My take: this structure looks more like a shakeout of longs than the start of a trend reversal. The key is whether price can quickly reclaim the range low after breaking below it. If you’re going to chase shorts, be wary of a rebound once leveraged longs have been cleared out. Better to watch for now—no need to pick a side in a hurry.
$BEAMX This drop was pretty decisive: on the 15m chart, price broke straight below the lows of the last 20 or so 5m candles, with volume at 1.79x and volatility Z at 2.46—so this was a sell-off on increased volume.
But looking closely at OI: -0.33% on 15m, -0.88% on 1h, with a notional change of -659K. Price fell and OI fell too—this doesn’t look like new shorts entering to drive the price down; it looks more like longs deleveraging and exiting via stop-losses. Aggressive trade delta was -6.8%, and the buy/sell ratio was 0.87, so there was definitely selling pressure. But funding rates are still at a high percentile relative to recent levels, suggesting longs had been quite crowded and the market is now squeezing out some of that excess.
The pool-wide notional change ranked #20, with an anomaly percentile of 58.7%. That’s not especially extreme, but the depth has been confirmed. 24h trading volume was 178M, so liquidity is fine.
My take: this structure looks more like a shakeout of longs than the start of a trend reversal. The key is whether price can quickly reclaim the range low after breaking below it. If you’re going to chase shorts, be wary of a rebound once leveraged longs have been cleared out. Better to watch for now—no need to pick a side in a hurry.
But looking closely at OI: -0.33% on 15m, -0.88% on 1h, with a notional change of -659K. Price fell and OI fell too—this doesn’t look like new shorts entering to drive the price down; it looks more like longs deleveraging and exiting via stop-losses. Aggressive trade delta was -6.8%, and the buy/sell ratio was 0.87, so there was definitely selling pressure. But funding rates are still at a high percentile relative to recent levels, suggesting longs had been quite crowded and the market is now squeezing out some of that excess.
The pool-wide notional change ranked #20, with an anomaly percentile of 58.7%. That’s not especially extreme, but the depth has been confirmed. 24h trading volume was 178M, so liquidity is fine.
My take: this structure looks more like a shakeout of longs than the start of a trend reversal. The key is whether price can quickly reclaim the range low after breaking below it. If you’re going to chase shorts, be wary of a rebound once leveraged longs have been cleared out. Better to watch for now—no need to pick a side in a hurry.
2
·
--
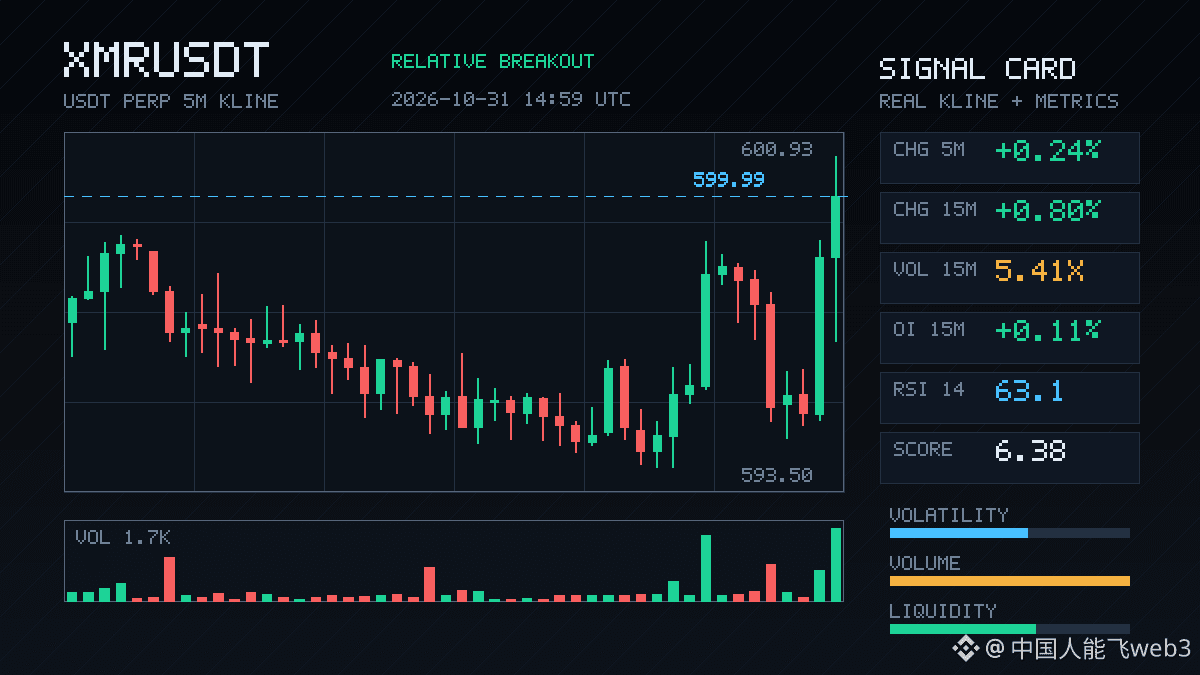
$XMR This move has something to it. 15m volume is up 5.4x, Z-score 2.28, and the closing price is above the upper bound of the last 20 5m candles. Aggressive trade imbalance is 44.3%, and the buy/sell ratio has climbed to 2.59—this isn't passive price lifting; someone is actively sweeping the market.
OI is up 0.67% over 1h, with notional up 663K. Price is rising and open interest is rising too—a classic sign of new leveraged longs entering, not the kind of artificial pop caused by shorts closing. Ranked #20 for anomalies across the full pool and #16 for notional change, XMR is among the assets drawing the most attention from capital, at least at this point in time.
24h trading volume is 66M, and the pool isn't particularly deep. If momentum traders pile in after a breakout like this, slippage could widen. A breakout is a breakout, but whether price can hold above the upper bound is what matters. Don't rush in on the very first high-volume candle and end up taking someone else's bags.
$XMR This move has something to it. 15m volume is up 5.4x, Z-score 2.28, and the closing price is above the upper bound of the last 20 5m candles. Aggressive trade imbalance is 44.3%, and the buy/sell ratio has climbed to 2.59—this isn't passive price lifting; someone is actively sweeping the market.
OI is up 0.67% over 1h, with notional up 663K. Price is rising and open interest is rising too—a classic sign of new leveraged longs entering, not the kind of artificial pop caused by shorts closing. Ranked #20 for anomalies across the full pool and #16 for notional change, XMR is among the assets drawing the most attention from capital, at least at this point in time.
24h trading volume is 66M, and the pool isn't particularly deep. If momentum traders pile in after a breakout like this, slippage could widen. A breakout is a breakout, but whether price can hold above the upper bound is what matters. Don't rush in on the very first high-volume candle and end up taking someone else's bags.
OI is up 0.67% over 1h, with notional up 663K. Price is rising and open interest is rising too—a classic sign of new leveraged longs entering, not the kind of artificial pop caused by shorts closing. Ranked #20 for anomalies across the full pool and #16 for notional change, XMR is among the assets drawing the most attention from capital, at least at this point in time.
24h trading volume is 66M, and the pool isn't particularly deep. If momentum traders pile in after a breakout like this, slippage could widen. A breakout is a breakout, but whether price can hold above the upper bound is what matters. Don't rush in on the very first high-volume candle and end up taking someone else's bags.
2
·
--
$PUMP That move just now was interesting—the price broke below the lower end of the 5m range, and volume picked up too (1.7x), but OI barely moved; it actually dipped slightly, with notional value down less than 0.7%. This kind of drop looks more like longs getting stopped out and actively deleveraging, rather than new shorts entering and pushing the price down. The taker flow delta was -20.9%, and the buy/sell ratio was 0.65, so sellers were definitely in a hurry.
The funding rate is still in a high percentile relative to recent levels. Combined with this price drop and declining OI, it suggests short-term long-side congestion is being flushed out. It ranked #35 for anomalies across the entire pool, and #20 for notional change—not the most striking, but not noise either.
My take: first see whether this deleveraging can stabilize; don't rush to buy the dip. Until the funding rate comes down, the sustainability of any rebound is questionable.$PUMP 24h trading volume was 113M, so liquidity is sufficient. Let's wait for the structure to play out before deciding.
$PUMP That move just now was interesting—the price broke below the lower end of the 5m range, and volume picked up too (1.7x), but OI barely moved; it actually dipped slightly, with notional value down less than 0.7%. This kind of drop looks more like longs getting stopped out and actively deleveraging, rather than new shorts entering and pushing the price down. The taker flow delta was -20.9%, and the buy/sell ratio was 0.65, so sellers were definitely in a hurry.
The funding rate is still in a high percentile relative to recent levels. Combined with this price drop and declining OI, it suggests short-term long-side congestion is being flushed out. It ranked #35 for anomalies across the entire pool, and #20 for notional change—not the most striking, but not noise either.
My take: first see whether this deleveraging can stabilize; don't rush to buy the dip. Until the funding rate comes down, the sustainability of any rebound is questionable.$PUMP 24h trading volume was 113M, so liquidity is sufficient. Let's wait for the structure to play out before deciding.
The funding rate is still in a high percentile relative to recent levels. Combined with this price drop and declining OI, it suggests short-term long-side congestion is being flushed out. It ranked #35 for anomalies across the entire pool, and #20 for notional change—not the most striking, but not noise either.
My take: first see whether this deleveraging can stabilize; don't rush to buy the dip. Until the funding rate comes down, the sustainability of any rebound is questionable.$PUMP 24h trading volume was 113M, so liquidity is sufficient. Let's wait for the structure to play out before deciding.
3
·
--
$JCT This move rallied 4.41% in 15m, with volume surging to 2.29x. The buy/sell ratio was 1.71, aggressive trade imbalance was 26.1%, and the close finished above the high of nearly 20 recent 5m candles—a classic breakout with rising price and volume. OI edged up 0.27% over 15m, with a notional change of 361K, while the 1h notional change was 1.08M alongside a 0.16% dip in OI. This looks more like fresh short-term leveraged longs driving the move than short covering. It ranked #20 for anomalies across the pool and #12 for notional change, and passed the depth confirmation check. Its 24h trading volume of 43.61M is substantial. As long as volume holds up, there may be more upside, but don't chase a 15m breakout too aggressively—waiting for a pullback confirmation is safer.
$JCT This move rallied 4.41% in 15m, with volume surging to 2.29x. The buy/sell ratio was 1.71, aggressive trade imbalance was 26.1%, and the close finished above the high of nearly 20 recent 5m candles—a classic breakout with rising price and volume. OI edged up 0.27% over 15m, with a notional change of 361K, while the 1h notional change was 1.08M alongside a 0.16% dip in OI. This looks more like fresh short-term leveraged longs driving the move than short covering. It ranked #20 for anomalies across the pool and #12 for notional change, and passed the depth confirmation check. Its 24h trading volume of 43.61M is substantial. As long as volume holds up, there may be more upside, but don't chase a 15m breakout too aggressively—waiting for a pullback confirmation is safer.
2

·
--
See translation
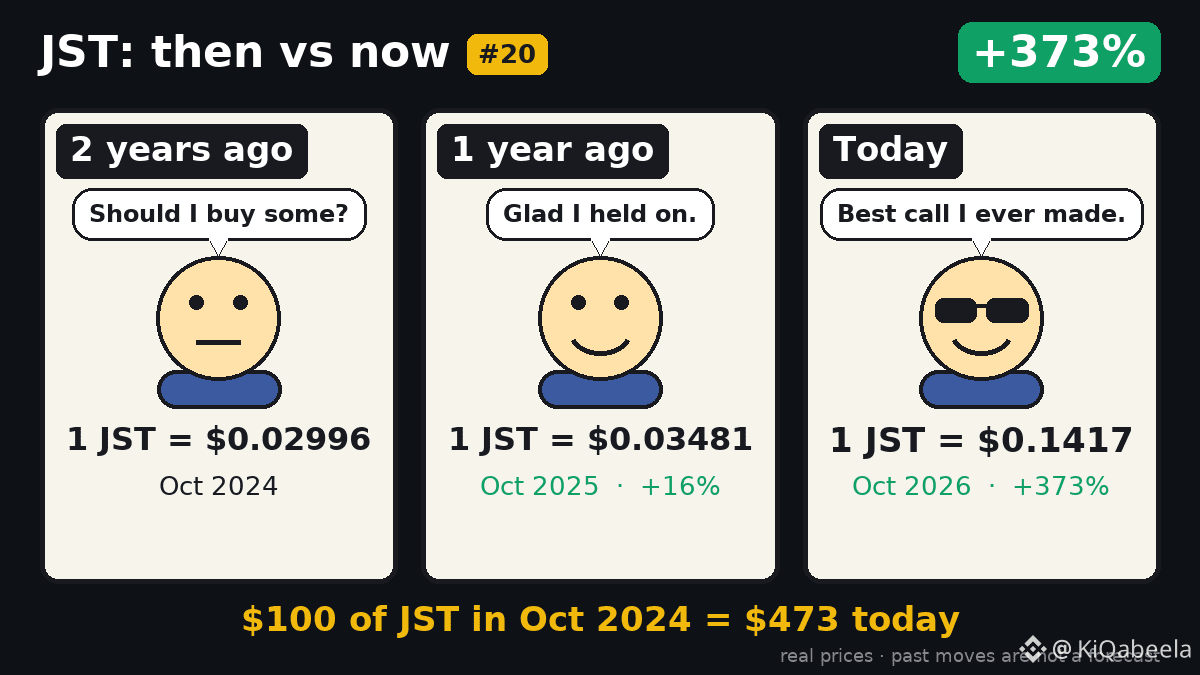
$100 → $473: JST since Oct 2024.
A $100 stake in JST back in October 2024 would now sit at $473, a 373% rise. The daily close moved from $0.02996 to $0.14174 over two years.
Past moves say nothing about the next ones.
💬 Holder?
🎨 Then vs Now #20 · a new one every morning
$JST
#JST
$100 → $473: JST since Oct 2024.
A $100 stake in JST back in October 2024 would now sit at $473, a 373% rise. The daily close moved from $0.02996 to $0.14174 over two years.
Past moves say nothing about the next ones.
💬 Holder?
🎨 Then vs Now #20 · a new one every morning
$JST
#JST
A $100 stake in JST back in October 2024 would now sit at $473, a 373% rise. The daily close moved from $0.02996 to $0.14174 over two years.
Past moves say nothing about the next ones.
💬 Holder?
🎨 Then vs Now #20 · a new one every morning
$JST
#JST
16
Log in to explore more content
Join global crypto users on Binance Square
⚡️ Get latest and useful information about crypto.
💬 Trusted by the world’s largest crypto exchange.
👍 Discover real insights from verified creators.
Email / Phone number
Trending Topics
1
#BitcoinRebounds$75KAsChipsLead
0 views
1 Discussing
2
#JobsReportRaisesHikeOdds
20,336 views
382 Discussing
3
#US Data Center Rules May Constrain AI Expansion
3,231 views
49 Discussing
4
#BinanceReopensWithdrawalsForMoreAssets
1.2M views
6,689 Discussing
5
#$2TWipedOutHedgeFundsFaceLiquidation
7,747 views
64 Discussing
6
#USNovemberMichiganExpectationsIndexPrelimAt50.9
1,559 views
76 Discussing
7
#AnthropicIPOValuationDoubts
52,163 views
884 Discussing
8
#OilPlungesBelow$100
5,078 views
26 Discussing
9
#TradFiForBeginners
30 views
12 Discussing
10
#USMidtermsCouldShakeUpUS-IranTies
17,113 views
288 Discussing