
#27
27
19,230 views
109 Discussing
Hot
Latest

·
--
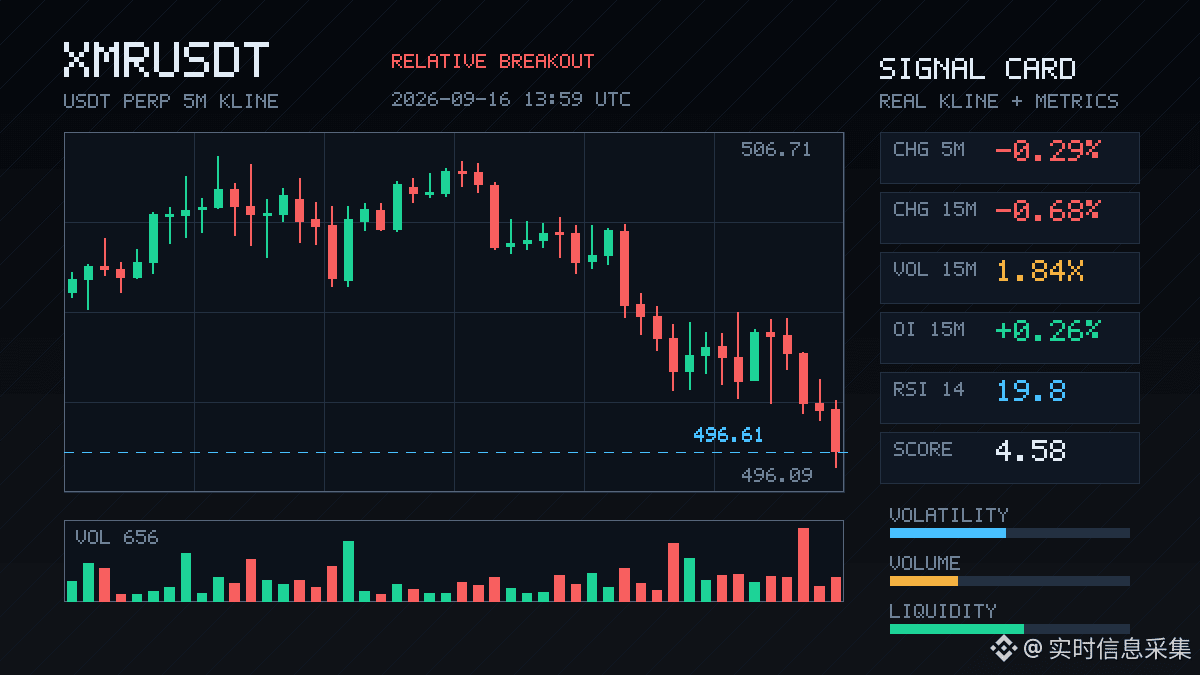
$XMR In these 15m there’s something going on. The price dropped by 0.68% while volume surged straight to 1.84x; the Z-value is 1.93. The close also fell below the lower band of the last 20 5m candles—not a fake dip. There’s clear sell pressure actively pushing it. The buy/sell ratio is 0.67; active trades are down 19.5%, and the bias is very one-sided.
What’s interesting is that OI is rising: 15m +0.26%, 1h +0.61%, yet the notional change is negative. Price down with OI up looks more like new leveraged short positions being opened, not long liquidation from a long-side squeeze or stop-out. The abnormal percentile is 82.5%, the whole pool is #27, notional change is #31, and depth confirmation has also passed.
Over 24h, the turnover is 46.88M—not that big. But if leveraged shorts start clustering at this level, watch to see whether there’s room for a squeeze afterward. For now, just observe—don’t rush to pick it up.
$XMR In these 15m there’s something going on. The price dropped by 0.68% while volume surged straight to 1.84x; the Z-value is 1.93. The close also fell below the lower band of the last 20 5m candles—not a fake dip. There’s clear sell pressure actively pushing it. The buy/sell ratio is 0.67; active trades are down 19.5%, and the bias is very one-sided.
What’s interesting is that OI is rising: 15m +0.26%, 1h +0.61%, yet the notional change is negative. Price down with OI up looks more like new leveraged short positions being opened, not long liquidation from a long-side squeeze or stop-out. The abnormal percentile is 82.5%, the whole pool is #27, notional change is #31, and depth confirmation has also passed.
Over 24h, the turnover is 46.88M—not that big. But if leveraged shorts start clustering at this level, watch to see whether there’s room for a squeeze afterward. For now, just observe—don’t rush to pick it up.
What’s interesting is that OI is rising: 15m +0.26%, 1h +0.61%, yet the notional change is negative. Price down with OI up looks more like new leveraged short positions being opened, not long liquidation from a long-side squeeze or stop-out. The abnormal percentile is 82.5%, the whole pool is #27, notional change is #31, and depth confirmation has also passed.
Over 24h, the turnover is 46.88M—not that big. But if leveraged shorts start clustering at this level, watch to see whether there’s room for a squeeze afterward. For now, just observe—don’t rush to pick it up.
7

·
--
ZEC, this upswing is kind of interesting: the 15m is up 2.19%, but OI is actually falling. When price rises while open interest declines, this combination usually isn’t fresh longs entering—it’s more like shorts are being lifted or old positions are being covered.
Look at the details: liquidation agents on the 5m timeframe are concentrated on Binance at 472K. Buyer-side direction dominates; the active execution gap is 26.2%, and the buy/sell ratio is 1.71. In plain terms, someone is being forced to liquidate, rather than the market actively adding long positions.
The OI abnormal percentile reached 97.2%, the entire pool abnormal #27, nominal change #3, but the absolute change amount is only -0.44%. This structure is quite “twisted,” suggesting that positions got rapidly cleared in an extremely thin area.
24h trading volume is a little over 1.8 billion. Liquidity depth can hold, but the price has already pushed to the upper edge of the recent range. Chasing longs here doesn’t offer a great cost-performance ratio. Instead, watch whether there’s follow-through after the cover is complete. Without follow-through, it’s just a single impulse.
ZEC, this upswing is kind of interesting: the 15m is up 2.19%, but OI is actually falling. When price rises while open interest declines, this combination usually isn’t fresh longs entering—it’s more like shorts are being lifted or old positions are being covered.
Look at the details: liquidation agents on the 5m timeframe are concentrated on Binance at 472K. Buyer-side direction dominates; the active execution gap is 26.2%, and the buy/sell ratio is 1.71. In plain terms, someone is being forced to liquidate, rather than the market actively adding long positions.
The OI abnormal percentile reached 97.2%, the entire pool abnormal #27, nominal change #3, but the absolute change amount is only -0.44%. This structure is quite “twisted,” suggesting that positions got rapidly cleared in an extremely thin area.
24h trading volume is a little over 1.8 billion. Liquidity depth can hold, but the price has already pushed to the upper edge of the recent range. Chasing longs here doesn’t offer a great cost-performance ratio. Instead, watch whether there’s follow-through after the cover is complete. Without follow-through, it’s just a single impulse.
Look at the details: liquidation agents on the 5m timeframe are concentrated on Binance at 472K. Buyer-side direction dominates; the active execution gap is 26.2%, and the buy/sell ratio is 1.71. In plain terms, someone is being forced to liquidate, rather than the market actively adding long positions.
The OI abnormal percentile reached 97.2%, the entire pool abnormal #27, nominal change #3, but the absolute change amount is only -0.44%. This structure is quite “twisted,” suggesting that positions got rapidly cleared in an extremely thin area.
24h trading volume is a little over 1.8 billion. Liquidity depth can hold, but the price has already pushed to the upper edge of the recent range. Chasing longs here doesn’t offer a great cost-performance ratio. Instead, watch whether there’s follow-through after the cover is complete. Without follow-through, it’s just a single impulse.
153

·
--
$LIT This move is a bit interesting.
Price dropped 2.1%, while volume immediately surged to 4.95x—volume ratio blew up, and OI (15m) is still rising. Price down + OI up is a typical new short entry structure; it’s not just longs being liquidated and dumped—it’s actively opening new shorts to push price lower.
It just broke below the lower edge of the recent 20 5m-bar range. The buy/sell ratio is 0.75, and the aggressive trade gap is -14.5%, with the sell side clearly in control.
But note that OI (1h) is -0.11%, nominal -2.5M. OI increased on the 15m timeframe and decreased on the 1h timeframe, which suggests the earlier batch of shorts is already closing, while newer shorts are getting added. This is a turnover-driven structure—not one-sided piling.
Whole-pool anomaly #27, nominal change #10. It’s been continuing for several consecutive cycles, and depth also confirms it: volume is higher than normal.
24h turnover is 112M—not small relative to the pool.
If the close breaks below the lower-edge level, and if the subsequent pullback can’t reclaim that area, the structure will be confirmed.
Watch, don’t chase.
$LIT This move is a bit interesting.
Price dropped 2.1%, while volume immediately surged to 4.95x—volume ratio blew up, and OI (15m) is still rising. Price down + OI up is a typical new short entry structure; it’s not just longs being liquidated and dumped—it’s actively opening new shorts to push price lower.
It just broke below the lower edge of the recent 20 5m-bar range. The buy/sell ratio is 0.75, and the aggressive trade gap is -14.5%, with the sell side clearly in control.
But note that OI (1h) is -0.11%, nominal -2.5M. OI increased on the 15m timeframe and decreased on the 1h timeframe, which suggests the earlier batch of shorts is already closing, while newer shorts are getting added. This is a turnover-driven structure—not one-sided piling.
Whole-pool anomaly #27, nominal change #10. It’s been continuing for several consecutive cycles, and depth also confirms it: volume is higher than normal.
24h turnover is 112M—not small relative to the pool.
If the close breaks below the lower-edge level, and if the subsequent pullback can’t reclaim that area, the structure will be confirmed.
Watch, don’t chase.
Price dropped 2.1%, while volume immediately surged to 4.95x—volume ratio blew up, and OI (15m) is still rising. Price down + OI up is a typical new short entry structure; it’s not just longs being liquidated and dumped—it’s actively opening new shorts to push price lower.
It just broke below the lower edge of the recent 20 5m-bar range. The buy/sell ratio is 0.75, and the aggressive trade gap is -14.5%, with the sell side clearly in control.
But note that OI (1h) is -0.11%, nominal -2.5M. OI increased on the 15m timeframe and decreased on the 1h timeframe, which suggests the earlier batch of shorts is already closing, while newer shorts are getting added. This is a turnover-driven structure—not one-sided piling.
Whole-pool anomaly #27, nominal change #10. It’s been continuing for several consecutive cycles, and depth also confirms it: volume is higher than normal.
24h turnover is 112M—not small relative to the pool.
If the close breaks below the lower-edge level, and if the subsequent pullback can’t reclaim that area, the structure will be confirmed.
Watch, don’t chase.

8

·
--
$ATOM These 15 minutes seem a bit off.
The price is down 1.4%, volume has surged straight to 1.62 times the average, and the volatility Z hit 3.05—this isn’t the usual scale of wash-trading volume. More importantly, OI: both the 15m and 1h are rising, totaling about +0.3%, yet the notional size has actually shrunk by nearly 0.5 million USDT. The combination—price down, positions up, notional contracting—points very clearly to what’s happening: newly added leveraged short positions are entering the market, and this isn’t random, scattered retail trial-buying/selling; it’s abnormal activity that’s been continuing across multiple consecutive cycles.
At the 83.3rd percentile of anomalies, the whole pool ranks #27, with notional change at #35. A single coin moving into the top positions on both of these lists at the same time indicates this isn’t an isolated event. The 24h trading value is only 39.82M, the liquidity pool isn’t deep. With this level of active sell pressure pushing it down, the price elasticity will be very fragile.
Active成交差 (active trade imbalance) is -22.8%, and the buy/sell ratio is 0.63—bearish on the order book is extremely obvious. The 15m close has already broken below the lower bound of the range formed by the prior ~20 5m K-lines—meaning the base of that earlier consolidation structure has been punctured.
The key issue now is: the shorts are newly opened, and they’re still adding. As long as OI keeps rising and price keeps being pushed down, this is the formation of trend acceleration—not a mere wick. Conversely, if price holds sideways while OI starts to fall, that could mean the shorts are short-term cashing out, and then we’d need to reassess.
Don’t rush to catch at $ATOM . Wait until OI and price reveal which direction wins.
$ATOM These 15 minutes seem a bit off.
The price is down 1.4%, volume has surged straight to 1.62 times the average, and the volatility Z hit 3.05—this isn’t the usual scale of wash-trading volume. More importantly, OI: both the 15m and 1h are rising, totaling about +0.3%, yet the notional size has actually shrunk by nearly 0.5 million USDT. The combination—price down, positions up, notional contracting—points very clearly to what’s happening: newly added leveraged short positions are entering the market, and this isn’t random, scattered retail trial-buying/selling; it’s abnormal activity that’s been continuing across multiple consecutive cycles.
At the 83.3rd percentile of anomalies, the whole pool ranks #27, with notional change at #35. A single coin moving into the top positions on both of these lists at the same time indicates this isn’t an isolated event. The 24h trading value is only 39.82M, the liquidity pool isn’t deep. With this level of active sell pressure pushing it down, the price elasticity will be very fragile.
Active成交差 (active trade imbalance) is -22.8%, and the buy/sell ratio is 0.63—bearish on the order book is extremely obvious. The 15m close has already broken below the lower bound of the range formed by the prior ~20 5m K-lines—meaning the base of that earlier consolidation structure has been punctured.
The key issue now is: the shorts are newly opened, and they’re still adding. As long as OI keeps rising and price keeps being pushed down, this is the formation of trend acceleration—not a mere wick. Conversely, if price holds sideways while OI starts to fall, that could mean the shorts are short-term cashing out, and then we’d need to reassess.
Don’t rush to catch at $ATOM . Wait until OI and price reveal which direction wins.
The price is down 1.4%, volume has surged straight to 1.62 times the average, and the volatility Z hit 3.05—this isn’t the usual scale of wash-trading volume. More importantly, OI: both the 15m and 1h are rising, totaling about +0.3%, yet the notional size has actually shrunk by nearly 0.5 million USDT. The combination—price down, positions up, notional contracting—points very clearly to what’s happening: newly added leveraged short positions are entering the market, and this isn’t random, scattered retail trial-buying/selling; it’s abnormal activity that’s been continuing across multiple consecutive cycles.
At the 83.3rd percentile of anomalies, the whole pool ranks #27, with notional change at #35. A single coin moving into the top positions on both of these lists at the same time indicates this isn’t an isolated event. The 24h trading value is only 39.82M, the liquidity pool isn’t deep. With this level of active sell pressure pushing it down, the price elasticity will be very fragile.
Active成交差 (active trade imbalance) is -22.8%, and the buy/sell ratio is 0.63—bearish on the order book is extremely obvious. The 15m close has already broken below the lower bound of the range formed by the prior ~20 5m K-lines—meaning the base of that earlier consolidation structure has been punctured.
The key issue now is: the shorts are newly opened, and they’re still adding. As long as OI keeps rising and price keeps being pushed down, this is the formation of trend acceleration—not a mere wick. Conversely, if price holds sideways while OI starts to fall, that could mean the shorts are short-term cashing out, and then we’d need to reassess.
Don’t rush to catch at $ATOM . Wait until OI and price reveal which direction wins.
6
·
--
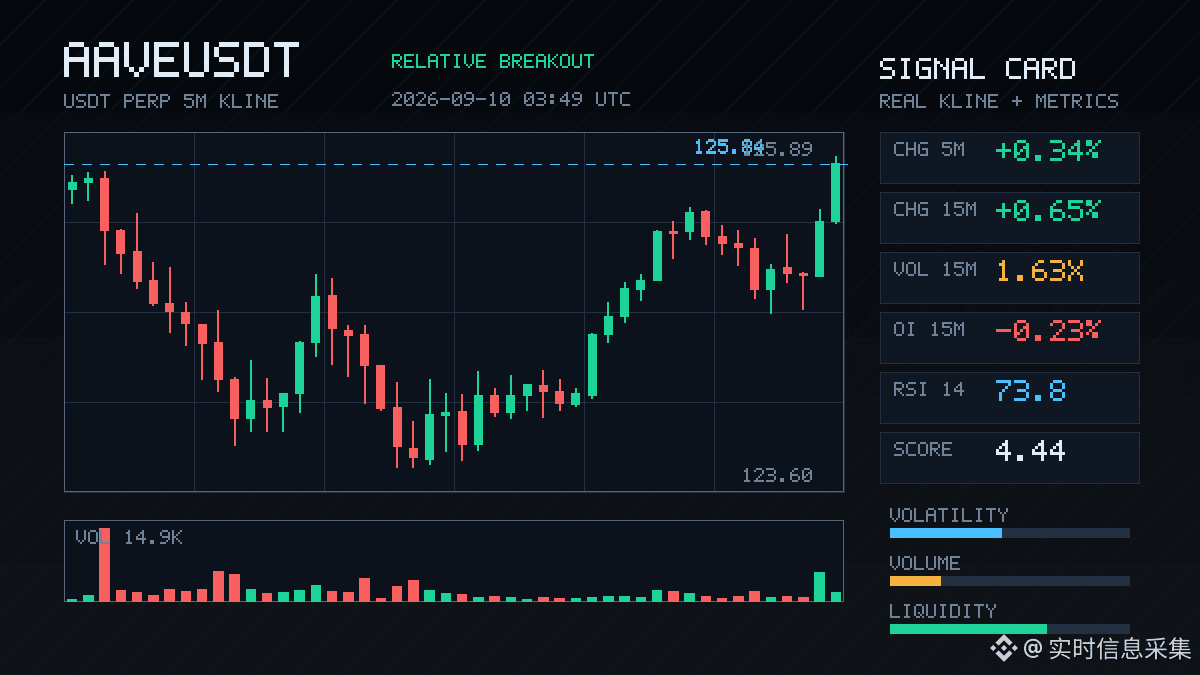
AAVE This move is a bit interesting.
In the 15m timeframe it’s up 0.65%, with volume at 1.63x. It doesn’t look very aggressive at first glance, but the details are in the back: OI is negative for both 15m and 1h. As the price rises, the position size is actually decreasing.
I usually don’t treat this kind of structure as a bullish breakout. It feels more like the short side is getting squeezed, or someone is taking the opportunity to close positions and leave—rather than new money actively driving it in.
That said, active trade volume is down 44.3% and the buy/sell ratio is 2.59. And at the close it just so happened to “bite through” the upper boundary of nearly 20 of the 5m candles. So on the short term, there really does seem to be funds pushing upward. The whole pool’s anomaly ranks #14, with a nominal change of #27—it's not huge, but it’s also not small.
My take: don’t rush to chase. As long as the volume-price divergence hasn’t finished playing out, this kind of breakout can easily turn into a fake move. Wait for a pullback to confirm, or wait until OI flips back to positive.
$AAVE
AAVE This move is a bit interesting.
In the 15m timeframe it’s up 0.65%, with volume at 1.63x. It doesn’t look very aggressive at first glance, but the details are in the back: OI is negative for both 15m and 1h. As the price rises, the position size is actually decreasing.
I usually don’t treat this kind of structure as a bullish breakout. It feels more like the short side is getting squeezed, or someone is taking the opportunity to close positions and leave—rather than new money actively driving it in.
That said, active trade volume is down 44.3% and the buy/sell ratio is 2.59. And at the close it just so happened to “bite through” the upper boundary of nearly 20 of the 5m candles. So on the short term, there really does seem to be funds pushing upward. The whole pool’s anomaly ranks #14, with a nominal change of #27—it's not huge, but it’s also not small.
My take: don’t rush to chase. As long as the volume-price divergence hasn’t finished playing out, this kind of breakout can easily turn into a fake move. Wait for a pullback to confirm, or wait until OI flips back to positive.
$AAVE
In the 15m timeframe it’s up 0.65%, with volume at 1.63x. It doesn’t look very aggressive at first glance, but the details are in the back: OI is negative for both 15m and 1h. As the price rises, the position size is actually decreasing.
I usually don’t treat this kind of structure as a bullish breakout. It feels more like the short side is getting squeezed, or someone is taking the opportunity to close positions and leave—rather than new money actively driving it in.
That said, active trade volume is down 44.3% and the buy/sell ratio is 2.59. And at the close it just so happened to “bite through” the upper boundary of nearly 20 of the 5m candles. So on the short term, there really does seem to be funds pushing upward. The whole pool’s anomaly ranks #14, with a nominal change of #27—it's not huge, but it’s also not small.
My take: don’t rush to chase. As long as the volume-price divergence hasn’t finished playing out, this kind of breakout can easily turn into a fake move. Wait for a pullback to confirm, or wait until OI flips back to positive.
$AAVE
48


·
--
MAGMA Anomaly AnalysisThe MAGMA alert is kind of interesting. In 24h it’s only -1.8%, which looks calm and unhurried, but in 5m it’s -4.8% and in 1h -6.8%. The short-term cycle has already started getting smashed downward, with volume up 8.7x. This isn’t a slow drift down—someone is taking action.
The issue is that the direction hasn’t been decided yet. The alert is very clear: it’s a volatility breakout signal. Historically, within 4h it triggers a ≥3% volatility move about 89% of the time, but the directional accuracy is only 44%—basically a coin flip. The most treacherous thing about this kind of signal is exactly that: volatility will definitely come, but you don’t know which way it will go. Chasing the current price of 0.23444 is just betting on the toss.
Looking at the social side again: in the last 24h there are 73 mentions and breadth of 66, but in the past 4h they have directly dropped to 6 mentions with 0 KOLs. The discussion cooling is very obvious. When attention fades, it tries to ramp volume to sell off—usually not a good sign. BSQ 94 ranks at #27. The sentiment side isn’t strong enough to support a one-sided trend.
MAGMA Anomaly Analysis
The MAGMA alert is kind of interesting. In 24h it’s only -1.8%, which looks calm and unhurried, but in 5m it’s -4.8% and in 1h -6.8%. The short-term cycle has already started getting smashed downward, with volume up 8.7x. This isn’t a slow drift down—someone is taking action.
The issue is that the direction hasn’t been decided yet. The alert is very clear: it’s a volatility breakout signal. Historically, within 4h it triggers a ≥3% volatility move about 89% of the time, but the directional accuracy is only 44%—basically a coin flip. The most treacherous thing about this kind of signal is exactly that: volatility will definitely come, but you don’t know which way it will go. Chasing the current price of 0.23444 is just betting on the toss.
Looking at the social side again: in the last 24h there are 73 mentions and breadth of 66, but in the past 4h they have directly dropped to 6 mentions with 0 KOLs. The discussion cooling is very obvious. When attention fades, it tries to ramp volume to sell off—usually not a good sign. BSQ 94 ranks at #27. The sentiment side isn’t strong enough to support a one-sided trend.
The issue is that the direction hasn’t been decided yet. The alert is very clear: it’s a volatility breakout signal. Historically, within 4h it triggers a ≥3% volatility move about 89% of the time, but the directional accuracy is only 44%—basically a coin flip. The most treacherous thing about this kind of signal is exactly that: volatility will definitely come, but you don’t know which way it will go. Chasing the current price of 0.23444 is just betting on the toss.
Looking at the social side again: in the last 24h there are 73 mentions and breadth of 66, but in the past 4h they have directly dropped to 6 mentions with 0 KOLs. The discussion cooling is very obvious. When attention fades, it tries to ramp volume to sell off—usually not a good sign. BSQ 94 ranks at #27. The sentiment side isn’t strong enough to support a one-sided trend.
56
·
--
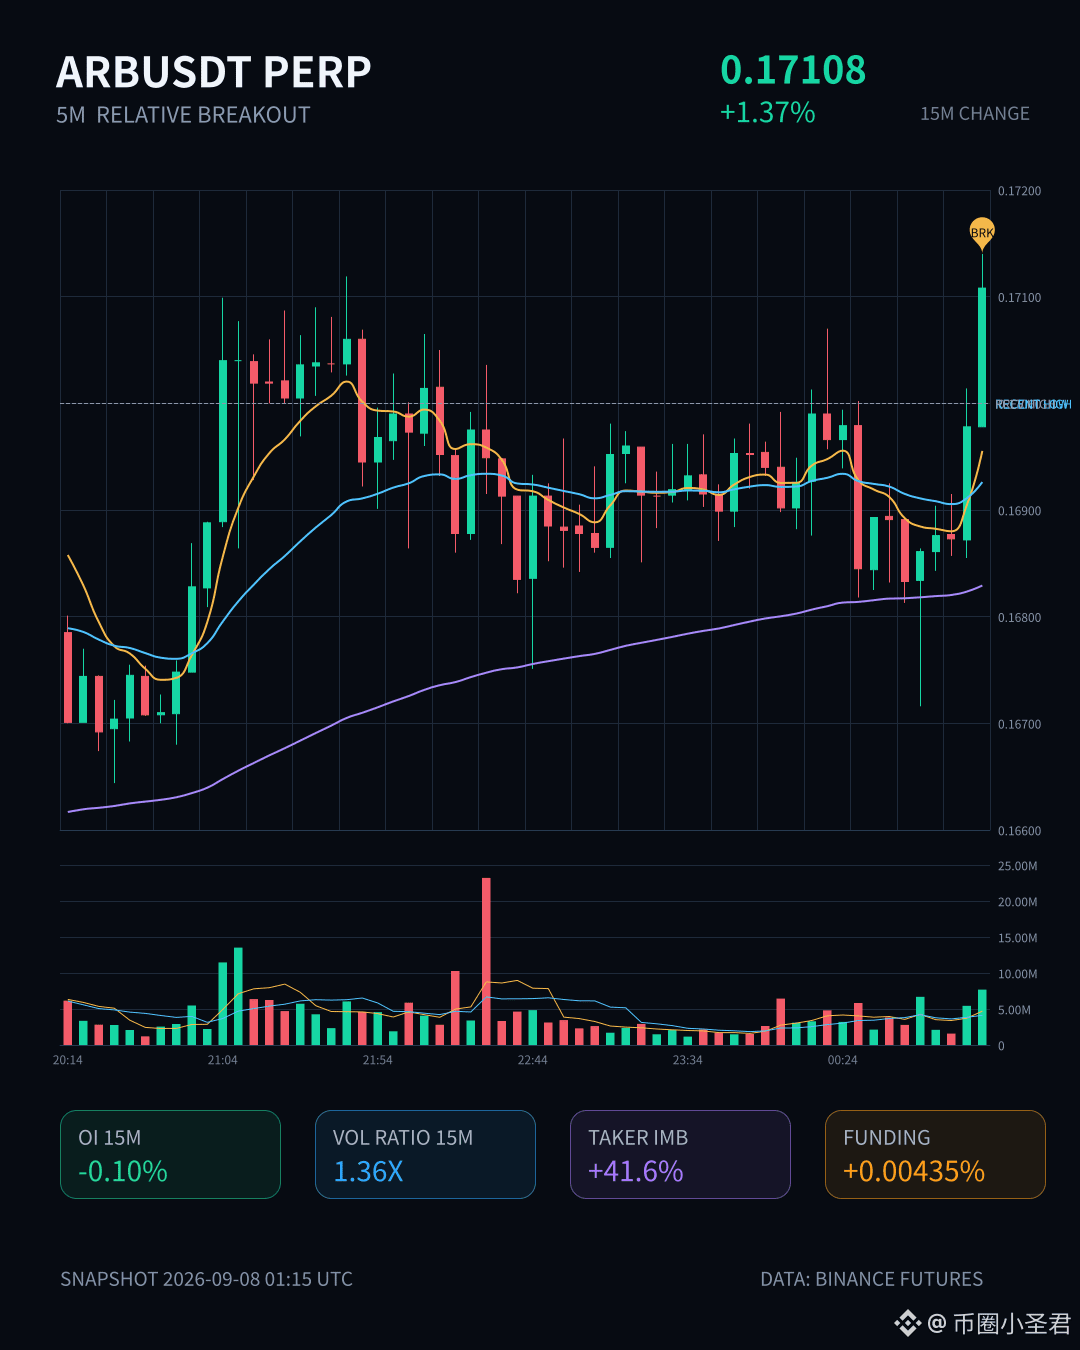
$ARB Morning session move had a lot of flavor.
A 15-minute rally of 1.37% isn’t exactly brutal, but the volume expanded to 1.36x, the Z-score is close to 3, and the aggressive buy order side bought 2.42 versus the sell side reaching 2.42. At the close, it directly pierced through the upper boundary of the range of nearly 20 five-minute candlesticks. The price has broken out, but OI is decreasing—-0.10%, and on the hourly timeframe it’s even -0.90%. This indicates the shorts are running/covering, not new money is actively attacking.
This “price up while positions down” structure, in plain terms, is a行情 pushed by short-covering. Its feature is that it’s fast, but its sustainability should be questioned. And both the nominal changes and the overall pool’s abnormal ranking are in the top tier (#11/#27), which suggests that capital attention is indeed there—not just scattered, small moves.
My read on the tape is: short-term momentum is definitely strong, and the buy side clearly shows a breakout posture. But the open interest/position volume can’t keep up, which implies that in this push higher, passive liquidation outweighs active incremental buying. Whether to chase higher on a breakout is up to each person’s own judgment.
For myself, I’d first see whether this move can hold steady above the upper boundary of the range before considering the next step. I won’t blindly chase if it breaks; if the pullback doesn’t break the level, then there’s still a chance.
$ARB Morning session move had a lot of flavor.
A 15-minute rally of 1.37% isn’t exactly brutal, but the volume expanded to 1.36x, the Z-score is close to 3, and the aggressive buy order side bought 2.42 versus the sell side reaching 2.42. At the close, it directly pierced through the upper boundary of the range of nearly 20 five-minute candlesticks. The price has broken out, but OI is decreasing—-0.10%, and on the hourly timeframe it’s even -0.90%. This indicates the shorts are running/covering, not new money is actively attacking.
This “price up while positions down” structure, in plain terms, is a行情 pushed by short-covering. Its feature is that it’s fast, but its sustainability should be questioned. And both the nominal changes and the overall pool’s abnormal ranking are in the top tier (#11/#27), which suggests that capital attention is indeed there—not just scattered, small moves.
My read on the tape is: short-term momentum is definitely strong, and the buy side clearly shows a breakout posture. But the open interest/position volume can’t keep up, which implies that in this push higher, passive liquidation outweighs active incremental buying. Whether to chase higher on a breakout is up to each person’s own judgment.
For myself, I’d first see whether this move can hold steady above the upper boundary of the range before considering the next step. I won’t blindly chase if it breaks; if the pullback doesn’t break the level, then there’s still a chance.
A 15-minute rally of 1.37% isn’t exactly brutal, but the volume expanded to 1.36x, the Z-score is close to 3, and the aggressive buy order side bought 2.42 versus the sell side reaching 2.42. At the close, it directly pierced through the upper boundary of the range of nearly 20 five-minute candlesticks. The price has broken out, but OI is decreasing—-0.10%, and on the hourly timeframe it’s even -0.90%. This indicates the shorts are running/covering, not new money is actively attacking.
This “price up while positions down” structure, in plain terms, is a行情 pushed by short-covering. Its feature is that it’s fast, but its sustainability should be questioned. And both the nominal changes and the overall pool’s abnormal ranking are in the top tier (#11/#27), which suggests that capital attention is indeed there—not just scattered, small moves.
My read on the tape is: short-term momentum is definitely strong, and the buy side clearly shows a breakout posture. But the open interest/position volume can’t keep up, which implies that in this push higher, passive liquidation outweighs active incremental buying. Whether to chase higher on a breakout is up to each person’s own judgment.
For myself, I’d first see whether this move can hold steady above the upper boundary of the range before considering the next step. I won’t blindly chase if it breaks; if the pullback doesn’t break the level, then there’s still a chance.
187

·
--
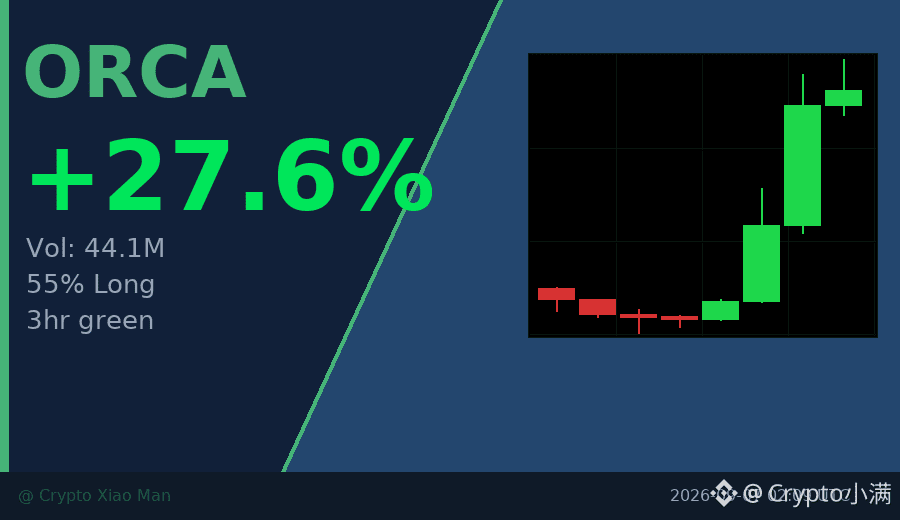
27% gain, but the funding rate is negative—what does that mean?
ORCA surged from 1.30 all the way to 1.70 today, with trading volume hitting 44 million USDT.
On the surface, it looks like a strong breakout, but the funding rate of -0.0191% reveals the truth:
Although more people are going long (55% long), most are holding through with spot positions,
rather than using high leverage to chase the rally.
The hourly candlesticks have been closing green one after another, which shows that buying pressure has been sustained, not a one-off spike.
This kind of situation—"price rising but leverage not crowded"—is actually safer than everyone turning bullish.
$ORCA #资金费率背离 #27%
Click the small card below to quickly view the market👇
27% gain, but the funding rate is negative—what does that mean?
ORCA surged from 1.30 all the way to 1.70 today, with trading volume hitting 44 million USDT.
On the surface, it looks like a strong breakout, but the funding rate of -0.0191% reveals the truth:
Although more people are going long (55% long), most are holding through with spot positions,
rather than using high leverage to chase the rally.
The hourly candlesticks have been closing green one after another, which shows that buying pressure has been sustained, not a one-off spike.
This kind of situation—"price rising but leverage not crowded"—is actually safer than everyone turning bullish.
$ORCA #资金费率背离 #27%
Click the small card below to quickly view the market👇
ORCA surged from 1.30 all the way to 1.70 today, with trading volume hitting 44 million USDT.
On the surface, it looks like a strong breakout, but the funding rate of -0.0191% reveals the truth:
Although more people are going long (55% long), most are holding through with spot positions,
rather than using high leverage to chase the rally.
The hourly candlesticks have been closing green one after another, which shows that buying pressure has been sustained, not a one-off spike.
This kind of situation—"price rising but leverage not crowded"—is actually safer than everyone turning bullish.
$ORCA #资金费率背离 #27%
Click the small card below to quickly view the market👇
71
·
--
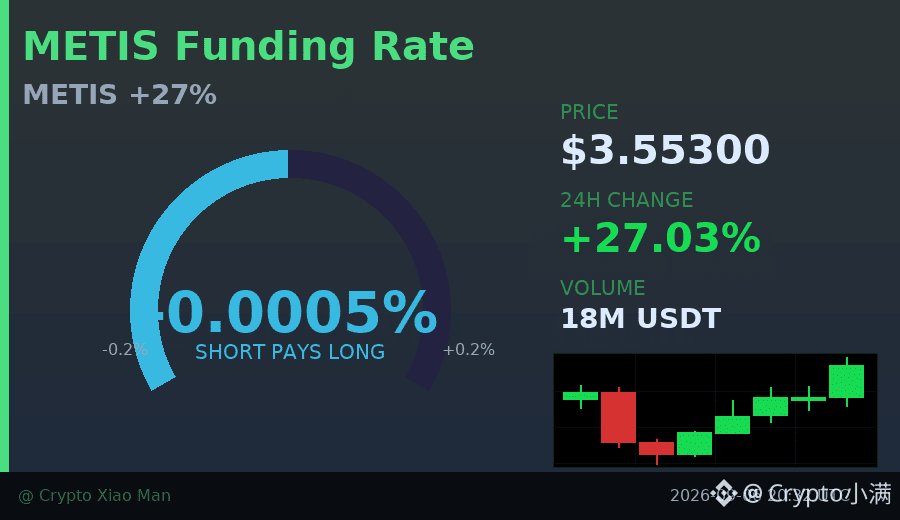
27% increase, but the funding rate is actually negative?
METIS surged to 3.55 today, with trading volume climbing to 18 million USDT. Longs account for 64%, making it look overwhelmingly one-sided. But funding is -0.0005, which suggests many people are shorting to collect funding, or that large players are quietly hedging.
Over the past 8 hours, it has been steadily strengthening, and the last candlestick showed the strongest volume spike. This kind of divergence usually means: either shorts are being forced to liquidate, accelerating the rally, or someone is using liquidity at higher levels to distribute.
I’ll wait for the next 15-minute confirmation—if volume continues and it holds above 3.58, there is still room for a short-term move; if volume shrinks and it pulls back below 3.38, this move may be a false breakout.
$METIS #资金费率背离 #27%
Click the small card below to quickly view the market 👇
27% increase, but the funding rate is actually negative?
METIS surged to 3.55 today, with trading volume climbing to 18 million USDT. Longs account for 64%, making it look overwhelmingly one-sided. But funding is -0.0005, which suggests many people are shorting to collect funding, or that large players are quietly hedging.
Over the past 8 hours, it has been steadily strengthening, and the last candlestick showed the strongest volume spike. This kind of divergence usually means: either shorts are being forced to liquidate, accelerating the rally, or someone is using liquidity at higher levels to distribute.
I’ll wait for the next 15-minute confirmation—if volume continues and it holds above 3.58, there is still room for a short-term move; if volume shrinks and it pulls back below 3.38, this move may be a false breakout.
$METIS #资金费率背离 #27%
Click the small card below to quickly view the market 👇
METIS surged to 3.55 today, with trading volume climbing to 18 million USDT. Longs account for 64%, making it look overwhelmingly one-sided. But funding is -0.0005, which suggests many people are shorting to collect funding, or that large players are quietly hedging.
Over the past 8 hours, it has been steadily strengthening, and the last candlestick showed the strongest volume spike. This kind of divergence usually means: either shorts are being forced to liquidate, accelerating the rally, or someone is using liquidity at higher levels to distribute.
I’ll wait for the next 15-minute confirmation—if volume continues and it holds above 3.58, there is still room for a short-term move; if volume shrinks and it pulls back below 3.38, this move may be a false breakout.
$METIS #资金费率背离 #27%
Click the small card below to quickly view the market 👇
45
·
--
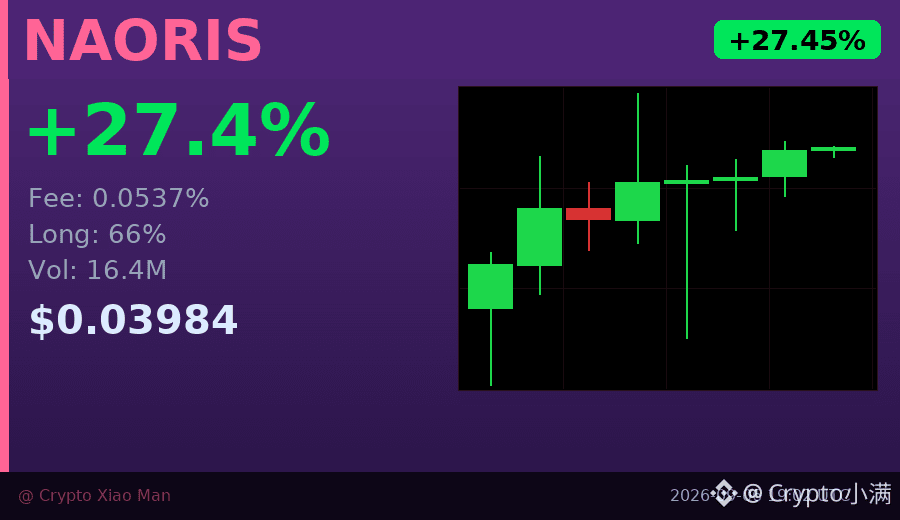
Behind the 27% surge, the funding rate has quietly risen to 0.0537%.
NAORIS traded 16.4 million USDT today, with longs accounting for 66%, and positions are clearly crowded. The hourly chart has closed three consecutive bullish candles, with price rising from 0.02887 to 0.03984, and short-term momentum is still intact.
But a high funding rate means longs are paying shorts, and this kind of move often won’t stay smooth forever. If trading volume fails to keep up, a pullback may occur to flush out leverage.
I’ll be watching for support in the 0.037-0.038 range; if it breaks below 0.035, the short-term trend will weaken.
$NAORIS #资金费率预警 #27%
Click the card below to quickly check the market👇
Behind the 27% surge, the funding rate has quietly risen to 0.0537%.
NAORIS traded 16.4 million USDT today, with longs accounting for 66%, and positions are clearly crowded. The hourly chart has closed three consecutive bullish candles, with price rising from 0.02887 to 0.03984, and short-term momentum is still intact.
But a high funding rate means longs are paying shorts, and this kind of move often won’t stay smooth forever. If trading volume fails to keep up, a pullback may occur to flush out leverage.
I’ll be watching for support in the 0.037-0.038 range; if it breaks below 0.035, the short-term trend will weaken.
$NAORIS #资金费率预警 #27%
Click the card below to quickly check the market👇
NAORIS traded 16.4 million USDT today, with longs accounting for 66%, and positions are clearly crowded. The hourly chart has closed three consecutive bullish candles, with price rising from 0.02887 to 0.03984, and short-term momentum is still intact.
But a high funding rate means longs are paying shorts, and this kind of move often won’t stay smooth forever. If trading volume fails to keep up, a pullback may occur to flush out leverage.
I’ll be watching for support in the 0.037-0.038 range; if it breaks below 0.035, the short-term trend will weaken.
$NAORIS #资金费率预警 #27%
Click the card below to quickly check the market👇
14
·
--
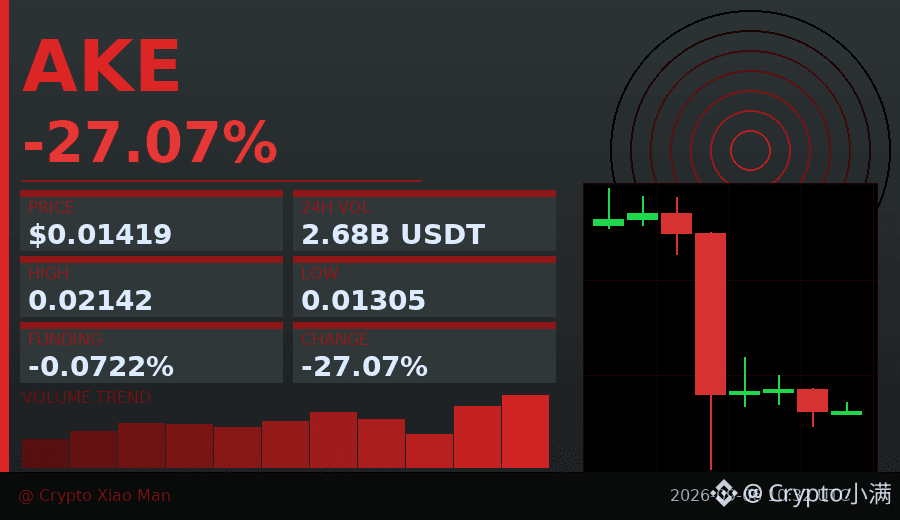
27% plunge, yet the funding rate is negative at -0.072%?
AKE’s price action is pretty interesting. Within 8 hours, it was dumped straight from 0.0214 to 0.013. Trading volume surged to $268 million, but shorts have already reached 52%.
The most abnormal thing is the funding rate—a deep negative value means the cost of shorting is rising rapidly, and the risk of a short squeeze is building.
If this finds support here, there could be a quick rebound; but if it keeps breaking below 0.013, support below will be hard to find.
I’ll watch for signs of stabilization in the 0.013-0.014 range and won’t rush to buy the dip.
$AKE #资金费率预警 #27%crash
Click the card below to quickly check the market 👇
27% plunge, yet the funding rate is negative at -0.072%?
AKE’s price action is pretty interesting. Within 8 hours, it was dumped straight from 0.0214 to 0.013. Trading volume surged to $268 million, but shorts have already reached 52%.
The most abnormal thing is the funding rate—a deep negative value means the cost of shorting is rising rapidly, and the risk of a short squeeze is building.
If this finds support here, there could be a quick rebound; but if it keeps breaking below 0.013, support below will be hard to find.
I’ll watch for signs of stabilization in the 0.013-0.014 range and won’t rush to buy the dip.
$AKE #资金费率预警 #27%crash
Click the card below to quickly check the market 👇
AKE’s price action is pretty interesting. Within 8 hours, it was dumped straight from 0.0214 to 0.013. Trading volume surged to $268 million, but shorts have already reached 52%.
The most abnormal thing is the funding rate—a deep negative value means the cost of shorting is rising rapidly, and the risk of a short squeeze is building.
If this finds support here, there could be a quick rebound; but if it keeps breaking below 0.013, support below will be hard to find.
I’ll watch for signs of stabilization in the 0.013-0.014 range and won’t rush to buy the dip.
$AKE #资金费率预警 #27%crash
Click the card below to quickly check the market 👇
162
·
--
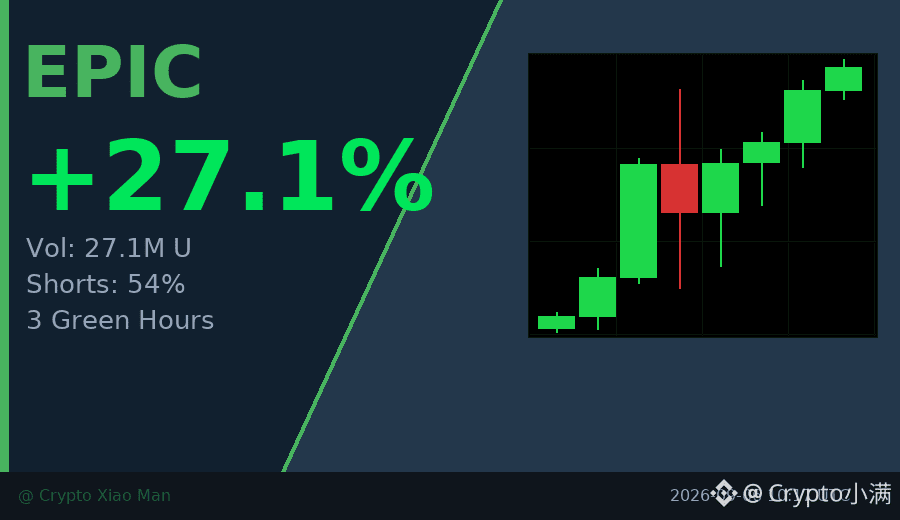
Behind the 27% surge, are bears still adding positions?
EPIC surged to 0.4858 today, with 24-hour trading volume expanding to 27.1M U. The hourly chart has already posted three consecutive bullish candles, and the momentum is very clear.
What’s interesting, though, is that the long/short ratio shows 54% of people are still shorting. Price is rising sharply, but bears aren’t backing off — this kind of divergence often means two things: either shorts are waiting for a pullback, or they’re on the path to being forced to cover.
The funding rate is only 0.003, not extreme, which suggests longs aren’t overheated yet. If price continues to break above the previous high of 0.4879, it may trigger a wave of short covering.
I’m watching the 0.488 level closely; if it breaks, there may still be room for a short-term move higher.
$EPIC #多空背离 #27%gain
Click the small card below to quickly check the market 👇
Behind the 27% surge, are bears still adding positions?
EPIC surged to 0.4858 today, with 24-hour trading volume expanding to 27.1M U. The hourly chart has already posted three consecutive bullish candles, and the momentum is very clear.
What’s interesting, though, is that the long/short ratio shows 54% of people are still shorting. Price is rising sharply, but bears aren’t backing off — this kind of divergence often means two things: either shorts are waiting for a pullback, or they’re on the path to being forced to cover.
The funding rate is only 0.003, not extreme, which suggests longs aren’t overheated yet. If price continues to break above the previous high of 0.4879, it may trigger a wave of short covering.
I’m watching the 0.488 level closely; if it breaks, there may still be room for a short-term move higher.
$EPIC #多空背离 #27%gain
Click the small card below to quickly check the market 👇
EPIC surged to 0.4858 today, with 24-hour trading volume expanding to 27.1M U. The hourly chart has already posted three consecutive bullish candles, and the momentum is very clear.
What’s interesting, though, is that the long/short ratio shows 54% of people are still shorting. Price is rising sharply, but bears aren’t backing off — this kind of divergence often means two things: either shorts are waiting for a pullback, or they’re on the path to being forced to cover.
The funding rate is only 0.003, not extreme, which suggests longs aren’t overheated yet. If price continues to break above the previous high of 0.4879, it may trigger a wave of short covering.
I’m watching the 0.488 level closely; if it breaks, there may still be room for a short-term move higher.
$EPIC #多空背离 #27%gain
Click the small card below to quickly check the market 👇
109

·
--
Bullish
60-SECOND ALPHA #27 | $SC
$SC is one of the older names in the market, but its use case remains interesting: decentralized storage through the Sia network.
The important lesson is that older projects can still become relevant when their original infrastructure fits a new market narrative. Decentralized storage is becoming increasingly important as blockchain and AI generate more data.
Alpha: Sometimes the next narrative is built on technology that has been around for years.
{spot}(SCUSDT)
60-SECOND ALPHA #27 | $SC
$SC is one of the older names in the market, but its use case remains interesting: decentralized storage through the Sia network.
The important lesson is that older projects can still become relevant when their original infrastructure fits a new market narrative. Decentralized storage is becoming increasingly important as blockchain and AI generate more data.
Alpha: Sometimes the next narrative is built on technology that has been around for years.
$SC is one of the older names in the market, but its use case remains interesting: decentralized storage through the Sia network.
The important lesson is that older projects can still become relevant when their original infrastructure fits a new market narrative. Decentralized storage is becoming increasingly important as blockchain and AI generate more data.
Alpha: Sometimes the next narrative is built on technology that has been around for years.
147

·
--
** How Do You Identify Momentum Coins? Step-by-Step Practice with Updated Binance Data as of 2026‑09‑04Uniswap (UNIUSDT) is trending right now!
Rank: #27
** 🚀 **Step 1 – Scan the daily “Top Movers” list** - Open the “Top Movers” tab on Binance Square and note the coins with the highest 24h change. - **Example (from the dataset):** - +6.84 % (price 0.2218 USDT, volume 53.31 M) - +6.45 % (price 12.009 USDT, volume 36.19 M) - +5.95 % (price 2.013 USDT, volume 43.54 M) - +5.82 % (price 1.452 USDT, volume 308.44 M) - +5.57 % (price 0.08779 USDT, volume 105.12 M) 📊 **Step 2 – Check the volume-price relationship** - If a high % change appears together with high volume, that is a strong signal that the move is driven by real demand. - **How to check?** 1. Look at the “Quote Volume” value (volume in USDT). 2. Compare it with the coin’s 7-day average volume (Binance → Chart → “Indicators” → “Volume MA(7)”). 3. If daily volume is above **1.5x – 2x** the average, momentum is strong. - **Example:** the quote volume is 308.44 M, 7-day average≈150 M → 2.05x → strong buying pressure. 🎯 **Step 3 – Measure order book tightness** - Check the spread between “Bid” (buy) and “Ask” (sell), and the quantity at the first 5 levels. - Tight spread + high bid qty → strong support on the buy side. - **Example:** : bid 12.009 USDT (qty 1.29), ask 12.010 USDT (qty 278.17) → spread only 0.001 USDT (≈0.008 %). This very tight spread indicates short-term breakthrough potential. 📈 **Step 4 – Scan the momentum pattern on the chart** - On 15 m–1 hour candles, look for the following patterns: - **Bulli
** How Do You Identify Momentum Coins? Step-by-Step Practice with Updated Binance Data as of 2026‑09‑04
Uniswap (UNIUSDT) is trending right now!
Rank: #27
** 🚀 **Step 1 – Scan the daily “Top Movers” list** - Open the “Top Movers” tab on Binance Square and note the coins with the highest 24h change. - **Example (from the dataset):** - +6.84 % (price 0.2218 USDT, volume 53.31 M) - +6.45 % (price 12.009 USDT, volume 36.19 M) - +5.95 % (price 2.013 USDT, volume 43.54 M) - +5.82 % (price 1.452 USDT, volume 308.44 M) - +5.57 % (price 0.08779 USDT, volume 105.12 M) 📊 **Step 2 – Check the volume-price relationship** - If a high % change appears together with high volume, that is a strong signal that the move is driven by real demand. - **How to check?** 1. Look at the “Quote Volume” value (volume in USDT). 2. Compare it with the coin’s 7-day average volume (Binance → Chart → “Indicators” → “Volume MA(7)”). 3. If daily volume is above **1.5x – 2x** the average, momentum is strong. - **Example:** the quote volume is 308.44 M, 7-day average≈150 M → 2.05x → strong buying pressure. 🎯 **Step 3 – Measure order book tightness** - Check the spread between “Bid” (buy) and “Ask” (sell), and the quantity at the first 5 levels. - Tight spread + high bid qty → strong support on the buy side. - **Example:** : bid 12.009 USDT (qty 1.29), ask 12.010 USDT (qty 278.17) → spread only 0.001 USDT (≈0.008 %). This very tight spread indicates short-term breakthrough potential. 📈 **Step 4 – Scan the momentum pattern on the chart** - On 15 m–1 hour candles, look for the following patterns: - **Bulli
Rank: #27
** 🚀 **Step 1 – Scan the daily “Top Movers” list** - Open the “Top Movers” tab on Binance Square and note the coins with the highest 24h change. - **Example (from the dataset):** - +6.84 % (price 0.2218 USDT, volume 53.31 M) - +6.45 % (price 12.009 USDT, volume 36.19 M) - +5.95 % (price 2.013 USDT, volume 43.54 M) - +5.82 % (price 1.452 USDT, volume 308.44 M) - +5.57 % (price 0.08779 USDT, volume 105.12 M) 📊 **Step 2 – Check the volume-price relationship** - If a high % change appears together with high volume, that is a strong signal that the move is driven by real demand. - **How to check?** 1. Look at the “Quote Volume” value (volume in USDT). 2. Compare it with the coin’s 7-day average volume (Binance → Chart → “Indicators” → “Volume MA(7)”). 3. If daily volume is above **1.5x – 2x** the average, momentum is strong. - **Example:** the quote volume is 308.44 M, 7-day average≈150 M → 2.05x → strong buying pressure. 🎯 **Step 3 – Measure order book tightness** - Check the spread between “Bid” (buy) and “Ask” (sell), and the quantity at the first 5 levels. - Tight spread + high bid qty → strong support on the buy side. - **Example:** : bid 12.009 USDT (qty 1.29), ask 12.010 USDT (qty 278.17) → spread only 0.001 USDT (≈0.008 %). This very tight spread indicates short-term breakthrough potential. 📈 **Step 4 – Scan the momentum pattern on the chart** - On 15 m–1 hour candles, look for the following patterns: - **Bulli
38
·
--
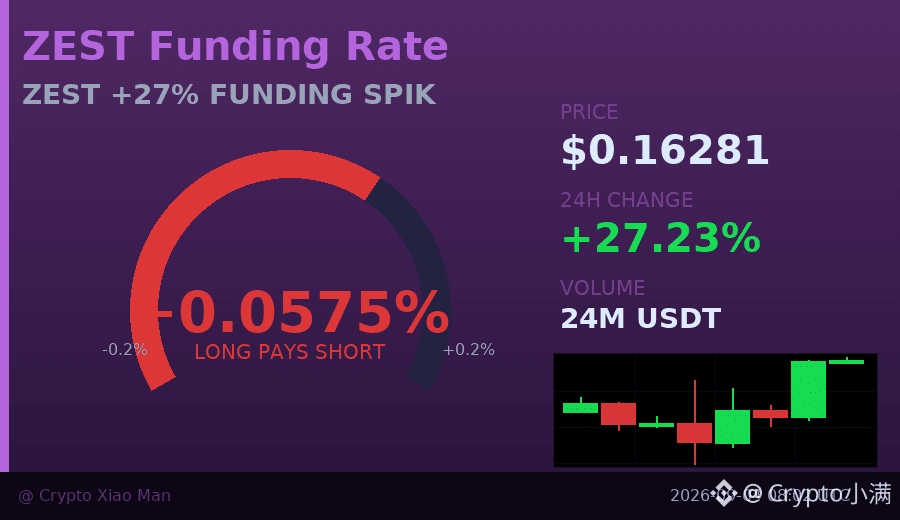
Behind the 27% rise, the funding rate has already climbed to 0.0575%—longs are starting to pay a premium.
ZEST has risen from 0.127 to 0.162; trading volume is 24.5 million USDT. The hourly chart has three consecutive bullish candles,
but the long-term positioning share is 58%, indicating leveraged funds are chasing—not purely spot-driven.
This kind of structure is common during short-term sentiment euphoria: the price is still surging, but once funding continues to rise,
profit-taking is prone to cluster and be cashed out. I’ll watch around 0.17 to see whether there’s a volume expansion followed by a stall.
If the hourly K-line prints a long upper wick, the probability of a short-term pullback will be higher.
$ZEST #资金费率预警 #27%
Click the small card below to quickly check the market trend👇
Behind the 27% rise, the funding rate has already climbed to 0.0575%—longs are starting to pay a premium.
ZEST has risen from 0.127 to 0.162; trading volume is 24.5 million USDT. The hourly chart has three consecutive bullish candles,
but the long-term positioning share is 58%, indicating leveraged funds are chasing—not purely spot-driven.
This kind of structure is common during short-term sentiment euphoria: the price is still surging, but once funding continues to rise,
profit-taking is prone to cluster and be cashed out. I’ll watch around 0.17 to see whether there’s a volume expansion followed by a stall.
If the hourly K-line prints a long upper wick, the probability of a short-term pullback will be higher.
$ZEST #资金费率预警 #27%
Click the small card below to quickly check the market trend👇
ZEST has risen from 0.127 to 0.162; trading volume is 24.5 million USDT. The hourly chart has three consecutive bullish candles,
but the long-term positioning share is 58%, indicating leveraged funds are chasing—not purely spot-driven.
This kind of structure is common during short-term sentiment euphoria: the price is still surging, but once funding continues to rise,
profit-taking is prone to cluster and be cashed out. I’ll watch around 0.17 to see whether there’s a volume expansion followed by a stall.
If the hourly K-line prints a long upper wick, the probability of a short-term pullback will be higher.
$ZEST #资金费率预警 #27%
Click the small card below to quickly check the market trend👇
85
·
--
** How Does Crypto Get Bought Like a Momentum Stock? – A Practical Step-by-Step Guide with Current DataUniswap (UNIUSDT) is trending right now!
Rank: #27
** 🚀 **Summary:** According to today’s Binance data ( 1,159.99 +4.91 %, ,505.36 +4.65 %), the market is in a short-term uptrend. The most active coins ( +9.03 %, +7.85 %, +7.07 %, +7.01 %, +6.34 %) offer good opportunities to catch momentum. With the steps below, you can safely evaluate these moves and create an entry-exit plan. --- ### 1️⃣ Check Trend and Volume – “Why This Coin?” | Coin | Price (USDT) | 24s % | 24s Volume (USDT) | Volume/Price Ratio* | |------|--------------|------|------------------|-------------------| | | 0.2209 | **+9.03** | 48,844,327 | **≈221** | | | 6.3170 | **+7.85** | 88,880,449 | **≈14,080** | | | 1.4488 | **+7.07** | 301,867,829 | **≈208,500** | | | 0.08763| **+7.01** | 993,326,100| **≈11,340,000** | | | 11.816 | **+6.34** | 34,474,850 | **≈2,918** | \*Volume/Price Ratio = 24s volume (USDT) ÷ price. A high ratio shows the move happened with strong liquidity support—reducing the risk of a “fake pump.” **Application:** - In Binance Spot → the “Markets” tab, sort by 24s volume and % change. - **Filter:** % change > %5 and volume/price ratio > 10 000 (for altcoins) or > 100 000 (for big coins like BTC/ETH). - The coins that match this filter are currently: , , , , . --- ### 2️⃣ Entry Signal – Simple Technical Pattern **A. Breakout + Retest (Break-and-Retest)** 1. **On the 4-hour chart** the last load
** How Does Crypto Get Bought Like a Momentum Stock? – A Practical Step-by-Step Guide with Current Data
Uniswap (UNIUSDT) is trending right now!
Rank: #27
** 🚀 **Summary:** According to today’s Binance data ( 1,159.99 +4.91 %, ,505.36 +4.65 %), the market is in a short-term uptrend. The most active coins ( +9.03 %, +7.85 %, +7.07 %, +7.01 %, +6.34 %) offer good opportunities to catch momentum. With the steps below, you can safely evaluate these moves and create an entry-exit plan. --- ### 1️⃣ Check Trend and Volume – “Why This Coin?” | Coin | Price (USDT) | 24s % | 24s Volume (USDT) | Volume/Price Ratio* | |------|--------------|------|------------------|-------------------| | | 0.2209 | **+9.03** | 48,844,327 | **≈221** | | | 6.3170 | **+7.85** | 88,880,449 | **≈14,080** | | | 1.4488 | **+7.07** | 301,867,829 | **≈208,500** | | | 0.08763| **+7.01** | 993,326,100| **≈11,340,000** | | | 11.816 | **+6.34** | 34,474,850 | **≈2,918** | \*Volume/Price Ratio = 24s volume (USDT) ÷ price. A high ratio shows the move happened with strong liquidity support—reducing the risk of a “fake pump.” **Application:** - In Binance Spot → the “Markets” tab, sort by 24s volume and % change. - **Filter:** % change > %5 and volume/price ratio > 10 000 (for altcoins) or > 100 000 (for big coins like BTC/ETH). - The coins that match this filter are currently: , , , , . --- ### 2️⃣ Entry Signal – Simple Technical Pattern **A. Breakout + Retest (Break-and-Retest)** 1. **On the 4-hour chart** the last load
Rank: #27
** 🚀 **Summary:** According to today’s Binance data ( 1,159.99 +4.91 %, ,505.36 +4.65 %), the market is in a short-term uptrend. The most active coins ( +9.03 %, +7.85 %, +7.07 %, +7.01 %, +6.34 %) offer good opportunities to catch momentum. With the steps below, you can safely evaluate these moves and create an entry-exit plan. --- ### 1️⃣ Check Trend and Volume – “Why This Coin?” | Coin | Price (USDT) | 24s % | 24s Volume (USDT) | Volume/Price Ratio* | |------|--------------|------|------------------|-------------------| | | 0.2209 | **+9.03** | 48,844,327 | **≈221** | | | 6.3170 | **+7.85** | 88,880,449 | **≈14,080** | | | 1.4488 | **+7.07** | 301,867,829 | **≈208,500** | | | 0.08763| **+7.01** | 993,326,100| **≈11,340,000** | | | 11.816 | **+6.34** | 34,474,850 | **≈2,918** | \*Volume/Price Ratio = 24s volume (USDT) ÷ price. A high ratio shows the move happened with strong liquidity support—reducing the risk of a “fake pump.” **Application:** - In Binance Spot → the “Markets” tab, sort by 24s volume and % change. - **Filter:** % change > %5 and volume/price ratio > 10 000 (for altcoins) or > 100 000 (for big coins like BTC/ETH). - The coins that match this filter are currently: , , , , . --- ### 2️⃣ Entry Signal – Simple Technical Pattern **A. Breakout + Retest (Break-and-Retest)** 1. **On the 4-hour chart** the last load
73
·
--
$CYS This 15-minute drop was down 4%, and the trading volume shot up to 2.8 times the usual level. The tape looks pretty honest—when the price is being smashed lower, OI is still rising. This isn’t any kind of “liquidation leverage” at all; it’s clearly new shorts actively entering.
The close directly broke through the lower bound of the recent range across the past 20 five-minute candlesticks. Selling pressure is dominant (buy/sell ratio 0.84), and the fund flow is equally straightforward: the nominal change in the 15-minute window is -302K, and in the 1-hour window it's -335K. Money is running out, while positions are stacking up. This is a classic add-on pattern for leveraged shorting.
The overall pool’s nominal change ranks at #27, with an abnormal percentile of 83.1%. Volume expansion combined with the boundary breakout—this is an effective event, not noise. Total trading volume over 24 hours is $138 million. The foundation is here; there’s no need to panic.
That said, with the combo of falling price plus OI increasing, the next move is either shorts continue to grind it down, or a violent rebound comes and shorts collectively get squeezed. The market is bearish, but don’t fight the trend. Also, don’t chase shorts too easily—at this level you can get swept.
Keep an eye on the 15-minute level’s volume/flow changes.
$CYS This 15-minute drop was down 4%, and the trading volume shot up to 2.8 times the usual level. The tape looks pretty honest—when the price is being smashed lower, OI is still rising. This isn’t any kind of “liquidation leverage” at all; it’s clearly new shorts actively entering.
The close directly broke through the lower bound of the recent range across the past 20 five-minute candlesticks. Selling pressure is dominant (buy/sell ratio 0.84), and the fund flow is equally straightforward: the nominal change in the 15-minute window is -302K, and in the 1-hour window it's -335K. Money is running out, while positions are stacking up. This is a classic add-on pattern for leveraged shorting.
The overall pool’s nominal change ranks at #27, with an abnormal percentile of 83.1%. Volume expansion combined with the boundary breakout—this is an effective event, not noise. Total trading volume over 24 hours is $138 million. The foundation is here; there’s no need to panic.
That said, with the combo of falling price plus OI increasing, the next move is either shorts continue to grind it down, or a violent rebound comes and shorts collectively get squeezed. The market is bearish, but don’t fight the trend. Also, don’t chase shorts too easily—at this level you can get swept.
Keep an eye on the 15-minute level’s volume/flow changes.
The close directly broke through the lower bound of the recent range across the past 20 five-minute candlesticks. Selling pressure is dominant (buy/sell ratio 0.84), and the fund flow is equally straightforward: the nominal change in the 15-minute window is -302K, and in the 1-hour window it's -335K. Money is running out, while positions are stacking up. This is a classic add-on pattern for leveraged shorting.
The overall pool’s nominal change ranks at #27, with an abnormal percentile of 83.1%. Volume expansion combined with the boundary breakout—this is an effective event, not noise. Total trading volume over 24 hours is $138 million. The foundation is here; there’s no need to panic.
That said, with the combo of falling price plus OI increasing, the next move is either shorts continue to grind it down, or a violent rebound comes and shorts collectively get squeezed. The market is bearish, but don’t fight the trend. Also, don’t chase shorts too easily—at this level you can get swept.
Keep an eye on the 15-minute level’s volume/flow changes.
33
·
--
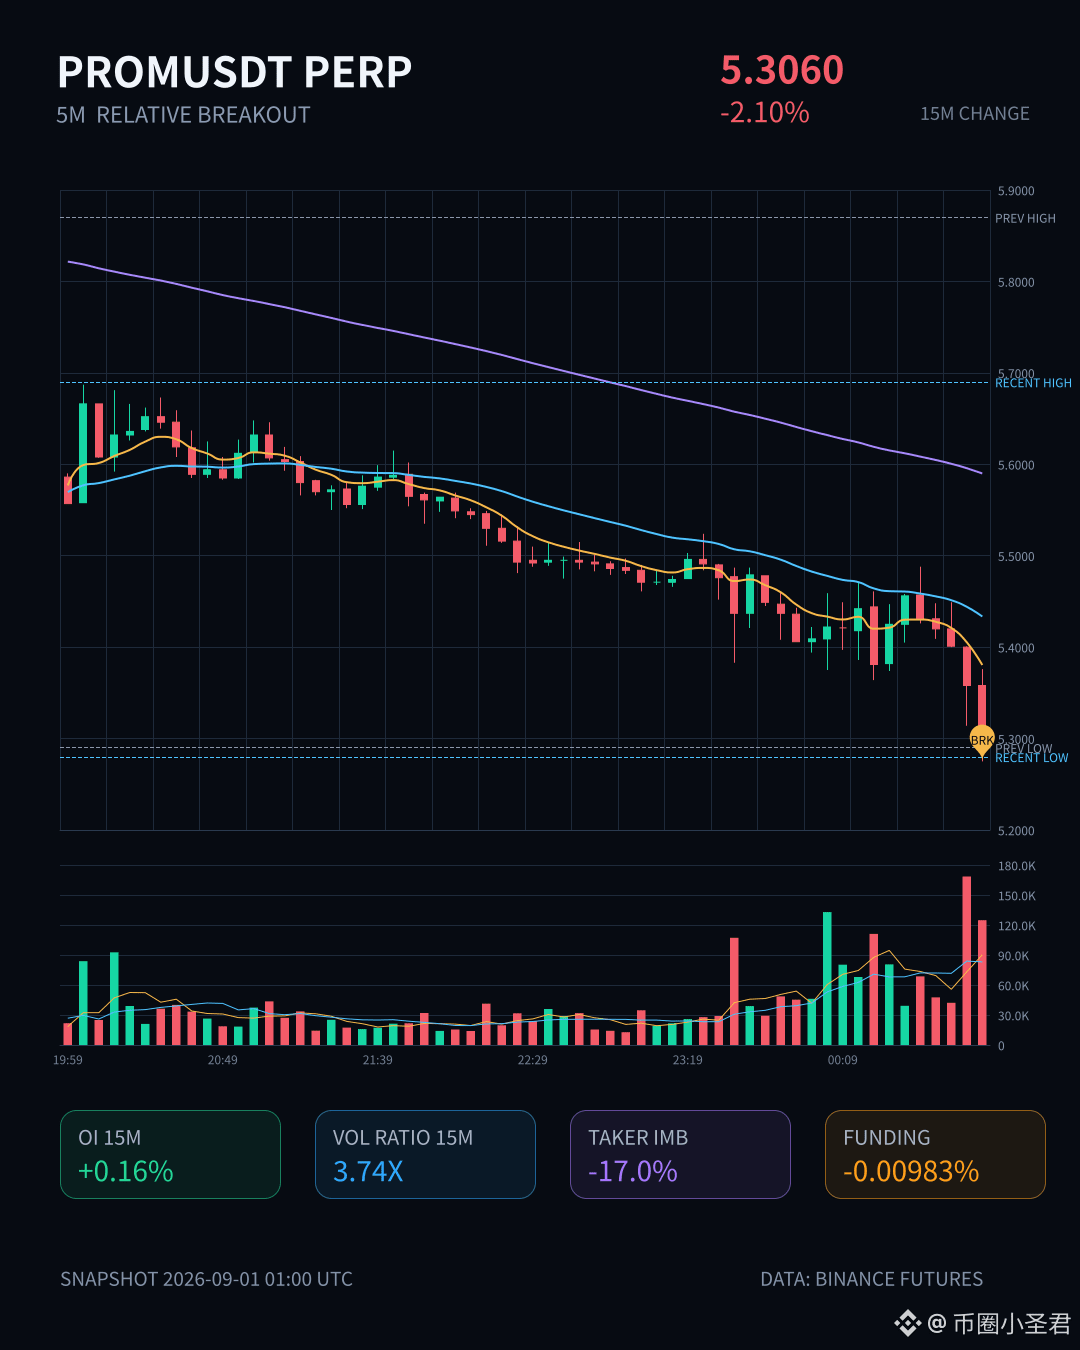
$PROM In this 15-minute move, it directly breaks through the recent lows. While falling 2.1%, the trading volume has surged to 3.74x. The abnormality ranks #27 across the entire pool, and the notional change is also squeezed into the top 15—so it’s hard to say this is only a normal pullback.
What’s interesting is that as the price is dropping, OI is actually rising: the 15-minute contracts are +0.16%, and the 1-hour is +1.17%. This looks more like newly added leveraged short positions entering the market rather than old longs cutting losses. Active volume is down -17%, and the buy/sell ratio of 0.71 also confirms that the selling pressure is strongly directional.
After breaking below the lower edge of the last 20 five-minute candlesticks, the short-term structure has turned bearish. But if the shorts added leverage right from this level, the next step is either to accelerate into probing lower prices, or get blown up by a counter-pull. This kind of divergence pattern often turns out to be extremely violent.
In the past 24 hours, trading value is still $245 million, so liquidity is sufficient. Directionally, I lean toward staying bearish rather than chasing. I’d wait for a high-volume wick/pin (a large sell-off spike) or a sudden drop in OI as a signal before taking action.
$PROM In this 15-minute move, it directly breaks through the recent lows. While falling 2.1%, the trading volume has surged to 3.74x. The abnormality ranks #27 across the entire pool, and the notional change is also squeezed into the top 15—so it’s hard to say this is only a normal pullback.
What’s interesting is that as the price is dropping, OI is actually rising: the 15-minute contracts are +0.16%, and the 1-hour is +1.17%. This looks more like newly added leveraged short positions entering the market rather than old longs cutting losses. Active volume is down -17%, and the buy/sell ratio of 0.71 also confirms that the selling pressure is strongly directional.
After breaking below the lower edge of the last 20 five-minute candlesticks, the short-term structure has turned bearish. But if the shorts added leverage right from this level, the next step is either to accelerate into probing lower prices, or get blown up by a counter-pull. This kind of divergence pattern often turns out to be extremely violent.
In the past 24 hours, trading value is still $245 million, so liquidity is sufficient. Directionally, I lean toward staying bearish rather than chasing. I’d wait for a high-volume wick/pin (a large sell-off spike) or a sudden drop in OI as a signal before taking action.
What’s interesting is that as the price is dropping, OI is actually rising: the 15-minute contracts are +0.16%, and the 1-hour is +1.17%. This looks more like newly added leveraged short positions entering the market rather than old longs cutting losses. Active volume is down -17%, and the buy/sell ratio of 0.71 also confirms that the selling pressure is strongly directional.
After breaking below the lower edge of the last 20 five-minute candlesticks, the short-term structure has turned bearish. But if the shorts added leverage right from this level, the next step is either to accelerate into probing lower prices, or get blown up by a counter-pull. This kind of divergence pattern often turns out to be extremely violent.
In the past 24 hours, trading value is still $245 million, so liquidity is sufficient. Directionally, I lean toward staying bearish rather than chasing. I’d wait for a high-volume wick/pin (a large sell-off spike) or a sudden drop in OI as a signal before taking action.
61
·
--
I spent the whole day watching the charts, and the CLO really made me take a second look.
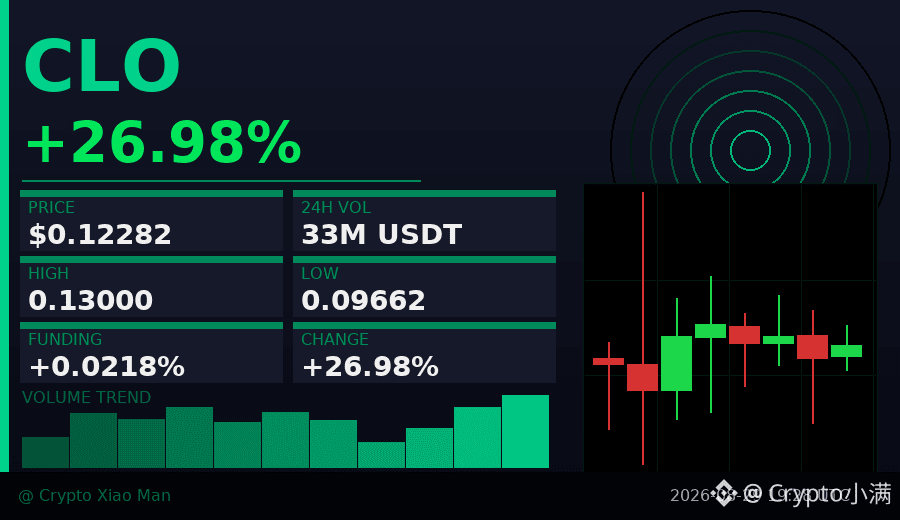
In the past 24 hours it’s up 27%. The intraday low was 0.0966 and the high was 0.13—its price range expanded directly by 34%. This isn’t a slow, “boiling the frog in warm water” type of gradual rise; it was more like someone yanked it up hard in a short period of time.
But here’s the interesting part: looking at the funding rate, it’s only 0.0218%, which is almost zero. Usually when a coin is pumped sharply, leveraged longs rush in and the funding rate spikes quickly. Here, that didn’t happen—suggesting that leveraged longs didn’t really chase in to take over the bag, and that the move might be driven from the spot market instead.
Next, the long/short ratio: 62% longs vs 38% shorts. Longs do have the edge, but it’s not to the extent of an extreme “everyone in the whole market is bullish” situation.
Trading volume is 32 million. For a coin at this scale, that counts as a volume expansion. The candlestick chart shows that it has now entered a short-term consolidation range: after spiking higher, it neither pulled back immediately nor continued breaking out—it’s been moving back and forth around 0.12.
Going sideways isn’t necessarily a bad thing. Sometimes it’s absorbing the gains and waiting for direction. But if volume can’t keep up, holding this level will become more difficult.
$CLO #资金费率异常 #27% surge behind the scenes
Click the small card below to quickly view the行情👇
I spent the whole day watching the charts, and the CLO really made me take a second look.
In the past 24 hours it’s up 27%. The intraday low was 0.0966 and the high was 0.13—its price range expanded directly by 34%. This isn’t a slow, “boiling the frog in warm water” type of gradual rise; it was more like someone yanked it up hard in a short period of time.
But here’s the interesting part: looking at the funding rate, it’s only 0.0218%, which is almost zero. Usually when a coin is pumped sharply, leveraged longs rush in and the funding rate spikes quickly. Here, that didn’t happen—suggesting that leveraged longs didn’t really chase in to take over the bag, and that the move might be driven from the spot market instead.
Next, the long/short ratio: 62% longs vs 38% shorts. Longs do have the edge, but it’s not to the extent of an extreme “everyone in the whole market is bullish” situation.
Trading volume is 32 million. For a coin at this scale, that counts as a volume expansion. The candlestick chart shows that it has now entered a short-term consolidation range: after spiking higher, it neither pulled back immediately nor continued breaking out—it’s been moving back and forth around 0.12.
Going sideways isn’t necessarily a bad thing. Sometimes it’s absorbing the gains and waiting for direction. But if volume can’t keep up, holding this level will become more difficult.
$CLO #资金费率异常 #27% surge behind the scenes
Click the small card below to quickly view the行情👇
In the past 24 hours it’s up 27%. The intraday low was 0.0966 and the high was 0.13—its price range expanded directly by 34%. This isn’t a slow, “boiling the frog in warm water” type of gradual rise; it was more like someone yanked it up hard in a short period of time.
But here’s the interesting part: looking at the funding rate, it’s only 0.0218%, which is almost zero. Usually when a coin is pumped sharply, leveraged longs rush in and the funding rate spikes quickly. Here, that didn’t happen—suggesting that leveraged longs didn’t really chase in to take over the bag, and that the move might be driven from the spot market instead.
Next, the long/short ratio: 62% longs vs 38% shorts. Longs do have the edge, but it’s not to the extent of an extreme “everyone in the whole market is bullish” situation.
Trading volume is 32 million. For a coin at this scale, that counts as a volume expansion. The candlestick chart shows that it has now entered a short-term consolidation range: after spiking higher, it neither pulled back immediately nor continued breaking out—it’s been moving back and forth around 0.12.
Going sideways isn’t necessarily a bad thing. Sometimes it’s absorbing the gains and waiting for direction. But if volume can’t keep up, holding this level will become more difficult.
$CLO #资金费率异常 #27% surge behind the scenes
Click the small card below to quickly view the行情👇
58
·
--
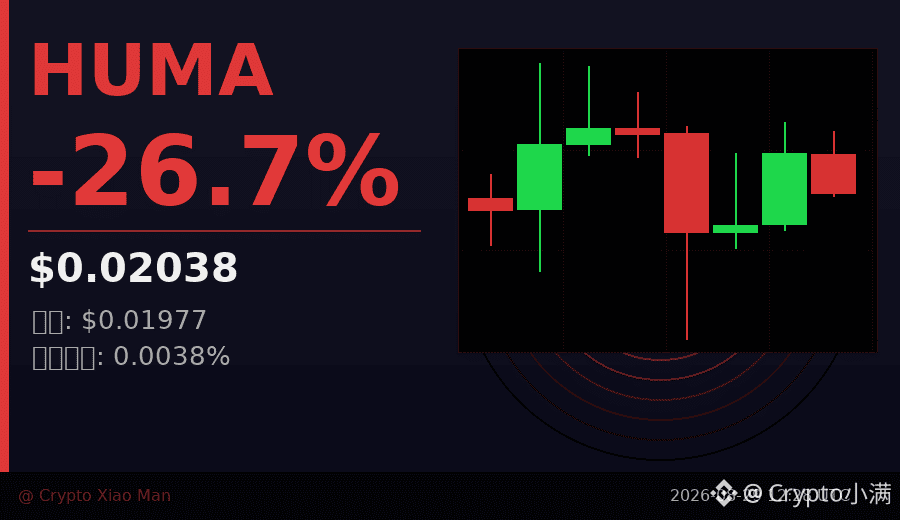
Fell 27%, yet shorts are still adding to their positions—this signal is worth paying attention to.
Today, HUMA has dropped from a high of 0.0278 all the way to around 0.0198. The decline is close to 27%, making it one of the largest single-day pullbacks in the recent period.
But what concerns me isn’t the drop itself, but the long-to-short ratio: shorts account for 57.75%, while longs are only 42.25%. In other words, even after prices have fallen this much, more than half of the market participants are still shorting.
Both of these possibilities should be considered:
1) The short sellers believe there’s still room for further downside and keep applying pressure;
2) Shorts are overly concentrated—if any rebound signal appears, a short-squeeze could come very quickly.
Looking at the candlesticks, the recent candles have been chopping around 0.0200. The low at 0.0197 hasn’t seen an effective break below it. The range is tight and volume is shrinking—this kind of consolidation is often a quiet period before direction is chosen.
The funding rate is just 0.00384%, which is very low, indicating there isn’t much willingness among longs to pay to stubbornly hold on. Market sentiment is relatively cautious.
At this level, 0.0197 is a soft support line. As long as it holds, the short sellers’ pressure is temporarily manageable. If it breaks, shorts may push the price lower further.
No rush to judge direction—first, see whether 0.0197 can hold.
$HUMA #多空博弈 #27%暴跌
Click the small card below to quickly view the行情👇
Fell 27%, yet shorts are still adding to their positions—this signal is worth paying attention to.
Today, HUMA has dropped from a high of 0.0278 all the way to around 0.0198. The decline is close to 27%, making it one of the largest single-day pullbacks in the recent period.
But what concerns me isn’t the drop itself, but the long-to-short ratio: shorts account for 57.75%, while longs are only 42.25%. In other words, even after prices have fallen this much, more than half of the market participants are still shorting.
Both of these possibilities should be considered:
1) The short sellers believe there’s still room for further downside and keep applying pressure;
2) Shorts are overly concentrated—if any rebound signal appears, a short-squeeze could come very quickly.
Looking at the candlesticks, the recent candles have been chopping around 0.0200. The low at 0.0197 hasn’t seen an effective break below it. The range is tight and volume is shrinking—this kind of consolidation is often a quiet period before direction is chosen.
The funding rate is just 0.00384%, which is very low, indicating there isn’t much willingness among longs to pay to stubbornly hold on. Market sentiment is relatively cautious.
At this level, 0.0197 is a soft support line. As long as it holds, the short sellers’ pressure is temporarily manageable. If it breaks, shorts may push the price lower further.
No rush to judge direction—first, see whether 0.0197 can hold.
$HUMA #多空博弈 #27%暴跌
Click the small card below to quickly view the行情👇
Today, HUMA has dropped from a high of 0.0278 all the way to around 0.0198. The decline is close to 27%, making it one of the largest single-day pullbacks in the recent period.
But what concerns me isn’t the drop itself, but the long-to-short ratio: shorts account for 57.75%, while longs are only 42.25%. In other words, even after prices have fallen this much, more than half of the market participants are still shorting.
Both of these possibilities should be considered:
1) The short sellers believe there’s still room for further downside and keep applying pressure;
2) Shorts are overly concentrated—if any rebound signal appears, a short-squeeze could come very quickly.
Looking at the candlesticks, the recent candles have been chopping around 0.0200. The low at 0.0197 hasn’t seen an effective break below it. The range is tight and volume is shrinking—this kind of consolidation is often a quiet period before direction is chosen.
The funding rate is just 0.00384%, which is very low, indicating there isn’t much willingness among longs to pay to stubbornly hold on. Market sentiment is relatively cautious.
At this level, 0.0197 is a soft support line. As long as it holds, the short sellers’ pressure is temporarily manageable. If it breaks, shorts may push the price lower further.
No rush to judge direction—first, see whether 0.0197 can hold.
$HUMA #多空博弈 #27%暴跌
Click the small card below to quickly view the行情👇
28
Log in to explore more content
Join global crypto users on Binance Square
⚡️ Get latest and useful information about crypto.
💬 Trusted by the world’s largest crypto exchange.
👍 Discover real insights from verified creators.
Email / Phone number
Trending Topics
1
#DotPlotSignalsOneMoreHikeIn2026
12,138 views
285 Discussing
2
#RobinhoodToSupportCircleArcNetwork
1,133 views
61 Discussing
3
#FedHikes25BpsUSStocksClose
15,823 views
252 Discussing
4
#AaveToLaunchRWAMarketOnAvalanche
4,558 views
118 Discussing
5
#CryptoVCFundingRebounds$5.6BInQ2
6,188 views
34 Discussing
6
#RevolutHackersDemand$3MInMonero
365 views
8 Discussing
7
#ZcashRises6%
113,001 views
976 Discussing
8
#XRPSinks10%
68,801 views
661 Discussing
9
#BitcoinETFsShed$450M
10,911 views
113 Discussing
10
#CircleOpensArcMainnet
29,058 views
400 Discussing