

Singel70
596 Posts

Singel70
Report
Block User
Market Analysis | Trade Signals | Risk Management
Open Trade
High-Frequency Trader
6.7 Years
6 Following
162 Followers
532 Liked
Posts
Portfolio
All
Quotes
Videos
·
--
Verified
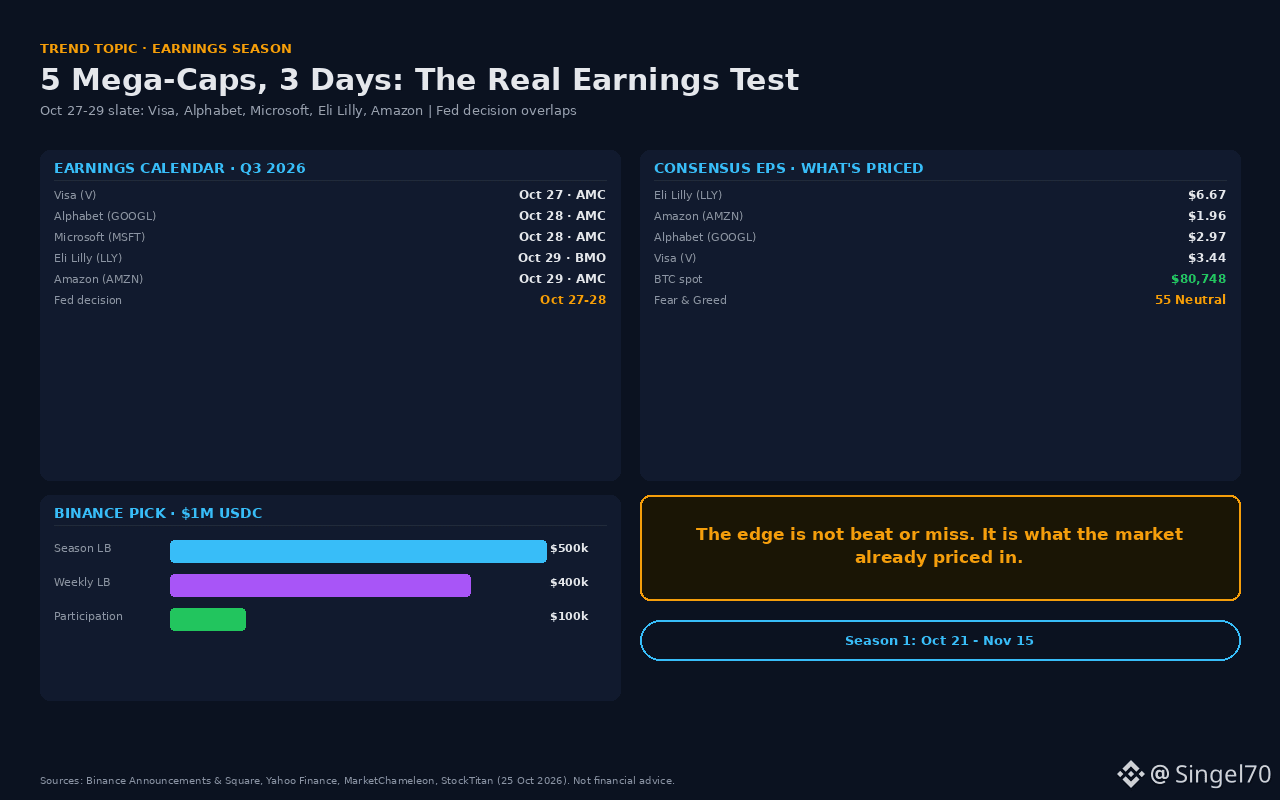
#EarningsSeason This week, the earnings calendar will determine crypto’s direction: 5 major reports in 3 days.
📌 Calendar (US, Q3 2026 · source: Yahoo Finance / MarketChameleon, Oct 25):
• Oct 27: Visa (V) — after market close
• Oct 28: Alphabet (GOOGL) + Microsoft (MSFT) — after market close
• Oct 29: Eli Lilly (LLY) — before market open | Amazon (AMZN) — after market close
• Same window: Fed rate decision, Oct 27–28
📊 Consensus EPS (market expectations):
• LLY $6.67 | AMZN $1.96 | GOOGL $2.97 | V $3.44
• The key point: a “beat” alone isn’t enough; the question is how much of the expectation is already priced in.
🐋 Crypto connection:
• BTC $80,748 (+0.5%) | ETH $2,354 (+1.2%)
• Fear & Greed: 55 (Neutral)
• Last week’s Nasdaq selloff pushed BTC below $80k; this week, AI capex guidance will determine risk appetite.
🎯 Binance Pick angle (campaign information, not investment advice):
• Season 1: Oct 21 – Nov 15, $1M USDC total
• Season LB $500k (top 20,000) | Weekly $400k ($100k per week, top 8,000) | Participation $100k
• The Earnings category is now open; it’s possible to base predictions on expectations for these 5 reports.
📌 My view: Rather than predicting a beat or miss, focusing on “which numbers are already priced in” may offer higher returns. LLY and AMZN have asymmetric timing; AI capex guidance is the key risk for GOOGL/MSFT.
Which of these 5 reports do you think will shake $BTC the most? Write your prediction with $USDC .
#EarningsSeason #BinancePick #Crypto
This is not financial advice.
#EarningsSeason This week, the earnings calendar will determine crypto’s direction: 5 major reports in 3 days.
📌 Calendar (US, Q3 2026 · source: Yahoo Finance / MarketChameleon, Oct 25):
• Oct 27: Visa (V) — after market close
• Oct 28: Alphabet (GOOGL) + Microsoft (MSFT) — after market close
• Oct 29: Eli Lilly (LLY) — before market open | Amazon (AMZN) — after market close
• Same window: Fed rate decision, Oct 27–28
📊 Consensus EPS (market expectations):
• LLY $6.67 | AMZN $1.96 | GOOGL $2.97 | V $3.44
• The key point: a “beat” alone isn’t enough; the question is how much of the expectation is already priced in.
🐋 Crypto connection:
• BTC $80,748 (+0.5%) | ETH $2,354 (+1.2%)
• Fear & Greed: 55 (Neutral)
• Last week’s Nasdaq selloff pushed BTC below $80k; this week, AI capex guidance will determine risk appetite.
🎯 Binance Pick angle (campaign information, not investment advice):
• Season 1: Oct 21 – Nov 15, $1M USDC total
• Season LB $500k (top 20,000) | Weekly $400k ($100k per week, top 8,000) | Participation $100k
• The Earnings category is now open; it’s possible to base predictions on expectations for these 5 reports.
📌 My view: Rather than predicting a beat or miss, focusing on “which numbers are already priced in” may offer higher returns. LLY and AMZN have asymmetric timing; AI capex guidance is the key risk for GOOGL/MSFT.
Which of these 5 reports do you think will shake $BTC the most? Write your prediction with $USDC .
#EarningsSeason #BinancePick #Crypto
This is not financial advice.
📌 Calendar (US, Q3 2026 · source: Yahoo Finance / MarketChameleon, Oct 25):
• Oct 27: Visa (V) — after market close
• Oct 28: Alphabet (GOOGL) + Microsoft (MSFT) — after market close
• Oct 29: Eli Lilly (LLY) — before market open | Amazon (AMZN) — after market close
• Same window: Fed rate decision, Oct 27–28
📊 Consensus EPS (market expectations):
• LLY $6.67 | AMZN $1.96 | GOOGL $2.97 | V $3.44
• The key point: a “beat” alone isn’t enough; the question is how much of the expectation is already priced in.
🐋 Crypto connection:
• BTC $80,748 (+0.5%) | ETH $2,354 (+1.2%)
• Fear & Greed: 55 (Neutral)
• Last week’s Nasdaq selloff pushed BTC below $80k; this week, AI capex guidance will determine risk appetite.
🎯 Binance Pick angle (campaign information, not investment advice):
• Season 1: Oct 21 – Nov 15, $1M USDC total
• Season LB $500k (top 20,000) | Weekly $400k ($100k per week, top 8,000) | Participation $100k
• The Earnings category is now open; it’s possible to base predictions on expectations for these 5 reports.
📌 My view: Rather than predicting a beat or miss, focusing on “which numbers are already priced in” may offer higher returns. LLY and AMZN have asymmetric timing; AI capex guidance is the key risk for GOOGL/MSFT.
Which of these 5 reports do you think will shake $BTC the most? Write your prediction with $USDC .
#EarningsSeason #BinancePick #Crypto
This is not financial advice.
1
124
·
--
Verified
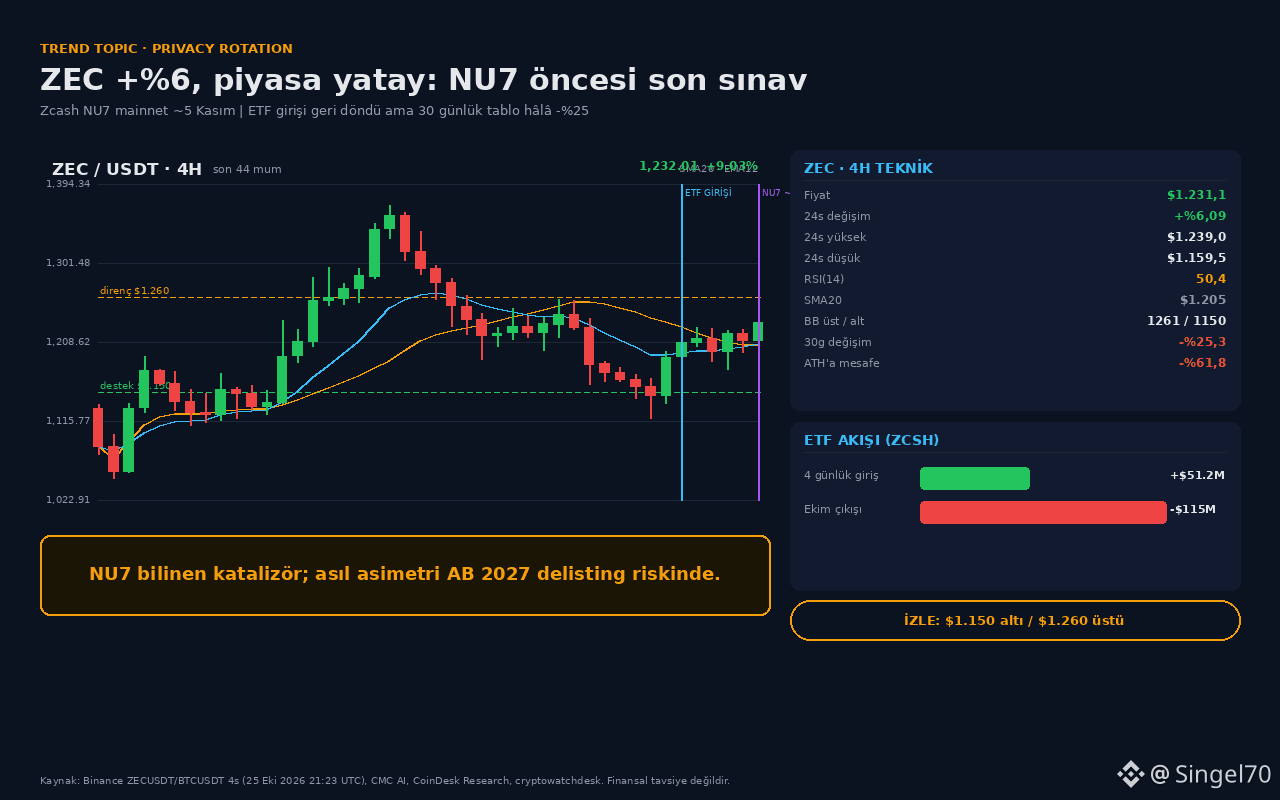
There’s a notable move in Zcash while BTC trades sideways: ZEC is up approximately 6% over the last 24 hours.
📊 Binance spot data as of October 25, 2026, 21:23 UTC:
• ZEC: $1,231.1
• 24h change: +6.09%
• 24h price range: $1,159.5 – $1,239.0
• 24h volume: ~$117M
• BTC: $80,748 — +0.53%
📈 4-hour technical outlook:
• SMA20: $1,205
• EMA12: $1,207
• RSI(14): 50.4 — neither overbought nor oversold
• Upper Bollinger Band: $1,260.6
• Lower Bollinger Band: $1,149.8
The price is above short-term averages, but has not yet broken above the $1,260 area. A move above this level supported by volume could be worth watching as a sign of continued momentum.
🐋 Developments in focus:
• Inflows into the Grayscale Zcash ETF have been seen in recent days. However, due to earlier outflows this month, the overall flow picture remains unbalanced.
• The NU7 upgrade is expected to go live around November 5. The upgrade is planned to reduce block time from 75 seconds to 25 seconds.
• ZEC is still down approximately 25% over the last 30 days and is trading well below its all-time high.
⚠️ Risk note:
Since NU7 is already a well-known development in the market, profit-taking may occur as the event approaches or afterward. Regulatory developments concerning privacy-focused assets may also affect access, liquidity, and market interest.
📌 Scenarios to watch:
• A 4-hour close above $1,260 supported by volume could strengthen the short-term outlook.
• Weakness below $1,150 could signal increased downside risk.
Is this move in ZEC the beginning of a broader rotation into privacy-focused coins, or just short-term interest ahead of NU7?
#ZEC #Zcash #NU7 #Crypto #BinanceSquare #Write2Earn
This is not financial advice.
There’s a notable move in Zcash while BTC trades sideways: ZEC is up approximately 6% over the last 24 hours.
📊 Binance spot data as of October 25, 2026, 21:23 UTC: • ZEC: $1,231.1
• 24h change: +6.09%
• 24h price range: $1,159.5 – $1,239.0
• 24h volume: ~$117M
• BTC: $80,748 — +0.53%
📈 4-hour technical outlook: • SMA20: $1,205
• EMA12: $1,207
• RSI(14): 50.4 — neither overbought nor oversold
• Upper Bollinger Band: $1,260.6
• Lower Bollinger Band: $1,149.8
The price is above short-term averages, but has not yet broken above the $1,260 area. A move above this level supported by volume could be worth watching as a sign of continued momentum.
🐋 Developments in focus: • Inflows into the Grayscale Zcash ETF have been seen in recent days. However, due to earlier outflows this month, the overall flow picture remains unbalanced.
• The NU7 upgrade is expected to go live around November 5. The upgrade is planned to reduce block time from 75 seconds to 25 seconds.
• ZEC is still down approximately 25% over the last 30 days and is trading well below its all-time high.
⚠️ Risk note:
Since NU7 is already a well-known development in the market, profit-taking may occur as the event approaches or afterward. Regulatory developments concerning privacy-focused assets may also affect access, liquidity, and market interest.
📌 Scenarios to watch: • A 4-hour close above $1,260 supported by volume could strengthen the short-term outlook.
• Weakness below $1,150 could signal increased downside risk.
Is this move in ZEC the beginning of a broader rotation into privacy-focused coins, or just short-term interest ahead of NU7?
#ZEC #Zcash #NU7 #Crypto #BinanceSquare #Write2Earn
This is not financial advice.
📊 Binance spot data as of October 25, 2026, 21:23 UTC: • ZEC: $1,231.1
• 24h change: +6.09%
• 24h price range: $1,159.5 – $1,239.0
• 24h volume: ~$117M
• BTC: $80,748 — +0.53%
📈 4-hour technical outlook: • SMA20: $1,205
• EMA12: $1,207
• RSI(14): 50.4 — neither overbought nor oversold
• Upper Bollinger Band: $1,260.6
• Lower Bollinger Band: $1,149.8
The price is above short-term averages, but has not yet broken above the $1,260 area. A move above this level supported by volume could be worth watching as a sign of continued momentum.
🐋 Developments in focus: • Inflows into the Grayscale Zcash ETF have been seen in recent days. However, due to earlier outflows this month, the overall flow picture remains unbalanced.
• The NU7 upgrade is expected to go live around November 5. The upgrade is planned to reduce block time from 75 seconds to 25 seconds.
• ZEC is still down approximately 25% over the last 30 days and is trading well below its all-time high.
⚠️ Risk note:
Since NU7 is already a well-known development in the market, profit-taking may occur as the event approaches or afterward. Regulatory developments concerning privacy-focused assets may also affect access, liquidity, and market interest.
📌 Scenarios to watch: • A 4-hour close above $1,260 supported by volume could strengthen the short-term outlook.
• Weakness below $1,150 could signal increased downside risk.
Is this move in ZEC the beginning of a broader rotation into privacy-focused coins, or just short-term interest ahead of NU7?
#ZEC #Zcash #NU7 #Crypto #BinanceSquare #Write2Earn
This is not financial advice.
1
243
·
--
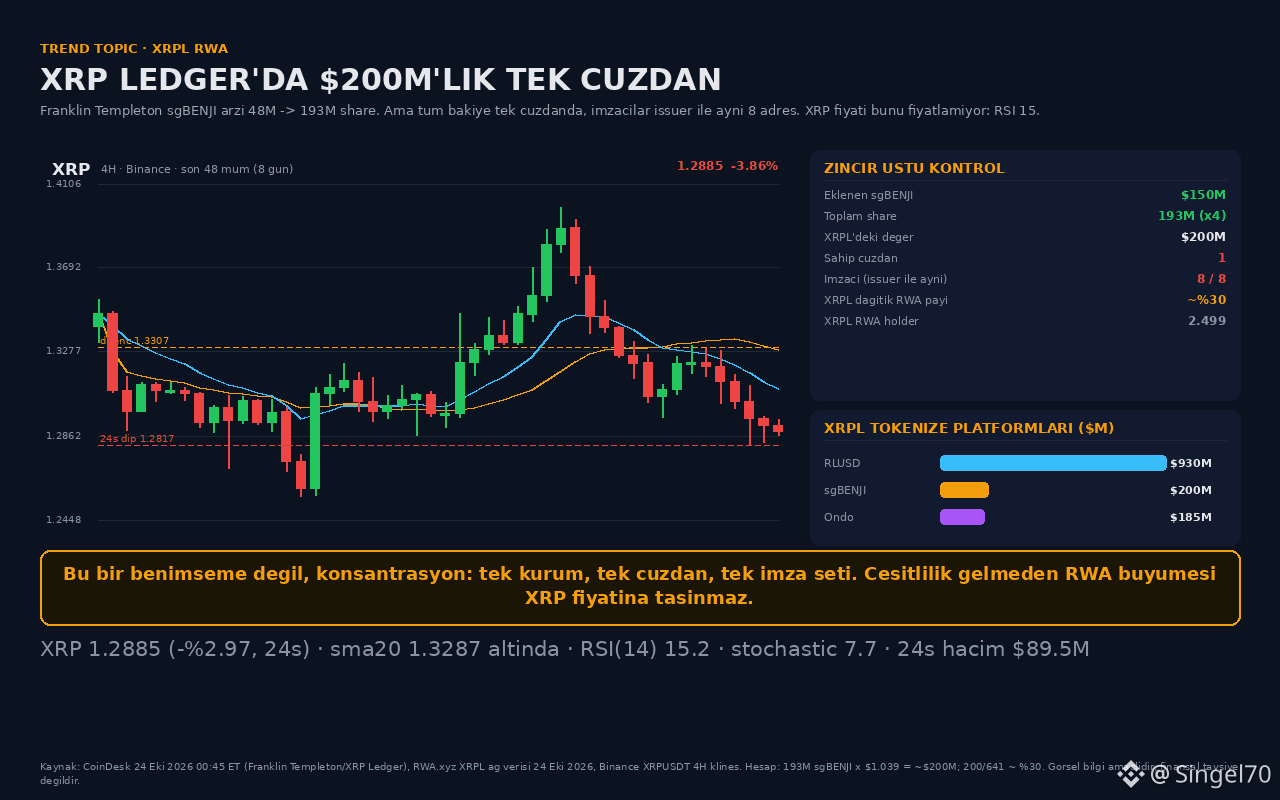
$XRP On Ledger, the "$150 million institutional adoption" is actually a mint to a single wallet.
📌 The real numbers (CoinDesk, Oct 24, 2026)
• Franklin Templeton increased the sgBENJI supply from ~48M to ~193M shares (+$150M)
• At $1.039/share, the total value on XRPL is ~$200M
• All the new shares went to a SINGLE wallet. That wallet and the issuer authorize the same 8 signer addresses; any two can approve a transaction
• Franklin can freeze or claw back the balance if needed
📉 The price isn't pricing this in
XRP 1.2885 (-2.97%, 24h), 24h range 1.2817–1.3307. Below SMA20 at 1.3287 and EMA12 at 1.3095; RSI(14) 15.2, stochastic 7.7. It's oversold, but there's no bounce.
🐋 The real on-chain picture
RWA.xyz XRPL network: distributed RWA value of $641M (+27.6%, 30 days), with $7.03B in transfer volume over 30 days. But the number of RWA holders is just 2,499 (+0.4%, 30 days). A single sgBENJI wallet holds roughly 30% of this distributed value. In other words, volume is growing, but the user base isn't.
🎯 Plan
A 4h close above 1.30 → a test of 1.33 and 1.36. A 4h close below 1.2817 → the 1.26 zone. Chasing shorts with RSI at 15 is poor R:R; likewise, it's wrong to interpret a single-wallet mint as "new institutional demand." My bias is neutral-to-bearish: no buying until the structure at 1.33 breaks.
📌 Do you think $200M concentrated in a single wallet counts as "institutional demand," or is it just an accounting move? Let me know in the comments.
#XRP #XRPL #RWA #sgBENJI #Tokenization
Not financial advice.
$XRP On Ledger, the "$150 million institutional adoption" is actually a mint to a single wallet.
📌 The real numbers (CoinDesk, Oct 24, 2026)
• Franklin Templeton increased the sgBENJI supply from ~48M to ~193M shares (+$150M)
• At $1.039/share, the total value on XRPL is ~$200M
• All the new shares went to a SINGLE wallet. That wallet and the issuer authorize the same 8 signer addresses; any two can approve a transaction
• Franklin can freeze or claw back the balance if needed
📉 The price isn't pricing this in
XRP 1.2885 (-2.97%, 24h), 24h range 1.2817–1.3307. Below SMA20 at 1.3287 and EMA12 at 1.3095; RSI(14) 15.2, stochastic 7.7. It's oversold, but there's no bounce.
🐋 The real on-chain picture
RWA.xyz XRPL network: distributed RWA value of $641M (+27.6%, 30 days), with $7.03B in transfer volume over 30 days. But the number of RWA holders is just 2,499 (+0.4%, 30 days). A single sgBENJI wallet holds roughly 30% of this distributed value. In other words, volume is growing, but the user base isn't.
🎯 Plan
A 4h close above 1.30 → a test of 1.33 and 1.36. A 4h close below 1.2817 → the 1.26 zone. Chasing shorts with RSI at 15 is poor R:R; likewise, it's wrong to interpret a single-wallet mint as "new institutional demand." My bias is neutral-to-bearish: no buying until the structure at 1.33 breaks.
📌 Do you think $200M concentrated in a single wallet counts as "institutional demand," or is it just an accounting move? Let me know in the comments.
#XRP #XRPL #RWA #sgBENJI #Tokenization
Not financial advice.
📌 The real numbers (CoinDesk, Oct 24, 2026)
• Franklin Templeton increased the sgBENJI supply from ~48M to ~193M shares (+$150M)
• At $1.039/share, the total value on XRPL is ~$200M
• All the new shares went to a SINGLE wallet. That wallet and the issuer authorize the same 8 signer addresses; any two can approve a transaction
• Franklin can freeze or claw back the balance if needed
📉 The price isn't pricing this in
XRP 1.2885 (-2.97%, 24h), 24h range 1.2817–1.3307. Below SMA20 at 1.3287 and EMA12 at 1.3095; RSI(14) 15.2, stochastic 7.7. It's oversold, but there's no bounce.
🐋 The real on-chain picture
RWA.xyz XRPL network: distributed RWA value of $641M (+27.6%, 30 days), with $7.03B in transfer volume over 30 days. But the number of RWA holders is just 2,499 (+0.4%, 30 days). A single sgBENJI wallet holds roughly 30% of this distributed value. In other words, volume is growing, but the user base isn't.
🎯 Plan
A 4h close above 1.30 → a test of 1.33 and 1.36. A 4h close below 1.2817 → the 1.26 zone. Chasing shorts with RSI at 15 is poor R:R; likewise, it's wrong to interpret a single-wallet mint as "new institutional demand." My bias is neutral-to-bearish: no buying until the structure at 1.33 breaks.
📌 Do you think $200M concentrated in a single wallet counts as "institutional demand," or is it just an accounting move? Let me know in the comments.
#XRP #XRPL #RWA #sgBENJI #Tokenization
Not financial advice.
1
55
·
--
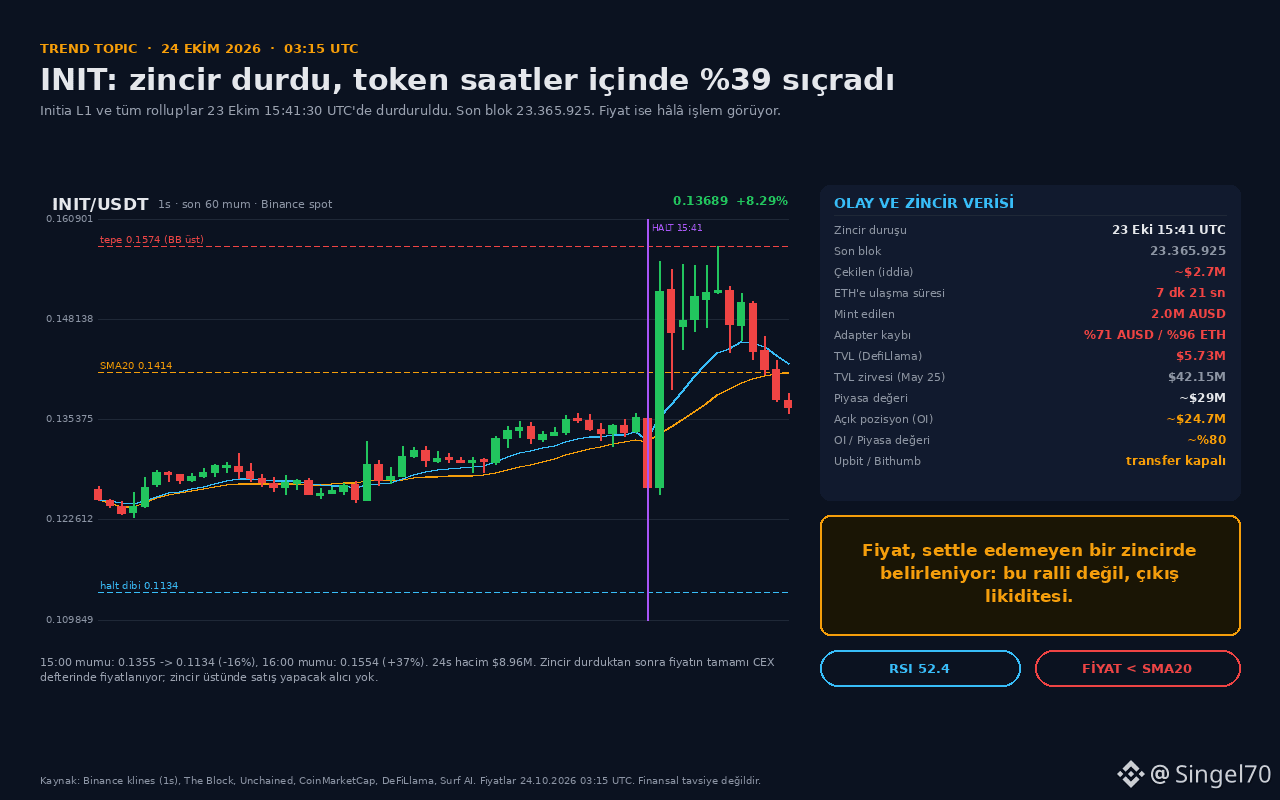
#InitiaHalt The chain stopped at block 23,365,925, but why is the INIT price still moving?
📌 Actual figures (24.10.2026 03:15 UTC)
• INIT: $0.13689, 24h +3.5%; intraday range 0.11337–0.15738
• 24h volume: $8.96M (Binance spot)
• Chain: stopped on Oct 23 at 15:41:30 UTC, last block 23,365,925, no restart date
• Drained (alleged): ~$2.7M; according to D2 Finance, $2.65M reached ETH in 7 min 21 sec
• TVL: $5.73M (DefiLlama) — May 2025 peak: $42.15M
📉 Reading the data
At the time of the halt, price went from 0.1355 → 0.1134 (-16%), then to 0.1554 (+37%) an hour later. Now at 0.13689, the entire bounce has been given back. Price is below the SMA20 (0.1414), EMA12 (0.1426), and EMA26 (0.1400); RSI is 52, with a clear rejection from the upper BB at 0.1571. The structure hasn't fully broken down, but there's no momentum either.
🐋 On-chain evidence
The attacker minted 2M unbacked AUSD and bridged it to Ethereum via LayerZero: 1.4M AUSD (71% of the adapter), 105 ETH (96%), and 1.08M USDC; 1,135.5 ETH was consolidated at a single address. Upbit and Bithumb halted INIT deposits and withdrawals. Open interest is ~$24.7M, market cap ~$29M: OI/MCAP ~80%. In other words, leverage—not spot demand—is driving the price.
🎯 Plan
It's too early to say “buy the dip” here; whether this is a supply shock or exit liquidity on a halted chain will become clearer once the official post-mortem is released.
• Aggressive: No longs without a 1h close above 0.1414 (SMA20).
• Conservative: Wait for a restart and loss disclosure; a close below 0.1134 opens the risk of a new low.
• Short-term downside looks more likely; upside returns only with a high-volume close above 0.1574.
My view: price discovery isn't healthy until the chain is back online, and conditions aren't suitable for leveraged longs.
📌 What do you think will determine INIT's direction: the restart or the loss figure to be disclosed?
#InitiaHalt #INIT $INIT #OnChain #RiskManagement
Not financial advice.
#InitiaHalt The chain stopped at block 23,365,925, but why is the INIT price still moving?
📌 Actual figures (24.10.2026 03:15 UTC)
• INIT: $0.13689, 24h +3.5%; intraday range 0.11337–0.15738
• 24h volume: $8.96M (Binance spot)
• Chain: stopped on Oct 23 at 15:41:30 UTC, last block 23,365,925, no restart date
• Drained (alleged): ~$2.7M; according to D2 Finance, $2.65M reached ETH in 7 min 21 sec
• TVL: $5.73M (DefiLlama) — May 2025 peak: $42.15M
📉 Reading the data
At the time of the halt, price went from 0.1355 → 0.1134 (-16%), then to 0.1554 (+37%) an hour later. Now at 0.13689, the entire bounce has been given back. Price is below the SMA20 (0.1414), EMA12 (0.1426), and EMA26 (0.1400); RSI is 52, with a clear rejection from the upper BB at 0.1571. The structure hasn't fully broken down, but there's no momentum either.
🐋 On-chain evidence
The attacker minted 2M unbacked AUSD and bridged it to Ethereum via LayerZero: 1.4M AUSD (71% of the adapter), 105 ETH (96%), and 1.08M USDC; 1,135.5 ETH was consolidated at a single address. Upbit and Bithumb halted INIT deposits and withdrawals. Open interest is ~$24.7M, market cap ~$29M: OI/MCAP ~80%. In other words, leverage—not spot demand—is driving the price.
🎯 Plan
It's too early to say “buy the dip” here; whether this is a supply shock or exit liquidity on a halted chain will become clearer once the official post-mortem is released.
• Aggressive: No longs without a 1h close above 0.1414 (SMA20).
• Conservative: Wait for a restart and loss disclosure; a close below 0.1134 opens the risk of a new low.
• Short-term downside looks more likely; upside returns only with a high-volume close above 0.1574.
My view: price discovery isn't healthy until the chain is back online, and conditions aren't suitable for leveraged longs.
📌 What do you think will determine INIT's direction: the restart or the loss figure to be disclosed?
#InitiaHalt #INIT $INIT #OnChain #RiskManagement
Not financial advice.
📌 Actual figures (24.10.2026 03:15 UTC)
• INIT: $0.13689, 24h +3.5%; intraday range 0.11337–0.15738
• 24h volume: $8.96M (Binance spot)
• Chain: stopped on Oct 23 at 15:41:30 UTC, last block 23,365,925, no restart date
• Drained (alleged): ~$2.7M; according to D2 Finance, $2.65M reached ETH in 7 min 21 sec
• TVL: $5.73M (DefiLlama) — May 2025 peak: $42.15M
📉 Reading the data
At the time of the halt, price went from 0.1355 → 0.1134 (-16%), then to 0.1554 (+37%) an hour later. Now at 0.13689, the entire bounce has been given back. Price is below the SMA20 (0.1414), EMA12 (0.1426), and EMA26 (0.1400); RSI is 52, with a clear rejection from the upper BB at 0.1571. The structure hasn't fully broken down, but there's no momentum either.
🐋 On-chain evidence
The attacker minted 2M unbacked AUSD and bridged it to Ethereum via LayerZero: 1.4M AUSD (71% of the adapter), 105 ETH (96%), and 1.08M USDC; 1,135.5 ETH was consolidated at a single address. Upbit and Bithumb halted INIT deposits and withdrawals. Open interest is ~$24.7M, market cap ~$29M: OI/MCAP ~80%. In other words, leverage—not spot demand—is driving the price.
🎯 Plan
It's too early to say “buy the dip” here; whether this is a supply shock or exit liquidity on a halted chain will become clearer once the official post-mortem is released.
• Aggressive: No longs without a 1h close above 0.1414 (SMA20).
• Conservative: Wait for a restart and loss disclosure; a close below 0.1134 opens the risk of a new low.
• Short-term downside looks more likely; upside returns only with a high-volume close above 0.1574.
My view: price discovery isn't healthy until the chain is back online, and conditions aren't suitable for leveraged longs.
📌 What do you think will determine INIT's direction: the restart or the loss figure to be disclosed?
#InitiaHalt #INIT $INIT #OnChain #RiskManagement
Not financial advice.
1
93
·
--
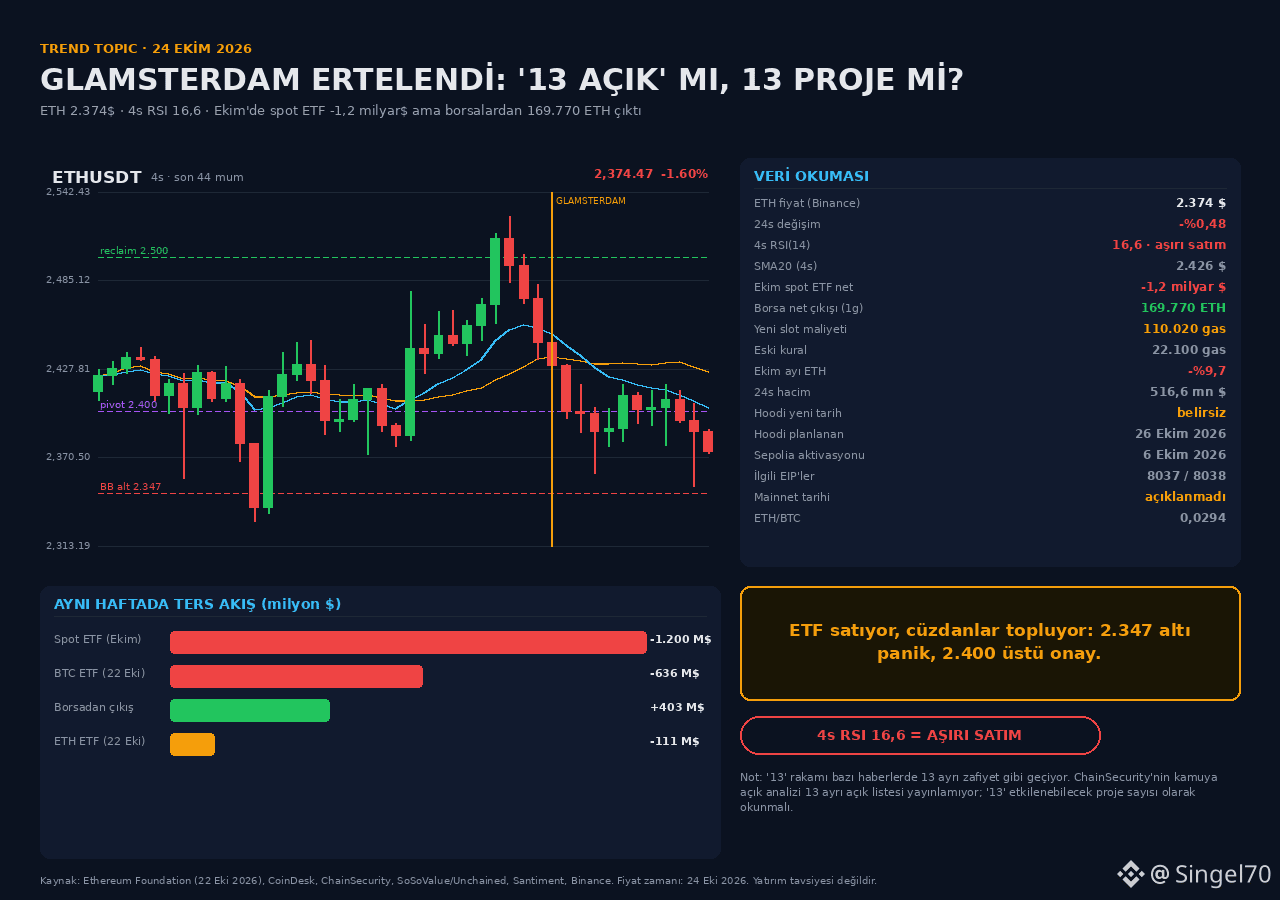
Those panic-selling below #Glamsterdam 2.347$ think they’re facing 13 separate exploits. But the real story is in the flow.
📌 The real numbers (October 24, 2026)
• $ETH 2.374$, 24h -0.48%; 4h RSI 16.6 (oversold), SMA20 2.426$
• Hoodi activation was postponed indefinitely from October 26 at 17:42 UTC; there’s no new date, and the 200M gas target has also been shelved (Ethereum Foundation, October 22)
• Sepolia passed on October 6; a mainnet date was never announced
• Spot ETH ETFs saw net outflows of -1.2 billion$ in October (the worst month of the year); a single-day outflow of -111 million$ on October 22
📉 Technical analysis
Price is at 2.374$, just below the 2.400 pivot and trying to hold above 2.347 (the lower Bollinger Band). A 4h RSI of 16.6 is historically rare oversold territory; a break below 2.330 invalidates the scenario, while a close above 2.500 would confirm a bottom.
🐋 On-chain contradiction
That same week, a net 169.770 ETH (~403 million$) left exchanges—the largest daily outflow in over 4 months (Santiment). Coins are being withdrawn from exchanges even as ETFs sell. This looks more like a change of hands than panic selling.
🔍 ‘13’ is being misread
ChainSecurity’s public analysis does not list 13 separate vulnerabilities; ‘13’ is the number of projects that could be affected. The risk is real: a new storage slot could cost 110.020 gas instead of 22.100 (EIP-8037). But this isn’t a confirmed mainnet exploit; it’s a test that was postponed.
🎯 Plan
If the 2.347-2.330 range holds, expect a reaction targeting 2.400/2.500; a daily close below 2.330 invalidates the scenario. Directionally, a short-term reaction is possible, but it won’t count as a trend reversal in the medium term until 2.500 is reclaimed. Scale in gradually on spot; be cautious with leverage.
📌 Do you think this postponement means greater security for ETH, or just a delay? Share your thoughts in the comments.
$ETH #Glamsterdam #Ethereum #ETH #Crypto
Not financial advice.
Those panic-selling below #Glamsterdam 2.347$ think they’re facing 13 separate exploits. But the real story is in the flow.
📌 The real numbers (October 24, 2026)
• $ETH 2.374$, 24h -0.48%; 4h RSI 16.6 (oversold), SMA20 2.426$
• Hoodi activation was postponed indefinitely from October 26 at 17:42 UTC; there’s no new date, and the 200M gas target has also been shelved (Ethereum Foundation, October 22)
• Sepolia passed on October 6; a mainnet date was never announced
• Spot ETH ETFs saw net outflows of -1.2 billion$ in October (the worst month of the year); a single-day outflow of -111 million$ on October 22
📉 Technical analysis
Price is at 2.374$, just below the 2.400 pivot and trying to hold above 2.347 (the lower Bollinger Band). A 4h RSI of 16.6 is historically rare oversold territory; a break below 2.330 invalidates the scenario, while a close above 2.500 would confirm a bottom.
🐋 On-chain contradiction
That same week, a net 169.770 ETH (~403 million$) left exchanges—the largest daily outflow in over 4 months (Santiment). Coins are being withdrawn from exchanges even as ETFs sell. This looks more like a change of hands than panic selling.
🔍 ‘13’ is being misread
ChainSecurity’s public analysis does not list 13 separate vulnerabilities; ‘13’ is the number of projects that could be affected. The risk is real: a new storage slot could cost 110.020 gas instead of 22.100 (EIP-8037). But this isn’t a confirmed mainnet exploit; it’s a test that was postponed.
🎯 Plan
If the 2.347-2.330 range holds, expect a reaction targeting 2.400/2.500; a daily close below 2.330 invalidates the scenario. Directionally, a short-term reaction is possible, but it won’t count as a trend reversal in the medium term until 2.500 is reclaimed. Scale in gradually on spot; be cautious with leverage.
📌 Do you think this postponement means greater security for ETH, or just a delay? Share your thoughts in the comments.
$ETH #Glamsterdam #Ethereum #ETH #Crypto
Not financial advice.
📌 The real numbers (October 24, 2026)
• $ETH 2.374$, 24h -0.48%; 4h RSI 16.6 (oversold), SMA20 2.426$
• Hoodi activation was postponed indefinitely from October 26 at 17:42 UTC; there’s no new date, and the 200M gas target has also been shelved (Ethereum Foundation, October 22)
• Sepolia passed on October 6; a mainnet date was never announced
• Spot ETH ETFs saw net outflows of -1.2 billion$ in October (the worst month of the year); a single-day outflow of -111 million$ on October 22
📉 Technical analysis
Price is at 2.374$, just below the 2.400 pivot and trying to hold above 2.347 (the lower Bollinger Band). A 4h RSI of 16.6 is historically rare oversold territory; a break below 2.330 invalidates the scenario, while a close above 2.500 would confirm a bottom.
🐋 On-chain contradiction
That same week, a net 169.770 ETH (~403 million$) left exchanges—the largest daily outflow in over 4 months (Santiment). Coins are being withdrawn from exchanges even as ETFs sell. This looks more like a change of hands than panic selling.
🔍 ‘13’ is being misread
ChainSecurity’s public analysis does not list 13 separate vulnerabilities; ‘13’ is the number of projects that could be affected. The risk is real: a new storage slot could cost 110.020 gas instead of 22.100 (EIP-8037). But this isn’t a confirmed mainnet exploit; it’s a test that was postponed.
🎯 Plan
If the 2.347-2.330 range holds, expect a reaction targeting 2.400/2.500; a daily close below 2.330 invalidates the scenario. Directionally, a short-term reaction is possible, but it won’t count as a trend reversal in the medium term until 2.500 is reclaimed. Scale in gradually on spot; be cautious with leverage.
📌 Do you think this postponement means greater security for ETH, or just a delay? Share your thoughts in the comments.
$ETH #Glamsterdam #Ethereum #ETH #Crypto
Not financial advice.
1
78
·
--
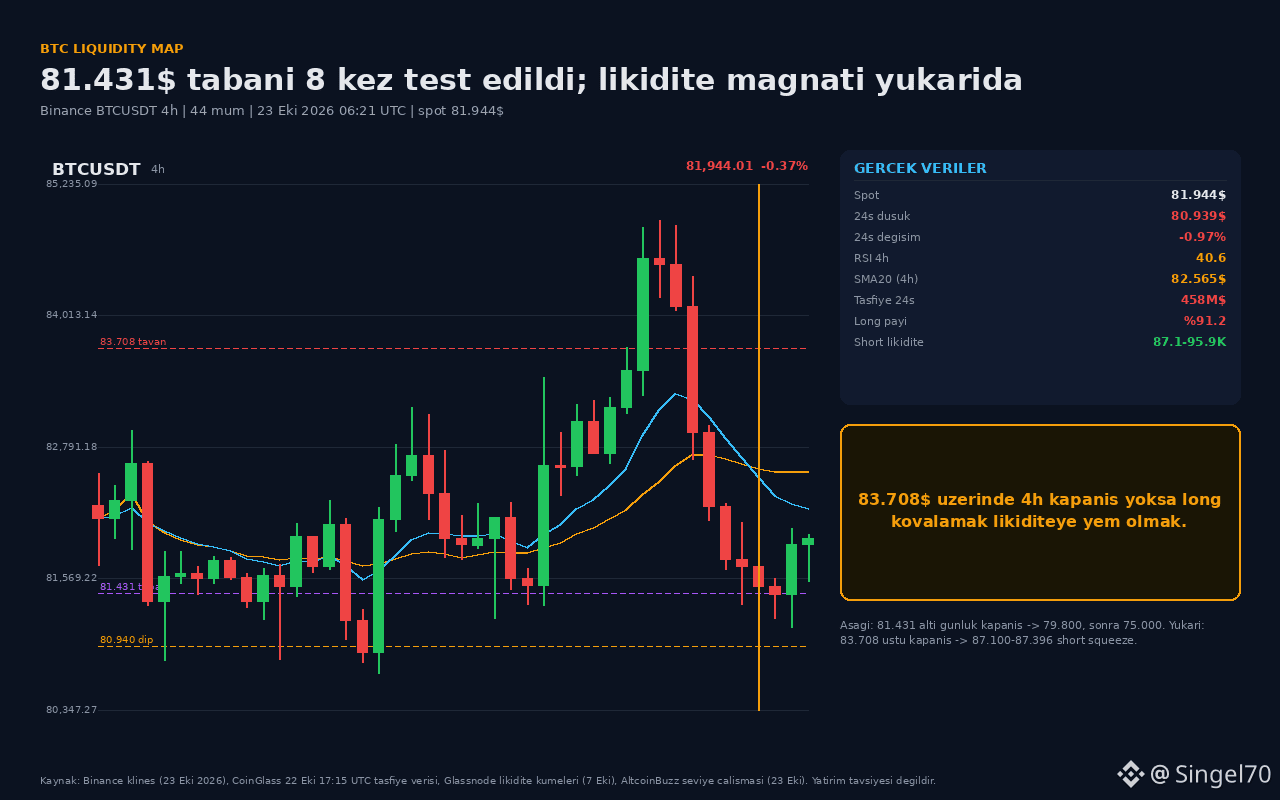
#LiquidationHeatmap BTC at the $81,431 floor: everyone is looking down, but the liquidity map points up.
📌 The real numbers (Oct 23, 2026, 06:21 UTC)
• Binance BTCUSDT: $81,944 | 24h low $80,939 | 24h -0.97%
• CoinGlass (Oct 22, 17:15 UTC): $458M liquidated in 24h, $417.9M of it from longs (91.2%), 103,000+ traders
• Oct 22: Nasdaq -2.60%, S&P 500 -1.21%; BTC fell with high beta
• 4h RSI 40.6; SMA20 at $82,565 above price; price above the lower Bollinger Band at $80,581
📉 Technical read
The $81,431 level has been tested 8 separate times since February 2025. Yesterday's daily close at $81,416 was just below the floor and the lowest in 30 days; today it was reclaimed at $81,944. So this is not a breakdown, but a defense of the floor. Critical levels: a close above $83,708 opens the way to $87,396; a close below $79,800 leaves room to $75,000.
🐋 Liquidity map (Glassnode, Oct 7)
The main short liquidation cluster is at $87,100–$95,900 (densest around 92K). The long cluster is at $81,700–$83,300, just above the current price. $458M in longs has been liquidated, but the price is still below the SMA20: no confirmation of a recovery.
🎯 Plan
• Upside: daily close above $83,708 → $87,100–$87,396, stop below $81,431
• Downside: daily close below $79,800 → $75,000
• Bottom line: No trade until there's a trigger. The upside squeeze scenario is more compelling because the short cluster overhead is large and the long side has just been cleared; but I won't chase longs without a close above 83.7K.
📌 Which side are you waiting for: an 87K squeeze or 79.8K?
#Bitcoin #BTC #CryptoMarket #RiskManagement
$BTC
Not financial advice.
#LiquidationHeatmap BTC at the $81,431 floor: everyone is looking down, but the liquidity map points up.
📌 The real numbers (Oct 23, 2026, 06:21 UTC)
• Binance BTCUSDT: $81,944 | 24h low $80,939 | 24h -0.97%
• CoinGlass (Oct 22, 17:15 UTC): $458M liquidated in 24h, $417.9M of it from longs (91.2%), 103,000+ traders
• Oct 22: Nasdaq -2.60%, S&P 500 -1.21%; BTC fell with high beta
• 4h RSI 40.6; SMA20 at $82,565 above price; price above the lower Bollinger Band at $80,581
📉 Technical read
The $81,431 level has been tested 8 separate times since February 2025. Yesterday's daily close at $81,416 was just below the floor and the lowest in 30 days; today it was reclaimed at $81,944. So this is not a breakdown, but a defense of the floor. Critical levels: a close above $83,708 opens the way to $87,396; a close below $79,800 leaves room to $75,000.
🐋 Liquidity map (Glassnode, Oct 7)
The main short liquidation cluster is at $87,100–$95,900 (densest around 92K). The long cluster is at $81,700–$83,300, just above the current price. $458M in longs has been liquidated, but the price is still below the SMA20: no confirmation of a recovery.
🎯 Plan
• Upside: daily close above $83,708 → $87,100–$87,396, stop below $81,431
• Downside: daily close below $79,800 → $75,000
• Bottom line: No trade until there's a trigger. The upside squeeze scenario is more compelling because the short cluster overhead is large and the long side has just been cleared; but I won't chase longs without a close above 83.7K.
📌 Which side are you waiting for: an 87K squeeze or 79.8K?
#Bitcoin #BTC #CryptoMarket #RiskManagement
$BTC
Not financial advice.
📌 The real numbers (Oct 23, 2026, 06:21 UTC)
• Binance BTCUSDT: $81,944 | 24h low $80,939 | 24h -0.97%
• CoinGlass (Oct 22, 17:15 UTC): $458M liquidated in 24h, $417.9M of it from longs (91.2%), 103,000+ traders
• Oct 22: Nasdaq -2.60%, S&P 500 -1.21%; BTC fell with high beta
• 4h RSI 40.6; SMA20 at $82,565 above price; price above the lower Bollinger Band at $80,581
📉 Technical read
The $81,431 level has been tested 8 separate times since February 2025. Yesterday's daily close at $81,416 was just below the floor and the lowest in 30 days; today it was reclaimed at $81,944. So this is not a breakdown, but a defense of the floor. Critical levels: a close above $83,708 opens the way to $87,396; a close below $79,800 leaves room to $75,000.
🐋 Liquidity map (Glassnode, Oct 7)
The main short liquidation cluster is at $87,100–$95,900 (densest around 92K). The long cluster is at $81,700–$83,300, just above the current price. $458M in longs has been liquidated, but the price is still below the SMA20: no confirmation of a recovery.
🎯 Plan
• Upside: daily close above $83,708 → $87,100–$87,396, stop below $81,431
• Downside: daily close below $79,800 → $75,000
• Bottom line: No trade until there's a trigger. The upside squeeze scenario is more compelling because the short cluster overhead is large and the long side has just been cleared; but I won't chase longs without a close above 83.7K.
📌 Which side are you waiting for: an 87K squeeze or 79.8K?
#Bitcoin #BTC #CryptoMarket #RiskManagement
$BTC
Not financial advice.
1
36
·
--
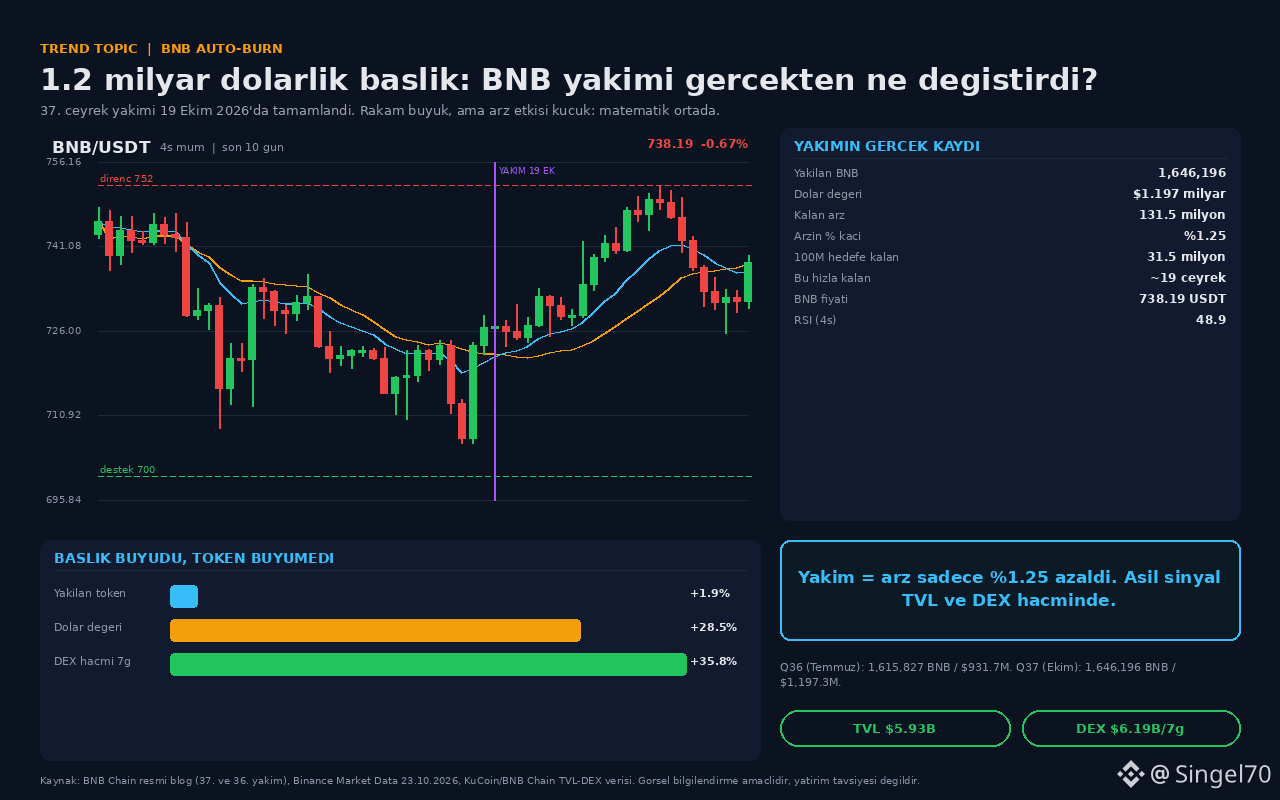
A burn worth #BNBBurn 1.2 billion dollars is being discussed, but only 1.25% of the supply is gone. So why hasn’t the price fallen or soared?
📌 The actual figures (official BNB Chain blog + Binance Market Data, 23.10.2026):
- 37th quarterly burn: 1,646,196.44 BNB (~1.197 billion dollars)
- Total supply remaining: 131,512,085 BNB (target: 100 million)
- Previous quarter (July): 1,615,827 BNB / 931.7 million dollars
- In other words, while the number of tokens increased by only +1.9%, the dollar figure grew by +28.5%. Most of the difference is due to price—not a larger burn.
📉 Technical analysis (BNB/USDT, 4-hour):
- Price: 738.19 USDT, 24h -0.36%
- SMA20 737.98 | EMA12 736.65 | RSI 48.9 (neutral)
- Bollinger bands: 723.8 - 752.2
- Support at 700-706, resistance at 750-752; if that breaks, the next target is 810
🐋 On-chain and flow evidence:
- 1.65 million BNB went to a dead address and cannot be recovered
- At this rate, it will take ~19 quarters (~4.8 years) to reach the 100 million target
- The real positive signal isn’t the burn: BNB Chain TVL is 5.93 billion dollars, and 7-day DEX volume is 6.19 billion dollars (+35.8%)
🎯 Plan: No need to rush within the 700-752 range. If it continues to hold above 700, 752 and 810 could be targets; below 700, the 680s are at risk. Focus not on the burn headline, but on whether TVL and DEX volume continue to grow. Neutral in the short term, slightly positive in the medium term.
📌 What do you think will move BNB most: quarterly burns or on-chain volume? Let’s discuss in the comments.
$BNB #BNBBurn #Crypto #DeFi #BinanceSquare
This is not financial advice.
A burn worth #BNBBurn 1.2 billion dollars is being discussed, but only 1.25% of the supply is gone. So why hasn’t the price fallen or soared?
📌 The actual figures (official BNB Chain blog + Binance Market Data, 23.10.2026):
- 37th quarterly burn: 1,646,196.44 BNB (~1.197 billion dollars)
- Total supply remaining: 131,512,085 BNB (target: 100 million)
- Previous quarter (July): 1,615,827 BNB / 931.7 million dollars
- In other words, while the number of tokens increased by only +1.9%, the dollar figure grew by +28.5%. Most of the difference is due to price—not a larger burn.
📉 Technical analysis (BNB/USDT, 4-hour):
- Price: 738.19 USDT, 24h -0.36%
- SMA20 737.98 | EMA12 736.65 | RSI 48.9 (neutral)
- Bollinger bands: 723.8 - 752.2
- Support at 700-706, resistance at 750-752; if that breaks, the next target is 810
🐋 On-chain and flow evidence:
- 1.65 million BNB went to a dead address and cannot be recovered
- At this rate, it will take ~19 quarters (~4.8 years) to reach the 100 million target
- The real positive signal isn’t the burn: BNB Chain TVL is 5.93 billion dollars, and 7-day DEX volume is 6.19 billion dollars (+35.8%)
🎯 Plan: No need to rush within the 700-752 range. If it continues to hold above 700, 752 and 810 could be targets; below 700, the 680s are at risk. Focus not on the burn headline, but on whether TVL and DEX volume continue to grow. Neutral in the short term, slightly positive in the medium term.
📌 What do you think will move BNB most: quarterly burns or on-chain volume? Let’s discuss in the comments.
$BNB #BNBBurn #Crypto #DeFi #BinanceSquare
This is not financial advice.
📌 The actual figures (official BNB Chain blog + Binance Market Data, 23.10.2026):
- 37th quarterly burn: 1,646,196.44 BNB (~1.197 billion dollars)
- Total supply remaining: 131,512,085 BNB (target: 100 million)
- Previous quarter (July): 1,615,827 BNB / 931.7 million dollars
- In other words, while the number of tokens increased by only +1.9%, the dollar figure grew by +28.5%. Most of the difference is due to price—not a larger burn.
📉 Technical analysis (BNB/USDT, 4-hour):
- Price: 738.19 USDT, 24h -0.36%
- SMA20 737.98 | EMA12 736.65 | RSI 48.9 (neutral)
- Bollinger bands: 723.8 - 752.2
- Support at 700-706, resistance at 750-752; if that breaks, the next target is 810
🐋 On-chain and flow evidence:
- 1.65 million BNB went to a dead address and cannot be recovered
- At this rate, it will take ~19 quarters (~4.8 years) to reach the 100 million target
- The real positive signal isn’t the burn: BNB Chain TVL is 5.93 billion dollars, and 7-day DEX volume is 6.19 billion dollars (+35.8%)
🎯 Plan: No need to rush within the 700-752 range. If it continues to hold above 700, 752 and 810 could be targets; below 700, the 680s are at risk. Focus not on the burn headline, but on whether TVL and DEX volume continue to grow. Neutral in the short term, slightly positive in the medium term.
📌 What do you think will move BNB most: quarterly burns or on-chain volume? Let’s discuss in the comments.
$BNB #BNBBurn #Crypto #DeFi #BinanceSquare
This is not financial advice.
1
71
·
--
#BitcoinETF
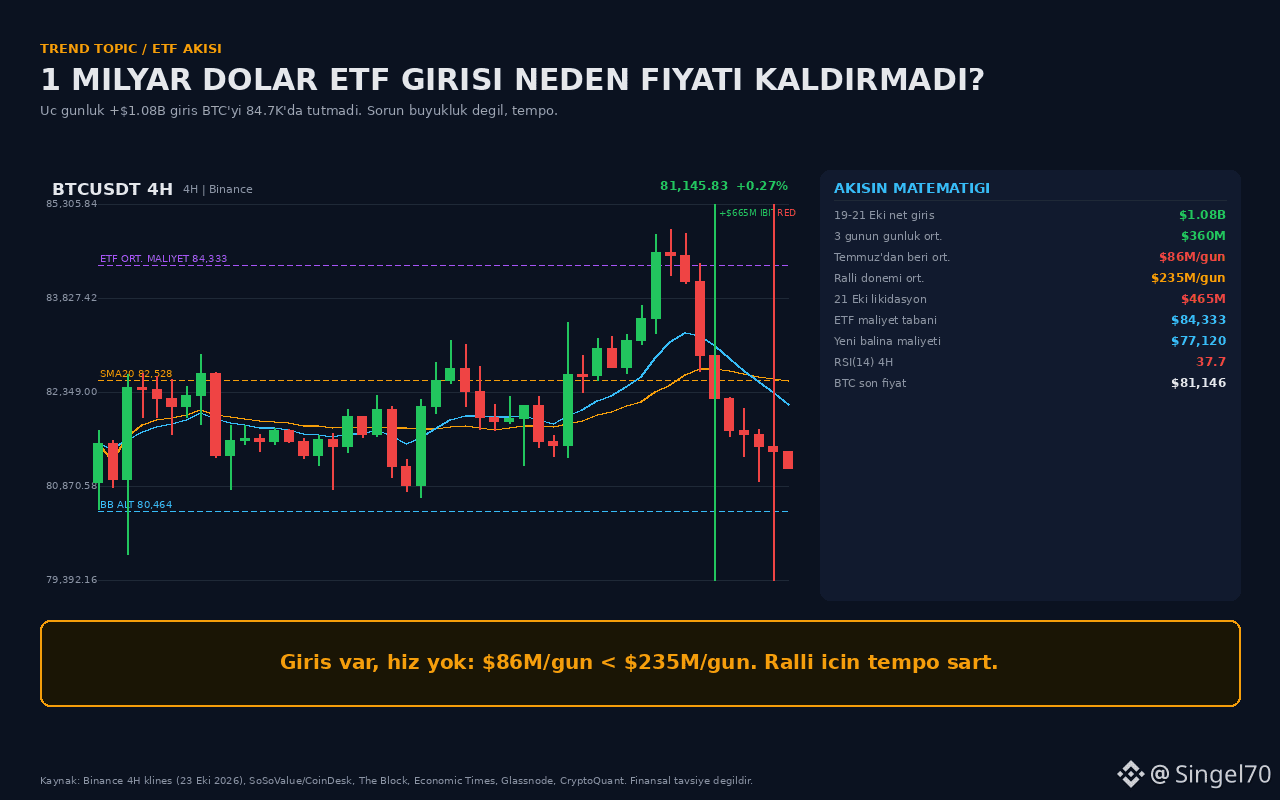
$1.08 billion in ETF inflows came in, but BTC once again hit a wall at 84.7K. Is the headline “Institutions are back” accurate, or is the pace of inflows still insufficient?
📌 The real numbers (October 23, 2026)
• Net inflows, October 19–21: +$1.08B (SoSoValue)
• October 21, single day: +$528.4M; IBIT +$235M, FBTC +$212.7M
• On October 19, IBIT alone saw +$665.2M; on October 20, the entire category totaled just +$23.2M
• On October 21, $465M in liquidations across the market (CoinGlass)
📉 Why didn’t the price rise?
CoinDesk’s flow analysis is clear: average daily inflows have been ~$86M since July. During the three steep rallies of 2024–25, that average was ~$235M/day. A three-day surge is nice, but it’s a one-off; the pace is below the threshold for a rally. BTC reached 84,377, then fell back to 81,146; below the SMA20 at 82,528, with RSI at 37.7.
🐋 On-chain data and cost basis
The average cost basis for ETF investors is ~$84,333 (Bitfinex). The price is below that: ETF buyers are not in profit. The cost basis for new whales is $77,120 (CryptoQuant). Glassnode sees a buildup of selling/liquidations between $85,000 and $87,500.
🎯 Plan
• Holding above 80,464 (lower BB) → test of 82,528
• The rally thesis is weak without a daily close above 84,333; I’d expect selling there
• A close below 80,000 → risk of 77,120
My view: flows are positive, but direction is neutral to weak. The “$1B inflow” headline alone is not a reason to trade; a sustainable daily pace is needed.
📌 What do you think is more decisive: total inflows or the average daily pace? $BTC
Not financial advice.
#Bitcoin #ETF #BTC #Macro
#BitcoinETF
$1.08 billion in ETF inflows came in, but BTC once again hit a wall at 84.7K. Is the headline “Institutions are back” accurate, or is the pace of inflows still insufficient?
📌 The real numbers (October 23, 2026)
• Net inflows, October 19–21: +$1.08B (SoSoValue)
• October 21, single day: +$528.4M; IBIT +$235M, FBTC +$212.7M
• On October 19, IBIT alone saw +$665.2M; on October 20, the entire category totaled just +$23.2M
• On October 21, $465M in liquidations across the market (CoinGlass)
📉 Why didn’t the price rise?
CoinDesk’s flow analysis is clear: average daily inflows have been ~$86M since July. During the three steep rallies of 2024–25, that average was ~$235M/day. A three-day surge is nice, but it’s a one-off; the pace is below the threshold for a rally. BTC reached 84,377, then fell back to 81,146; below the SMA20 at 82,528, with RSI at 37.7.
🐋 On-chain data and cost basis
The average cost basis for ETF investors is ~$84,333 (Bitfinex). The price is below that: ETF buyers are not in profit. The cost basis for new whales is $77,120 (CryptoQuant). Glassnode sees a buildup of selling/liquidations between $85,000 and $87,500.
🎯 Plan
• Holding above 80,464 (lower BB) → test of 82,528
• The rally thesis is weak without a daily close above 84,333; I’d expect selling there
• A close below 80,000 → risk of 77,120
My view: flows are positive, but direction is neutral to weak. The “$1B inflow” headline alone is not a reason to trade; a sustainable daily pace is needed.
📌 What do you think is more decisive: total inflows or the average daily pace? $BTC
Not financial advice.
#Bitcoin #ETF #BTC #Macro
$1.08 billion in ETF inflows came in, but BTC once again hit a wall at 84.7K. Is the headline “Institutions are back” accurate, or is the pace of inflows still insufficient?
📌 The real numbers (October 23, 2026)
• Net inflows, October 19–21: +$1.08B (SoSoValue)
• October 21, single day: +$528.4M; IBIT +$235M, FBTC +$212.7M
• On October 19, IBIT alone saw +$665.2M; on October 20, the entire category totaled just +$23.2M
• On October 21, $465M in liquidations across the market (CoinGlass)
📉 Why didn’t the price rise?
CoinDesk’s flow analysis is clear: average daily inflows have been ~$86M since July. During the three steep rallies of 2024–25, that average was ~$235M/day. A three-day surge is nice, but it’s a one-off; the pace is below the threshold for a rally. BTC reached 84,377, then fell back to 81,146; below the SMA20 at 82,528, with RSI at 37.7.
🐋 On-chain data and cost basis
The average cost basis for ETF investors is ~$84,333 (Bitfinex). The price is below that: ETF buyers are not in profit. The cost basis for new whales is $77,120 (CryptoQuant). Glassnode sees a buildup of selling/liquidations between $85,000 and $87,500.
🎯 Plan
• Holding above 80,464 (lower BB) → test of 82,528
• The rally thesis is weak without a daily close above 84,333; I’d expect selling there
• A close below 80,000 → risk of 77,120
My view: flows are positive, but direction is neutral to weak. The “$1B inflow” headline alone is not a reason to trade; a sustainable daily pace is needed.
📌 What do you think is more decisive: total inflows or the average daily pace? $BTC
Not financial advice.
#Bitcoin #ETF #BTC #Macro
1
88
·
--
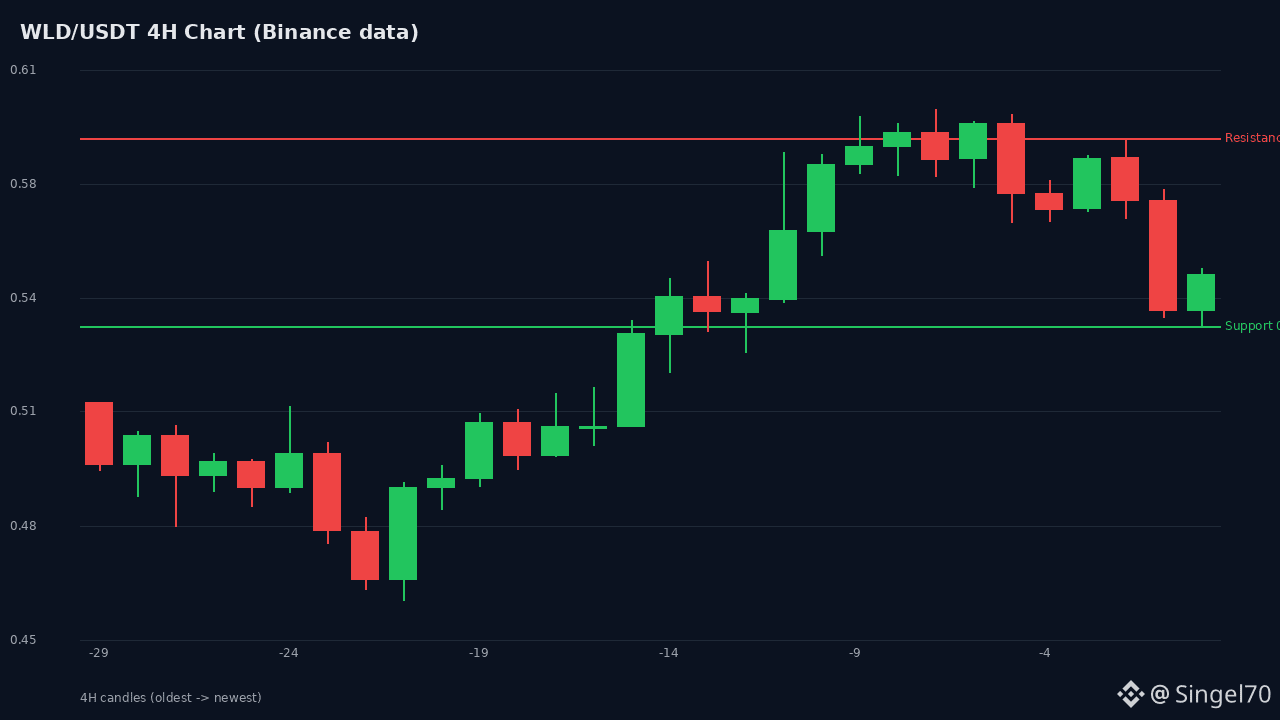
📊 WLDUSDT 4H Analysis | Live Binance data
Price 0.5506 USDT | 24h -5.02% | range 0.5357-0.5968 | volume 59.0M USDT
VWAP 0.5694 | 7d +9.5% | 30d -4.3% | latest candle 0.5401/0.5524/0.5357/0.5506
RSI14 51.9 (neutral) | SMA10 0.5748 | SMA20 0.5537 | SMA50 0.5208 | SMA100 0.5249
EMA12 0.5617 | EMA26 0.5478
MACD 0.0139 / signal 0.0170 → hist -0.0031 (negative, widening)
BB upper 0.6161 / middle 0.5537 / lower 0.4913 (width 22.6%)
Stoch %K 32.2 (%K3 27.5) → near the buying zone
ATR14 0.0225 (4.1%) | latest volume 8.6M vs 20M average (0.43x) → weak confirmation
RESISTANCE 0.5694 (VWAP) | 0.5898 | 0.5968 | 0.6161
SUPPORT 0.5357 | 0.5224 (SMA50) | 0.4913 | 0.4565
SIGNAL 24-72h: BULLISH 45% | SIDEWAYS 30% | BEARISH 25%
Below EMA12 + bearish MACD crossover + weak volume → chasing the rally is risky. However, Stochastic is in the oversold zone and price is above SMA50/100, so the medium-term structure remains intact.
PLAN
• Buy the dip at 0.5360-0.5420, stop 0.5140, TP 0.5700 / 0.5900
• Breakout: 4H close above 0.5700 + positive MACD hist → 0.5750, stop 0.5520, TP 0.5960 / 0.6160
• Bearish: close below 0.5357 → 0.5220 → 0.5000
• 2-3% of capital, no leverage
NEWS
• Oct 20: The project address deposited 14.475M WLD to exchanges in 24 hours → selling pressure
• Oct 19: World ID for banking launched (identity verification against AI fraud)
• Oct 15-16: Crypto sell-off following the U.S. inflation shock; WLD, a high-beta asset, fell 6.9%
#WLD #Worldcoin #BinanceSquare #CryptoTA #Altcoin
Note: For educational purposes only; not financial advice.
📊 WLDUSDT 4H Analysis | Live Binance data
Price 0.5506 USDT | 24h -5.02% | range 0.5357-0.5968 | volume 59.0M USDT
VWAP 0.5694 | 7d +9.5% | 30d -4.3% | latest candle 0.5401/0.5524/0.5357/0.5506
RSI14 51.9 (neutral) | SMA10 0.5748 | SMA20 0.5537 | SMA50 0.5208 | SMA100 0.5249
EMA12 0.5617 | EMA26 0.5478
MACD 0.0139 / signal 0.0170 → hist -0.0031 (negative, widening)
BB upper 0.6161 / middle 0.5537 / lower 0.4913 (width 22.6%)
Stoch %K 32.2 (%K3 27.5) → near the buying zone
ATR14 0.0225 (4.1%) | latest volume 8.6M vs 20M average (0.43x) → weak confirmation
RESISTANCE 0.5694 (VWAP) | 0.5898 | 0.5968 | 0.6161
SUPPORT 0.5357 | 0.5224 (SMA50) | 0.4913 | 0.4565
SIGNAL 24-72h: BULLISH 45% | SIDEWAYS 30% | BEARISH 25%
Below EMA12 + bearish MACD crossover + weak volume → chasing the rally is risky. However, Stochastic is in the oversold zone and price is above SMA50/100, so the medium-term structure remains intact.
PLAN
• Buy the dip at 0.5360-0.5420, stop 0.5140, TP 0.5700 / 0.5900
• Breakout: 4H close above 0.5700 + positive MACD hist → 0.5750, stop 0.5520, TP 0.5960 / 0.6160
• Bearish: close below 0.5357 → 0.5220 → 0.5000
• 2-3% of capital, no leverage
NEWS
• Oct 20: The project address deposited 14.475M WLD to exchanges in 24 hours → selling pressure
• Oct 19: World ID for banking launched (identity verification against AI fraud)
• Oct 15-16: Crypto sell-off following the U.S. inflation shock; WLD, a high-beta asset, fell 6.9%
#WLD #Worldcoin #BinanceSquare #CryptoTA #Altcoin
Note: For educational purposes only; not financial advice.
Price 0.5506 USDT | 24h -5.02% | range 0.5357-0.5968 | volume 59.0M USDT
VWAP 0.5694 | 7d +9.5% | 30d -4.3% | latest candle 0.5401/0.5524/0.5357/0.5506
RSI14 51.9 (neutral) | SMA10 0.5748 | SMA20 0.5537 | SMA50 0.5208 | SMA100 0.5249
EMA12 0.5617 | EMA26 0.5478
MACD 0.0139 / signal 0.0170 → hist -0.0031 (negative, widening)
BB upper 0.6161 / middle 0.5537 / lower 0.4913 (width 22.6%)
Stoch %K 32.2 (%K3 27.5) → near the buying zone
ATR14 0.0225 (4.1%) | latest volume 8.6M vs 20M average (0.43x) → weak confirmation
RESISTANCE 0.5694 (VWAP) | 0.5898 | 0.5968 | 0.6161
SUPPORT 0.5357 | 0.5224 (SMA50) | 0.4913 | 0.4565
SIGNAL 24-72h: BULLISH 45% | SIDEWAYS 30% | BEARISH 25%
Below EMA12 + bearish MACD crossover + weak volume → chasing the rally is risky. However, Stochastic is in the oversold zone and price is above SMA50/100, so the medium-term structure remains intact.
PLAN
• Buy the dip at 0.5360-0.5420, stop 0.5140, TP 0.5700 / 0.5900
• Breakout: 4H close above 0.5700 + positive MACD hist → 0.5750, stop 0.5520, TP 0.5960 / 0.6160
• Bearish: close below 0.5357 → 0.5220 → 0.5000
• 2-3% of capital, no leverage
NEWS
• Oct 20: The project address deposited 14.475M WLD to exchanges in 24 hours → selling pressure
• Oct 19: World ID for banking launched (identity verification against AI fraud)
• Oct 15-16: Crypto sell-off following the U.S. inflation shock; WLD, a high-beta asset, fell 6.9%
#WLD #Worldcoin #BinanceSquare #CryptoTA #Altcoin
Note: For educational purposes only; not financial advice.
1
118
·
--
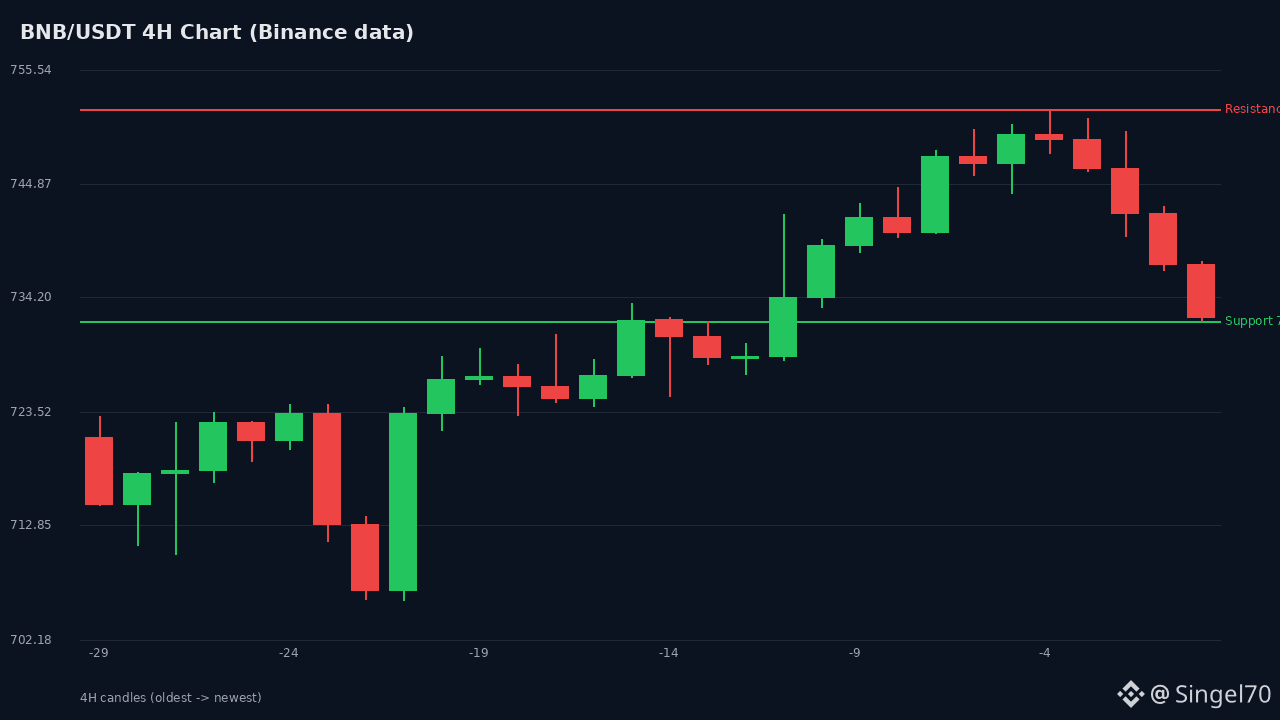
BNBUSDT 4H TECHNICAL ANALYSIS (Live Binance data)
Price: 732.40 USDT
24h change: -1.80% | 24h range: 732.00 - 751.86
Indicators (4H, 100 candles):
• RSI(14): 52.0 — neutral, weak direction
• SMA10: 743.30 | SMA20: 736.54 — price is below both (short-term pressure)
• EMA12: 739.46 | EMA26: 735.75 — EMA12 is slightly higher, but the gap is narrowing
• MACD: 3.71 / signal 3.71 / histogram 0.0 — momentum has reset to zero, indecision
• Bollinger Bands: upper 753.48 | middle 736.54 | lower 719.60 — price has dipped below the middle band
• Stochastic %K: 21.7 — in the lower zone, with potential for a rebound
• ATR(14): 6.08 USDT (~0.83%) — volatility is relatively low
Support / Resistance:
Support: 723.19 → 719.60 (lower BB) → 708.48 (major weekly support)
Resistance: 736.54 (SMA20) → 743.30 (SMA10) → 751.86 (24h high) → 770
Latest News:
• BNB Chain completed its 37th quarterly burn: 1.646 million BNB (≈$1.2 billion) was removed from circulation; supply fell to 131.51 million.
• BNB Standard (Nasdaq: BNC) will ring the Nasdaq opening bell on October 26; institutional visibility is increasing.
• The Jenner upgrade is scheduled for testnet on October 29: the CAS20 token standard and payment rails are coming; the NewL1 testnet is targeted for year-end.
Scenario and Probability:
• 55% — hold in the 719–723 range and rebound to 736–743 (low Stoch + spot outflows provide support)
• 45% — pull back to 708–706 with a daily close below 719.60
Plan:
• Buying interest: scale in around 723–720, stop below 714, first target 736, second target 743
• Breakout: if a 4H candle closes above 743, the 751–770 target range opens up; stop below 736
• Risk: 1–2% of capital per trade; since ATR is low, don't set the stop too tight
• Invalidation: a 4H close below 708.48 invalidates the scenario
Note: For educational purposes only; not financial advice.
#BNB #BNBUSDT #Kripto #TeknikAnaliz #BinanceSquare
BNBUSDT 4H TECHNICAL ANALYSIS (Live Binance data)
Price: 732.40 USDT
24h change: -1.80% | 24h range: 732.00 - 751.86
Indicators (4H, 100 candles):
• RSI(14): 52.0 — neutral, weak direction
• SMA10: 743.30 | SMA20: 736.54 — price is below both (short-term pressure)
• EMA12: 739.46 | EMA26: 735.75 — EMA12 is slightly higher, but the gap is narrowing
• MACD: 3.71 / signal 3.71 / histogram 0.0 — momentum has reset to zero, indecision
• Bollinger Bands: upper 753.48 | middle 736.54 | lower 719.60 — price has dipped below the middle band
• Stochastic %K: 21.7 — in the lower zone, with potential for a rebound
• ATR(14): 6.08 USDT (~0.83%) — volatility is relatively low
Support / Resistance:
Support: 723.19 → 719.60 (lower BB) → 708.48 (major weekly support)
Resistance: 736.54 (SMA20) → 743.30 (SMA10) → 751.86 (24h high) → 770
Latest News:
• BNB Chain completed its 37th quarterly burn: 1.646 million BNB (≈$1.2 billion) was removed from circulation; supply fell to 131.51 million.
• BNB Standard (Nasdaq: BNC) will ring the Nasdaq opening bell on October 26; institutional visibility is increasing.
• The Jenner upgrade is scheduled for testnet on October 29: the CAS20 token standard and payment rails are coming; the NewL1 testnet is targeted for year-end.
Scenario and Probability:
• 55% — hold in the 719–723 range and rebound to 736–743 (low Stoch + spot outflows provide support)
• 45% — pull back to 708–706 with a daily close below 719.60
Plan:
• Buying interest: scale in around 723–720, stop below 714, first target 736, second target 743
• Breakout: if a 4H candle closes above 743, the 751–770 target range opens up; stop below 736
• Risk: 1–2% of capital per trade; since ATR is low, don't set the stop too tight
• Invalidation: a 4H close below 708.48 invalidates the scenario
Note: For educational purposes only; not financial advice.
#BNB #BNBUSDT #Kripto #TeknikAnaliz #BinanceSquare
Price: 732.40 USDT
24h change: -1.80% | 24h range: 732.00 - 751.86
Indicators (4H, 100 candles):
• RSI(14): 52.0 — neutral, weak direction
• SMA10: 743.30 | SMA20: 736.54 — price is below both (short-term pressure)
• EMA12: 739.46 | EMA26: 735.75 — EMA12 is slightly higher, but the gap is narrowing
• MACD: 3.71 / signal 3.71 / histogram 0.0 — momentum has reset to zero, indecision
• Bollinger Bands: upper 753.48 | middle 736.54 | lower 719.60 — price has dipped below the middle band
• Stochastic %K: 21.7 — in the lower zone, with potential for a rebound
• ATR(14): 6.08 USDT (~0.83%) — volatility is relatively low
Support / Resistance:
Support: 723.19 → 719.60 (lower BB) → 708.48 (major weekly support)
Resistance: 736.54 (SMA20) → 743.30 (SMA10) → 751.86 (24h high) → 770
Latest News:
• BNB Chain completed its 37th quarterly burn: 1.646 million BNB (≈$1.2 billion) was removed from circulation; supply fell to 131.51 million.
• BNB Standard (Nasdaq: BNC) will ring the Nasdaq opening bell on October 26; institutional visibility is increasing.
• The Jenner upgrade is scheduled for testnet on October 29: the CAS20 token standard and payment rails are coming; the NewL1 testnet is targeted for year-end.
Scenario and Probability:
• 55% — hold in the 719–723 range and rebound to 736–743 (low Stoch + spot outflows provide support)
• 45% — pull back to 708–706 with a daily close below 719.60
Plan:
• Buying interest: scale in around 723–720, stop below 714, first target 736, second target 743
• Breakout: if a 4H candle closes above 743, the 751–770 target range opens up; stop below 736
• Risk: 1–2% of capital per trade; since ATR is low, don't set the stop too tight
• Invalidation: a 4H close below 708.48 invalidates the scenario
Note: For educational purposes only; not financial advice.
#BNB #BNBUSDT #Kripto #TeknikAnaliz #BinanceSquare
1
4
·
--
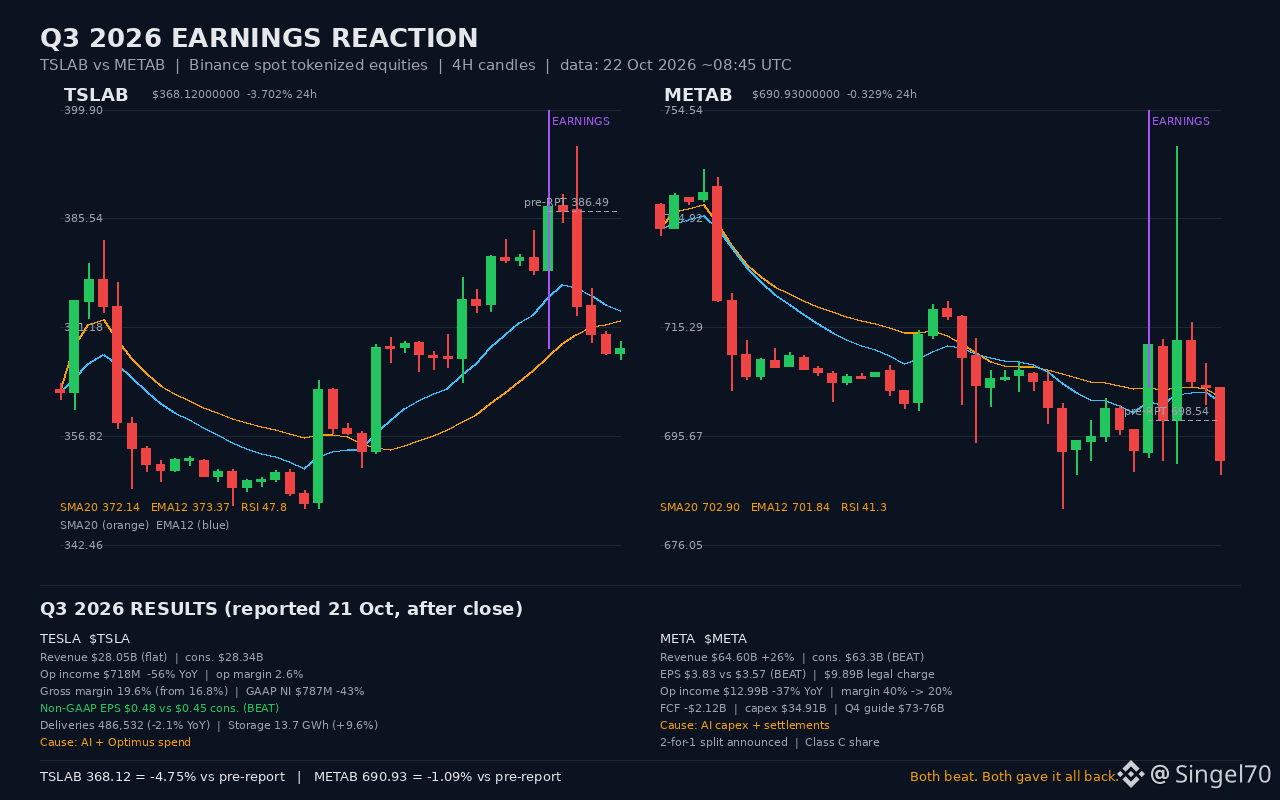
#EarningsSeason 🚨 Tesla and Meta both beat expectations. But both gave back their opening gains.
📌 Reports (Oct 21, after the close)
$TSLA: Revenue $28.05B (flat, consensus $28.34B). Operating profit $718M, -56%, margin 2.6%. Gross margin 16.8%→19.6% (good). GAAP net income $787M, -43%. Non-GAAP EPS $0.48 vs. $0.45 (beat). Deliveries 486,532 (-2.1%). Reason: spending on AI + Optimus.
$META: Revenue $64.60B (+26%, consensus $63.3B) and EPS $3.83 vs. $3.57 (beat) — but that includes a $9.89B legal provision; excluding it, EPS was $7.40. Operating profit $12.99B, -37%, margin 40%→20%. Free cash flow -$2.12B (capex $34.91B). Q4 guidance $73–76B. 2-for-1 split + Class C.
📉 Oct 21, 20:00 UTC candle = first 4 hours after the reports (Binance spot tokenized stocks)
TSLAB: 386.49 → peak 395.11 → 373.94 (-3.3%), volume $4.5M (4x). Now 368.12 → 4.8% below pre-report levels.
METAB: 698.54 → peak 748.00 (+7.1%!) → 712.90 → 705.64 → 704.80 → now 690.93: 1.1% below pre-report levels.
META's entire 7% after-hours jump evaporated. Neither "beat" brought in buyers — the common reason is the same: AI capex is eating into profits.
🔗 Crypto angle
TSLAB/METAB now trade 24/7 on Binance spot (TSLAB 24h volume $10.9M, METAB $2.4M): you can catch the post-report reaction on crypto rails, even after the stock market closes. Bitcoin $81,973 (-1.4%), ETH $2,410 (-1.7%) — the "beat" didn't bring back risk appetite. The Oct 28 Fed decision is approaching.
🎯 My post-report rule: don't chase the first candle; wait for the retest the next day.
• $TSLA: A close above 373.37 (EMA12) → target 386.49. Below that, if 364.93 (SMA50) breaks, 352.73. I'm leaning short, stop 374.
• $META: Above 701.84 (EMA12) → 714.96 (SMA50). If 688.26 (lower BB) breaks, 682.59. I'm leaning long, stop 686.
Position size 1–2%, no leverage.
📌 Question: stocks sold in the first 4 hours and bought the next day? I'm leaning toward buying $META and selling $TSLA — do you agree?
#TSLA #META #BinanceSquare
#EarningsSeason 🚨 Tesla and Meta both beat expectations. But both gave back their opening gains.
📌 Reports (Oct 21, after the close)
$TSLA: Revenue $28.05B (flat, consensus $28.34B). Operating profit $718M, -56%, margin 2.6%. Gross margin 16.8%→19.6% (good). GAAP net income $787M, -43%. Non-GAAP EPS $0.48 vs. $0.45 (beat). Deliveries 486,532 (-2.1%). Reason: spending on AI + Optimus.
$META: Revenue $64.60B (+26%, consensus $63.3B) and EPS $3.83 vs. $3.57 (beat) — but that includes a $9.89B legal provision; excluding it, EPS was $7.40. Operating profit $12.99B, -37%, margin 40%→20%. Free cash flow -$2.12B (capex $34.91B). Q4 guidance $73–76B. 2-for-1 split + Class C.
📉 Oct 21, 20:00 UTC candle = first 4 hours after the reports (Binance spot tokenized stocks)
TSLAB: 386.49 → peak 395.11 → 373.94 (-3.3%), volume $4.5M (4x). Now 368.12 → 4.8% below pre-report levels.
METAB: 698.54 → peak 748.00 (+7.1%!) → 712.90 → 705.64 → 704.80 → now 690.93: 1.1% below pre-report levels.
META's entire 7% after-hours jump evaporated. Neither "beat" brought in buyers — the common reason is the same: AI capex is eating into profits.
🔗 Crypto angle
TSLAB/METAB now trade 24/7 on Binance spot (TSLAB 24h volume $10.9M, METAB $2.4M): you can catch the post-report reaction on crypto rails, even after the stock market closes. Bitcoin $81,973 (-1.4%), ETH $2,410 (-1.7%) — the "beat" didn't bring back risk appetite. The Oct 28 Fed decision is approaching.
🎯 My post-report rule: don't chase the first candle; wait for the retest the next day.
• $TSLA: A close above 373.37 (EMA12) → target 386.49. Below that, if 364.93 (SMA50) breaks, 352.73. I'm leaning short, stop 374.
• $META: Above 701.84 (EMA12) → 714.96 (SMA50). If 688.26 (lower BB) breaks, 682.59. I'm leaning long, stop 686.
Position size 1–2%, no leverage.
📌 Question: stocks sold in the first 4 hours and bought the next day? I'm leaning toward buying $META and selling $TSLA — do you agree?
#TSLA #META #BinanceSquare
📌 Reports (Oct 21, after the close)
$TSLA: Revenue $28.05B (flat, consensus $28.34B). Operating profit $718M, -56%, margin 2.6%. Gross margin 16.8%→19.6% (good). GAAP net income $787M, -43%. Non-GAAP EPS $0.48 vs. $0.45 (beat). Deliveries 486,532 (-2.1%). Reason: spending on AI + Optimus.
$META: Revenue $64.60B (+26%, consensus $63.3B) and EPS $3.83 vs. $3.57 (beat) — but that includes a $9.89B legal provision; excluding it, EPS was $7.40. Operating profit $12.99B, -37%, margin 40%→20%. Free cash flow -$2.12B (capex $34.91B). Q4 guidance $73–76B. 2-for-1 split + Class C.
📉 Oct 21, 20:00 UTC candle = first 4 hours after the reports (Binance spot tokenized stocks)
TSLAB: 386.49 → peak 395.11 → 373.94 (-3.3%), volume $4.5M (4x). Now 368.12 → 4.8% below pre-report levels.
METAB: 698.54 → peak 748.00 (+7.1%!) → 712.90 → 705.64 → 704.80 → now 690.93: 1.1% below pre-report levels.
META's entire 7% after-hours jump evaporated. Neither "beat" brought in buyers — the common reason is the same: AI capex is eating into profits.
🔗 Crypto angle
TSLAB/METAB now trade 24/7 on Binance spot (TSLAB 24h volume $10.9M, METAB $2.4M): you can catch the post-report reaction on crypto rails, even after the stock market closes. Bitcoin $81,973 (-1.4%), ETH $2,410 (-1.7%) — the "beat" didn't bring back risk appetite. The Oct 28 Fed decision is approaching.
🎯 My post-report rule: don't chase the first candle; wait for the retest the next day.
• $TSLA: A close above 373.37 (EMA12) → target 386.49. Below that, if 364.93 (SMA50) breaks, 352.73. I'm leaning short, stop 374.
• $META: Above 701.84 (EMA12) → 714.96 (SMA50). If 688.26 (lower BB) breaks, 682.59. I'm leaning long, stop 686.
Position size 1–2%, no leverage.
📌 Question: stocks sold in the first 4 hours and bought the next day? I'm leaning toward buying $META and selling $TSLA — do you agree?
#TSLA #META #BinanceSquare
1
104
·
--
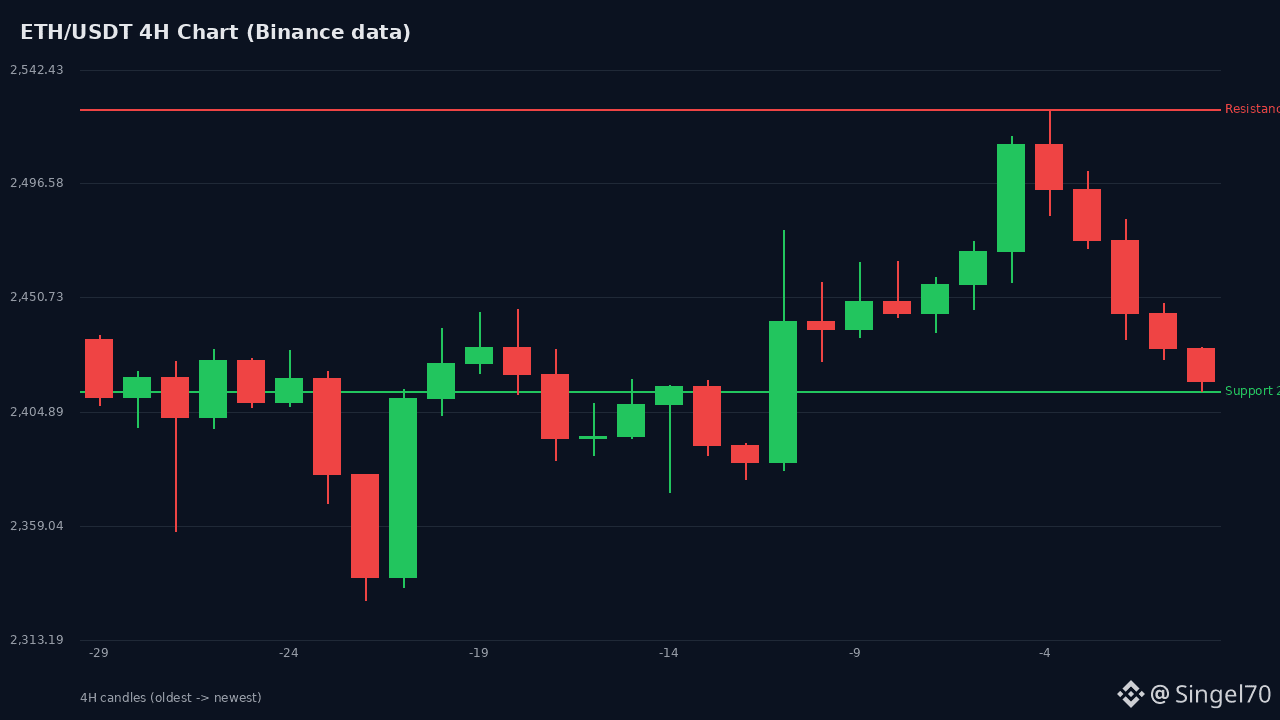
#EthereumSurpasses$2500 ⏳ Rejected within 24 hours: $2,500 was tested for the third time—and failed for the third time.
📌 Numbers (Binance spot, Oct 22, 08:30 UTC)
$ETH $2,415 | 24h -1,6% | high $2,526,62 | low $2,412,93 | volume $853M
• Oct 9: intraday high of $2,520,54 → close at $2,487,70 (intraday +%2,65)
• Oct 12: high of $2,579,88 → close at $2,447,17 (-%3,54) = failed breakout
• Oct 21, 12:00 (4H): $2,515,70, with $248M in 4-hour volume (the highest in the past 24 hours) → followed by 5 consecutive bearish 4H candles
So $2,500 has been tested 3 times in the past 13 days, and rejected all 3 times. On Oct 21, the price rose on volume 43% above Oct 20 ($0,84B vs $0,59B), but the day ended with rejection, not a rally. Classic distribution.
📉 4H TA
SMA20 2.435 | EMA12 2.446 | SMA10 2.459 | RSI14 50 | Stoch %K 26,6
BB 2.367-2.504 (%B 0,37) | ATR 35 (1,5%)
Price is below all moving averages; $2,500 is now resistance.
🐋 On-chain
• Staking at a record: 43,8M ETH (%35,9 of supply), net inflows of 1,99M ETH (6th consecutive quarter) — but yield fell from %2,81 to %2,63
• Bitmine staked another 159.728 ETH ($390M), bringing its total to 5,23M
• One whale has accumulated 46.100 ETH since Oct 11 at an average price of $2.513
• On the other hand: the Drift exploiter sent 44.510 ETH ($109M) to Tornado Cash, and the Ethereum Foundation moved 4.393 ETH to Kraken
📊 Flow divergence
US spot ETH ETFs saw -$231M over the past 5 sessions, with just +$28M on Oct 21. In the same period, $BTC ETFs received +$1,08B in 3 days. ETH/BTC is down %7,1 in 20 days, and %11,8 below its Oct 4 peak. ETH is weaker than BTC as it attempts its own “reclaim”—that’s usually unsustainable.
🎯 Plan
• Retest of $2.435-2.459 (SMA20/SMA10) → SHORT opportunity, stop at $2.530
• If $2.368 (lower BB) breaks → $2.330, then $2.180
• Long only on a close above $2.504 with volume confirmation → $2.580 / $2.650
Position size 1-2%, no leverage. The Oct 28 Fed decision is the main risk.
📌 Do you think $2,500 is genuine support, or a price that’s been held for selling for 13 days? Share your thoughts.
#Ethereum #ETH #BinanceSquare
#EthereumSurpasses$2500 ⏳ Rejected within 24 hours: $2,500 was tested for the third time—and failed for the third time.
📌 Numbers (Binance spot, Oct 22, 08:30 UTC)
$ETH $2,415 | 24h -1,6% | high $2,526,62 | low $2,412,93 | volume $853M
• Oct 9: intraday high of $2,520,54 → close at $2,487,70 (intraday +%2,65)
• Oct 12: high of $2,579,88 → close at $2,447,17 (-%3,54) = failed breakout
• Oct 21, 12:00 (4H): $2,515,70, with $248M in 4-hour volume (the highest in the past 24 hours) → followed by 5 consecutive bearish 4H candles
So $2,500 has been tested 3 times in the past 13 days, and rejected all 3 times. On Oct 21, the price rose on volume 43% above Oct 20 ($0,84B vs $0,59B), but the day ended with rejection, not a rally. Classic distribution.
📉 4H TA
SMA20 2.435 | EMA12 2.446 | SMA10 2.459 | RSI14 50 | Stoch %K 26,6
BB 2.367-2.504 (%B 0,37) | ATR 35 (1,5%)
Price is below all moving averages; $2,500 is now resistance.
🐋 On-chain
• Staking at a record: 43,8M ETH (%35,9 of supply), net inflows of 1,99M ETH (6th consecutive quarter) — but yield fell from %2,81 to %2,63
• Bitmine staked another 159.728 ETH ($390M), bringing its total to 5,23M
• One whale has accumulated 46.100 ETH since Oct 11 at an average price of $2.513
• On the other hand: the Drift exploiter sent 44.510 ETH ($109M) to Tornado Cash, and the Ethereum Foundation moved 4.393 ETH to Kraken
📊 Flow divergence
US spot ETH ETFs saw -$231M over the past 5 sessions, with just +$28M on Oct 21. In the same period, $BTC ETFs received +$1,08B in 3 days. ETH/BTC is down %7,1 in 20 days, and %11,8 below its Oct 4 peak. ETH is weaker than BTC as it attempts its own “reclaim”—that’s usually unsustainable.
🎯 Plan
• Retest of $2.435-2.459 (SMA20/SMA10) → SHORT opportunity, stop at $2.530
• If $2.368 (lower BB) breaks → $2.330, then $2.180
• Long only on a close above $2.504 with volume confirmation → $2.580 / $2.650
Position size 1-2%, no leverage. The Oct 28 Fed decision is the main risk.
📌 Do you think $2,500 is genuine support, or a price that’s been held for selling for 13 days? Share your thoughts.
#Ethereum #ETH #BinanceSquare
📌 Numbers (Binance spot, Oct 22, 08:30 UTC)
$ETH $2,415 | 24h -1,6% | high $2,526,62 | low $2,412,93 | volume $853M
• Oct 9: intraday high of $2,520,54 → close at $2,487,70 (intraday +%2,65)
• Oct 12: high of $2,579,88 → close at $2,447,17 (-%3,54) = failed breakout
• Oct 21, 12:00 (4H): $2,515,70, with $248M in 4-hour volume (the highest in the past 24 hours) → followed by 5 consecutive bearish 4H candles
So $2,500 has been tested 3 times in the past 13 days, and rejected all 3 times. On Oct 21, the price rose on volume 43% above Oct 20 ($0,84B vs $0,59B), but the day ended with rejection, not a rally. Classic distribution.
📉 4H TA
SMA20 2.435 | EMA12 2.446 | SMA10 2.459 | RSI14 50 | Stoch %K 26,6
BB 2.367-2.504 (%B 0,37) | ATR 35 (1,5%)
Price is below all moving averages; $2,500 is now resistance.
🐋 On-chain
• Staking at a record: 43,8M ETH (%35,9 of supply), net inflows of 1,99M ETH (6th consecutive quarter) — but yield fell from %2,81 to %2,63
• Bitmine staked another 159.728 ETH ($390M), bringing its total to 5,23M
• One whale has accumulated 46.100 ETH since Oct 11 at an average price of $2.513
• On the other hand: the Drift exploiter sent 44.510 ETH ($109M) to Tornado Cash, and the Ethereum Foundation moved 4.393 ETH to Kraken
📊 Flow divergence
US spot ETH ETFs saw -$231M over the past 5 sessions, with just +$28M on Oct 21. In the same period, $BTC ETFs received +$1,08B in 3 days. ETH/BTC is down %7,1 in 20 days, and %11,8 below its Oct 4 peak. ETH is weaker than BTC as it attempts its own “reclaim”—that’s usually unsustainable.
🎯 Plan
• Retest of $2.435-2.459 (SMA20/SMA10) → SHORT opportunity, stop at $2.530
• If $2.368 (lower BB) breaks → $2.330, then $2.180
• Long only on a close above $2.504 with volume confirmation → $2.580 / $2.650
Position size 1-2%, no leverage. The Oct 28 Fed decision is the main risk.
📌 Do you think $2,500 is genuine support, or a price that’s been held for selling for 13 days? Share your thoughts.
#Ethereum #ETH #BinanceSquare
1
7
·
--
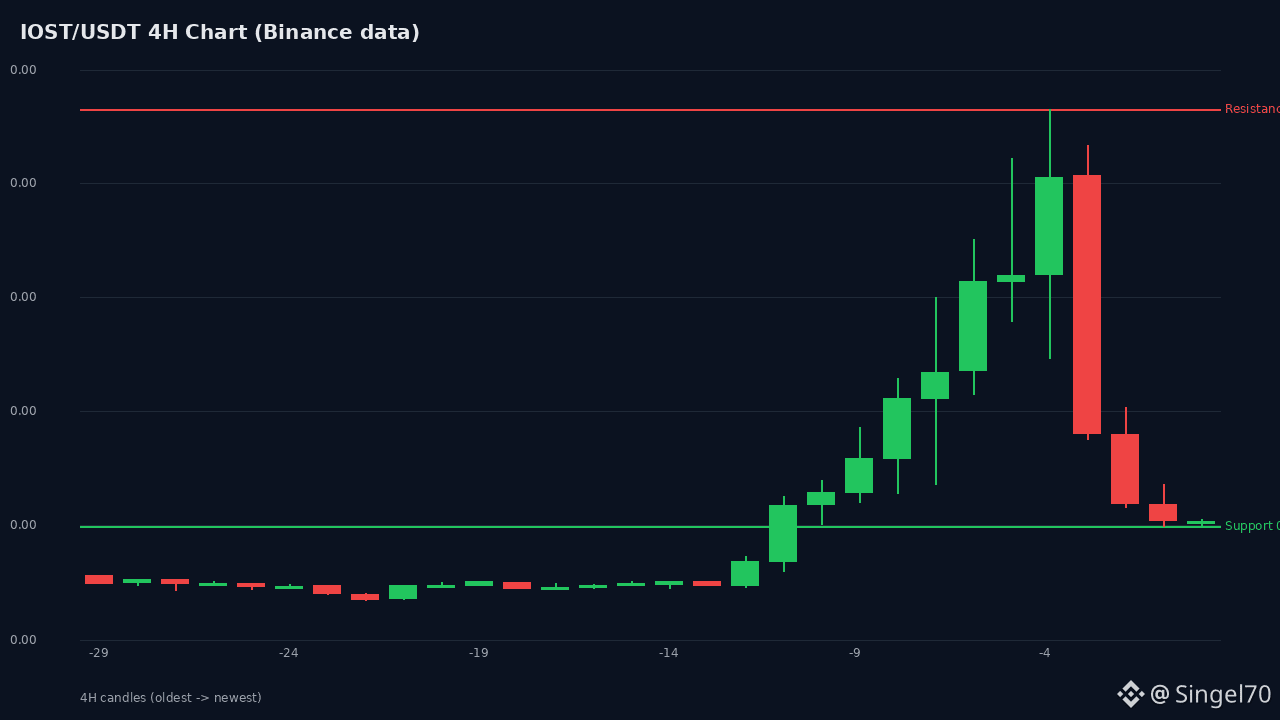
🔻 IOST/USDT — Pump is over, in the distribution phase (4H analysis)
📊 Status (Binance spot, Oct 22, 08:15 UTC)
Price: 0.000899 | 24h: -28.9% | Volume: $41.6M
24h high: 0.001908 | 24h low: 0.000888
On Oct 20–21, it pumped from 0.000744 to 0.001908 (+156%), then retraced. Down 52.8% from the peak to today. Last 3 candles: -36.2% / -15.3% / -4.4% → 3 consecutive bearish candles.
📰 News
• Oct 21: IOST v4.0.0 mainnet upgrade → catalyst for the pump
• Altcoin season rotation (Altcoin Season Index 59) — the rally was part of a broader risk-on flow
• Structural risk: ~7% annual inflation, 90B max supply, FDV of $87M+ at the peak
📈 TA (4H, 100 candles)
SMA20 0.001002 | SMA10 0.001211 | EMA12 0.001083 | EMA26 0.001001
Price is below all moving averages: SMA20 -10.2%, EMA12 -16.9%, SMA10 -25.7%
RSI14 54 (script) / 46 (Wilder) → momentum has broken down
Bollinger: upper 0.001598 / middle 0.001002 / lower 0.000406 → %B 0.41 (in the lower half, bands very wide)
Stochastic %K 13.8 → oversold
ATR14 0.000188 = 20.9% of price → no leverage
🔻 Which side is stronger? SHORT
Structurally, the short is stronger: price is below all MAs, the top formation has broken down, there are 3 consecutive bearish candles, and distribution volume is drying up (11.1M$ → 2.8M$). There is currently no confirmation of a reversal for a long.
However: %K is 13.8 and price is at support (0.000888) → chasing the bottom is risky; it makes sense to enter a short on a bounce.
✅ Plan
Entry: SHORT on a retest of 0.000990–0.001117 (SMA20/EMA12)
Stop: close above 0.001230 (above SMA10)
Target 1: 0.000742 | Target 2: 0.000706 | Target 3: 0.000526 (Aug 19 ATL)
Directional probability (4–8 hours, subjective TA estimate): 60–65% chance of continued downside
⛔ Long only: close above 0.001002 (SMA20) + volume confirmation → 0.001211 / 0.001908
📍 Position size max 1–2%, no leverage, stop required. Liquidity and volatility are high.
⚠️ Not financial advice
#IOST #Altcoin #Crypto #Trading #Binance
🔻 IOST/USDT — Pump is over, in the distribution phase (4H analysis)
📊 Status (Binance spot, Oct 22, 08:15 UTC)
Price: 0.000899 | 24h: -28.9% | Volume: $41.6M
24h high: 0.001908 | 24h low: 0.000888
On Oct 20–21, it pumped from 0.000744 to 0.001908 (+156%), then retraced. Down 52.8% from the peak to today. Last 3 candles: -36.2% / -15.3% / -4.4% → 3 consecutive bearish candles.
📰 News
• Oct 21: IOST v4.0.0 mainnet upgrade → catalyst for the pump
• Altcoin season rotation (Altcoin Season Index 59) — the rally was part of a broader risk-on flow
• Structural risk: ~7% annual inflation, 90B max supply, FDV of $87M+ at the peak
📈 TA (4H, 100 candles)
SMA20 0.001002 | SMA10 0.001211 | EMA12 0.001083 | EMA26 0.001001
Price is below all moving averages: SMA20 -10.2%, EMA12 -16.9%, SMA10 -25.7%
RSI14 54 (script) / 46 (Wilder) → momentum has broken down
Bollinger: upper 0.001598 / middle 0.001002 / lower 0.000406 → %B 0.41 (in the lower half, bands very wide)
Stochastic %K 13.8 → oversold
ATR14 0.000188 = 20.9% of price → no leverage
🔻 Which side is stronger? SHORT
Structurally, the short is stronger: price is below all MAs, the top formation has broken down, there are 3 consecutive bearish candles, and distribution volume is drying up (11.1M$ → 2.8M$). There is currently no confirmation of a reversal for a long.
However: %K is 13.8 and price is at support (0.000888) → chasing the bottom is risky; it makes sense to enter a short on a bounce.
✅ Plan
Entry: SHORT on a retest of 0.000990–0.001117 (SMA20/EMA12)
Stop: close above 0.001230 (above SMA10)
Target 1: 0.000742 | Target 2: 0.000706 | Target 3: 0.000526 (Aug 19 ATL)
Directional probability (4–8 hours, subjective TA estimate): 60–65% chance of continued downside
⛔ Long only: close above 0.001002 (SMA20) + volume confirmation → 0.001211 / 0.001908
📍 Position size max 1–2%, no leverage, stop required. Liquidity and volatility are high.
⚠️ Not financial advice
#IOST #Altcoin #Crypto #Trading #Binance
📊 Status (Binance spot, Oct 22, 08:15 UTC)
Price: 0.000899 | 24h: -28.9% | Volume: $41.6M
24h high: 0.001908 | 24h low: 0.000888
On Oct 20–21, it pumped from 0.000744 to 0.001908 (+156%), then retraced. Down 52.8% from the peak to today. Last 3 candles: -36.2% / -15.3% / -4.4% → 3 consecutive bearish candles.
📰 News
• Oct 21: IOST v4.0.0 mainnet upgrade → catalyst for the pump
• Altcoin season rotation (Altcoin Season Index 59) — the rally was part of a broader risk-on flow
• Structural risk: ~7% annual inflation, 90B max supply, FDV of $87M+ at the peak
📈 TA (4H, 100 candles)
SMA20 0.001002 | SMA10 0.001211 | EMA12 0.001083 | EMA26 0.001001
Price is below all moving averages: SMA20 -10.2%, EMA12 -16.9%, SMA10 -25.7%
RSI14 54 (script) / 46 (Wilder) → momentum has broken down
Bollinger: upper 0.001598 / middle 0.001002 / lower 0.000406 → %B 0.41 (in the lower half, bands very wide)
Stochastic %K 13.8 → oversold
ATR14 0.000188 = 20.9% of price → no leverage
🔻 Which side is stronger? SHORT
Structurally, the short is stronger: price is below all MAs, the top formation has broken down, there are 3 consecutive bearish candles, and distribution volume is drying up (11.1M$ → 2.8M$). There is currently no confirmation of a reversal for a long.
However: %K is 13.8 and price is at support (0.000888) → chasing the bottom is risky; it makes sense to enter a short on a bounce.
✅ Plan
Entry: SHORT on a retest of 0.000990–0.001117 (SMA20/EMA12)
Stop: close above 0.001230 (above SMA10)
Target 1: 0.000742 | Target 2: 0.000706 | Target 3: 0.000526 (Aug 19 ATL)
Directional probability (4–8 hours, subjective TA estimate): 60–65% chance of continued downside
⛔ Long only: close above 0.001002 (SMA20) + volume confirmation → 0.001211 / 0.001908
📍 Position size max 1–2%, no leverage, stop required. Liquidity and volatility are high.
⚠️ Not financial advice
#IOST #Altcoin #Crypto #Trading #Binance
1
209
·
--
Verified
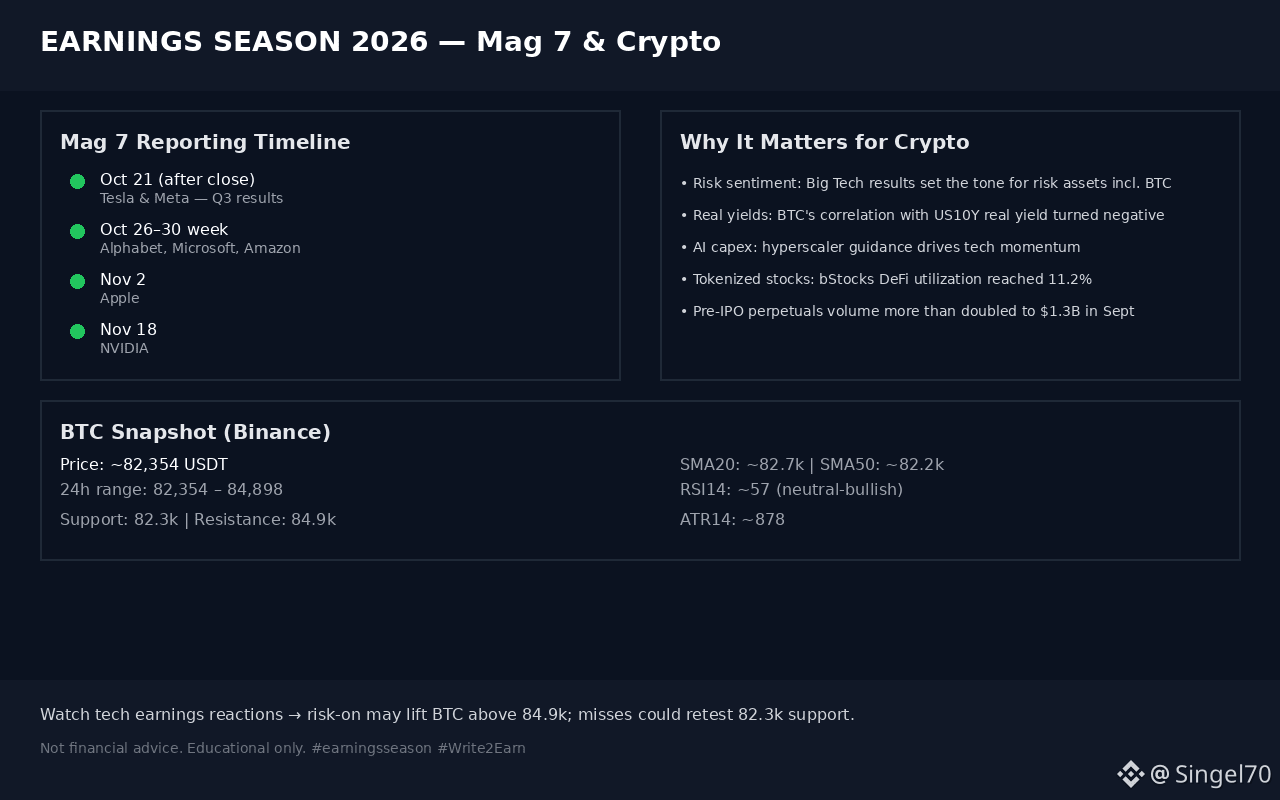
Earnings Season is here: Mag 7 reporting Oct 21 – Nov 18 📊
Key dates:
• Oct 21 (after close): Tesla & Meta
• Oct 26–30 week: Alphabet, Microsoft, Amazon
• Nov 2: Apple
• Nov 18: NVIDIA
Why it matters for crypto:
• Big Tech results set the tone for risk assets incl. BTC
• BTC's correlation with US10Y real yield has turned negative
• Hyperscaler AI capex guidance drives tech momentum
• Tokenized stocks keep growing: bStocks DeFi utilization at 11.2%
• Pre-IPO perpetuals volume more than doubled to $1.3B in September
BTC snapshot (Binance):
• Price: ~82,354 USDT
• 24h range: 82,354 – 84,898
• Support: 82.3k | Resistance: 84.9k
• RSI14: ~57 (neutral-bullish)
Watch: Tech earnings reactions → risk-on may lift BTC above 84.9k; misses could retest 82.3k support.
Which Mag 7 report are you watching? 👇
Not financial advice. Educational only.
#earningsseason #Bitcoin #Crypto #TokenizedStocks
Earnings Season is here: Mag 7 reporting Oct 21 – Nov 18 📊
Key dates:
• Oct 21 (after close): Tesla & Meta
• Oct 26–30 week: Alphabet, Microsoft, Amazon
• Nov 2: Apple
• Nov 18: NVIDIA
Why it matters for crypto:
• Big Tech results set the tone for risk assets incl. BTC
• BTC's correlation with US10Y real yield has turned negative
• Hyperscaler AI capex guidance drives tech momentum
• Tokenized stocks keep growing: bStocks DeFi utilization at 11.2%
• Pre-IPO perpetuals volume more than doubled to $1.3B in September
BTC snapshot (Binance):
• Price: ~82,354 USDT
• 24h range: 82,354 – 84,898
• Support: 82.3k | Resistance: 84.9k
• RSI14: ~57 (neutral-bullish)
Watch: Tech earnings reactions → risk-on may lift BTC above 84.9k; misses could retest 82.3k support.
Which Mag 7 report are you watching? 👇
Not financial advice. Educational only.
#earningsseason #Bitcoin #Crypto #TokenizedStocks
Key dates:
• Oct 21 (after close): Tesla & Meta
• Oct 26–30 week: Alphabet, Microsoft, Amazon
• Nov 2: Apple
• Nov 18: NVIDIA
Why it matters for crypto:
• Big Tech results set the tone for risk assets incl. BTC
• BTC's correlation with US10Y real yield has turned negative
• Hyperscaler AI capex guidance drives tech momentum
• Tokenized stocks keep growing: bStocks DeFi utilization at 11.2%
• Pre-IPO perpetuals volume more than doubled to $1.3B in September
BTC snapshot (Binance):
• Price: ~82,354 USDT
• 24h range: 82,354 – 84,898
• Support: 82.3k | Resistance: 84.9k
• RSI14: ~57 (neutral-bullish)
Watch: Tech earnings reactions → risk-on may lift BTC above 84.9k; misses could retest 82.3k support.
Which Mag 7 report are you watching? 👇
Not financial advice. Educational only.
#earningsseason #Bitcoin #Crypto #TokenizedStocks
2
5.8k
·
--
NEAR/USDT 4H Technical Analysis | Binance, Oct 22, 2026 06:36 UTC
Price 4.993 USDT | 24h -0.85% | range 4.985-5.451 | volume 172.8M USDT
TREND (100 x 4H)
Price is below the main averages: SMA20 5.012 | SMA50 5.001 | EMA12 5.096 | EMA26 5.044 | EMA100 5.079 | EMA200 5.118. 4H is weak; the daily structure is strong.
MOMENTUM
RSI14 53.2 (Wilder 48.1) → neutral, no overbought/oversold conditions.
MACD +0.0513 / signal +0.0294 / histogram +0.0219 → positive, but contracting for 3 bars (0.0612→0.0219).
Stochastic %K 43.9, %D 60.3 → %K below %D, selling pressure.
VOLATILITY
ATR14 0.2051 = 4.11% of price. Bollinger 5.381 / 5.012 / 4.642, %B 0.475. Last 4H volume 2.65M vs. 20-period average 5.02M (0.53x) → volume is drying up during the decline.
LEVELS
Support 4.938 (Fib 61.8%) / 4.90 (HVN) / 4.799 (Fib 78.6%) / 4.62 (lower BB) / 4.301 (100-candle low)
Resistance 5.012-5.036 (SMA20 + Fib 50%) / 5.096-5.134 (EMA12 + Fib 38.2%) / 5.255 (Fib 23.6%) / 5.451 (24h high) / 6.00 (100-candle high)
SIGNAL PROBABILITY (24 hours, 4H close; σ 2.39%/candle, random walk + drift model)
Touch 5.13: 59% | touch 4.90: 79% (close: 44%) | 5.26: 32% | 4.80: 56% | 5.45: 11%
24h close above 4.993: 43% | 72h: 5.13: 72%, 4.62: 55% | 7 days: 5.45: 43%, 4.62: 74%
PLAN
Signal: WAIT / PARTIAL BUY — short-term indecision, medium-term positive.
Entry at 4.94 / 4.90 / 4.80 in stages (40%/30%/30%) | Stop on a 4H close below 4.60 (~2 ATR)
Targets 5.13 → 5.45 → 5.75-6.00 | Position size max 2-3%, no leverage
Trigger: 4H close above 5.13 + volume above the 20-period average = buy confirmation; below 4.90 = wait
NEWS
- Oct 20: Confidential Intents TVL ~160M$ (Q3 +463%), Q3 volume $10.4B, total $32B, $52M+ in fees, $8M+ in buybacks.
- Oct 20: House of Stake HSP-029 vote aims to reduce emissions from 2.5%→1.6% (voting closes Nov 2). NEAR Business multisig treasury platform launched.
- Oct 19-20: Bitwise NEAR ETF (NRR) saw inflows for 3 consecutive days, cumulative ~88.5M$. Oct 16: 3.8M$ Intents exploit postmortem, full compensation.
Note: For educational purposes only; not financial advice.
#NEAR #NEARUSDT #BinanceSquare #TeknikAnaliz #Crypto
NEAR/USDT 4H Technical Analysis | Binance, Oct 22, 2026 06:36 UTC
Price 4.993 USDT | 24h -0.85% | range 4.985-5.451 | volume 172.8M USDT
TREND (100 x 4H)
Price is below the main averages: SMA20 5.012 | SMA50 5.001 | EMA12 5.096 | EMA26 5.044 | EMA100 5.079 | EMA200 5.118. 4H is weak; the daily structure is strong.
MOMENTUM
RSI14 53.2 (Wilder 48.1) → neutral, no overbought/oversold conditions.
MACD +0.0513 / signal +0.0294 / histogram +0.0219 → positive, but contracting for 3 bars (0.0612→0.0219).
Stochastic %K 43.9, %D 60.3 → %K below %D, selling pressure.
VOLATILITY
ATR14 0.2051 = 4.11% of price. Bollinger 5.381 / 5.012 / 4.642, %B 0.475. Last 4H volume 2.65M vs. 20-period average 5.02M (0.53x) → volume is drying up during the decline.
LEVELS
Support 4.938 (Fib 61.8%) / 4.90 (HVN) / 4.799 (Fib 78.6%) / 4.62 (lower BB) / 4.301 (100-candle low)
Resistance 5.012-5.036 (SMA20 + Fib 50%) / 5.096-5.134 (EMA12 + Fib 38.2%) / 5.255 (Fib 23.6%) / 5.451 (24h high) / 6.00 (100-candle high)
SIGNAL PROBABILITY (24 hours, 4H close; σ 2.39%/candle, random walk + drift model)
Touch 5.13: 59% | touch 4.90: 79% (close: 44%) | 5.26: 32% | 4.80: 56% | 5.45: 11%
24h close above 4.993: 43% | 72h: 5.13: 72%, 4.62: 55% | 7 days: 5.45: 43%, 4.62: 74%
PLAN
Signal: WAIT / PARTIAL BUY — short-term indecision, medium-term positive.
Entry at 4.94 / 4.90 / 4.80 in stages (40%/30%/30%) | Stop on a 4H close below 4.60 (~2 ATR)
Targets 5.13 → 5.45 → 5.75-6.00 | Position size max 2-3%, no leverage
Trigger: 4H close above 5.13 + volume above the 20-period average = buy confirmation; below 4.90 = wait
NEWS
- Oct 20: Confidential Intents TVL ~160M$ (Q3 +463%), Q3 volume $10.4B, total $32B, $52M+ in fees, $8M+ in buybacks.
- Oct 20: House of Stake HSP-029 vote aims to reduce emissions from 2.5%→1.6% (voting closes Nov 2). NEAR Business multisig treasury platform launched.
- Oct 19-20: Bitwise NEAR ETF (NRR) saw inflows for 3 consecutive days, cumulative ~88.5M$. Oct 16: 3.8M$ Intents exploit postmortem, full compensation.
Note: For educational purposes only; not financial advice.
#NEAR #NEARUSDT #BinanceSquare #TeknikAnaliz #Crypto
Price 4.993 USDT | 24h -0.85% | range 4.985-5.451 | volume 172.8M USDT
TREND (100 x 4H)
Price is below the main averages: SMA20 5.012 | SMA50 5.001 | EMA12 5.096 | EMA26 5.044 | EMA100 5.079 | EMA200 5.118. 4H is weak; the daily structure is strong.
MOMENTUM
RSI14 53.2 (Wilder 48.1) → neutral, no overbought/oversold conditions.
MACD +0.0513 / signal +0.0294 / histogram +0.0219 → positive, but contracting for 3 bars (0.0612→0.0219).
Stochastic %K 43.9, %D 60.3 → %K below %D, selling pressure.
VOLATILITY
ATR14 0.2051 = 4.11% of price. Bollinger 5.381 / 5.012 / 4.642, %B 0.475. Last 4H volume 2.65M vs. 20-period average 5.02M (0.53x) → volume is drying up during the decline.
LEVELS
Support 4.938 (Fib 61.8%) / 4.90 (HVN) / 4.799 (Fib 78.6%) / 4.62 (lower BB) / 4.301 (100-candle low)
Resistance 5.012-5.036 (SMA20 + Fib 50%) / 5.096-5.134 (EMA12 + Fib 38.2%) / 5.255 (Fib 23.6%) / 5.451 (24h high) / 6.00 (100-candle high)
SIGNAL PROBABILITY (24 hours, 4H close; σ 2.39%/candle, random walk + drift model)
Touch 5.13: 59% | touch 4.90: 79% (close: 44%) | 5.26: 32% | 4.80: 56% | 5.45: 11%
24h close above 4.993: 43% | 72h: 5.13: 72%, 4.62: 55% | 7 days: 5.45: 43%, 4.62: 74%
PLAN
Signal: WAIT / PARTIAL BUY — short-term indecision, medium-term positive.
Entry at 4.94 / 4.90 / 4.80 in stages (40%/30%/30%) | Stop on a 4H close below 4.60 (~2 ATR)
Targets 5.13 → 5.45 → 5.75-6.00 | Position size max 2-3%, no leverage
Trigger: 4H close above 5.13 + volume above the 20-period average = buy confirmation; below 4.90 = wait
NEWS
- Oct 20: Confidential Intents TVL ~160M$ (Q3 +463%), Q3 volume $10.4B, total $32B, $52M+ in fees, $8M+ in buybacks.
- Oct 20: House of Stake HSP-029 vote aims to reduce emissions from 2.5%→1.6% (voting closes Nov 2). NEAR Business multisig treasury platform launched.
- Oct 19-20: Bitwise NEAR ETF (NRR) saw inflows for 3 consecutive days, cumulative ~88.5M$. Oct 16: 3.8M$ Intents exploit postmortem, full compensation.
Note: For educational purposes only; not financial advice.
#NEAR #NEARUSDT #BinanceSquare #TeknikAnaliz #Crypto
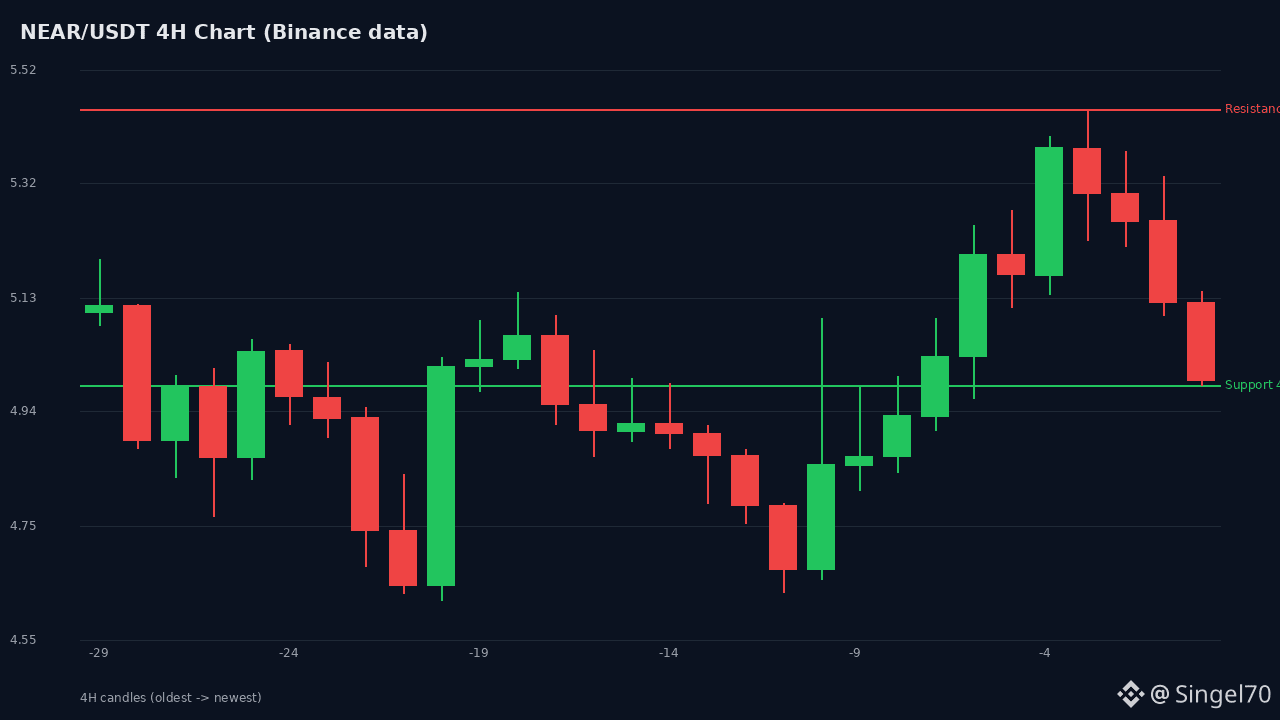
1
51
·
--
SOL/USDT Detailed Analysis + News Support 📊
News flow: Solana activated the Alpenglow upgrade on October 21 (finality 12.8s → 150ms). This is a major catalyst. However, U.S. spot SOL ETFs have seen continuous outflows since October 5; the sell-the-news risk remains. Solana is a leader in RWA and stablecoin transfers.
Current: ~104.93 USDT
24h: 104.72 – 109.20 | 7d low: 100.43
Indicators (4H) — Trading Strategist:
• RSI14: 49.3 (neutral)
• SMA10: 106.64 | SMA20: 105.75
• EMA12: 106.16 | EMA26: 105.73
• MACD: 0.43 (positive but weak)
• Bollinger: 103.18 – 108.32
• Stoch %K: 22.8 (oversold zone)
• ATR14: ~1.76
Mini chart:
109.20 | ┌┐ ← RESISTANCE 2
108.52 | ┌┘
107.50 | ─┘ ← RESISTANCE 1
105.72 | ┌┘ ← PRICE
105.04 | ┌┘ ← SUPPORT 1
104.72 |──┘ ← SUPPORT 2
Levels:
• Support: 105.04 / 104.72 / 100.43
• Resistance: 105.72 / 107.50 / 108.52 / 109.20
Potential signals:
- Break above 105.72 + volume → 107.50/108.52 (probability ~50%)
- Break below 104.72 → 103.18/100.43 (probability ~50%)
Plan: Wait for confirmation above 105.72; stop 104.50; target 108.00.
Live chart: https://www.tradingview.com/chart/?symbol=BINANCE:SOLUSDT
Note: For educational purposes only; not financial advice.
#Solana #SOL #Crypto #Trading #Write2Earn
SOL/USDT Detailed Analysis + News Support 📊
News flow: Solana activated the Alpenglow upgrade on October 21 (finality 12.8s → 150ms). This is a major catalyst. However, U.S. spot SOL ETFs have seen continuous outflows since October 5; the sell-the-news risk remains. Solana is a leader in RWA and stablecoin transfers.
Current: ~104.93 USDT
24h: 104.72 – 109.20 | 7d low: 100.43
Indicators (4H) — Trading Strategist:
• RSI14: 49.3 (neutral)
• SMA10: 106.64 | SMA20: 105.75
• EMA12: 106.16 | EMA26: 105.73
• MACD: 0.43 (positive but weak)
• Bollinger: 103.18 – 108.32
• Stoch %K: 22.8 (oversold zone)
• ATR14: ~1.76
Mini chart:
109.20 | ┌┐ ← RESISTANCE 2
108.52 | ┌┘
107.50 | ─┘ ← RESISTANCE 1
105.72 | ┌┘ ← PRICE
105.04 | ┌┘ ← SUPPORT 1
104.72 |──┘ ← SUPPORT 2
Levels:
• Support: 105.04 / 104.72 / 100.43
• Resistance: 105.72 / 107.50 / 108.52 / 109.20
Potential signals:
- Break above 105.72 + volume → 107.50/108.52 (probability ~50%)
- Break below 104.72 → 103.18/100.43 (probability ~50%)
Plan: Wait for confirmation above 105.72; stop 104.50; target 108.00.
Live chart: https://www.tradingview.com/chart/?symbol=BINANCE:SOLUSDT
Note: For educational purposes only; not financial advice.
#Solana #SOL #Crypto #Trading #Write2Earn
News flow: Solana activated the Alpenglow upgrade on October 21 (finality 12.8s → 150ms). This is a major catalyst. However, U.S. spot SOL ETFs have seen continuous outflows since October 5; the sell-the-news risk remains. Solana is a leader in RWA and stablecoin transfers.
Current: ~104.93 USDT
24h: 104.72 – 109.20 | 7d low: 100.43
Indicators (4H) — Trading Strategist:
• RSI14: 49.3 (neutral)
• SMA10: 106.64 | SMA20: 105.75
• EMA12: 106.16 | EMA26: 105.73
• MACD: 0.43 (positive but weak)
• Bollinger: 103.18 – 108.32
• Stoch %K: 22.8 (oversold zone)
• ATR14: ~1.76
Mini chart:
109.20 | ┌┐ ← RESISTANCE 2
108.52 | ┌┘
107.50 | ─┘ ← RESISTANCE 1
105.72 | ┌┘ ← PRICE
105.04 | ┌┘ ← SUPPORT 1
104.72 |──┘ ← SUPPORT 2
Levels:
• Support: 105.04 / 104.72 / 100.43
• Resistance: 105.72 / 107.50 / 108.52 / 109.20
Potential signals:
- Break above 105.72 + volume → 107.50/108.52 (probability ~50%)
- Break below 104.72 → 103.18/100.43 (probability ~50%)
Plan: Wait for confirmation above 105.72; stop 104.50; target 108.00.
Live chart: https://www.tradingview.com/chart/?symbol=BINANCE:SOLUSDT
Note: For educational purposes only; not financial advice.
#Solana #SOL #Crypto #Trading #Write2Earn
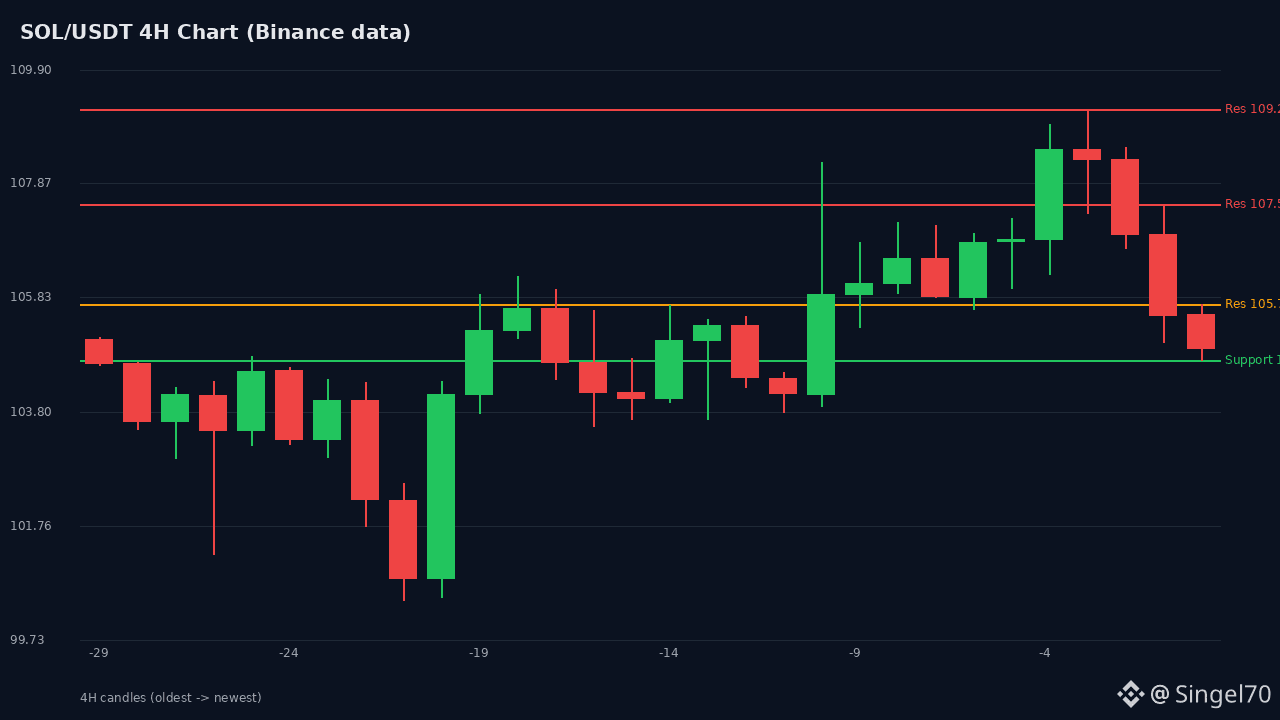
1
15
·
--
ZEC/USDT Detailed Analysis + News Support 📊
News flow: ZEC is 2026's most talked-about coin, driven by its privacy narrative. The NU7 update (target date: November 5), Grayscale ETF in-kind purchases, and whale long positions are supporting the price. A 12% gain and short liquidations were seen over 24h.
Current: ~1,264 USDT
24h: 1,255 – 1,368 | 7-day low: 1,049
Indicators (4H) — Trading Strategist:
• RSI14: 66.7 (bullish zone)
• SMA10: 1,285 | SMA20: 1,217
• EMA12: 1,266 | EMA26: 1,226
• MACD: 39.95 (positive)
• Bollinger: 1,061 – 1,373
• Stoch %K: 58.2
• ATR14: ~47.6
Mini chart:
1,368 | ┌┐ ← RESISTANCE 2
1,338 | ┌┘
1,299 | ─┘ ← RESISTANCE 1
1,264 | ┌┘ ← PRICE
1,262 | ┌┘ ← SUPPORT 1
1,255 |──┘ ← SUPPORT 2
Levels:
• Support: 1,262 / 1,255 / 1,200
• Resistance: 1,299 / 1,338 / 1,368
Potential signals:
- Break above 1,299 + volume → 1,338/1,368 (probability ~60%)
- Break below 1,262 → 1,255/1,200 (probability ~40%)
Plan: Wait for confirmation above 1,299; stop at 1,250; target 1,360.
Live chart: https://www.tradingview.com/chart/?symbol=BINANCE:ZECUSDT
Note: For educational purposes only; not financial advice.
#Zcash #ZEC #Crypto #Trading #Write2Earn
ZEC/USDT Detailed Analysis + News Support 📊
News flow: ZEC is 2026's most talked-about coin, driven by its privacy narrative. The NU7 update (target date: November 5), Grayscale ETF in-kind purchases, and whale long positions are supporting the price. A 12% gain and short liquidations were seen over 24h.
Current: ~1,264 USDT
24h: 1,255 – 1,368 | 7-day low: 1,049
Indicators (4H) — Trading Strategist:
• RSI14: 66.7 (bullish zone)
• SMA10: 1,285 | SMA20: 1,217
• EMA12: 1,266 | EMA26: 1,226
• MACD: 39.95 (positive)
• Bollinger: 1,061 – 1,373
• Stoch %K: 58.2
• ATR14: ~47.6
Mini chart:
1,368 | ┌┐ ← RESISTANCE 2
1,338 | ┌┘
1,299 | ─┘ ← RESISTANCE 1
1,264 | ┌┘ ← PRICE
1,262 | ┌┘ ← SUPPORT 1
1,255 |──┘ ← SUPPORT 2
Levels:
• Support: 1,262 / 1,255 / 1,200
• Resistance: 1,299 / 1,338 / 1,368
Potential signals:
- Break above 1,299 + volume → 1,338/1,368 (probability ~60%)
- Break below 1,262 → 1,255/1,200 (probability ~40%)
Plan: Wait for confirmation above 1,299; stop at 1,250; target 1,360.
Live chart: https://www.tradingview.com/chart/?symbol=BINANCE:ZECUSDT
Note: For educational purposes only; not financial advice.
#Zcash #ZEC #Crypto #Trading #Write2Earn
News flow: ZEC is 2026's most talked-about coin, driven by its privacy narrative. The NU7 update (target date: November 5), Grayscale ETF in-kind purchases, and whale long positions are supporting the price. A 12% gain and short liquidations were seen over 24h.
Current: ~1,264 USDT
24h: 1,255 – 1,368 | 7-day low: 1,049
Indicators (4H) — Trading Strategist:
• RSI14: 66.7 (bullish zone)
• SMA10: 1,285 | SMA20: 1,217
• EMA12: 1,266 | EMA26: 1,226
• MACD: 39.95 (positive)
• Bollinger: 1,061 – 1,373
• Stoch %K: 58.2
• ATR14: ~47.6
Mini chart:
1,368 | ┌┐ ← RESISTANCE 2
1,338 | ┌┘
1,299 | ─┘ ← RESISTANCE 1
1,264 | ┌┘ ← PRICE
1,262 | ┌┘ ← SUPPORT 1
1,255 |──┘ ← SUPPORT 2
Levels:
• Support: 1,262 / 1,255 / 1,200
• Resistance: 1,299 / 1,338 / 1,368
Potential signals:
- Break above 1,299 + volume → 1,338/1,368 (probability ~60%)
- Break below 1,262 → 1,255/1,200 (probability ~40%)
Plan: Wait for confirmation above 1,299; stop at 1,250; target 1,360.
Live chart: https://www.tradingview.com/chart/?symbol=BINANCE:ZECUSDT
Note: For educational purposes only; not financial advice.
#Zcash #ZEC #Crypto #Trading #Write2Earn
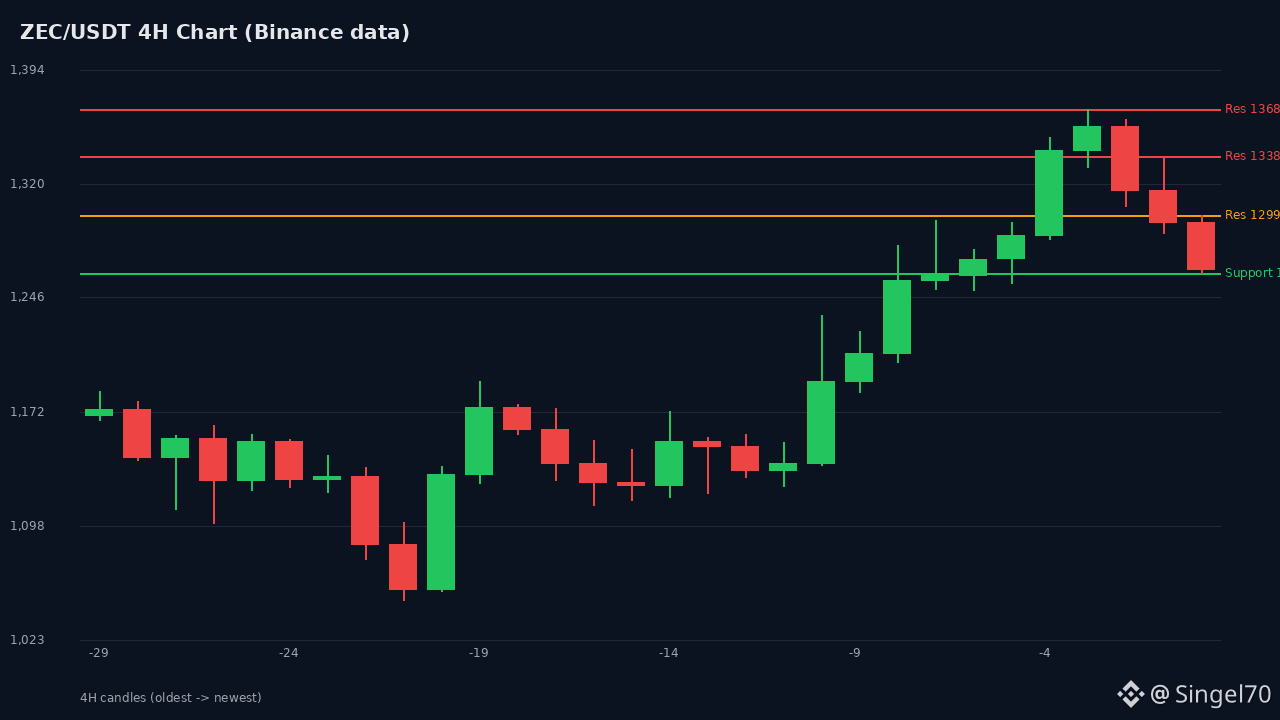
1
187
·
--
BTC/USDT 4H Chart Analysis 📊 (Current Data)
Current: ~82,779 USDT | 24h: 82,647 – 84,898
On the chart:
• Green candles: buyers in control
• Red: selling pressure
• Blue line: 82,647 support
• Red line: 84,898 resistance
Indicators:
• RSI14: 56.7 (neutral-bullish)
• SMA20: 82,752 | SMA50: 82,246
• ATR14: ~878
Signal:
- Break above 83,200 + volume → 84.4k/84.9k (probability ~55%)
- Break below 82,647 → 82.3k/81.8k (probability ~45%)
Plan: Wait for confirmation above 83.2k; stop at 82.5k; target 84.5k.
Note: For educational purposes only; not financial advice.
#Bitcoin #BTC #Crypto #Trading #Write2Earn
BTC/USDT 4H Chart Analysis 📊 (Current Data)
Current: ~82,779 USDT | 24h: 82,647 – 84,898
On the chart:
• Green candles: buyers in control
• Red: selling pressure
• Blue line: 82,647 support
• Red line: 84,898 resistance
Indicators:
• RSI14: 56.7 (neutral-bullish)
• SMA20: 82,752 | SMA50: 82,246
• ATR14: ~878
Signal:
- Break above 83,200 + volume → 84.4k/84.9k (probability ~55%)
- Break below 82,647 → 82.3k/81.8k (probability ~45%)
Plan: Wait for confirmation above 83.2k; stop at 82.5k; target 84.5k.
Note: For educational purposes only; not financial advice.
#Bitcoin #BTC #Crypto #Trading #Write2Earn
Current: ~82,779 USDT | 24h: 82,647 – 84,898
On the chart:
• Green candles: buyers in control
• Red: selling pressure
• Blue line: 82,647 support
• Red line: 84,898 resistance
Indicators:
• RSI14: 56.7 (neutral-bullish)
• SMA20: 82,752 | SMA50: 82,246
• ATR14: ~878
Signal:
- Break above 83,200 + volume → 84.4k/84.9k (probability ~55%)
- Break below 82,647 → 82.3k/81.8k (probability ~45%)
Plan: Wait for confirmation above 83.2k; stop at 82.5k; target 84.5k.
Note: For educational purposes only; not financial advice.
#Bitcoin #BTC #Crypto #Trading #Write2Earn
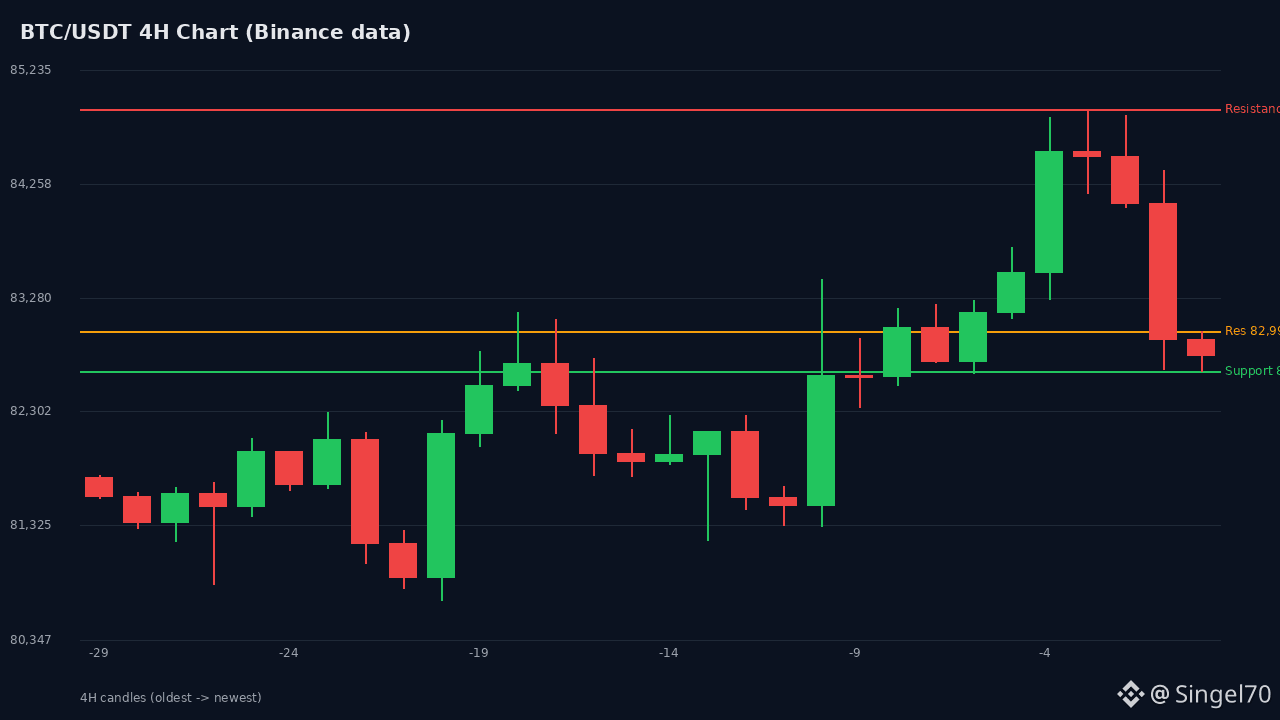
1
60
·
--
ETH/USDT Detailed Analysis + News Update 📊
News update: According to Binance market data, ETH broke above 2,500 USDT (24h high: 2,526). It has now pulled back to the 2,440 area amid profit-taking. The market is watching to see whether it can retest $2,500.
Current: ~2,439 USDT
24h: 2,431 – 2,526 | 7d low: 2,324
Indicators (4H):
• RSI14: 56.2 (neutral-bullish)
• SMA20: 2,436 | SMA50: 2,430
• ATR14: ~36.9 (low-to-moderate volatility)
Mini chart:
2,526 | ┌┐ ← RESISTANCE 2
2,501 | ┌┘
2,482 | ─┘ ← RESISTANCE 1
2,448 | ┌┘ ← PRICE
2,431 | ┌┘ ← SUPPORT 1
2,400 |──┘ ← SUPPORT 2
Levels:
• Support: 2,431 / 2,400 / 2,324
• Resistance: 2,448 / 2,482 / 2,501 / 2,526
Potential scenarios:
- Break above 2,448 + volume → 2,482/2,501 (probability ~55%)
- Break below 2,431 → 2,400/2,324 (probability ~45%)
Plan: Wait for confirmation above 2,448; stop at 2,425; target 2,500.
Live chart: https://www.tradingview.com/chart/?symbol=BINANCE:ETHUSDT
Note: For educational purposes only; not financial advice.
#Ethereum #ETH #Crypto #Trading #Write2Earn
ETH/USDT Detailed Analysis + News Update 📊
News update: According to Binance market data, ETH broke above 2,500 USDT (24h high: 2,526). It has now pulled back to the 2,440 area amid profit-taking. The market is watching to see whether it can retest $2,500.
Current: ~2,439 USDT
24h: 2,431 – 2,526 | 7d low: 2,324
Indicators (4H):
• RSI14: 56.2 (neutral-bullish)
• SMA20: 2,436 | SMA50: 2,430
• ATR14: ~36.9 (low-to-moderate volatility)
Mini chart:
2,526 | ┌┐ ← RESISTANCE 2
2,501 | ┌┘
2,482 | ─┘ ← RESISTANCE 1
2,448 | ┌┘ ← PRICE
2,431 | ┌┘ ← SUPPORT 1
2,400 |──┘ ← SUPPORT 2
Levels:
• Support: 2,431 / 2,400 / 2,324
• Resistance: 2,448 / 2,482 / 2,501 / 2,526
Potential scenarios:
- Break above 2,448 + volume → 2,482/2,501 (probability ~55%)
- Break below 2,431 → 2,400/2,324 (probability ~45%)
Plan: Wait for confirmation above 2,448; stop at 2,425; target 2,500.
Live chart: https://www.tradingview.com/chart/?symbol=BINANCE:ETHUSDT
Note: For educational purposes only; not financial advice.
#Ethereum #ETH #Crypto #Trading #Write2Earn
News update: According to Binance market data, ETH broke above 2,500 USDT (24h high: 2,526). It has now pulled back to the 2,440 area amid profit-taking. The market is watching to see whether it can retest $2,500.
Current: ~2,439 USDT
24h: 2,431 – 2,526 | 7d low: 2,324
Indicators (4H):
• RSI14: 56.2 (neutral-bullish)
• SMA20: 2,436 | SMA50: 2,430
• ATR14: ~36.9 (low-to-moderate volatility)
Mini chart:
2,526 | ┌┐ ← RESISTANCE 2
2,501 | ┌┘
2,482 | ─┘ ← RESISTANCE 1
2,448 | ┌┘ ← PRICE
2,431 | ┌┘ ← SUPPORT 1
2,400 |──┘ ← SUPPORT 2
Levels:
• Support: 2,431 / 2,400 / 2,324
• Resistance: 2,448 / 2,482 / 2,501 / 2,526
Potential scenarios:
- Break above 2,448 + volume → 2,482/2,501 (probability ~55%)
- Break below 2,431 → 2,400/2,324 (probability ~45%)
Plan: Wait for confirmation above 2,448; stop at 2,425; target 2,500.
Live chart: https://www.tradingview.com/chart/?symbol=BINANCE:ETHUSDT
Note: For educational purposes only; not financial advice.
#Ethereum #ETH #Crypto #Trading #Write2Earn
1
41
·
--
BTC/USDT Detailed Technical Analysis — Live Data 📊
Most discussed/watched coin: BTC (24h volume leader)
Current: ~82,779 USDT
24h: 82,647 – 84,898 | 7d low: 79,800
Indicators (4H):
• RSI14: 56.7 (neutral-bullish)
• SMA20: 82,752 | SMA50: 82,246
• ATR14: ~878 (moderate volatility)
Mini chart:
84.9k | ┌┐ ← RESISTANCE 2
84.4k | ┌┘
83.2k | ─┘ ← RESISTANCE 1
82.9k | ┌┘ ← PRICE
82.6k | ┌┘ ← SUPPORT 1
82.3k |──┘ ← SUPPORT 2
Levels:
• Support: 82,647 / 82,300 / 81,800
• Resistance: 82,992 / 83,200 / 84,377 / 84,898
Signal scenarios:
- Break above 83,200 + volume → 84.4k/84.9k (probability ~55%)
- Break below 82,647 → 82.3k/81.8k (probability ~45%)
Plan: Wait for confirmation above 83.2k; stop at 82.5k; target 84.5k.
Live chart: https://www.tradingview.com/chart/?symbol=BINANCE:BTCUSDT
Note: For educational purposes only; not financial advice.
#Bitcoin #BTC #Crypto #Trading #Write2Earn
BTC/USDT Detailed Technical Analysis — Live Data 📊
Most discussed/watched coin: BTC (24h volume leader)
Current: ~82,779 USDT
24h: 82,647 – 84,898 | 7d low: 79,800
Indicators (4H):
• RSI14: 56.7 (neutral-bullish)
• SMA20: 82,752 | SMA50: 82,246
• ATR14: ~878 (moderate volatility)
Mini chart:
84.9k | ┌┐ ← RESISTANCE 2
84.4k | ┌┘
83.2k | ─┘ ← RESISTANCE 1
82.9k | ┌┘ ← PRICE
82.6k | ┌┘ ← SUPPORT 1
82.3k |──┘ ← SUPPORT 2
Levels:
• Support: 82,647 / 82,300 / 81,800
• Resistance: 82,992 / 83,200 / 84,377 / 84,898
Signal scenarios:
- Break above 83,200 + volume → 84.4k/84.9k (probability ~55%)
- Break below 82,647 → 82.3k/81.8k (probability ~45%)
Plan: Wait for confirmation above 83.2k; stop at 82.5k; target 84.5k.
Live chart: https://www.tradingview.com/chart/?symbol=BINANCE:BTCUSDT
Note: For educational purposes only; not financial advice.
#Bitcoin #BTC #Crypto #Trading #Write2Earn
Most discussed/watched coin: BTC (24h volume leader)
Current: ~82,779 USDT
24h: 82,647 – 84,898 | 7d low: 79,800
Indicators (4H):
• RSI14: 56.7 (neutral-bullish)
• SMA20: 82,752 | SMA50: 82,246
• ATR14: ~878 (moderate volatility)
Mini chart:
84.9k | ┌┐ ← RESISTANCE 2
84.4k | ┌┘
83.2k | ─┘ ← RESISTANCE 1
82.9k | ┌┘ ← PRICE
82.6k | ┌┘ ← SUPPORT 1
82.3k |──┘ ← SUPPORT 2
Levels:
• Support: 82,647 / 82,300 / 81,800
• Resistance: 82,992 / 83,200 / 84,377 / 84,898
Signal scenarios:
- Break above 83,200 + volume → 84.4k/84.9k (probability ~55%)
- Break below 82,647 → 82.3k/81.8k (probability ~45%)
Plan: Wait for confirmation above 83.2k; stop at 82.5k; target 84.5k.
Live chart: https://www.tradingview.com/chart/?symbol=BINANCE:BTCUSDT
Note: For educational purposes only; not financial advice.
#Bitcoin #BTC #Crypto #Trading #Write2Earn
1
76
Log in to explore more content
Join global crypto users on Binance Square
⚡️ Get latest and useful information about crypto.
💬 Trusted by the world’s largest crypto exchange.
👍 Discover real insights from verified creators.
Email / Phone number