cryptoarbitrage

134,486 views
283 Discussing
Zeklor
·
--
Yield Arbitrage Looks Easy on Paper: Here Is What Decides Your Real Return. Yield differentials between decentralized lending protocols and centralized exchange earn products create recurring arbitrage opportunities, especially for large-capital operators. The idea is simple. Collateralize a low-yielding asset, mint a stablecoin against it, and deploy that stablecoin into a higher-yielding wealth management product. If the yield earned exceeds the cost of borrowing, the operator captures a positive net interest margin without selling the original asset. However, the headline spread is rarely the number that ends up in your account. Gas costs eat into returns every time capital moves on-chain. Slippage during stablecoin conversion can quietly shave off more, particularly when the amounts are large or the pool is thin. Because of this, a loop that looks profitable at first glance can shrink to almost nothing once every step is priced in. On the other hand, the cost that is easiest to ignore is platform counterparty risk. Funds placed in a centralized earn product depend on the platform’s solvency and operational integrity, while the decentralized side carries its own smart contract and liquidation risks. As a result, a fair evaluation needs to measure the risk-adjusted return, not just the raw yield difference. That is why experienced investors run the full calculation before they commit capital. Subtract the fees, account for slippage, and ask honestly what happens if one platform fails. If you would rather follow a trader who weighs these trade-offs every day, join my copy trading account on Binance here: [https://www.binance.com/en/copy-trading/lead-details/5293024773212277505?timeRange=365D](https://www.binance.com/en/copy-trading/lead-details/5293024773212277505?timeRange=365D) $USDT $ETH $BNB #CryptoArbitrage #defi #Copytrading #BinanceSquare
Yield Arbitrage Looks Easy on Paper: Here Is What Decides Your Real Return.

Yield differentials between decentralized lending protocols and centralized exchange earn products create recurring arbitrage opportunities, especially for large-capital operators. The idea is simple. Collateralize a low-yielding asset, mint a stablecoin against it, and deploy that stablecoin into a higher-yielding wealth management product. If the yield earned exceeds the cost of borrowing, the operator captures a positive net interest margin without selling the original asset.

However, the headline spread is rarely the number that ends up in your account. Gas costs eat into returns every time capital moves on-chain. Slippage during stablecoin conversion can quietly shave off more, particularly when the amounts are large or the pool is thin. Because of this, a loop that looks profitable at first glance can shrink to almost nothing once every step is priced in.

On the other hand, the cost that is easiest to ignore is platform counterparty risk. Funds placed in a centralized earn product depend on the platform’s solvency and operational integrity, while the decentralized side carries its own smart contract and liquidation risks. As a result, a fair evaluation needs to measure the risk-adjusted return, not just the raw yield difference.

That is why experienced investors run the full calculation before they commit capital. Subtract the fees, account for slippage, and ask honestly what happens if one platform fails. If you would rather follow a trader who weighs these trade-offs every day, join my copy trading account on Binance here: https://www.binance.com/en/copy-trading/lead-details/5293024773212277505?timeRange=365D

$USDT $ETH $BNB
#CryptoArbitrage #defi #Copytrading #BinanceSquare
My Spot Portfolio
0 / 300
Minimum 10USDT
7D PNL
(USDT)
-17.47
7D ROI
-3.09%
AUM
$546.49
Win Rate
30.00%
·
--
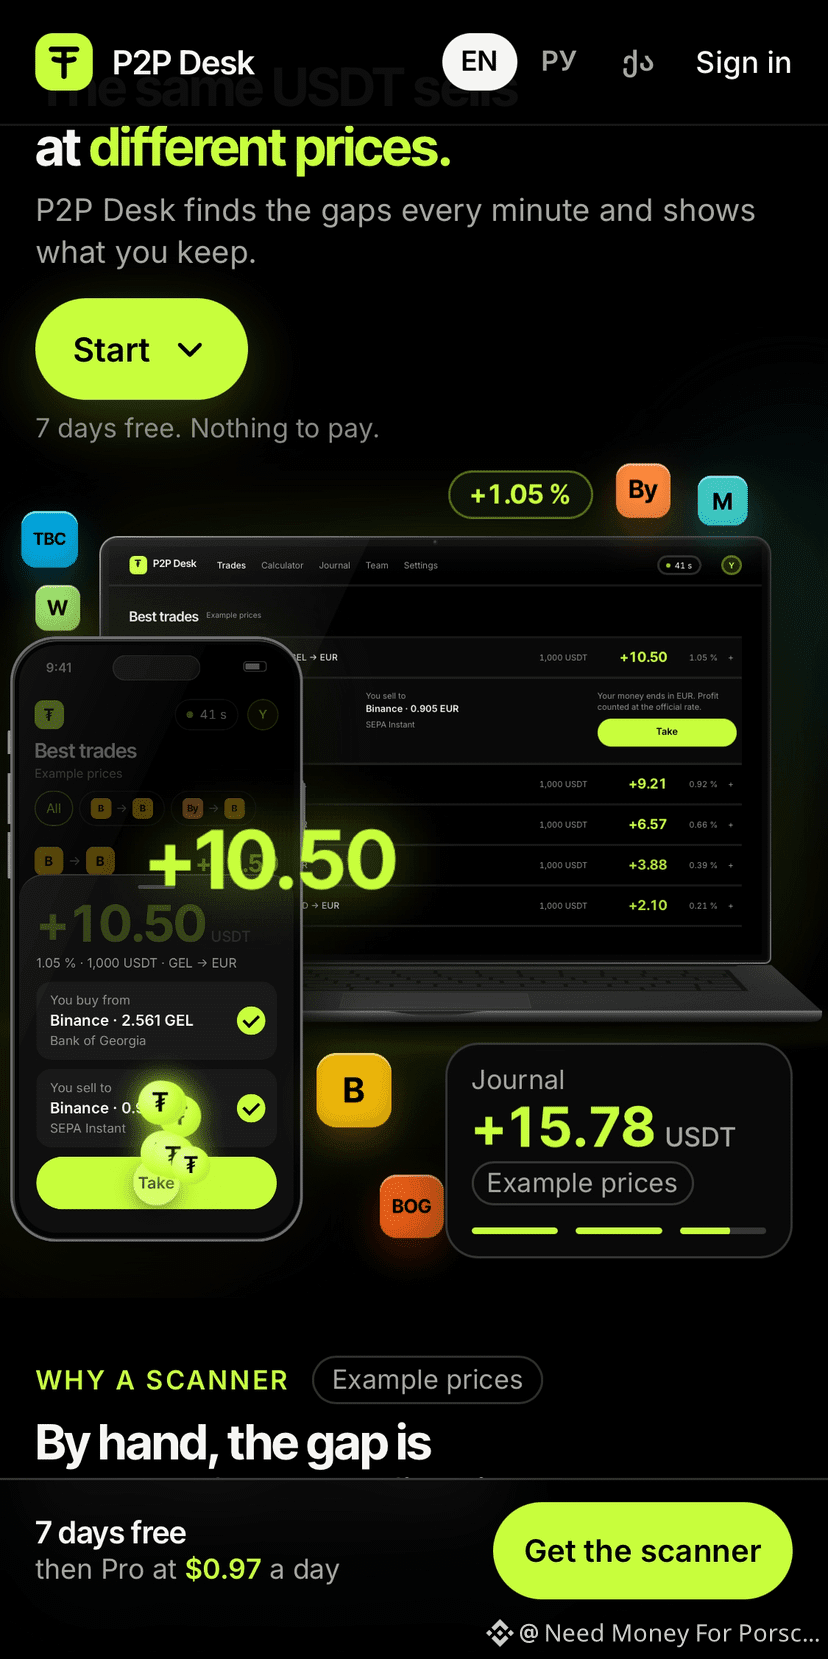
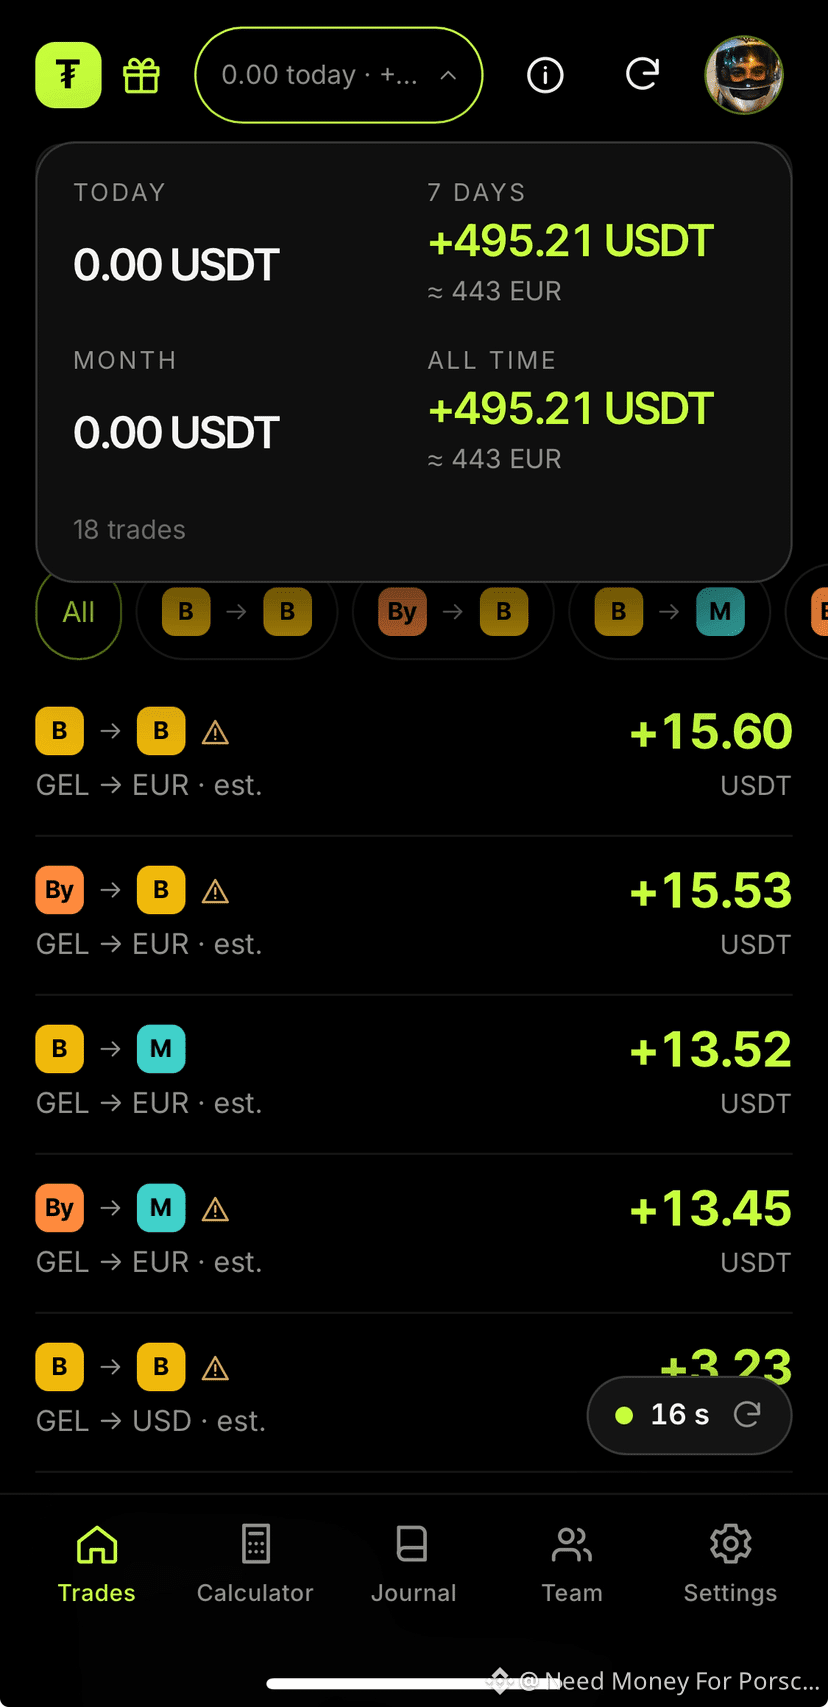
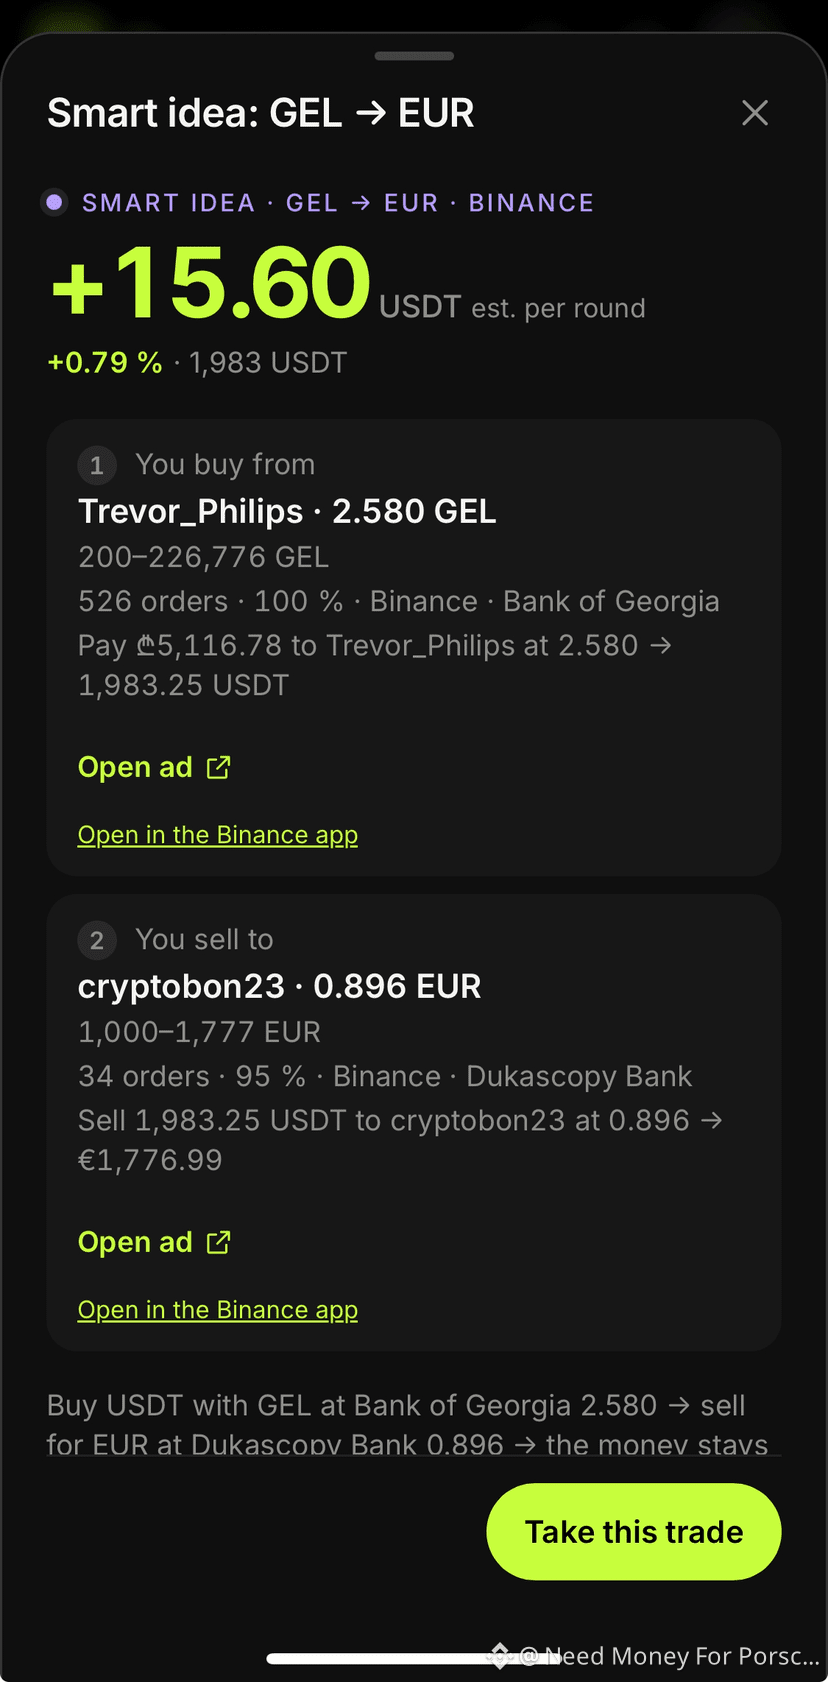
🎉 MILESTONE CELEBRATION: 100 FREE 1-YEAR ACCOUNTS OPEN! 🎉 To mark the launch of our P2P trading scanner, we are giving 100 P2P traders full 1-year free access to our market tools and complete strategy suite! 💡 What’s included in your 1-Year Free Access: • Complete P2P Trading Guide: Step-by-step risk management, bank account safety, and spread calculations. • Real-Time P2P Scanner: Live tracking for arbitrage opportunities across major fiat pairs. • Banking & AML Rules: Proven methods to protect your cards and accounts from compliance flags. 🎁 How to Claim Your Free 1-Year Access: Follow this profile & like this post. Open your browser and go to: p2p.shotatrades/com/guide Register your account to activate your free access before all 100 spots are filled! Let's elevate P2P trading together! 🚀 #P2PTrading #CryptoArbitrage #P2PTrading #BİNANCESQUARE #CryptoEducation
🎉 MILESTONE CELEBRATION: 100 FREE 1-YEAR ACCOUNTS OPEN! 🎉
To mark the launch of our P2P trading scanner, we are giving 100 P2P traders full 1-year free access to our market tools and complete strategy suite!
💡 What’s included in your 1-Year Free Access:
• Complete P2P Trading Guide: Step-by-step risk management, bank account safety, and spread calculations.
• Real-Time P2P Scanner: Live tracking for arbitrage opportunities across major fiat pairs.
• Banking & AML Rules: Proven methods to protect your cards and accounts from compliance flags.
🎁 How to Claim Your Free 1-Year Access:
Follow this profile & like this post.
Open your browser and go to:

p2p.shotatrades/com/guide

Register your account to activate your free access before all 100 spots are filled!
Let's elevate P2P trading together! 🚀

#P2PTrading #CryptoArbitrage #P2PTrading #BİNANCESQUARE #CryptoEducation
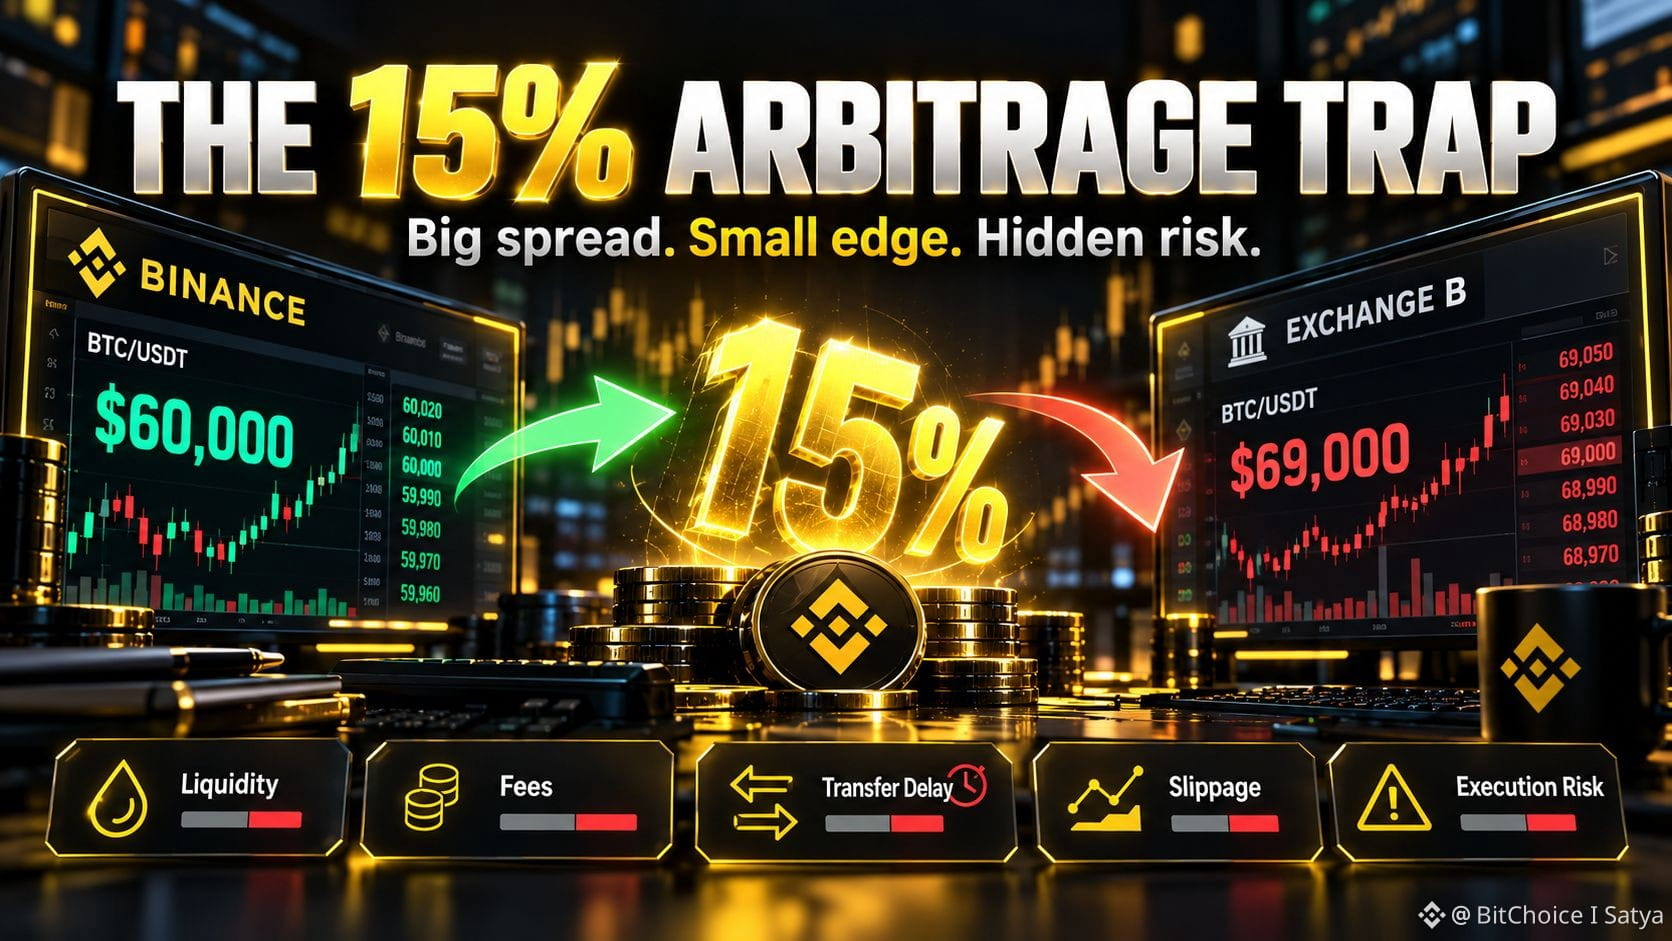
🚨 THE 15% ARBITRAGE TRAP — BIG SPREAD, HIDDEN RISKS! 📊 Crypto Arbitrage | Educational Analysis Imagine discovering the same token on two exchanges: 🟢 Exchange A: $1.00 🔴 Exchange B: $1.15 That's a 15% price difference. Easy money? Not necessarily. ⚠️ SIX CHECKS BEFORE CALLING IT AN OPPORTUNITY 1️⃣ ORDER BOOK DEPTH A 15% gap means little if only a few tokens are available at the displayed price. Your actual trade size matters. 2️⃣ TRADING FEES Buying and selling both incur costs. Maker/taker fees and your execution method change the economics. 3️⃣ DEPOSIT & WITHDRAWAL STATUS Can you withdraw from Exchange A and deposit into Exchange B? Both operations must be available on a compatible network. 4️⃣ TOKEN & NETWORK IDENTITY Similar tickers do not guarantee identical assets. Verify the blockchain, contract address and transfer compatibility. 5️⃣ SLIPPAGE & TRANSFER DELAYS Order execution, blockchain confirmations and exchange crediting take time. The spread may disappear before the tokens arrive. 6️⃣ REAL EXECUTABLE PROFIT Calculate the actual quantity bought and sold, average execution prices, fees and final proceeds. 💡 THE ARBITRAGE REALITY A displayed 15% spread can become a much smaller gain — or even a loss. Some price gaps persist precisely because the transfer route is blocked, liquidity is insufficient or the assets are not truly equivalent. 🔍 THE KEY PRINCIPLE Headline spread ≠ executable profit. The opportunity only becomes meaningful when the entire buy → transfer → sell route is verified. 💬 What is the biggest arbitrage trap you have encountered: low liquidity, transfer restrictions or misleading prices? Educational content only. Not financial advice. #CryptoArbitrage #TradingEducation #CEX #MarketAnalysis
🚨 THE 15% ARBITRAGE TRAP — BIG SPREAD, HIDDEN RISKS!

📊 Crypto Arbitrage | Educational Analysis
Imagine discovering the same token on two exchanges:

🟢 Exchange A: $1.00
🔴 Exchange B: $1.15

That's a 15% price difference.
Easy money? Not necessarily.

⚠️ SIX CHECKS BEFORE CALLING IT AN OPPORTUNITY

1️⃣ ORDER BOOK DEPTH
A 15% gap means little if only a few tokens are available at the displayed price. Your actual trade size matters.

2️⃣ TRADING FEES
Buying and selling both incur costs. Maker/taker fees and your execution method change the economics.

3️⃣ DEPOSIT & WITHDRAWAL STATUS
Can you withdraw from Exchange A and deposit into Exchange B? Both operations must be available on a compatible network.

4️⃣ TOKEN & NETWORK IDENTITY
Similar tickers do not guarantee identical assets. Verify the blockchain, contract address and transfer compatibility.

5️⃣ SLIPPAGE & TRANSFER DELAYS
Order execution, blockchain confirmations and exchange crediting take time. The spread may disappear before the tokens arrive.

6️⃣ REAL EXECUTABLE PROFIT
Calculate the actual quantity bought and sold, average execution prices, fees and final proceeds.

💡 THE ARBITRAGE REALITY

A displayed 15% spread can become a much smaller gain — or even a loss.
Some price gaps persist precisely because the transfer route is blocked, liquidity is insufficient or the assets are not truly equivalent.

🔍 THE KEY PRINCIPLE

Headline spread ≠ executable profit.
The opportunity only becomes meaningful when the entire buy → transfer → sell route is verified.

💬 What is the biggest arbitrage trap you have encountered: low
liquidity, transfer restrictions or misleading prices?
Educational content only. Not financial advice.

#CryptoArbitrage #TradingEducation #CEX #MarketAnalysis
Article
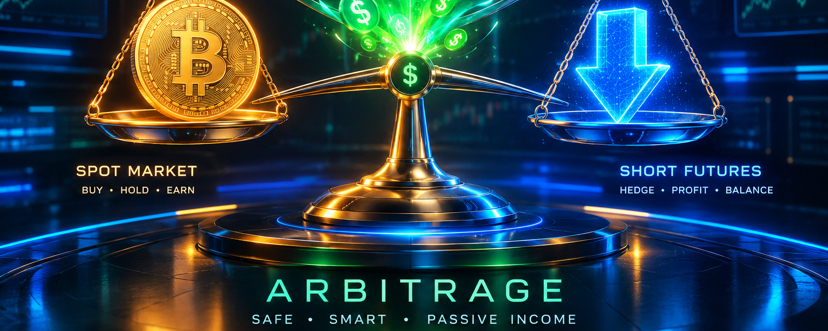
🤖 Risk-Free Crypto Arbitrage: How to Earn from the Funding Rate While the Market Is in TurmoilMost traders are used to making money when cryptocurrencies rise or fall. But what should you do when the market is flat, or if you simply don’t want to guess which way the price will move? Binance offers a tool that lets you earn fully market-neutral (risk-free) returns: the Arbitrage Bot. Let’s explore how to make the spot and futures markets work for your wallet.

🤖 Risk-Free Crypto Arbitrage: How to Earn from the Funding Rate While the Market Is in Turmoil

Most traders are used to making money when cryptocurrencies rise or fall. But what should you do when the market is flat, or if you simply don’t want to guess which way the price will move?
Binance offers a tool that lets you earn fully market-neutral (risk-free) returns: the Arbitrage Bot. Let’s explore how to make the spot and futures markets work for your wallet.
🚀 #Funding Rate #Arbitrage Alert: $10K Positions Printing Profits! Discover high-potential funding rate arbitrage setups across Bybit, Binance, and OKX. With a $10,000 position size in USDT/USD, smart traders are capturing real edge by going long on one exchange and short on another to lock in positive funding differentials. Top Opportunities Right Now: GWEI: Long Bybit (-4.1244%) vs Short Binance (-1.8027%) → $232.17 Profit (Fees: $11) SLX: Long Bybit (-2.4177%) vs Short OKX (-0.8998%) → $151.79 Profit EPIC: Long Bybit (-1.3113%) vs Short Binance (-0.3638%) → $94.75 Profit SKHYNIX: Positive rates on both sides delivering $20.51 Profit Additional solid plays on OGN, SAMSUNG, and LAB adding consistent small wins. These setups show clear funding rate dislocation — perfect for low-risk, market-neutral strategies that work regardless of overall crypto direction. 📈 Trade Forecast: Open GWEI Arbitrage Now! Based on the strong negative funding spread and momentum in the table, enter a $10K Long Bybit + Short Binance position immediately. Take Profit: $280 (realistic extension of current $232 capture) Stop Loss: $80 (protects against sudden rate convergence) This market-neutral play minimizes directional risk while harvesting funding payments. Scale smartly and monitor rates closely for adjustments. Don't miss these alpha opportunities in the current market! Whether you're chasing big spreads like GWEI or steady gains on lower volatility pairs, funding arbitrage remains one of the smartest ways to generate consistent returns in crypto. Start small, compound daily, and watch your portfolio grow. Success favors the prepared trader! Trade smart, stay disciplined, and turn funding inefficiencies into your edge today. Follow & turn on 🔔 notifications for more real-time arbitrage signals! ✅ #FundingRateArbitrage #CryptoArbitrage #PerpetualFutures #CryptoTrading #DeFi #AltcoinOpportunities #PassiveIncome
🚀 #Funding Rate #Arbitrage Alert: $10K Positions Printing Profits!
Discover high-potential funding rate arbitrage setups across Bybit, Binance, and OKX. With a $10,000 position size in USDT/USD, smart traders are capturing real edge by going long on one exchange and short on another to lock in positive funding differentials.
Top Opportunities Right Now:
GWEI: Long Bybit (-4.1244%) vs Short Binance (-1.8027%) → $232.17 Profit (Fees: $11)
SLX: Long Bybit (-2.4177%) vs Short OKX (-0.8998%) → $151.79 Profit
EPIC: Long Bybit (-1.3113%) vs Short Binance (-0.3638%) → $94.75 Profit
SKHYNIX: Positive rates on both sides delivering $20.51 Profit
Additional solid plays on OGN, SAMSUNG, and LAB adding consistent small wins.
These setups show clear funding rate dislocation — perfect for low-risk, market-neutral strategies that work regardless of overall crypto direction.
📈 Trade Forecast: Open GWEI Arbitrage Now!
Based on the strong negative funding spread and momentum in the table, enter a $10K Long Bybit + Short Binance position immediately.
Take Profit: $280 (realistic extension of current $232 capture)
Stop Loss: $80 (protects against sudden rate convergence)
This market-neutral play minimizes directional risk while harvesting funding payments. Scale smartly and monitor rates closely for adjustments.
Don't miss these alpha opportunities in the current market! Whether you're chasing big spreads like GWEI or steady gains on lower volatility pairs, funding arbitrage remains one of the smartest ways to generate consistent returns in crypto.
Start small, compound daily, and watch your portfolio grow. Success favors the prepared trader!
Trade smart, stay disciplined, and turn funding inefficiencies into your edge today.
Follow & turn on 🔔 notifications for more real-time arbitrage signals! ✅
#FundingRateArbitrage #CryptoArbitrage #PerpetualFutures #CryptoTrading #DeFi #AltcoinOpportunities #PassiveIncome
​Boosting my trading game with automated arbitrage on the XRP/USDT pair! Fine-tuning position management and keeping a close eye on fees is essential for maximizing those small price differences. Let's keep pushing the limits of decentralized finance! How do you see the market today? Will it go up or down? Cast your vote below! ​#CryptoArbitrage #Xrp🔥🔥 #BinanceSquare
​Boosting my trading game with automated arbitrage on the XRP/USDT pair! Fine-tuning position management and keeping a close eye on fees is essential for maximizing those small price differences. Let's keep pushing the limits of decentralized finance!

How do you see the market today? Will it go up or down? Cast your vote below!
​#CryptoArbitrage #Xrp🔥🔥 #BinanceSquare
Bitcoin Up or Down on August 17?

Bitcoin Up or Down on August 17?

99%Up1%Down
Volume $106,144.98
🚨 Funding Rate Arbitrage Alert: $10K Positions Printing Profits! Trade Now! Discover high-potential funding rate arbitrage setups across Bybit, Binance & OKX. With a $10,000 position size, smart traders are capturing risk-adjusted returns by going long on one exchange and short on another where funding rates diverge significantly. Top Opportunities Right Now: $PORTAL: Long Bybit (-2.2871%) vs Short Binance (-0.9647%) → +$132.25 profit $MBOX: Long Bybit (-0.7818%) vs Short Binance (-0.2712%) → +$51.06 profit $BTR: Solid +$49.93 potential $ID: +$47.75 on strong divergence Even smaller setups like $ARM, $LLY, $BMNR, $DRAM, $SXT, and $IO are showing consistent positive edges with only $11 fees. These are perfect for scaling in low-volatility environments while collecting funding payments. Forecast Play: Strong momentum in funding divergences favors opening $PORTAL Long Bybit + Short Binance arbitrage now. Suggested entry at current rates. Take Profit: $180 | Stop Loss: $45 (protects 65% of projected profit). Monitor for rate convergence. This is your edge in the market! Don't miss these mechanical profits that don't rely on directional bets. Scale smart, manage risk, and let the funding rates work for you. Perfect for both beginners and pros looking for alpha. Trade or copy these setups on Binance/Bybit NOW! Follow & turn 🔔 on ✅ #FundingRateArbitrage #CryptoArbitrage #Bybit #Binance #OKX #PORTAL #MBOX #CryptoTrading #PassiveIncome #USDT
🚨 Funding Rate Arbitrage Alert: $10K Positions Printing Profits! Trade Now!
Discover high-potential funding rate arbitrage setups across Bybit, Binance & OKX. With a $10,000 position size, smart traders are capturing risk-adjusted returns by going long on one exchange and short on another where funding rates diverge significantly.
Top Opportunities Right Now:
$PORTAL: Long Bybit (-2.2871%) vs Short Binance (-0.9647%) → +$132.25 profit
$MBOX: Long Bybit (-0.7818%) vs Short Binance (-0.2712%) → +$51.06 profit
$BTR: Solid +$49.93 potential
$ID: +$47.75 on strong divergence
Even smaller setups like $ARM, $LLY, $BMNR, $DRAM, $SXT, and $IO are showing consistent positive edges with only $11 fees. These are perfect for scaling in low-volatility environments while collecting funding payments.
Forecast Play: Strong momentum in funding divergences favors opening $PORTAL Long Bybit + Short Binance arbitrage now. Suggested entry at current rates. Take Profit: $180 | Stop Loss: $45 (protects 65% of projected profit). Monitor for rate convergence.
This is your edge in the market! Don't miss these mechanical profits that don't rely on directional bets.
Scale smart, manage risk, and let the funding rates work for you. Perfect for both beginners and pros looking for alpha.
Trade or copy these setups on Binance/Bybit NOW! Follow & turn 🔔 on ✅
#FundingRateArbitrage #CryptoArbitrage #Bybit #Binance #OKX #PORTAL #MBOX #CryptoTrading #PassiveIncome #USDT
💰 #Funding Rate #Arbitrage Explosive Opportunities Right Now! Up to $133 Profit on $10K Position – Trade Smart! 🚀 Discover high-conviction funding rate arbitrage setups across top exchanges! With a $10,000 USDT position, smart traders are locking in risk-adjusted profits by going Long on one platform and Short on another to capture positive funding rate differentials. Top Plays Right Now: PROVE: Long Bybit + Short Binance = $133.73 potential profit MSTR: Long Bybit + Short OKX = $42.38 profit COIN: Long OKX + Short Binance = $31.91 profit LPT & MBOX: Solid $23+ setups ready to print These low-risk arb opportunities let you earn while markets move sideways. Perfect for consistent income in any condition! Forecast Alert: Strong momentum in funding spreads suggests opening PROVE Long Bybit / Short Binance now. Target Take Profit at full $133 level within 24-48h. Set Stop Loss at 40% of expected profit ($53) to protect capital. Ready to scale your portfolio with minimal directional risk? Trade or copy these setups Now on Binance, Bybit & OKX! Follow & turn 🔔 on ✅ for daily alpha drops. #FundingRateArbitrage #CryptoArbitrage #Binance #Bybit #OKX #PerpetualTrading #CryptoTrading #PassiveIncome #USDT #AltcoinSeason
💰 #Funding Rate #Arbitrage Explosive Opportunities Right Now! Up to $133 Profit on $10K Position – Trade Smart! 🚀
Discover high-conviction funding rate arbitrage setups across top exchanges! With a $10,000 USDT position, smart traders are locking in risk-adjusted profits by going Long on one platform and Short on another to capture positive funding rate differentials.
Top Plays Right Now:
PROVE: Long Bybit + Short Binance = $133.73 potential profit
MSTR: Long Bybit + Short OKX = $42.38 profit
COIN: Long OKX + Short Binance = $31.91 profit
LPT & MBOX: Solid $23+ setups ready to print
These low-risk arb opportunities let you earn while markets move sideways. Perfect for consistent income in any condition!
Forecast Alert: Strong momentum in funding spreads suggests opening PROVE Long Bybit / Short Binance now. Target Take Profit at full $133 level within 24-48h. Set Stop Loss at 40% of expected profit ($53) to protect capital.
Ready to scale your portfolio with minimal directional risk?
Trade or copy these setups Now on Binance, Bybit & OKX! Follow & turn 🔔 on ✅ for daily alpha drops.
#FundingRateArbitrage #CryptoArbitrage #Binance #Bybit #OKX #PerpetualTrading #CryptoTrading #PassiveIncome #USDT #AltcoinSeason
🚨 #Funding Rate #Arbitrage Alert: Top Opportunities + LIVE Trade Forecast! 💰 Position Size: $10,000 USDT High-conviction funding rate arbitrage setups are printing clean profits right now across major exchanges! Top Performers Right Now: $H: Long Bybit (-2.8446%) vs Short Binance (0.01%) → +$285.46 Profit $GWEI: Long Binance (-0.3614%) vs Short Bybit (0.0717%) → +$43.24 Profit $IWM: Long Bybit (-0.2827%) vs Short Binance (0%) → +$28.27 Profit $ESPORTS: Strong momentum with +$18.59 $SKHYNIX, $SPACE, $BR, $SAHARA, $BTW also delivering solid $13–16 gains each! These negative funding rates on one side and positive on the other create perfect low-risk arb windows. Fees are minimal (~$10-11) while profits stack up fast. 🔥 TRADE FORECAST: Open $H Arbitrage Now! Enter: Long Bybit + Short Binance on $H Take Profit: $420 (additional ~47% upside from current) Stop Loss: $180 (protect capital if spread collapses) This setup has strong momentum with deep negative funding divergence. Perfect for conservative size scaling. Funding rate arbitrage remains one of the safest ways to generate consistent yield in any market condition. Don’t sleep on these edges! Trade smart, size responsibly, and let the rates work for you! Follow & turn 🔔 on ✅ for daily alpha, fresh arb setups, and live signals! #FundingRateArbitrage #CryptoArbitrage #PerpetualFutures #CryptoTrading #YieldFarming #PassiveIncome #USDTTrading
🚨 #Funding Rate #Arbitrage Alert: Top Opportunities + LIVE Trade Forecast!
💰 Position Size: $10,000 USDT
High-conviction funding rate arbitrage setups are printing clean profits right now across major exchanges!
Top Performers Right Now:
$H: Long Bybit (-2.8446%) vs Short Binance (0.01%) → +$285.46 Profit
$GWEI: Long Binance (-0.3614%) vs Short Bybit (0.0717%) → +$43.24 Profit
$IWM: Long Bybit (-0.2827%) vs Short Binance (0%) → +$28.27 Profit
$ESPORTS: Strong momentum with +$18.59
$SKHYNIX, $SPACE, $BR, $SAHARA, $BTW also delivering solid $13–16 gains each!
These negative funding rates on one side and positive on the other create perfect low-risk arb windows. Fees are minimal (~$10-11) while profits stack up fast.
🔥 TRADE FORECAST: Open $H Arbitrage Now!
Enter: Long Bybit + Short Binance on $H
Take Profit: $420 (additional ~47% upside from current)
Stop Loss: $180 (protect capital if spread collapses)
This setup has strong momentum with deep negative funding divergence. Perfect for conservative size scaling.
Funding rate arbitrage remains one of the safest ways to generate consistent yield in any market condition. Don’t sleep on these edges!
Trade smart, size responsibly, and let the rates work for you!
Follow & turn 🔔 on ✅ for daily alpha, fresh arb setups, and live signals!
#FundingRateArbitrage #CryptoArbitrage #PerpetualFutures #CryptoTrading #YieldFarming #PassiveIncome #USDTTrading
🚀 #Funding Rate #Arbitrage Opportunity Spotted! ESPORTS Leading with $63+ Profit Potential! Looking for low-risk, high-reward crypto strategies? Check this out! With a $10,000 position size, the ESPORTS pair is showing a massive funding rate gap: Long on Binance at 0.705% vs Short on Bybit at 1.3399% — delivering an estimated $63.49 profit after just $11 fees! Other strong plays include HIGH, BIRB, and ESP with solid $20–$43 profits. Funding rate arbitrage lets you earn from rate differences while staying market-neutral. Perfect for volatile times! Ready to act? Open your arb positions on Binance & Bybit NOW! Secure that passive income stream. Pro tip: Always size properly, monitor rates closely, and use this edge before it closes. Who’s jumping in? Drop a 🔥 if you're trading today! #CryptoArbitrage #FundingRate #Binance #ESPORTS #CryptoTrading #PassiveIncome #AltcoinSeason #TradeSmart #CryptoGains
🚀 #Funding Rate #Arbitrage Opportunity Spotted! ESPORTS Leading with $63+ Profit Potential!
Looking for low-risk, high-reward crypto strategies? Check this out! With a $10,000 position size, the ESPORTS pair is showing a massive funding rate gap: Long on Binance at 0.705% vs Short on Bybit at 1.3399% — delivering an estimated $63.49 profit after just $11 fees!
Other strong plays include HIGH, BIRB, and ESP with solid $20–$43 profits. Funding rate arbitrage lets you earn from rate differences while staying market-neutral. Perfect for volatile times!
Ready to act? Open your arb positions on Binance & Bybit NOW! Secure that passive income stream.
Pro tip: Always size properly, monitor rates closely, and use this edge before it closes. Who’s jumping in? Drop a 🔥 if you're trading today!
#CryptoArbitrage #FundingRate #Binance #ESPORTS #CryptoTrading #PassiveIncome #AltcoinSeason #TradeSmart #CryptoGains
🚀 #Funding Rate #Arbitrage GOLD: $10K Position Delivers $357+ Profits! Forecast Inside! 💰 Just locked in massive wins with smart cross-exchange funding rate arbitrage! Check these top performers: HEI: Long Bybit (-3.74%) vs Short Binance (-0.17%) → +$357.25 profit HOME: Long Bybit vs Short Binance → +$262 EDEN: Solid +$233 BTR, LLY, AERGO all printing $28-$43 each! Total fees minimal at ~$11 per trade. This strategy is crushing it right now — low risk, high reward by exploiting funding rate gaps between Bybit, Binance & OKX! 🔥 TRADE FORECAST: Open HEI Long/Short Arbitrage Now! Target entry at current spread. Take Profit: +$420 (full cycle capture). Stop Loss: -$85 (tight risk management). Position size $10K recommended for steady compounding. Watch for widening negative funding on Bybit — perfect setup for next leg up! This is your edge in volatile markets. Funding rates are paying out big time — don't sleep on these altcoin opportunities! Whether you're farming yields or scaling positions, these setups deliver consistent profits with minimal directional risk. Perfect for Binance Square traders hunting alpha. Ready to copy the winning strategy? Start your $10K arbitrage journey today and turn funding differences into daily income! Trade smart, stack profits! 💸 Follow & turn on 🔔 notifications for more live signals & setups! ✅ #FundingRateArbitrage #CryptoArbitrage #HEI #Binance #Bybit #CryptoTrading #AltcoinSeason #PassiveIncome #BinanceSquare #YieldFarming
🚀 #Funding Rate #Arbitrage GOLD: $10K Position Delivers $357+ Profits! Forecast Inside!
💰 Just locked in massive wins with smart cross-exchange funding rate arbitrage! Check these top performers:
HEI: Long Bybit (-3.74%) vs Short Binance (-0.17%) → +$357.25 profit
HOME: Long Bybit vs Short Binance → +$262
EDEN: Solid +$233
BTR, LLY, AERGO all printing $28-$43 each!
Total fees minimal at ~$11 per trade. This strategy is crushing it right now — low risk, high reward by exploiting funding rate gaps between Bybit, Binance & OKX!
🔥 TRADE FORECAST: Open HEI Long/Short Arbitrage Now!
Target entry at current spread. Take Profit: +$420 (full cycle capture). Stop Loss: -$85 (tight risk management). Position size $10K recommended for steady compounding. Watch for widening negative funding on Bybit — perfect setup for next leg up!
This is your edge in volatile markets. Funding rates are paying out big time — don't sleep on these altcoin opportunities!
Whether you're farming yields or scaling positions, these setups deliver consistent profits with minimal directional risk. Perfect for Binance Square traders hunting alpha.
Ready to copy the winning strategy? Start your $10K arbitrage journey today and turn funding differences into daily income!
Trade smart, stack profits! 💸
Follow & turn on 🔔 notifications for more live signals & setups! ✅
#FundingRateArbitrage #CryptoArbitrage #HEI #Binance #Bybit #CryptoTrading #AltcoinSeason #PassiveIncome #BinanceSquare #YieldFarming
🚀 #Funding Rate #Arbitrage Alert: $10K Positions Printing Profits! 💰 Tired of choppy markets? Smart money is stacking steady gains through funding rate arbitrage across Binance, Bybit & OKX! With a $10,000 USDT position size, these setups are delivering clean profits with minimal risk: STABLE leads strong at +$51.81 profit (Long Bybit -1.1412% vs Short Binance -0.6232%) BSB adding +$22.37 FIDA delivering +$21.64 ALT, PRL, ICNT & EDEN all showing solid double-digit profits between $11.76 - $15.54 These negative funding rate spreads create perfect long/short opportunities for consistent income regardless of market direction. Low fees, high efficiency - pure alpha in volatile conditions! This is your edge in perpetual futures. Don't sleep on these mispricings while they last. Position sizing, hedging & quick execution are key to locking in these returns. Ready to scale your trading game? Start with small test positions on these pairs and watch the funding payments roll in! Trade smart, stay disciplined, and compound those wins daily! 📈 Follow for more alpha, arbitrage setups & live opportunities. Turn on notifications 🔔 and never miss the next big one! ✅ #FundingRateArbitrage #CryptoArbitrage #BinanceFutures #Bybit #PerpetualFutures #CryptoTrading #USDTTrading #AltcoinOpportunities #CryptoProfits #PassiveCryptoIncome
🚀 #Funding Rate #Arbitrage Alert: $10K Positions Printing Profits! 💰
Tired of choppy markets? Smart money is stacking steady gains through funding rate arbitrage across Binance, Bybit & OKX!
With a $10,000 USDT position size, these setups are delivering clean profits with minimal risk:
STABLE leads strong at +$51.81 profit (Long Bybit -1.1412% vs Short Binance -0.6232%)
BSB adding +$22.37
FIDA delivering +$21.64
ALT, PRL, ICNT & EDEN all showing solid double-digit profits between $11.76 - $15.54
These negative funding rate spreads create perfect long/short opportunities for consistent income regardless of market direction. Low fees, high efficiency - pure alpha in volatile conditions!
This is your edge in perpetual futures. Don't sleep on these mispricings while they last. Position sizing, hedging & quick execution are key to locking in these returns.
Ready to scale your trading game? Start with small test positions on these pairs and watch the funding payments roll in!
Trade smart, stay disciplined, and compound those wins daily! 📈
Follow for more alpha, arbitrage setups & live opportunities. Turn on notifications 🔔 and never miss the next big one! ✅
#FundingRateArbitrage #CryptoArbitrage #BinanceFutures #Bybit #PerpetualFutures #CryptoTrading #USDTTrading #AltcoinOpportunities #CryptoProfits #PassiveCryptoIncome
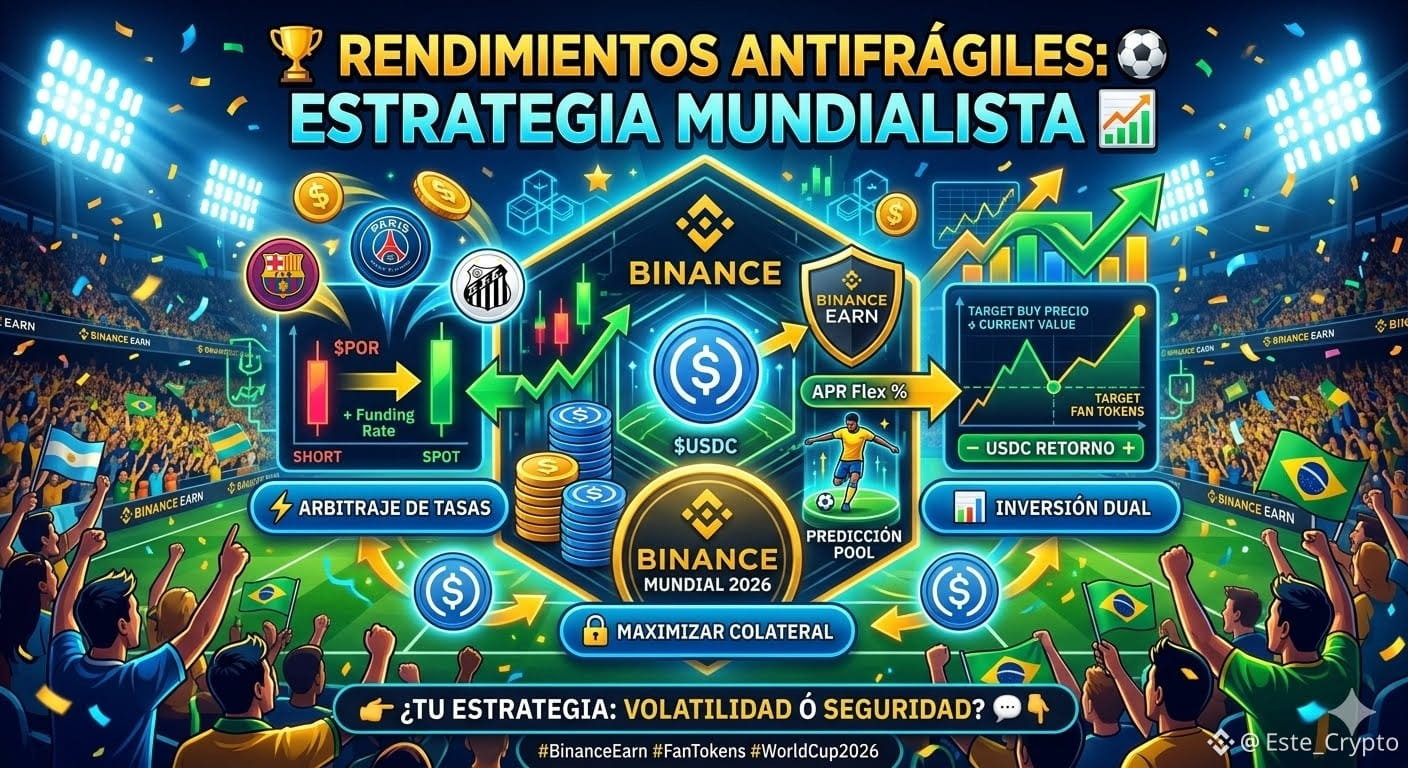
⚽ Antifragile Returns During World Cup Season: The Arbitrage and Hedging Strategy The 2026 World Cup has kicked off, and the capital flow into Fan Tokens ($BAR, $PSG, $SANTOS) and prediction markets is breaking records. While most are betting with their hearts and losing, savvy investors utilize this spike in volatility to extract predictable returns using CeFi infrastructure. How to monetize the trend while minimizing market risk? 1. Funding Rates Arbitrage: Long positions in Fan Tokens often overheat before crucial matches. By opening a short position in Binance Futures while buying the same asset on the Spot market, you neutralize price exposure and earn the funding rate paid by speculative traders every few hours. 2. Maximizing Collateral in Binance Earn: Instead of letting your stablecoins sit idle, place them in Binance Simple Earn’s Flexible products. They allow you to generate a steady base APR while using those assets as liquid collateral to safely participate in Binance’s mega prediction pools, safeguarding your principal capital. 3. Dual Investment for Fan Tokens: If you’re looking to accumulate sports tokens at discounted prices, use Dual Investment. This lets you set a lower target buy price and capture triple-digit annualized returns on $USDC while the market consolidates. The technical key: Don’t chase the token price after a goal. Capitalize on implied volatility and the liquidity injected into the ecosystem. 👉 Are you trading the volatility of Fan Tokens or do you prefer the security of stablecoins in Earn this month? Drop your strategy below. #BinanceEarn #FanTokens #WorldCup2026 #CryptoArbitrage #CryptoInvesting
⚽ Antifragile Returns During World Cup Season: The Arbitrage and Hedging Strategy

The 2026 World Cup has kicked off, and the capital flow into Fan Tokens ($BAR, $PSG, $SANTOS) and prediction markets is breaking records. While most are betting with their hearts and losing, savvy investors utilize this spike in volatility to extract predictable returns using CeFi infrastructure.

How to monetize the trend while minimizing market risk?

1. Funding Rates Arbitrage:
Long positions in Fan Tokens often overheat before crucial matches. By opening a short position in Binance Futures while buying the same asset on the Spot market, you neutralize price exposure and earn the funding rate paid by speculative traders every few hours.

2. Maximizing Collateral in Binance Earn:
Instead of letting your stablecoins sit idle, place them in Binance Simple Earn’s Flexible products. They allow you to generate a steady base APR while using those assets as liquid collateral to safely participate in Binance’s mega prediction pools, safeguarding your principal capital.

3. Dual Investment for Fan Tokens:
If you’re looking to accumulate sports tokens at discounted prices, use Dual Investment. This lets you set a lower target buy price and capture triple-digit annualized returns on $USDC while the market consolidates.

The technical key: Don’t chase the token price after a goal. Capitalize on implied volatility and the liquidity injected into the ecosystem.

👉 Are you trading the volatility of Fan Tokens or do you prefer the security of stablecoins in Earn this month? Drop your strategy below.

#BinanceEarn #FanTokens #WorldCup2026 #CryptoArbitrage #CryptoInvesting
Binance Post (English) 🚀 U$SDC/USDT Update – Steady as always! Current price: $1.00017 with 24h high/low tightly bound between 1.00094 – 1.00011. Trading volume: 3.16B USDC (and equal USDT) – massive liquidity, zero fee pair! 📊 Technical snapshot (1D chart): · MA60: 1.00019 · MACD: DIF -0.00000 / DEA 0.00000 – neutral momentum · Timeframe: 15m to 1D, all showing minimal deviation 📉 Performance: Today -0.014% · 7D -0.008% · 30D -0.023% · 90D -0.066% · 1Y -0.023% Perfect for risk‑free arbitrage, hedging, or just parking stablecoins. Binance’s 0‑fee trading makes it even sweeter! Trade now on #Binance 👉 [link] #USDC #USDT #Stablecoin #CryptoArbitrage #FASBProposesStablecoinsAsCashEquivalents
Binance Post (English)
🚀 U$SDC/USDT Update – Steady as always!

Current price: $1.00017 with 24h high/low tightly bound between 1.00094 – 1.00011.
Trading volume: 3.16B USDC (and equal USDT) – massive liquidity, zero fee pair!

📊 Technical snapshot (1D chart):

· MA60: 1.00019
· MACD: DIF -0.00000 / DEA 0.00000 – neutral momentum
· Timeframe: 15m to 1D, all showing minimal deviation

📉 Performance:
Today -0.014% · 7D -0.008% · 30D -0.023% · 90D -0.066% · 1Y -0.023%

Perfect for risk‑free arbitrage, hedging, or just parking stablecoins. Binance’s 0‑fee trading makes it even sweeter!

Trade now on #Binance 👉 [link]

#USDC #USDT #Stablecoin #CryptoArbitrage
#FASBProposesStablecoinsAsCashEquivalents
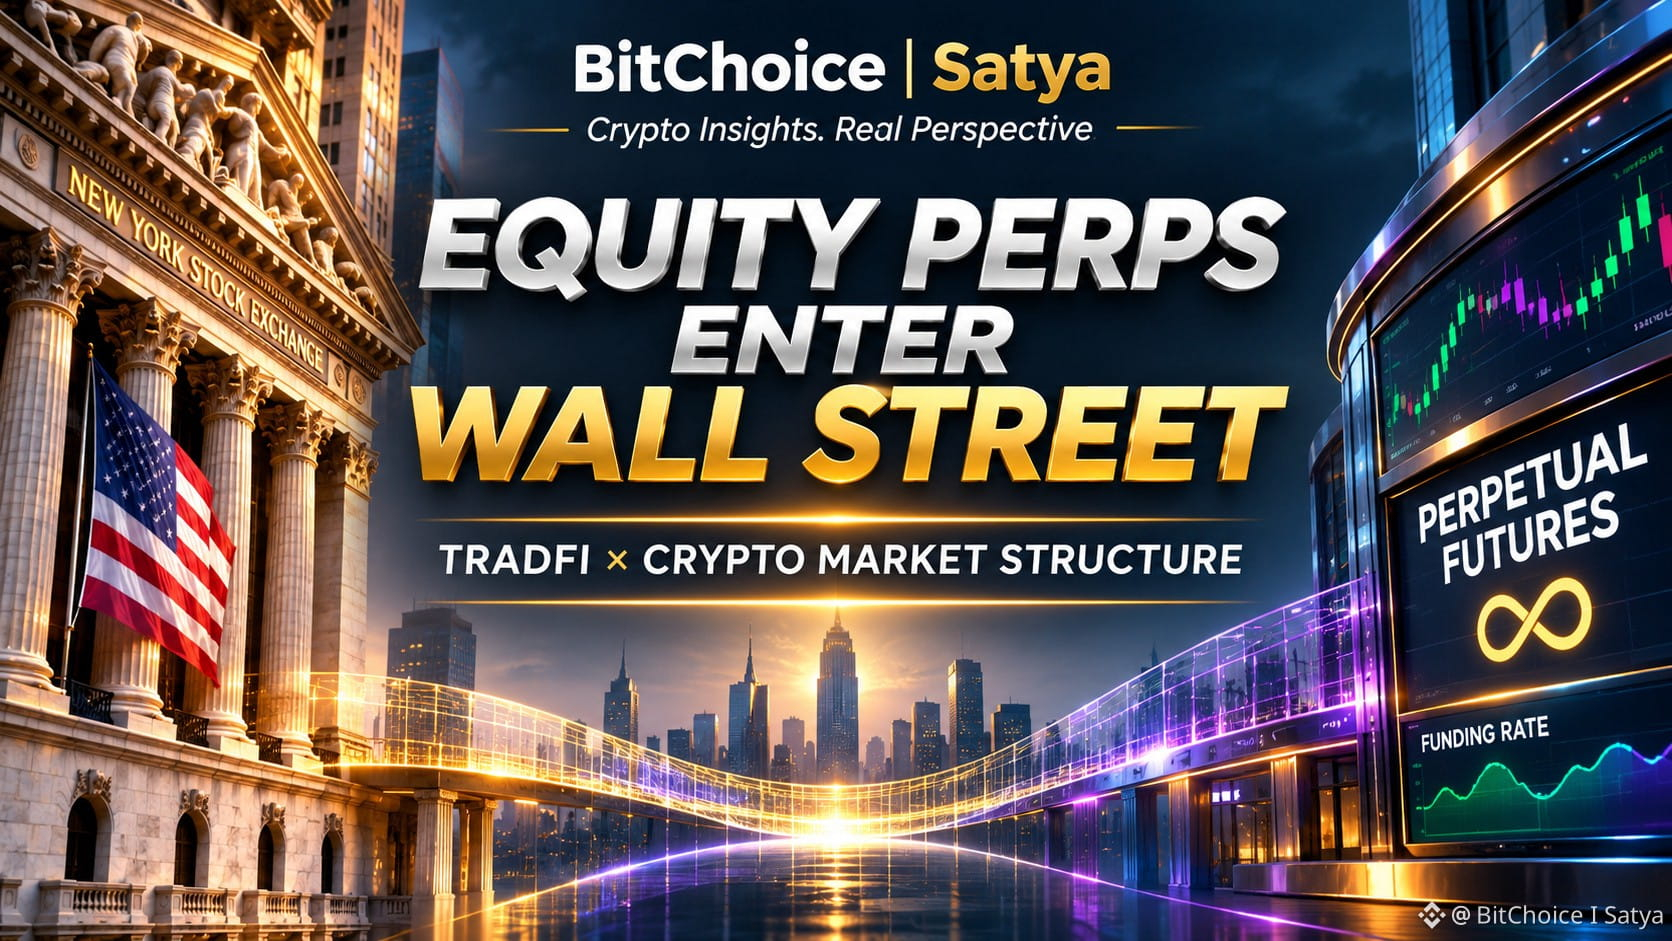
🚨EQUITY PERPS ENTER WALL STREET — A NEW ERA FOR TRADFI ARBITRAGE? The CFTC has opened a regulatory pathway for perpetual futures on individual U.S. stocks, bringing a crypto-native derivatives structure closer to traditional markets. Regulatory filings include contracts linked to AAPL, AMD, NVDA and TSLA. Why does this matter? Equity perpetuals could reshape how traders access stock exposure, hedge positions and manage capital across markets. Three developments worth watching: • Funding rates: Perpetual contracts may introduce new pricing dynamics relative to underlying equities. • Cross-market arbitrage: Price differences between regulated venues and crypto derivatives platforms could create opportunities. • Market accessibility: Extended trading availability could change liquidity and price discovery outside traditional stock-market hours. But execution is everything. A visible spread is not guaranteed profit. Funding costs, liquidity, margin requirements, contract specifications and settlement restrictions determine whether an arbitrage route is actually executable. Regulatory filings do not necessarily mean every contract is already actively trading. BitChoice | Satya Perspective: The real transformation is not simply bringing perpetual futures to Wall Street. It is the potential convergence of TradFi and crypto market infrastructure. The next milestone is measurable liquidity, reliable execution and sustainable pricing efficiency. $TSLA $AAPL $NVDA {future}(NVDAUSDT) {future}(AAPLUSDT) {future}(TSLAUSDT) #EquityPerps #Derivatives #TradFi #CryptoArbitrage #MarketStructure
🚨EQUITY PERPS ENTER WALL STREET — A NEW ERA FOR TRADFI ARBITRAGE?

The CFTC has opened a regulatory pathway for perpetual futures on individual U.S. stocks, bringing a crypto-native derivatives structure closer to traditional markets.

Regulatory filings include contracts linked to AAPL, AMD, NVDA and TSLA.

Why does this matter?

Equity perpetuals could reshape how traders access stock exposure, hedge positions and manage capital across markets.
Three developments worth watching:

• Funding rates: Perpetual contracts may introduce new pricing dynamics relative to underlying equities.
• Cross-market arbitrage: Price differences between regulated venues and crypto derivatives platforms could create opportunities.
• Market accessibility: Extended trading availability could change liquidity and price discovery outside traditional stock-market hours.
But execution is everything.

A visible spread is not guaranteed profit. Funding costs, liquidity, margin requirements, contract specifications and settlement restrictions determine whether an arbitrage route is actually executable.

Regulatory filings do not necessarily mean every contract is already actively trading.

BitChoice | Satya Perspective:

The real transformation is not simply bringing perpetual futures to Wall Street. It is the potential convergence of TradFi and crypto market infrastructure.

The next milestone is measurable liquidity, reliable execution and sustainable pricing efficiency.

$TSLA $AAPL $NVDA
#EquityPerps #Derivatives #TradFi #CryptoArbitrage #MarketStructure
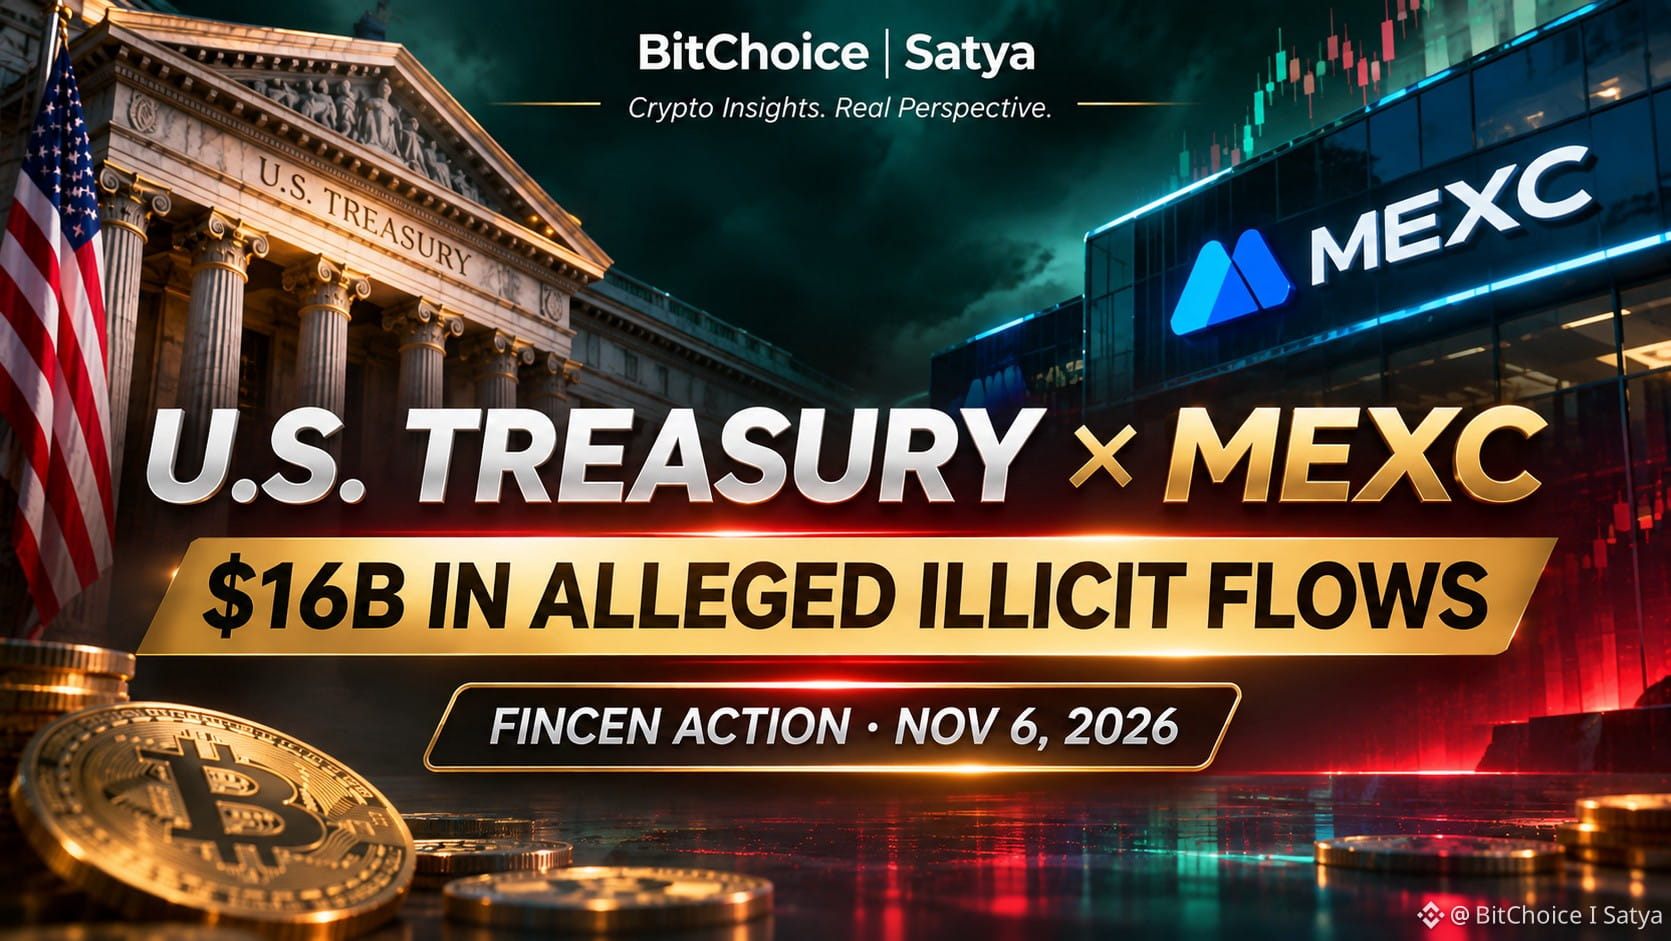
U.S. TREASURY TARGETS MEXC — $16B IN ALLEGED ILLICIT FLOWS On November 6, FinCEN announced enforcement action against MEXC Global, alleging at least $16 billion in transactions linked to illicit activity between 2021 and 2026. What changes? The order targets transfers involving MEXC through U.S. financial institutions. Restrictions are scheduled to take effect 30 days after publication in the Federal Register. MEXC states that its platform continues operating normally and has initiated an independent compliance review. Why should traders care? Regulatory exposure can disrupt banking relationships, counterparties, and settlement infrastructure — even when an exchange remains operational. For cross-exchange arbitrage, a visible price spread is not enough. Deposit and withdrawal availability, network compatibility, liquidity, fees, and regulatory restrictions determine whether a route is actually executable. BitChoice | Satya Perspective: Exchange availability does not guarantee regulatory stability. Counterparty risk must be evaluated alongside market risk. The FinCEN action does not, by itself, establish that user assets are frozen or crypto withdrawals are suspended. #MEXC #CryptoSecurity #CryptoRegulation #AML #CryptoArbitrage $BTC $ETH {spot}(ETHUSDT)
U.S. TREASURY TARGETS MEXC — $16B IN ALLEGED ILLICIT FLOWS

On November 6, FinCEN announced enforcement action against MEXC Global, alleging at least $16 billion in transactions linked to illicit activity between 2021 and 2026.

What changes?

The order targets transfers involving MEXC through U.S. financial institutions. Restrictions are scheduled to take effect 30 days after publication in the Federal Register.

MEXC states that its platform continues operating normally and has initiated an independent compliance review.

Why should traders care?

Regulatory exposure can disrupt banking relationships, counterparties, and settlement infrastructure — even when an exchange remains operational.

For cross-exchange arbitrage, a visible price spread is not enough. Deposit and withdrawal availability, network compatibility, liquidity, fees, and regulatory restrictions determine whether a route is actually executable.

BitChoice | Satya Perspective:

Exchange availability does not guarantee regulatory stability. Counterparty risk must be evaluated alongside market risk.

The FinCEN action does not, by itself, establish that user assets are frozen or crypto withdrawals are suspended.

#MEXC #CryptoSecurity #CryptoRegulation #AML #CryptoArbitrage $BTC
$ETH
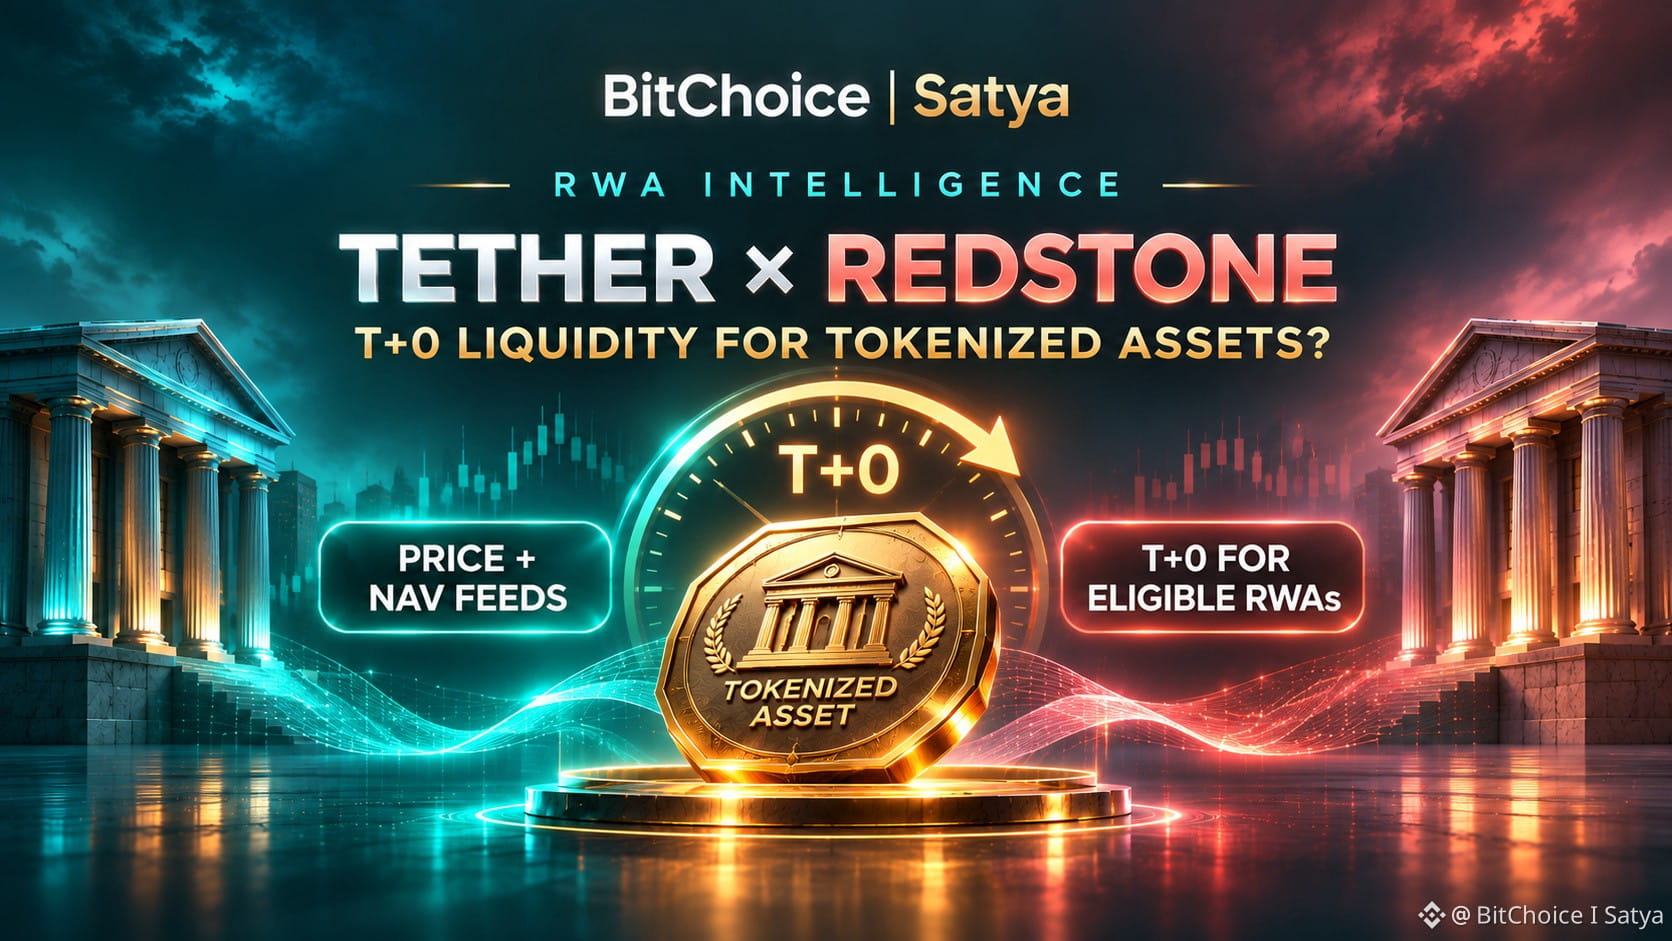
⚡ RWA INTELLIGENCE | TETHER × REDSTONE: CAN T+0 UNLOCK TOKENIZED LIQUIDITY? Tokenization is evolving beyond asset issuance. The next challenge is turning digital assets into usable liquidity. On November 5, Hadron by Tether announced a collaboration with RedStone to improve RWA pricing and settlement infrastructure. 🔍 WHAT IS CHANGING? • Price and NAV feeds for tokenized assets • T+0 liquidity mechanisms for eligible RWAs • Auction-based execution through verified liquidity providers • Faster collateral liquidations without replacing native redemption processes 🏦 WHY THIS MATTERS Traditional assets may take days or longer to redeem. DeFi lending protocols cannot always wait that long when collateral must be liquidated. RedStone Settle aims to bridge this gap by allowing liquidity providers to acquire positions and handle redemption separately. 💡 THE ARBITRAGE QUESTION Does T+0 eliminate price discrepancies? No. Real opportunities still depend on liquidity depth, execution costs, settlement terms and eligibility. Near-instant liquidity is not the same as instant redemption of the underlying asset. 🎯 OUR TAKE The next RWA breakthrough may be infrastructure that makes tokenized assets usable as collateral, not just tradable. Access remains restricted, and some settlement features are still being developed. Could T+0 become a new standard for institutional DeFi? BitChoice | Satya #RWA #Tokenization #DeFi #Tether #CryptoArbitrage $USDT $USDC {spot}(USDCUSDT)
⚡ RWA INTELLIGENCE | TETHER × REDSTONE: CAN T+0 UNLOCK TOKENIZED LIQUIDITY?

Tokenization is evolving beyond asset issuance. The next challenge is turning digital assets into usable liquidity.
On November 5, Hadron by Tether announced a collaboration with RedStone to improve RWA pricing and settlement infrastructure.

🔍 WHAT IS CHANGING?

• Price and NAV feeds for tokenized assets
• T+0 liquidity mechanisms for eligible RWAs
• Auction-based execution through verified liquidity providers
• Faster collateral liquidations without replacing native redemption processes

🏦 WHY THIS MATTERS

Traditional assets may take days or longer to redeem.
DeFi lending protocols cannot always wait that long when collateral must be liquidated.
RedStone Settle aims to bridge this gap by allowing liquidity providers to acquire positions and handle redemption separately.

💡 THE ARBITRAGE QUESTION

Does T+0 eliminate price discrepancies?

No.

Real opportunities still depend on liquidity depth, execution costs, settlement terms and eligibility.
Near-instant liquidity is not the same as instant redemption of the underlying asset.

🎯 OUR TAKE

The next RWA breakthrough may be infrastructure that makes tokenized assets usable as collateral, not just tradable.
Access remains restricted, and some settlement features are still being developed.

Could T+0 become a new standard for institutional DeFi?

BitChoice | Satya

#RWA #Tokenization #DeFi #Tether #CryptoArbitrage $USDT $USDC
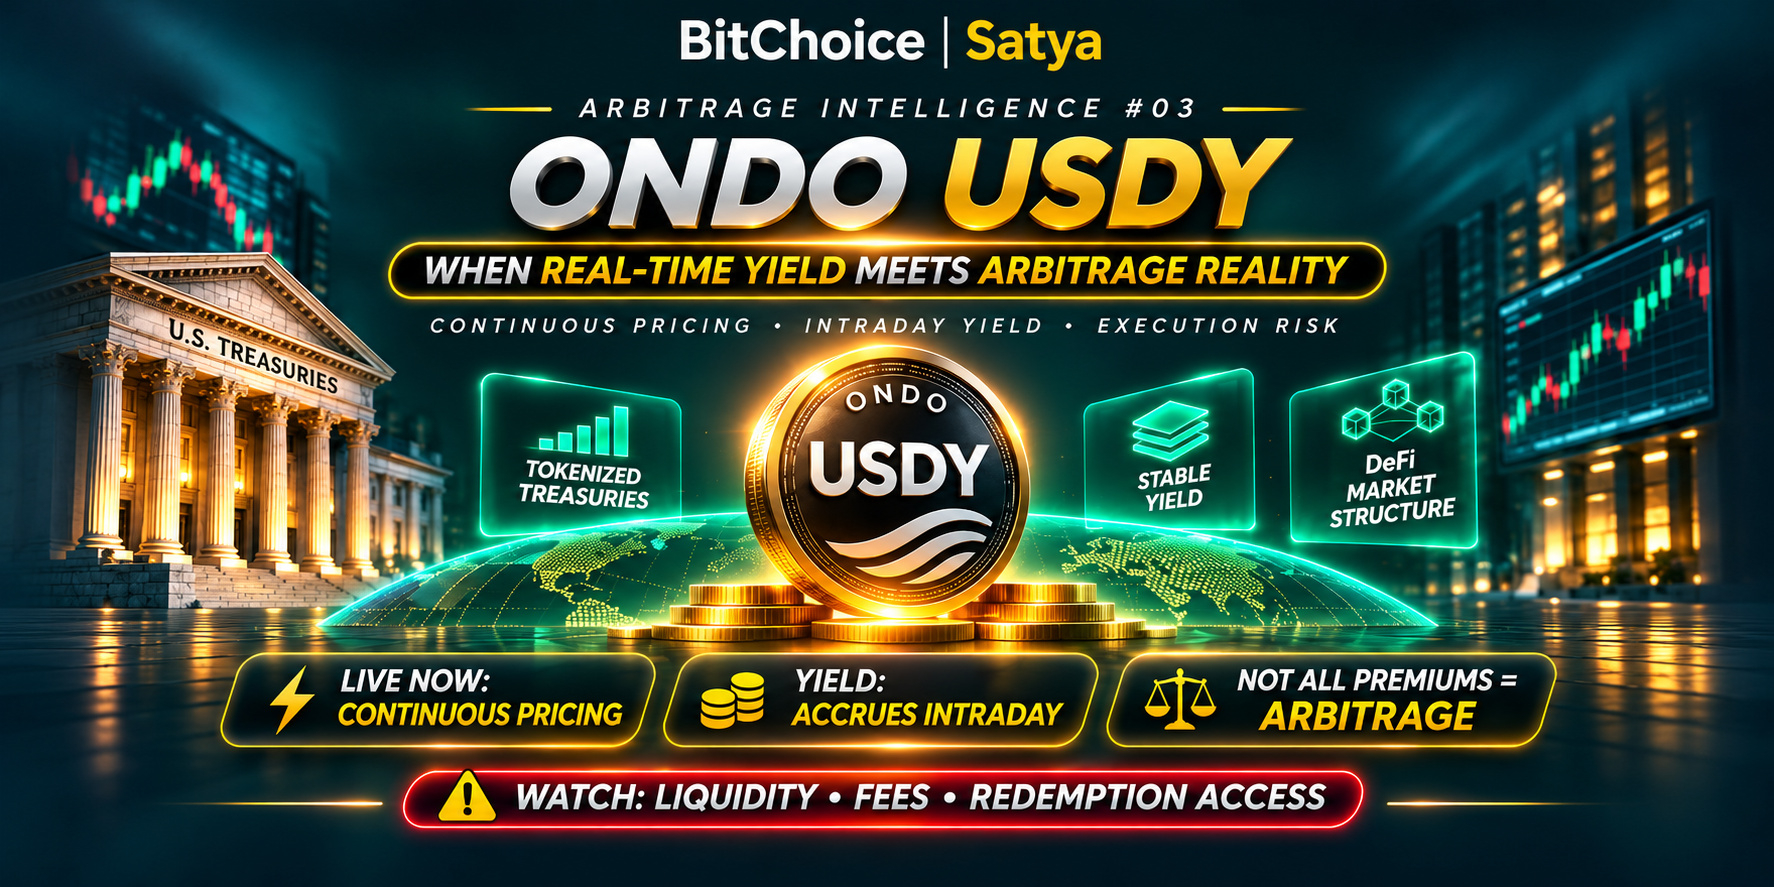
🚨 ARBITRAGE INTELLIGENCE #03 | ONDO USDY: WHEN REAL-TIME YIELD MEETS ARBITRAGE Tokenized U.S. Treasuries are becoming more dynamic — but does faster pricing create better arbitrage opportunities? On November 3, Ondo Finance introduced continuous pricing for USDY, its yield-bearing token backed by short-term U.S. Treasuries and bank deposits. ⚡ WHAT CHANGED? • USDY's reference price now updates continuously. • Yield accrues every second, including weekends. • Even short holding periods can capture proportional yield. • Eligible non-U.S. holders can access 24/7 minting and redemption, subject to operational restrictions. 🔍 THE ARBITRAGE QUESTION Suppose USDY trades at a premium on one venue and closer to its reference price elsewhere. Is the difference immediately profitable? Not necessarily. A quoted spread is NOT an executable spread. Before treating that difference as an opportunity, traders must evaluate: 1️⃣ Order-book depth and slippage. 2️⃣ Trading, transfer and network fees. 3️⃣ Deposit and withdrawal availability. 4️⃣ Minting/redemption eligibility and settlement delays. 5️⃣ Network compatibility and actual execution prices. 💡 THE BIGGER PICTURE Continuous pricing may improve valuation accuracy and reduce some timing-related inefficiencies. But it doesn't eliminate fragmented liquidity, market premiums or operational risks. Our conclusion: real arbitrage depends on the complete execution route — not the headline price difference. Can tokenized Treasury markets eventually become as efficient as traditional money markets? BitChoice | Satya — Arbitrage Intelligence #03 Source: Ondo Finance, November 3, 2026. #RWA #OndoFinance #Tokenization #DeFi #CryptoArbitrage $USDT $USDC
🚨 ARBITRAGE INTELLIGENCE #03 | ONDO USDY: WHEN REAL-TIME YIELD MEETS ARBITRAGE

Tokenized U.S. Treasuries are becoming more dynamic — but does faster pricing create better arbitrage opportunities?
On November 3, Ondo Finance introduced continuous pricing for USDY, its yield-bearing token backed by short-term U.S. Treasuries and bank deposits.

⚡ WHAT CHANGED?

• USDY's reference price now updates continuously.
• Yield accrues every second, including weekends.
• Even short holding periods can capture proportional yield.
• Eligible non-U.S. holders can access 24/7 minting and redemption, subject to operational restrictions.

🔍 THE ARBITRAGE QUESTION

Suppose USDY trades at a premium on one venue and closer to its reference price elsewhere.
Is the difference immediately profitable?
Not necessarily.
A quoted spread is NOT an executable spread.
Before treating that difference as an opportunity, traders must evaluate:

1️⃣ Order-book depth and slippage.
2️⃣ Trading, transfer and network fees.
3️⃣ Deposit and withdrawal availability.
4️⃣ Minting/redemption eligibility and settlement delays.
5️⃣ Network compatibility and actual execution prices.
💡 THE BIGGER PICTURE

Continuous pricing may improve valuation accuracy and reduce some timing-related inefficiencies.
But it doesn't eliminate fragmented liquidity, market premiums or operational risks.

Our conclusion: real arbitrage depends on the complete execution route — not the headline price difference.
Can tokenized Treasury markets eventually become as efficient as traditional money markets?

BitChoice | Satya — Arbitrage Intelligence #03
Source: Ondo Finance, November 3, 2026.
#RWA #OndoFinance #Tokenization #DeFi #CryptoArbitrage $USDT $USDC
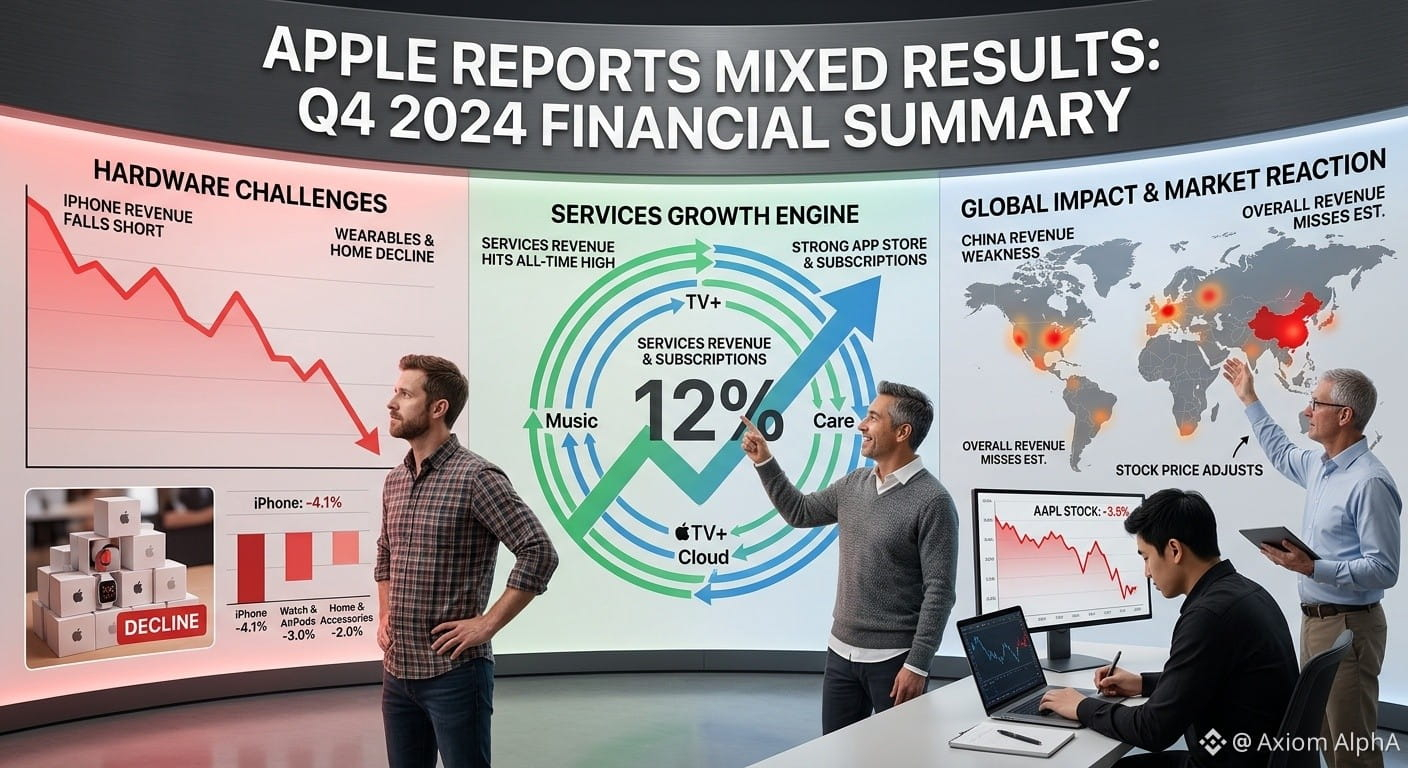
#applereportsmixedresults Apple Reports Mixed Results: Services Hit Record High as Hardware Faces Headwinds Apple reported a complex mix of financial performance in its latest quarterly results, highlighting structural divergence across its revenue streams. While total revenue reached $94.9 billion—up 6% year-over-year—driven by a standout Services division that surged 12% to an all-time record of $25 billion, key hardware categories experienced noticeable friction. The tech giant faced lower-than-expected sales growth across its Wearables, Home, and Accessories segment, alongside ongoing competitive pressures and currency headwinds in Greater China. Net income was also impacted by a non-recurring tax ruling charge in Europe, creating a mixed reaction across global markets. Despite hardware challenges, robust subscription growth and expanding gross margins near 46.2% underscore Apple's evolving pivot toward a high-margin ecosystem model. As broader equity markets digest the divergent report, crypto market participants are closely following risk appetite trends across liquidity-sensitive digital assets. Market Flash Alert: Tech Stocks vs. Tokenized Assets (AAPL & AAPLB) As equity markets digest recent corporate earnings, traditional Apple Inc. (AAPL) stock and its crypto-native counterpart Apple Tokenized Stock (AAPLB) are trading in tight correlation near key resistance levels around $338 – $345. The divergence between traditional equity market hours and 24/7 on-chain trading continues to create strategic arbitrage opportunities for cross-market traders. $AAPL & $AAPLB : Key Entry Zones: Accumulation Dip: $330.00 – $335.00 (Retest of key daily support line) Breakout Confirmation: Daily/Weekly close above $350.00 Target Levels: TP 1: $355.00 – $360.00 TP 2: $375.00 TP 3 (Macro Target): $400.00+ Risk Management (Stop-Loss): Invalidation: Daily close below $320.00 Risk/Reward Ratio: ~1:4 setup at current consolidation bounds. {spot}(AAPLBUSDT) {future}(AAPLUSDT) #AAPL #AAPLB #stockmarket #CryptoArbitrage
#applereportsmixedresults
Apple Reports Mixed Results: Services Hit Record High as Hardware Faces Headwinds
Apple reported a complex mix of financial performance in its latest quarterly results, highlighting structural divergence across its revenue streams. While total revenue reached $94.9 billion—up 6% year-over-year—driven by a standout Services division that surged 12% to an all-time record of $25 billion, key hardware categories experienced noticeable friction.
The tech giant faced lower-than-expected sales growth across its Wearables, Home, and Accessories segment, alongside ongoing competitive pressures and currency headwinds in Greater China. Net income was also impacted by a non-recurring tax ruling charge in Europe, creating a mixed reaction across global markets. Despite hardware challenges, robust subscription growth and expanding gross margins near 46.2% underscore Apple's evolving pivot toward a high-margin ecosystem model.
As broader equity markets digest the divergent report, crypto market participants are closely following risk appetite trends across liquidity-sensitive digital assets.
Market Flash Alert: Tech Stocks vs. Tokenized Assets (AAPL & AAPLB)
As equity markets digest recent corporate earnings, traditional Apple Inc. (AAPL) stock and its crypto-native counterpart Apple Tokenized Stock (AAPLB) are trading in tight correlation near key resistance levels around $338 – $345. The divergence between traditional equity market hours and 24/7 on-chain trading continues to create strategic arbitrage opportunities for cross-market traders.
$AAPL & $AAPLB :
Key Entry Zones:
Accumulation Dip: $330.00 – $335.00 (Retest of key daily support line)
Breakout Confirmation: Daily/Weekly close above $350.00
Target Levels:
TP 1: $355.00 – $360.00
TP 2: $375.00
TP 3 (Macro Target): $400.00+
Risk Management (Stop-Loss):
Invalidation: Daily close below $320.00
Risk/Reward Ratio: ~1:4 setup at current consolidation bounds.
#AAPL #AAPLB #stockmarket #CryptoArbitrage
Article
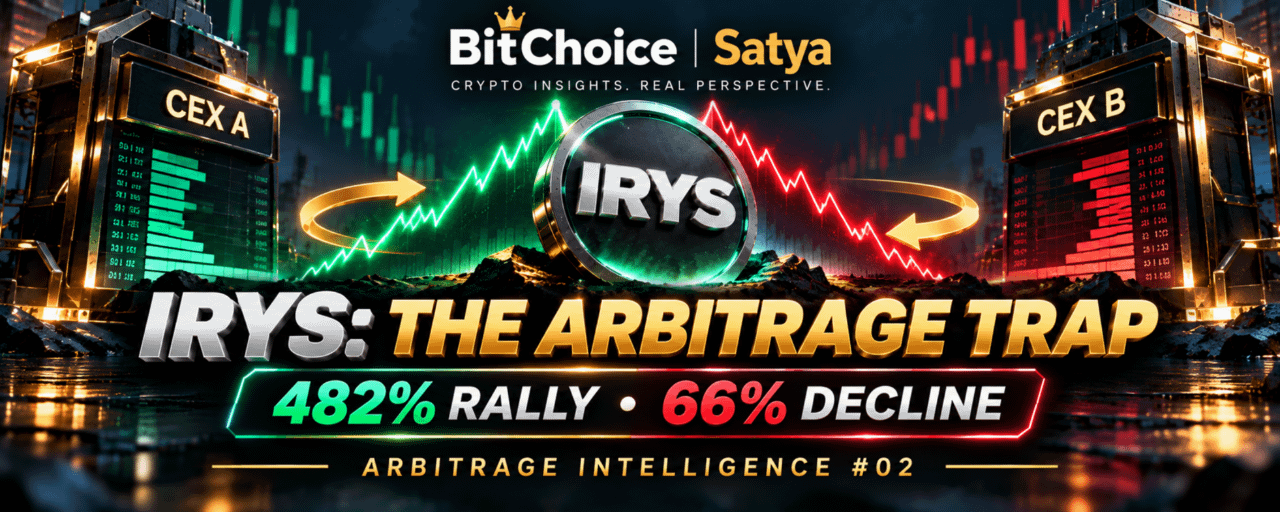
IRYS: The 482% Pump, 66% Collapse and the Hidden Risks of Crypto ArbitrageArbitrage Intelligence #02 | BitChoice | Satya October 31, 2026 | Market Structure & Risk Analysis When a Price Explosion Becomes an Arbitrage Trap A token surges almost 500% in three days. Different trading venues display sharply different prices. Arbitrage scanners light up with double-digit spreads. For many traders, it looks like the perfect opportunity. But the IRYS episode illustrates a critical distinction: A visible price difference is not the same as a realizable trading profit. During extreme volatility, traders can identify a genuine market inefficiency and still lose money because of leverage, liquidity, execution delays or exchange-specific restrictions. Let's examine what happened. 1. IRYS: From a 482% Rally to a 66% Decline According to Santiment's October 29 anomaly report, IRYS experienced an extraordinary price move: October 20: approximately $0.0130October 23: approximately $0.0756Three-day increase: +482%October 27: approximately $0.0260Decline from October 23: approximately 66% The rally occurred without a clearly identified major news catalyst in Santiment's analysis. An equally interesting development emerged in the blockchain data. Daily active token-transfer addresses increased sharply and peaked on October 25 — two days after the price peak. By then, IRYS had already lost substantial value. This timing suggests that on-chain participation and market prices were not moving in perfect synchronization. However, increased token-transfer activity does not automatically prove wash trading, coordinated manipulation or artificial demand. 2. Why Different Exchanges Can Display Different Prices During ordinary market conditions, arbitrage activity tends to reduce substantial differences between comparable markets. During a violent price move, several mechanisms can disrupt that process. Fragmented liquidity Each exchange has its own order book, participants and available depth. A quoted price may represent only a tiny amount of executable liquidity. Uneven market reactions Trading activity, liquidations and market-maker inventory adjustments can occur at different speeds across platforms. Different instruments Spot tokens and perpetual futures are not interchangeable products. A perpetual contract can trade at a premium or discount to spot because of leverage, funding and market positioning. Transfer constraints Spot arbitrage may depend on withdrawing an asset from one platform and depositing it on another. A suspended transfer, incompatible network or incorrect token contract can make that route impossible. The result: an apparent 10%, 15% or even larger spread may persist precisely because the apparent opportunity is difficult or impossible to capture. 3. The Two Very Different Arbitrage Models There is an important difference between transferring spot assets and maintaining offsetting derivative positions. Spot-to-Spot Arbitrage The theoretical route is: Buy on Exchange A → Transfer → Sell on Exchange B But the actual economics depend on order-book depth, fees, withdrawal availability, deposit crediting, blockchain confirmations and price changes during transfer. A high quoted spread does not guarantee that the selling price will remain available. Perpetual-to-Perpetual Spread Trading Another approach involves offsetting positions in comparable derivative contracts across different venues. Here, the trader is exposed to the difference between contract prices rather than simply the direction of the underlying token. But the strategy introduces additional risks: Separate margin requirementsDifferent liquidation pricesFunding-rate paymentsBasis divergenceExecution mismatchesExchange-specific risk controls A market-neutral idea is not automatically liquidation-neutral. One leg can be liquidated before the anticipated price convergence occurs. 4. What the IRYS Derivatives Data Reveals Historical data for Binance's IRYS perpetual market show a sharp change in positioning. The dollar value of open interest was approximately: October 24: $30.1 millionOctober 25: $14.7 millionOctober 27: $9.1 million This represents a substantial contraction in outstanding derivatives exposure. However, open interest measured in US dollars changes with both contract positions and the underlying market price. Therefore, the decline cannot be interpreted entirely as forced liquidations. Funding rates also moved considerably during the period, demonstrating how the cost of maintaining perpetual positions can vary under market stress. These observations support the picture of a highly unstable derivatives market, but do not establish that any specific arbitrage strategy was profitable. 5. Why Correctly Predicting Convergence Can Still Lose Money Imagine two comparable markets displaying significantly different contract prices. A trader expects the gap to narrow. Eventually, the prices do converge. Was the trade profitable? Not necessarily. Before convergence, the spread might widen much further. With leverage, that temporary movement can exhaust the margin supporting one position. Even without liquidation, funding charges, slippage and the cost of closing both legs may eliminate the expected return. That creates the fundamental danger of spread trading: Being right about the final direction of a spread is not the same as surviving the path to convergence. 6. A 15% Spread Is Not a 15% Return Consider a purely hypothetical example: Exchange A quotes a token at $1.00. Exchange B quotes the apparently equivalent asset at $1.15. The displayed price difference is 15%, measured against Exchange A's quoted price. But the actual opportunity depends on: Whether both quotes are executable at the required size.Whether the assets and contracts are economically equivalent.Whether trading and transfer costs are included.Whether deposits and withdrawals are available on compatible networks.Whether a hedge can be maintained without liquidation.Whether the spread remains available throughout execution. The final outcome could be a smaller profit, no profit or a loss. The headline percentage alone cannot answer the question. 7. Was the IRYS Move Manipulation? Extreme volatility naturally attracts allegations of manipulation. But a dramatic price chart, heavy token transfers and unusual derivatives activity are not sufficient evidence of coordinated wrongdoing. Establishing manipulation would require additional evidence about trading behavior, participant coordination and market activity. Santiment documented the price anomaly and delayed peak in token-transfer activity. Those observations are meaningful, but they do not prove who caused the rally or why. Likewise, reports of profitable arbitrage trades during the episode should be treated as unverified unless supported by detailed execution records. Market anomalies deserve investigation, not automatic accusations. 8. The Real Lessons for Arbitrage Traders The IRYS episode highlights five principles: Liquidity matters more than displayed price. A theoretical opportunity has little value without adequate executable depth. Equivalent tickers do not guarantee equivalent exposure. Contracts, settlement rules and funding structures must be understood. Leverage changes the survival equation. A spread can eventually converge after one position has already been liquidated. Exchange infrastructure is part of the risk. Deposits, withdrawals, order execution and margin controls can determine the outcome. A scanner detects discrepancies, not guaranteed profits. Its output is the beginning of analysis, not the conclusion. Final Perspective The most spectacular price gaps often appear during the least stable market conditions. IRYS demonstrates why an extraordinary rally can simultaneously create apparent arbitrage opportunities and severe execution risks. The real challenge is not merely identifying where two prices differ. It is understanding whether those differences represent comparable instruments, executable liquidity and a manageable path from entry to exit. Headline spread ≠ executable profit. Discussion: Which risk is most underestimated during violent crypto price moves — leverage, thin liquidity, funding or exchange restrictions? Sources: Santiment, The Weekly Anomaly Report: October 21–28 (published October 29, 2026); historical IRYS perpetual market data. Disclosure: Historical prices are sourced observations. Arbitrage spreads discussed here are conceptual unless otherwise specified. This article is for educational and informational purposes only and does not constitute financial or investment advice. #IRYS #CryptoArbitrage #MarketStructure #RiskManagement #Derivatives

IRYS: The 482% Pump, 66% Collapse and the Hidden Risks of Crypto Arbitrage

Arbitrage Intelligence #02 | BitChoice | Satya
October 31, 2026 | Market Structure & Risk Analysis
When a Price Explosion Becomes an Arbitrage Trap
A token surges almost 500% in three days. Different trading venues display sharply different prices. Arbitrage scanners light up with double-digit spreads.
For many traders, it looks like the perfect opportunity.
But the IRYS episode illustrates a critical distinction:
A visible price difference is not the same as a realizable trading profit.
During extreme volatility, traders can identify a genuine market inefficiency and still lose money because of leverage, liquidity, execution delays or exchange-specific restrictions.
Let's examine what happened.
1. IRYS: From a 482% Rally to a 66% Decline
According to Santiment's October 29 anomaly report, IRYS experienced an extraordinary price move:
October 20: approximately $0.0130October 23: approximately $0.0756Three-day increase: +482%October 27: approximately $0.0260Decline from October 23: approximately 66%
The rally occurred without a clearly identified major news catalyst in Santiment's analysis.
An equally interesting development emerged in the blockchain data.
Daily active token-transfer addresses increased sharply and peaked on October 25 — two days after the price peak.
By then, IRYS had already lost substantial value.
This timing suggests that on-chain participation and market prices were not moving in perfect synchronization.
However, increased token-transfer activity does not automatically prove wash trading, coordinated manipulation or artificial demand.
2. Why Different Exchanges Can Display Different Prices
During ordinary market conditions, arbitrage activity tends to reduce substantial differences between comparable markets.
During a violent price move, several mechanisms can disrupt that process.
Fragmented liquidity
Each exchange has its own order book, participants and available depth.
A quoted price may represent only a tiny amount of executable liquidity.
Uneven market reactions
Trading activity, liquidations and market-maker inventory adjustments can occur at different speeds across platforms.
Different instruments
Spot tokens and perpetual futures are not interchangeable products.
A perpetual contract can trade at a premium or discount to spot because of leverage, funding and market positioning.
Transfer constraints
Spot arbitrage may depend on withdrawing an asset from one platform and depositing it on another.
A suspended transfer, incompatible network or incorrect token contract can make that route impossible.
The result: an apparent 10%, 15% or even larger spread may persist precisely because the apparent opportunity is difficult or impossible to capture.
3. The Two Very Different Arbitrage Models
There is an important difference between transferring spot assets and maintaining offsetting derivative positions.
Spot-to-Spot Arbitrage
The theoretical route is:
Buy on Exchange A → Transfer → Sell on Exchange B
But the actual economics depend on order-book depth, fees, withdrawal availability, deposit crediting, blockchain confirmations and price changes during transfer.
A high quoted spread does not guarantee that the selling price will remain available.
Perpetual-to-Perpetual Spread Trading
Another approach involves offsetting positions in comparable derivative contracts across different venues.
Here, the trader is exposed to the difference between contract prices rather than simply the direction of the underlying token.
But the strategy introduces additional risks:
Separate margin requirementsDifferent liquidation pricesFunding-rate paymentsBasis divergenceExecution mismatchesExchange-specific risk controls
A market-neutral idea is not automatically liquidation-neutral.
One leg can be liquidated before the anticipated price convergence occurs.
4. What the IRYS Derivatives Data Reveals
Historical data for Binance's IRYS perpetual market show a sharp change in positioning.
The dollar value of open interest was approximately:
October 24: $30.1 millionOctober 25: $14.7 millionOctober 27: $9.1 million
This represents a substantial contraction in outstanding derivatives exposure.
However, open interest measured in US dollars changes with both contract positions and the underlying market price.
Therefore, the decline cannot be interpreted entirely as forced liquidations.
Funding rates also moved considerably during the period, demonstrating how the cost of maintaining perpetual positions can vary under market stress.
These observations support the picture of a highly unstable derivatives market, but do not establish that any specific arbitrage strategy was profitable.
5. Why Correctly Predicting Convergence Can Still Lose Money
Imagine two comparable markets displaying significantly different contract prices.
A trader expects the gap to narrow.
Eventually, the prices do converge.
Was the trade profitable?
Not necessarily.
Before convergence, the spread might widen much further.
With leverage, that temporary movement can exhaust the margin supporting one position.
Even without liquidation, funding charges, slippage and the cost of closing both legs may eliminate the expected return.
That creates the fundamental danger of spread trading:
Being right about the final direction of a spread is not the same as surviving the path to convergence.
6. A 15% Spread Is Not a 15% Return
Consider a purely hypothetical example:
Exchange A quotes a token at $1.00.
Exchange B quotes the apparently equivalent asset at $1.15.
The displayed price difference is 15%, measured against Exchange A's quoted price.
But the actual opportunity depends on:
Whether both quotes are executable at the required size.Whether the assets and contracts are economically equivalent.Whether trading and transfer costs are included.Whether deposits and withdrawals are available on compatible networks.Whether a hedge can be maintained without liquidation.Whether the spread remains available throughout execution.
The final outcome could be a smaller profit, no profit or a loss.
The headline percentage alone cannot answer the question.
7. Was the IRYS Move Manipulation?
Extreme volatility naturally attracts allegations of manipulation.
But a dramatic price chart, heavy token transfers and unusual derivatives activity are not sufficient evidence of coordinated wrongdoing.
Establishing manipulation would require additional evidence about trading behavior, participant coordination and market activity.
Santiment documented the price anomaly and delayed peak in token-transfer activity. Those observations are meaningful, but they do not prove who caused the rally or why.
Likewise, reports of profitable arbitrage trades during the episode should be treated as unverified unless supported by detailed execution records.
Market anomalies deserve investigation, not automatic accusations.
8. The Real Lessons for Arbitrage Traders
The IRYS episode highlights five principles:
Liquidity matters more than displayed price.
A theoretical opportunity has little value without adequate executable depth.
Equivalent tickers do not guarantee equivalent exposure.
Contracts, settlement rules and funding structures must be understood.
Leverage changes the survival equation.
A spread can eventually converge after one position has already been liquidated.
Exchange infrastructure is part of the risk.
Deposits, withdrawals, order execution and margin controls can determine the outcome.
A scanner detects discrepancies, not guaranteed profits.
Its output is the beginning of analysis, not the conclusion.
Final Perspective
The most spectacular price gaps often appear during the least stable market conditions.
IRYS demonstrates why an extraordinary rally can simultaneously create apparent arbitrage opportunities and severe execution risks.
The real challenge is not merely identifying where two prices differ.
It is understanding whether those differences represent comparable instruments, executable liquidity and a manageable path from entry to exit.
Headline spread ≠ executable profit.
Discussion: Which risk is most underestimated during violent crypto price moves — leverage, thin liquidity, funding or exchange restrictions?
Sources: Santiment, The Weekly Anomaly Report: October 21–28 (published October 29, 2026); historical IRYS perpetual market data.
Disclosure: Historical prices are sourced observations. Arbitrage spreads discussed here are conceptual unless otherwise specified. This article is for educational and informational purposes only and does not constitute financial or investment advice.
#IRYS #CryptoArbitrage #MarketStructure #RiskManagement #Derivatives

Log in to explore more content
Join global crypto users on Binance Square
⚡️ Get latest and useful information about crypto.
💬 Trusted by the world’s largest crypto exchange.
👍 Discover real insights from verified creators.
Email / Phone number