

#28
28
18,600 views
208 Discussing
Hot
Latest

·
--
$AVA is looking interesting. It’s up 0.89% over 15m—not a huge move, but OI jumped +2.15% over 15m and +1.44% over 1h, with volume at 2.02x and a taker buy/sell ratio of 1.32. New leveraged longs are entering, so this isn’t the kind of hollow pump you get from short covering.
The OI anomaly percentile is 83.1%, ranking #28 across the pool. It’s persisted for several consecutive periods, and depth confirmation is also coming through. 24h trading volume is just over 60M, so liquidity isn’t especially deep. If this setup accelerates, slippage and liquidations could both be amplified.
Don’t chase the move. Wait for a pullback and see whether the bulls can hold their ground. If they can’t, a lot of people will get caught out.
$AVA is looking interesting. It’s up 0.89% over 15m—not a huge move, but OI jumped +2.15% over 15m and +1.44% over 1h, with volume at 2.02x and a taker buy/sell ratio of 1.32. New leveraged longs are entering, so this isn’t the kind of hollow pump you get from short covering.
The OI anomaly percentile is 83.1%, ranking #28 across the pool. It’s persisted for several consecutive periods, and depth confirmation is also coming through. 24h trading volume is just over 60M, so liquidity isn’t especially deep. If this setup accelerates, slippage and liquidations could both be amplified.
Don’t chase the move. Wait for a pullback and see whether the bulls can hold their ground. If they can’t, a lot of people will get caught out.
The OI anomaly percentile is 83.1%, ranking #28 across the pool. It’s persisted for several consecutive periods, and depth confirmation is also coming through. 24h trading volume is just over 60M, so liquidity isn’t especially deep. If this setup accelerates, slippage and liquidations could both be amplified.
Don’t chase the move. Wait for a pullback and see whether the bulls can hold their ground. If they can’t, a lot of people will get caught out.
1

·
--
$ARIA This rally has some substance. It jumped 5.65% in 15m, with volume reaching 3.84 times normal levels. The closing price broke above the highs of the last 20 5m candles, and the taker buy/sell ratio was 1.38, showing a clear buying bias.
More interestingly, OI rose along with the price. 1h futures notional was up 5.78%, at the 85.5th percentile for anomalies. Rising prices and rising open interest are typical of new leveraged longs entering—not just a spot-driven move. Its notional change ranked #28 across the full pool, so depth confirmation is in place.
24h trading volume is only a little over 21M, so the pool isn’t very large. When a volume spike like this kicks in, the move can accelerate—but pullbacks can be just as fast. The key is whether the breakout can hold above the top of this range. If you’re chasing it, keep a close eye on volume.
$ARIA This rally has some substance. It jumped 5.65% in 15m, with volume reaching 3.84 times normal levels. The closing price broke above the highs of the last 20 5m candles, and the taker buy/sell ratio was 1.38, showing a clear buying bias.
More interestingly, OI rose along with the price. 1h futures notional was up 5.78%, at the 85.5th percentile for anomalies. Rising prices and rising open interest are typical of new leveraged longs entering—not just a spot-driven move. Its notional change ranked #28 across the full pool, so depth confirmation is in place.
24h trading volume is only a little over 21M, so the pool isn’t very large. When a volume spike like this kicks in, the move can accelerate—but pullbacks can be just as fast. The key is whether the breakout can hold above the top of this range. If you’re chasing it, keep a close eye on volume.
More interestingly, OI rose along with the price. 1h futures notional was up 5.78%, at the 85.5th percentile for anomalies. Rising prices and rising open interest are typical of new leveraged longs entering—not just a spot-driven move. Its notional change ranked #28 across the full pool, so depth confirmation is in place.
24h trading volume is only a little over 21M, so the pool isn’t very large. When a volume spike like this kicks in, the move can accelerate—but pullbacks can be just as fast. The key is whether the breakout can hold above the top of this range. If you’re chasing it, keep a close eye on volume.
2

·
--
$BR is up 2.96% over this 15m period, while OI is down 2.87%, with notional change at -214K. Price is rising as open interest falls, which clearly suggests short covering. The taker buy/sell ratio is 1.32 and the volume delta is 13.7%, indicating buyers have been slightly more aggressive. OI anomaly percentile is 66.5%, ranking #28 across the pool—not extreme, but the notional change ranks #19, suggesting some positions are being covered in the short term. 1h OI notional is still +610K, so it’s not a full exit; rather, some shorts were closed over this 15m period, giving price a push. Be cautious about chasing this move—wait for the covering to finish and see whether price can hold.
$BR is up 2.96% over this 15m period, while OI is down 2.87%, with notional change at -214K. Price is rising as open interest falls, which clearly suggests short covering. The taker buy/sell ratio is 1.32 and the volume delta is 13.7%, indicating buyers have been slightly more aggressive. OI anomaly percentile is 66.5%, ranking #28 across the pool—not extreme, but the notional change ranks #19, suggesting some positions are being covered in the short term. 1h OI notional is still +610K, so it’s not a full exit; rather, some shorts were closed over this 15m period, giving price a push. Be cautious about chasing this move—wait for the covering to finish and see whether price can hold.
6

·
--
$ERA fell 2.44% in this 15-minute move, with volume surging to 2.11x and a Z-score of 2.90—not a typical pullback. Open interest tells an even clearer story: 15-minute futures OI fell 1.80%, shedding 284K in notional value; over 1 hour, it’s already down 3.73%, with 507K in notional value gone—a classic long unwind. The aggressive trade flow delta is -13.6%, and the buy/sell ratio is 0.76, with selling pressure in control. The anomaly percentile is 91.9%, ranking #20 across the entire pool, while notional change ranks #28, so the data is indeed near the top. 24-hour trading volume is still 120M, and depth looks fine—it’s just longs trimming positions, so don’t rush to buy the dip.
$ERA fell 2.44% in this 15-minute move, with volume surging to 2.11x and a Z-score of 2.90—not a typical pullback. Open interest tells an even clearer story: 15-minute futures OI fell 1.80%, shedding 284K in notional value; over 1 hour, it’s already down 3.73%, with 507K in notional value gone—a classic long unwind. The aggressive trade flow delta is -13.6%, and the buy/sell ratio is 0.76, with selling pressure in control. The anomaly percentile is 91.9%, ranking #20 across the entire pool, while notional change ranks #28, so the data is indeed near the top. 24-hour trading volume is still 120M, and depth looks fine—it’s just longs trimming positions, so don’t rush to buy the dip.
4

·
--
【Alpha New Listings Monitoring Report】2026-10-17 18:00
■ Sample: Alpha Top 30 (BSC 30 + Solana 30)
■ New this period: 13 (BSC 13 / SOL 0)
■ Filter criteria: Top 3 by liquidity; excludes tokens reported within the past 24 hours
━━━━━━━━━━━━━━━
▸ $SIREN [BSC]
Liquidity 3.299 million
Alpha rank #6 (new)
1h inflow list No
Smart money signal None
Overall score 2/6 · Low attention
▸ $AIOT [BSC]
Liquidity 1.508 million
Alpha rank #28 (new)
1h inflow list No
Smart money signal None
Overall score 1/6 · Low attention
▸ $HANA [BSC]
Liquidity 859,000
Alpha rank #27 (new)
1h inflow list No
Smart money signal None
Overall score 0/6 · Low attention
━━━━━━━━━━━━━━━
This report is automatically generated and does not constitute investment advice.
#$SIREN #$AIOT #$HANA
【Alpha New Listings Monitoring Report】2026-10-17 18:00
■ Sample: Alpha Top 30 (BSC 30 + Solana 30)
■ New this period: 13 (BSC 13 / SOL 0)
■ Filter criteria: Top 3 by liquidity; excludes tokens reported within the past 24 hours
━━━━━━━━━━━━━━━
▸ $SIREN [BSC]
Liquidity 3.299 million
Alpha rank #6 (new)
1h inflow list No
Smart money signal None
Overall score 2/6 · Low attention
▸ $AIOT [BSC]
Liquidity 1.508 million
Alpha rank #28 (new)
1h inflow list No
Smart money signal None
Overall score 1/6 · Low attention
▸ $HANA [BSC]
Liquidity 859,000
Alpha rank #27 (new)
1h inflow list No
Smart money signal None
Overall score 0/6 · Low attention
━━━━━━━━━━━━━━━
This report is automatically generated and does not constitute investment advice.
#$SIREN #$AIOT #$HANA
■ Sample: Alpha Top 30 (BSC 30 + Solana 30)
■ New this period: 13 (BSC 13 / SOL 0)
■ Filter criteria: Top 3 by liquidity; excludes tokens reported within the past 24 hours
━━━━━━━━━━━━━━━
▸ $SIREN [BSC]
Liquidity 3.299 million
Alpha rank #6 (new)
1h inflow list No
Smart money signal None
Overall score 2/6 · Low attention
▸ $AIOT [BSC]
Liquidity 1.508 million
Alpha rank #28 (new)
1h inflow list No
Smart money signal None
Overall score 1/6 · Low attention
▸ $HANA [BSC]
Liquidity 859,000
Alpha rank #27 (new)
1h inflow list No
Smart money signal None
Overall score 0/6 · Low attention
━━━━━━━━━━━━━━━
This report is automatically generated and does not constitute investment advice.
#$SIREN #$AIOT #$HANA
698
·
--
This 15m move on $DUSK is interesting: a 2.33% gain isn’t extreme, but volume surged to 3.48x, with a Z-score of 3.33—this isn’t just random noise. OI rose 1.9% over 15m and 2.04% over 1h. Price and open interest moving together points more to new leveraged longs entering than shorts closing out. The close also broke above the highs of the last 20 5m candles. The active buy/sell delta was 14%, and the buy/sell ratio was 1.33, showing a clear directional bias. Its OI anomaly percentile is 95.2%, ranking #5 across the whole pool, while notional change ranks #28. 24h trading volume is still under 20M—the pool is shallow, so moves like this can get amplified. Keep that in mind if you’re chasing it.
This 15m move on $DUSK is interesting: a 2.33% gain isn’t extreme, but volume surged to 3.48x, with a Z-score of 3.33—this isn’t just random noise. OI rose 1.9% over 15m and 2.04% over 1h. Price and open interest moving together points more to new leveraged longs entering than shorts closing out. The close also broke above the highs of the last 20 5m candles. The active buy/sell delta was 14%, and the buy/sell ratio was 1.33, showing a clear directional bias. Its OI anomaly percentile is 95.2%, ranking #5 across the whole pool, while notional change ranks #28. 24h trading volume is still under 20M—the pool is shallow, so moves like this can get amplified. Keep that in mind if you’re chasing it.

·
--
$SUI is up 41% over the past month, but has now fallen back to $1.00. It’s still 81% below its all-time high. That’s the most glaring contradiction in the entire dataset—it looks like a recovery, but also like a dead cat being held down. The late-September surge on $2B in trading volume stalled at $1.26. Since then, volume has dwindled to around $500 million, and the price has slipped from its high. This usually means someone is buying at lower levels, but nobody is willing to keep burning money above $1.10.
So right now, there are two opposing paths.
First: $0.74 to $1.26 forms a range, and $SUI is currently just testing the lower end. The psychological support at the $1.00 level is still holding. If this scenario plays out, we should see a volume-backed rebound, with daily closes holding steadily above $1.10. That would mean today’s bearish candle was just a shakeout.
Second: $1.26 at the end of September was a false breakout used to distribute, and the price is now starting a slow bleed lower. If this scenario plays out, $1.00 won’t hold, volume will shrink further to below $400 million, and a break below $0.95 would mean looking for support further down.
The confirmation signals for both interpretations are there in plain sight—no guessing required. What really concerns me is that the narrative around $SUI was still strong last year, but its market-cap ranking, #28 , has now reached an awkward spot. To move higher, it will need either fresh liquidity or a lift from the broader market’s beta; relying on its own alpha alone is no longer enough. Would you rather wait for volume to prove that $1.10 is a new base, or believe that until $0.95 breaks, this is just normal movement within the range?
$SUI is up 41% over the past month, but has now fallen back to $1.00. It’s still 81% below its all-time high. That’s the most glaring contradiction in the entire dataset—it looks like a recovery, but also like a dead cat being held down. The late-September surge on $2B in trading volume stalled at $1.26. Since then, volume has dwindled to around $500 million, and the price has slipped from its high. This usually means someone is buying at lower levels, but nobody is willing to keep burning money above $1.10.
So right now, there are two opposing paths.
First: $0.74 to $1.26 forms a range, and $SUI is currently just testing the lower end. The psychological support at the $1.00 level is still holding. If this scenario plays out, we should see a volume-backed rebound, with daily closes holding steadily above $1.10. That would mean today’s bearish candle was just a shakeout.
Second: $1.26 at the end of September was a false breakout used to distribute, and the price is now starting a slow bleed lower. If this scenario plays out, $1.00 won’t hold, volume will shrink further to below $400 million, and a break below $0.95 would mean looking for support further down.
The confirmation signals for both interpretations are there in plain sight—no guessing required. What really concerns me is that the narrative around $SUI was still strong last year, but its market-cap ranking, #28 , has now reached an awkward spot. To move higher, it will need either fresh liquidity or a lift from the broader market’s beta; relying on its own alpha alone is no longer enough. Would you rather wait for volume to prove that $1.10 is a new base, or believe that until $0.95 breaks, this is just normal movement within the range?
So right now, there are two opposing paths.
First: $0.74 to $1.26 forms a range, and $SUI is currently just testing the lower end. The psychological support at the $1.00 level is still holding. If this scenario plays out, we should see a volume-backed rebound, with daily closes holding steadily above $1.10. That would mean today’s bearish candle was just a shakeout.
Second: $1.26 at the end of September was a false breakout used to distribute, and the price is now starting a slow bleed lower. If this scenario plays out, $1.00 won’t hold, volume will shrink further to below $400 million, and a break below $0.95 would mean looking for support further down.
The confirmation signals for both interpretations are there in plain sight—no guessing required. What really concerns me is that the narrative around $SUI was still strong last year, but its market-cap ranking, #28 , has now reached an awkward spot. To move higher, it will need either fresh liquidity or a lift from the broader market’s beta; relying on its own alpha alone is no longer enough. Would you rather wait for volume to prove that $1.10 is a new base, or believe that until $0.95 breaks, this is just normal movement within the range?
34

🟢 Master #28 added to the LONG $LDO: 5 → 11 USDT on our side (0.2 % of the account), average entry 0.4169 → 0.416278.
The add came in drawdown. Our rule: adds are copied only inside legs we already hold; we never join a master's existing losing position from outside.
We run this on a Binance copy-trading account. The group where the trades land first: https://app.binance.com/uni-qr/DpuA7yYD
🟢 Master #28 added to the LONG $LDO : 5 → 11 USDT on our side (0.2 % of the account), average entry 0.4169 → 0.416278.
The add came in drawdown. Our rule: adds are copied only inside legs we already hold; we never join a master's existing losing position from outside.
We run this on a Binance copy-trading account. The group where the trades land first: https://app.binance.com/uni-qr/DpuA7yYD
The add came in drawdown. Our rule: adds are copied only inside legs we already hold; we never join a master's existing losing position from outside.
We run this on a Binance copy-trading account. The group where the trades land first: https://app.binance.com/uni-qr/DpuA7yYD
1
·
--
$XLM 15m There's a bit of movement here.
Price is up 0.54%, volume has jumped to 1.90x, the taker buy/sell imbalance is 28.2%, and the buy/sell ratio is 1.79—buyers are clearly pushing. The closing price broke above the high of the last 20 5m candles, marking a minor range breakout.
More interestingly, OI is up 0.07% over 15m and 0.13% over 1h. The notional change isn't large, but alongside the price rise, the structure looks more like new leveraged longs entering than shorts getting squeezed. The anomaly percentile is 74%, ranking #28 across the pool; the notional change ranks #38, putting it relatively near the top of the pack.
The 24h trading volume is 38.86M, and depth looks fine. This kind of relative breakout on the 15m timeframe usually draws some follow-through, but it can also get sharply reversed—the breakout is only above the boundary of a 5m range, after all, so it's not a major one.
First, let's see whether price can hold above this level. If it can't, it's a false move; if it can, there may be more to come.
$XLM 15m There's a bit of movement here.
Price is up 0.54%, volume has jumped to 1.90x, the taker buy/sell imbalance is 28.2%, and the buy/sell ratio is 1.79—buyers are clearly pushing. The closing price broke above the high of the last 20 5m candles, marking a minor range breakout.
More interestingly, OI is up 0.07% over 15m and 0.13% over 1h. The notional change isn't large, but alongside the price rise, the structure looks more like new leveraged longs entering than shorts getting squeezed. The anomaly percentile is 74%, ranking #28 across the pool; the notional change ranks #38, putting it relatively near the top of the pack.
The 24h trading volume is 38.86M, and depth looks fine. This kind of relative breakout on the 15m timeframe usually draws some follow-through, but it can also get sharply reversed—the breakout is only above the boundary of a 5m range, after all, so it's not a major one.
First, let's see whether price can hold above this level. If it can't, it's a false move; if it can, there may be more to come.
Price is up 0.54%, volume has jumped to 1.90x, the taker buy/sell imbalance is 28.2%, and the buy/sell ratio is 1.79—buyers are clearly pushing. The closing price broke above the high of the last 20 5m candles, marking a minor range breakout.
More interestingly, OI is up 0.07% over 15m and 0.13% over 1h. The notional change isn't large, but alongside the price rise, the structure looks more like new leveraged longs entering than shorts getting squeezed. The anomaly percentile is 74%, ranking #28 across the pool; the notional change ranks #38, putting it relatively near the top of the pack.
The 24h trading volume is 38.86M, and depth looks fine. This kind of relative breakout on the 15m timeframe usually draws some follow-through, but it can also get sharply reversed—the breakout is only above the boundary of a 5m range, after all, so it's not a major one.
First, let's see whether price can hold above this level. If it can't, it's a false move; if it can, there may be more to come.
6
·
--
$BTW This 15m chart looks interesting.
Price surged 5.45%, volume was 1.63x, and the Z-score was 3.30, breaking straight above the upper range of the last 20 5m candles. The aggressive trade imbalance was 14.9%, and the buy/sell ratio was 1.35—buyers are pushing.
On the OI side, 15m contracts were up 0.17% and notional was up 3.10%; 1h contracts were down 1.02%, while notional was up 5.48%. There’s some divergence—up in the short term, down over the longer term. But it ranked #28 in anomalies across the entire pool and #5 in notional change, with an anomaly percentile of 82.1%. The move has continued for several consecutive periods, so this isn’t an isolated spike.
24h trading volume is 258.85M, and market depth is sufficient.
Structurally, this looks more like new leveraged longs entering than short covering. The breakout has just happened, so first watch whether price can hold above the top of this range.
$BTW This 15m chart looks interesting.
Price surged 5.45%, volume was 1.63x, and the Z-score was 3.30, breaking straight above the upper range of the last 20 5m candles. The aggressive trade imbalance was 14.9%, and the buy/sell ratio was 1.35—buyers are pushing.
On the OI side, 15m contracts were up 0.17% and notional was up 3.10%; 1h contracts were down 1.02%, while notional was up 5.48%. There’s some divergence—up in the short term, down over the longer term. But it ranked #28 in anomalies across the entire pool and #5 in notional change, with an anomaly percentile of 82.1%. The move has continued for several consecutive periods, so this isn’t an isolated spike.
24h trading volume is 258.85M, and market depth is sufficient.
Structurally, this looks more like new leveraged longs entering than short covering. The breakout has just happened, so first watch whether price can hold above the top of this range.
Price surged 5.45%, volume was 1.63x, and the Z-score was 3.30, breaking straight above the upper range of the last 20 5m candles. The aggressive trade imbalance was 14.9%, and the buy/sell ratio was 1.35—buyers are pushing.
On the OI side, 15m contracts were up 0.17% and notional was up 3.10%; 1h contracts were down 1.02%, while notional was up 5.48%. There’s some divergence—up in the short term, down over the longer term. But it ranked #28 in anomalies across the entire pool and #5 in notional change, with an anomaly percentile of 82.1%. The move has continued for several consecutive periods, so this isn’t an isolated spike.
24h trading volume is 258.85M, and market depth is sufficient.
Structurally, this looks more like new leveraged longs entering than short covering. The breakout has just happened, so first watch whether price can hold above the top of this range.
1

·
--
We’ve spotted a surge in the market’s heavyweights. Ethereum (ETH) +2.8% pushes us closer to the top, while Zcash (ZEC) climbs +3.5% to stay in the top‑10. Sui (SUI) rockets +4.1% and holds a solid #28 rank, proving its momentum is far from over. Investors are watching rising liquidity as volume spikes reinforce these gains 🚀.
Our mid‑range watchlist shows streamoors (STREAM) up +5.2% at rank #750, and Quantus (QTC) gaining +4.7% near #637. IGNITION (IGNITION) surprises with +6.0% despite a #871 position, indicating hidden potential for early adopters. Such activity often hints at upcoming protocol upgrades that could further boost sentiment. These moves keep our portfolio diversified and ready for the next swing 🔥.
We also keep an eye on Pearl (PRL), which jumped +7.3% to rank #101, signaling renewed interest in privacy‑focused assets. The community’s feedback on governance proposals also suggests a bullish outlook for privacy coins, reinforcing our confidence. Combining these trends, our strategy balances top‑tier stability with high‑growth opportunities, ensuring we capture both steady gains and breakout rallies 🌟.
$BAT, $STRK, $AGT
We’ve spotted a surge in the market’s heavyweights. Ethereum (ETH) +2.8% pushes us closer to the top, while Zcash (ZEC) climbs +3.5% to stay in the top‑10. Sui (SUI) rockets +4.1% and holds a solid #28 rank, proving its momentum is far from over. Investors are watching rising liquidity as volume spikes reinforce these gains 🚀.
Our mid‑range watchlist shows streamoors (STREAM) up +5.2% at rank #750, and Quantus (QTC) gaining +4.7% near #637. IGNITION (IGNITION) surprises with +6.0% despite a #871 position, indicating hidden potential for early adopters. Such activity often hints at upcoming protocol upgrades that could further boost sentiment. These moves keep our portfolio diversified and ready for the next swing 🔥.
We also keep an eye on Pearl (PRL), which jumped +7.3% to rank #101, signaling renewed interest in privacy‑focused assets. The community’s feedback on governance proposals also suggests a bullish outlook for privacy coins, reinforcing our confidence. Combining these trends, our strategy balances top‑tier stability with high‑growth opportunities, ensuring we capture both steady gains and breakout rallies 🌟.
$BAT , $STRK , $AGT
Our mid‑range watchlist shows streamoors (STREAM) up +5.2% at rank #750, and Quantus (QTC) gaining +4.7% near #637. IGNITION (IGNITION) surprises with +6.0% despite a #871 position, indicating hidden potential for early adopters. Such activity often hints at upcoming protocol upgrades that could further boost sentiment. These moves keep our portfolio diversified and ready for the next swing 🔥.
We also keep an eye on Pearl (PRL), which jumped +7.3% to rank #101, signaling renewed interest in privacy‑focused assets. The community’s feedback on governance proposals also suggests a bullish outlook for privacy coins, reinforcing our confidence. Combining these trends, our strategy balances top‑tier stability with high‑growth opportunities, ensuring we capture both steady gains and breakout rallies 🌟.
$BAT , $STRK , $AGT
418
·
--
XMR’s move up was pretty decisive: it jumped 1% in 15 minutes, with volume reaching 2.61x, and closed above the highs of the last 20 five-minute candles. What’s interesting is that OI fell rather than rose. One-hour contract positions shrank slightly, while notional change was positive—a classic short-covering setup. It wasn’t a rush of new longs; shorts just couldn’t hold on and closed out.
The taker flow imbalance was 45%, and the buy/sell ratio was 2.64, so buyers were clearly pushing. It ranked #16 for anomalies across the whole pool, with notional change at #28, and depth confirmation also passed. 24-hour trading volume was $39M—not especially huge, but the pulse itself looks pretty solid.
Oh, is the privacy sector moving again? Either way, be careful chasing this kind of setup higher; a rally driven by short covering can easily lose steam once the shorts are done covering. Watch to see whether it can hold above the top of this range.
XMR’s move up was pretty decisive: it jumped 1% in 15 minutes, with volume reaching 2.61x, and closed above the highs of the last 20 five-minute candles. What’s interesting is that OI fell rather than rose. One-hour contract positions shrank slightly, while notional change was positive—a classic short-covering setup. It wasn’t a rush of new longs; shorts just couldn’t hold on and closed out.
The taker flow imbalance was 45%, and the buy/sell ratio was 2.64, so buyers were clearly pushing. It ranked #16 for anomalies across the whole pool, with notional change at #28, and depth confirmation also passed. 24-hour trading volume was $39M—not especially huge, but the pulse itself looks pretty solid.
Oh, is the privacy sector moving again? Either way, be careful chasing this kind of setup higher; a rally driven by short covering can easily lose steam once the shorts are done covering. Watch to see whether it can hold above the top of this range.
The taker flow imbalance was 45%, and the buy/sell ratio was 2.64, so buyers were clearly pushing. It ranked #16 for anomalies across the whole pool, with notional change at #28, and depth confirmation also passed. 24-hour trading volume was $39M—not especially huge, but the pulse itself looks pretty solid.
Oh, is the privacy sector moving again? Either way, be careful chasing this kind of setup higher; a rally driven by short covering can easily lose steam once the shorts are done covering. Watch to see whether it can hold above the top of this range.
15
·
--
$INJ just broke below the lower end of the past 20 five-minute candles. 15-minute volume is more than 2x, and the aggressive buy/sell ratio is 0.77, clearly showing seller dominance.
The OI data is more interesting: 1h notional change is -221K, and 15m is -182K. Price is falling, and OI is falling too. This doesn't look like new shorts entering to drive the price down; it's more like longs deleveraging and stop-losses being triggered. It ranks #39 across the entire pool for anomalies and #28 for notional change, putting it among the more notable movers tonight. But the anomaly percentile is only 57.7%, suggesting this is a localized event, not a market-wide confluence.
With this kind of setup, I'm generally reluctant to chase shorts directly. When a drop is driven by position contraction, short-side fuel actually dwindles as the price falls. I'd wait for some low-volume sideways action and then see if there's any support. With 127M in 24-hour trading volume, liquidity is sufficient, so there's no need to worry too much about slippage.
$INJ just broke below the lower end of the past 20 five-minute candles. 15-minute volume is more than 2x, and the aggressive buy/sell ratio is 0.77, clearly showing seller dominance.
The OI data is more interesting: 1h notional change is -221K, and 15m is -182K. Price is falling, and OI is falling too. This doesn't look like new shorts entering to drive the price down; it's more like longs deleveraging and stop-losses being triggered. It ranks #39 across the entire pool for anomalies and #28 for notional change, putting it among the more notable movers tonight. But the anomaly percentile is only 57.7%, suggesting this is a localized event, not a market-wide confluence.
With this kind of setup, I'm generally reluctant to chase shorts directly. When a drop is driven by position contraction, short-side fuel actually dwindles as the price falls. I'd wait for some low-volume sideways action and then see if there's any support. With 127M in 24-hour trading volume, liquidity is sufficient, so there's no need to worry too much about slippage.
The OI data is more interesting: 1h notional change is -221K, and 15m is -182K. Price is falling, and OI is falling too. This doesn't look like new shorts entering to drive the price down; it's more like longs deleveraging and stop-losses being triggered. It ranks #39 across the entire pool for anomalies and #28 for notional change, putting it among the more notable movers tonight. But the anomaly percentile is only 57.7%, suggesting this is a localized event, not a market-wide confluence.
With this kind of setup, I'm generally reluctant to chase shorts directly. When a drop is driven by position contraction, short-side fuel actually dwindles as the price falls. I'd wait for some low-volume sideways action and then see if there's any support. With 127M in 24-hour trading volume, liquidity is sufficient, so there's no need to worry too much about slippage.
3
·
--
$STRK is showing a bit of movement.
It just climbed 1.06% in 15m, with volume at 1.49x. It doesn't look especially strong, but the key point is that the closing price broke above the highs of the past 20 5m candles. Once it gets above a level like this, short-term longs may start getting restless.
More interestingly, OI is rising in tandem: +0.31% over 15m and +0.40% over 1h. The nominal changes aren't large, but the direction is consistent. The aggressive trade imbalance is 24.7%, and the buy/sell ratio is 1.66, showing a clear bias. This doesn't look like mere short covering; it looks more like new longs are adding leverage.
The anomaly percentile is 60.5%, ranking #28 across the entire pool for anomalies and #17 for nominal change. It's not among the most explosive, but ranking in the top 30 across the pool suggests this isn't STRK acting alone—capital is moving across the pool.
24h trading volume is 250 million U, with sufficient depth.
My take: the breakout is real, but the move is still small; this 15m candle is just an appetizer. Two things to watch next: first, whether it can hold above the top of the range without pulling back; second, if OI continues rising along with price, this move may be more than just an intraday spike. On the other hand, if the price stalls while OI keeps rising, be careful—someone may be placing sell orders up there, waiting to distribute.
For now, just keep an eye on it. No need to rush in.
$STRK is showing a bit of movement.
It just climbed 1.06% in 15m, with volume at 1.49x. It doesn't look especially strong, but the key point is that the closing price broke above the highs of the past 20 5m candles. Once it gets above a level like this, short-term longs may start getting restless.
More interestingly, OI is rising in tandem: +0.31% over 15m and +0.40% over 1h. The nominal changes aren't large, but the direction is consistent. The aggressive trade imbalance is 24.7%, and the buy/sell ratio is 1.66, showing a clear bias. This doesn't look like mere short covering; it looks more like new longs are adding leverage.
The anomaly percentile is 60.5%, ranking #28 across the entire pool for anomalies and #17 for nominal change. It's not among the most explosive, but ranking in the top 30 across the pool suggests this isn't STRK acting alone—capital is moving across the pool.
24h trading volume is 250 million U, with sufficient depth.
My take: the breakout is real, but the move is still small; this 15m candle is just an appetizer. Two things to watch next: first, whether it can hold above the top of the range without pulling back; second, if OI continues rising along with price, this move may be more than just an intraday spike. On the other hand, if the price stalls while OI keeps rising, be careful—someone may be placing sell orders up there, waiting to distribute.
For now, just keep an eye on it. No need to rush in.
It just climbed 1.06% in 15m, with volume at 1.49x. It doesn't look especially strong, but the key point is that the closing price broke above the highs of the past 20 5m candles. Once it gets above a level like this, short-term longs may start getting restless.
More interestingly, OI is rising in tandem: +0.31% over 15m and +0.40% over 1h. The nominal changes aren't large, but the direction is consistent. The aggressive trade imbalance is 24.7%, and the buy/sell ratio is 1.66, showing a clear bias. This doesn't look like mere short covering; it looks more like new longs are adding leverage.
The anomaly percentile is 60.5%, ranking #28 across the entire pool for anomalies and #17 for nominal change. It's not among the most explosive, but ranking in the top 30 across the pool suggests this isn't STRK acting alone—capital is moving across the pool.
24h trading volume is 250 million U, with sufficient depth.
My take: the breakout is real, but the move is still small; this 15m candle is just an appetizer. Two things to watch next: first, whether it can hold above the top of the range without pulling back; second, if OI continues rising along with price, this move may be more than just an intraday spike. On the other hand, if the price stalls while OI keeps rising, be careful—someone may be placing sell orders up there, waiting to distribute.
For now, just keep an eye on it. No need to rush in.
4
·
--
$CC This drop is pretty interesting.
Price broke below the lower end of the recent 20-bar 5m range, and 15m volume surged to 6.48x—but OI is falling.
15m OI is down 0.11%, 1h OI is down 0.35%, and notional value has dropped by a little over $200k. This isn't new shorts piling in to drive the price down; longs are getting flushed out, either through stop-losses or by actively reducing positions. You can tell from the funding rate still being in a high percentile range recently.
Aggressive trade imbalance is -11.7%, and the buy/sell ratio is 0.79. Selling pressure is there, but this looks more like a chain reaction of deleveraging. The anomaly percentile is 91%, ranking #28 across the entire pool, so the data does point to an unusual event.
Let's see if it can hold this level.
$CC This drop is pretty interesting.
Price broke below the lower end of the recent 20-bar 5m range, and 15m volume surged to 6.48x—but OI is falling.
15m OI is down 0.11%, 1h OI is down 0.35%, and notional value has dropped by a little over $200k. This isn't new shorts piling in to drive the price down; longs are getting flushed out, either through stop-losses or by actively reducing positions. You can tell from the funding rate still being in a high percentile range recently.
Aggressive trade imbalance is -11.7%, and the buy/sell ratio is 0.79. Selling pressure is there, but this looks more like a chain reaction of deleveraging. The anomaly percentile is 91%, ranking #28 across the entire pool, so the data does point to an unusual event.
Let's see if it can hold this level.
Price broke below the lower end of the recent 20-bar 5m range, and 15m volume surged to 6.48x—but OI is falling.
15m OI is down 0.11%, 1h OI is down 0.35%, and notional value has dropped by a little over $200k. This isn't new shorts piling in to drive the price down; longs are getting flushed out, either through stop-losses or by actively reducing positions. You can tell from the funding rate still being in a high percentile range recently.
Aggressive trade imbalance is -11.7%, and the buy/sell ratio is 0.79. Selling pressure is there, but this looks more like a chain reaction of deleveraging. The anomaly percentile is 91%, ranking #28 across the entire pool, so the data does point to an unusual event.
Let's see if it can hold this level.
4

·
--
$BLUAI This move is getting interesting.
It’s up 2.32% on the 15m, with volume at 1.55x—not explosive, but OI has been rising for several consecutive periods: +0.24% on the 15m and +0.30% on the 1h, with nominal gains piling up to 140K+. Price up, OI up—that’s a classic leveraged long entry structure, not a short squeeze-driven pump.
The taker buy/sell delta is 26%, and the buy/sell ratio is 1.70, so buyers are clearly sweeping the asks. It also just closed a 5m candle above the upper end of the past 20 or so candles’ range.
The OI anomaly percentile is 93.8%, ranking #28 across the whole pool. That’s pretty high, which means I’m not the only one watching this.
24h trading volume is 41M, and liquidity is sufficient. Next, we’ll see if it can hold above the range high. If it does, that could be the start of a new structure; if not, this may just be a brief fakeout to lure in longs. I’d prefer to wait for a 15m candle to close for confirmation.
Not a trading signal—just keeping a record of what the chart looks like.
$BLUAI This move is getting interesting.
It’s up 2.32% on the 15m, with volume at 1.55x—not explosive, but OI has been rising for several consecutive periods: +0.24% on the 15m and +0.30% on the 1h, with nominal gains piling up to 140K+. Price up, OI up—that’s a classic leveraged long entry structure, not a short squeeze-driven pump.
The taker buy/sell delta is 26%, and the buy/sell ratio is 1.70, so buyers are clearly sweeping the asks. It also just closed a 5m candle above the upper end of the past 20 or so candles’ range.
The OI anomaly percentile is 93.8%, ranking #28 across the whole pool. That’s pretty high, which means I’m not the only one watching this.
24h trading volume is 41M, and liquidity is sufficient. Next, we’ll see if it can hold above the range high. If it does, that could be the start of a new structure; if not, this may just be a brief fakeout to lure in longs. I’d prefer to wait for a 15m candle to close for confirmation.
Not a trading signal—just keeping a record of what the chart looks like.
It’s up 2.32% on the 15m, with volume at 1.55x—not explosive, but OI has been rising for several consecutive periods: +0.24% on the 15m and +0.30% on the 1h, with nominal gains piling up to 140K+. Price up, OI up—that’s a classic leveraged long entry structure, not a short squeeze-driven pump.
The taker buy/sell delta is 26%, and the buy/sell ratio is 1.70, so buyers are clearly sweeping the asks. It also just closed a 5m candle above the upper end of the past 20 or so candles’ range.
The OI anomaly percentile is 93.8%, ranking #28 across the whole pool. That’s pretty high, which means I’m not the only one watching this.
24h trading volume is 41M, and liquidity is sufficient. Next, we’ll see if it can hold above the range high. If it does, that could be the start of a new structure; if not, this may just be a brief fakeout to lure in longs. I’d prefer to wait for a 15m candle to close for confirmation.
Not a trading signal—just keeping a record of what the chart looks like.
2
🟢 Master #28 added to the LONG $ETHFI: 5 → 11 USDT on our side (0.2 % of the account), average entry 0.6769 → 0.67529.
The add came in drawdown. Our rule: adds are copied only inside legs we already hold; we never join a master's existing losing position from outside.
Same trades, same rules, in a Binance group for people who copy by API or trade them by hand: https://app.binance.com/uni-qr/DpuA7yYD
🟢 Master #28 added to the LONG $ETHFI : 5 → 11 USDT on our side (0.2 % of the account), average entry 0.6769 → 0.67529.
The add came in drawdown. Our rule: adds are copied only inside legs we already hold; we never join a master's existing losing position from outside.
Same trades, same rules, in a Binance group for people who copy by API or trade them by hand: https://app.binance.com/uni-qr/DpuA7yYD
The add came in drawdown. Our rule: adds are copied only inside legs we already hold; we never join a master's existing losing position from outside.
Same trades, same rules, in a Binance group for people who copy by API or trade them by hand: https://app.binance.com/uni-qr/DpuA7yYD
·
--
$CAP This 15m move is starting to look interesting.
Price dropped 1.35%, while volume surged to 2.8x. The Z-score is 3.85, and the close broke below the low of nearly 20 recent 5m candles. Most importantly, the aggressive trade delta is -27.7%, and the buy/sell ratio is 0.57. The selling pressure is real—not just a fake breakout that briefly pokes through and reverses.
Open interest is interesting here: notional changes are negative on both the 15m and 1h timeframes, but the number of contracts is rising. Price down + OI slightly up is a classic sign of leveraged shorts entering, not pure spot selling. The anomaly percentile is 78%, the pool ranks #28 in notional change, and depth has confirmed the move.
24h volume is 28.93M. Notional change ranks near the top for this pool, which suggests that capital is taking this direction seriously.
The question now is: is this the start of an accelerating short move, or another bear trap? The breakdown, volume surge, and aggressive selling are all there, so I’m inclined to give the move some credence for now. If price doesn’t quickly reclaim the level below, a retest of the 5m low could offer a short opportunity.
Don’t chase it—wait for a retest and confirmation. $CAP
$CAP This 15m move is starting to look interesting.
Price dropped 1.35%, while volume surged to 2.8x. The Z-score is 3.85, and the close broke below the low of nearly 20 recent 5m candles. Most importantly, the aggressive trade delta is -27.7%, and the buy/sell ratio is 0.57. The selling pressure is real—not just a fake breakout that briefly pokes through and reverses.
Open interest is interesting here: notional changes are negative on both the 15m and 1h timeframes, but the number of contracts is rising. Price down + OI slightly up is a classic sign of leveraged shorts entering, not pure spot selling. The anomaly percentile is 78%, the pool ranks #28 in notional change, and depth has confirmed the move.
24h volume is 28.93M. Notional change ranks near the top for this pool, which suggests that capital is taking this direction seriously.
The question now is: is this the start of an accelerating short move, or another bear trap? The breakdown, volume surge, and aggressive selling are all there, so I’m inclined to give the move some credence for now. If price doesn’t quickly reclaim the level below, a retest of the 5m low could offer a short opportunity.
Don’t chase it—wait for a retest and confirmation. $CAP
Price dropped 1.35%, while volume surged to 2.8x. The Z-score is 3.85, and the close broke below the low of nearly 20 recent 5m candles. Most importantly, the aggressive trade delta is -27.7%, and the buy/sell ratio is 0.57. The selling pressure is real—not just a fake breakout that briefly pokes through and reverses.
Open interest is interesting here: notional changes are negative on both the 15m and 1h timeframes, but the number of contracts is rising. Price down + OI slightly up is a classic sign of leveraged shorts entering, not pure spot selling. The anomaly percentile is 78%, the pool ranks #28 in notional change, and depth has confirmed the move.
24h volume is 28.93M. Notional change ranks near the top for this pool, which suggests that capital is taking this direction seriously.
The question now is: is this the start of an accelerating short move, or another bear trap? The breakdown, volume surge, and aggressive selling are all there, so I’m inclined to give the move some credence for now. If price doesn’t quickly reclaim the level below, a retest of the 5m low could offer a short opportunity.
Don’t chase it—wait for a retest and confirmation. $CAP
7
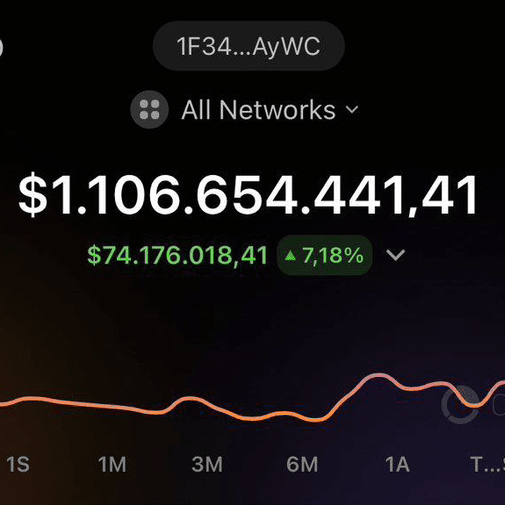
$OGN is up 27.05% over the past 24h, now at 0.03992 USDT.
• 24h range: 0.03107 – 0.0438 USDT, in the middle of its 24h range
• 24h volume: 25,235,405 USDT (#28 of 101 liquid USDT pairs)
• Outperforming BTC (-0.05%)
Outperforming BTC despite being in the middle of its range.
Data: Binance spot, 2026-10-13 12:00 UTC. Educational content, not financial advice.
$OGN is up 27.05% over the past 24h, now at 0.03992 USDT.
• 24h range: 0.03107 – 0.0438 USDT, in the middle of its 24h range
• 24h volume: 25,235,405 USDT (#28 of 101 liquid USDT pairs)
• Outperforming BTC (-0.05%)
Outperforming BTC despite being in the middle of its range.
Data: Binance spot, 2026-10-13 12:00 UTC. Educational content, not financial advice.
• 24h range: 0.03107 – 0.0438 USDT, in the middle of its 24h range
• 24h volume: 25,235,405 USDT (#28 of 101 liquid USDT pairs)
• Outperforming BTC (-0.05%)
Outperforming BTC despite being in the middle of its range.
Data: Binance spot, 2026-10-13 12:00 UTC. Educational content, not financial advice.
102
·
--
$CT saw a sharp sell-off, dropping 3.59% in 15m as volume climbed to 1.59x. The aggressive trade imbalance was -17.2%, and the buy/sell ratio was 0.71, clearly indicating that selling pressure was in control. The price broke below the lower bound of the range formed by the last 20 5m candles, triggering a relative breakout signal.
The key factor is OI: futures OI fell 1.22% over 15m and 1.17% over 1h, with notional exposure contracting in both cases. A falling price alongside declining OI looks more like longs deleveraging or exiting via stop-losses than a large influx of new shorts. Under this structure, short-term selling pressure may be coming from passive position reduction rather than active short-selling.
24h trading volume is still 100M, so liquidity isn't bad. However, the OI anomaly percentile has reached 90.5%, ranking #28 across the entire pool, which suggests that position changes at this level are indeed somewhat extreme. Next, watch whether the price can quickly reclaim the lower bound of the range. If it continues to drift down on shrinking volume, another round of liquidations may follow.
$CT saw a sharp sell-off, dropping 3.59% in 15m as volume climbed to 1.59x. The aggressive trade imbalance was -17.2%, and the buy/sell ratio was 0.71, clearly indicating that selling pressure was in control. The price broke below the lower bound of the range formed by the last 20 5m candles, triggering a relative breakout signal.
The key factor is OI: futures OI fell 1.22% over 15m and 1.17% over 1h, with notional exposure contracting in both cases. A falling price alongside declining OI looks more like longs deleveraging or exiting via stop-losses than a large influx of new shorts. Under this structure, short-term selling pressure may be coming from passive position reduction rather than active short-selling.
24h trading volume is still 100M, so liquidity isn't bad. However, the OI anomaly percentile has reached 90.5%, ranking #28 across the entire pool, which suggests that position changes at this level are indeed somewhat extreme. Next, watch whether the price can quickly reclaim the lower bound of the range. If it continues to drift down on shrinking volume, another round of liquidations may follow.
The key factor is OI: futures OI fell 1.22% over 15m and 1.17% over 1h, with notional exposure contracting in both cases. A falling price alongside declining OI looks more like longs deleveraging or exiting via stop-losses than a large influx of new shorts. Under this structure, short-term selling pressure may be coming from passive position reduction rather than active short-selling.
24h trading volume is still 100M, so liquidity isn't bad. However, the OI anomaly percentile has reached 90.5%, ranking #28 across the entire pool, which suggests that position changes at this level are indeed somewhat extreme. Next, watch whether the price can quickly reclaim the lower bound of the range. If it continues to drift down on shrinking volume, another round of liquidations may follow.
2
Log in to explore more content
Join global crypto users on Binance Square
⚡️ Get latest and useful information about crypto.
💬 Trusted by the world’s largest crypto exchange.
👍 Discover real insights from verified creators.
Email / Phone number
Trending Topics
1
#EarningsSeason
1.2M views
5,738 Discussing
2
#JPMorganPredictsBitcoinBestPerformingAssetOverNextDecade
9,166 views
47 Discussing
3
#InjectiveSignsMoUToMakeKRW1ExclusiveWonSettlementAsset
8,087 views
35 Discussing
4
#SwitzerlandApprovesFirstBitcoinETF
60,236 views
868 Discussing
5
#SkyAISellsAllSOLAndLaunchesCashTenderOffer
57,073 views
776 Discussing
6
#BankNegaraMalaysiaReportedlyLaunchesTokenizedBondPlatform
2,430 views
44 Discussing
7
#USBitcoinETFsRecord$527MInflows
11,034 views
89 Discussing
8
#ArbitrumProposalSeeks100MillionARBToBoostUSDGAdoption
3,051 views
55 Discussing
9
#KOSPIFallsMoreThan2%
98,207 views
1,239 Discussing
10
#ElicePlunges33%InKoreanIPODebut
43,094 views
863 Discussing