

#nvidia
nvidia
3.3M marta koʻrilgan
6,576 muhokama qilmoqda
Ommabop
Eng so‘nggi

Tarjimani ko‘rish
{stock_us}(SPCX.US)
{stock_us}(NVDA.US)
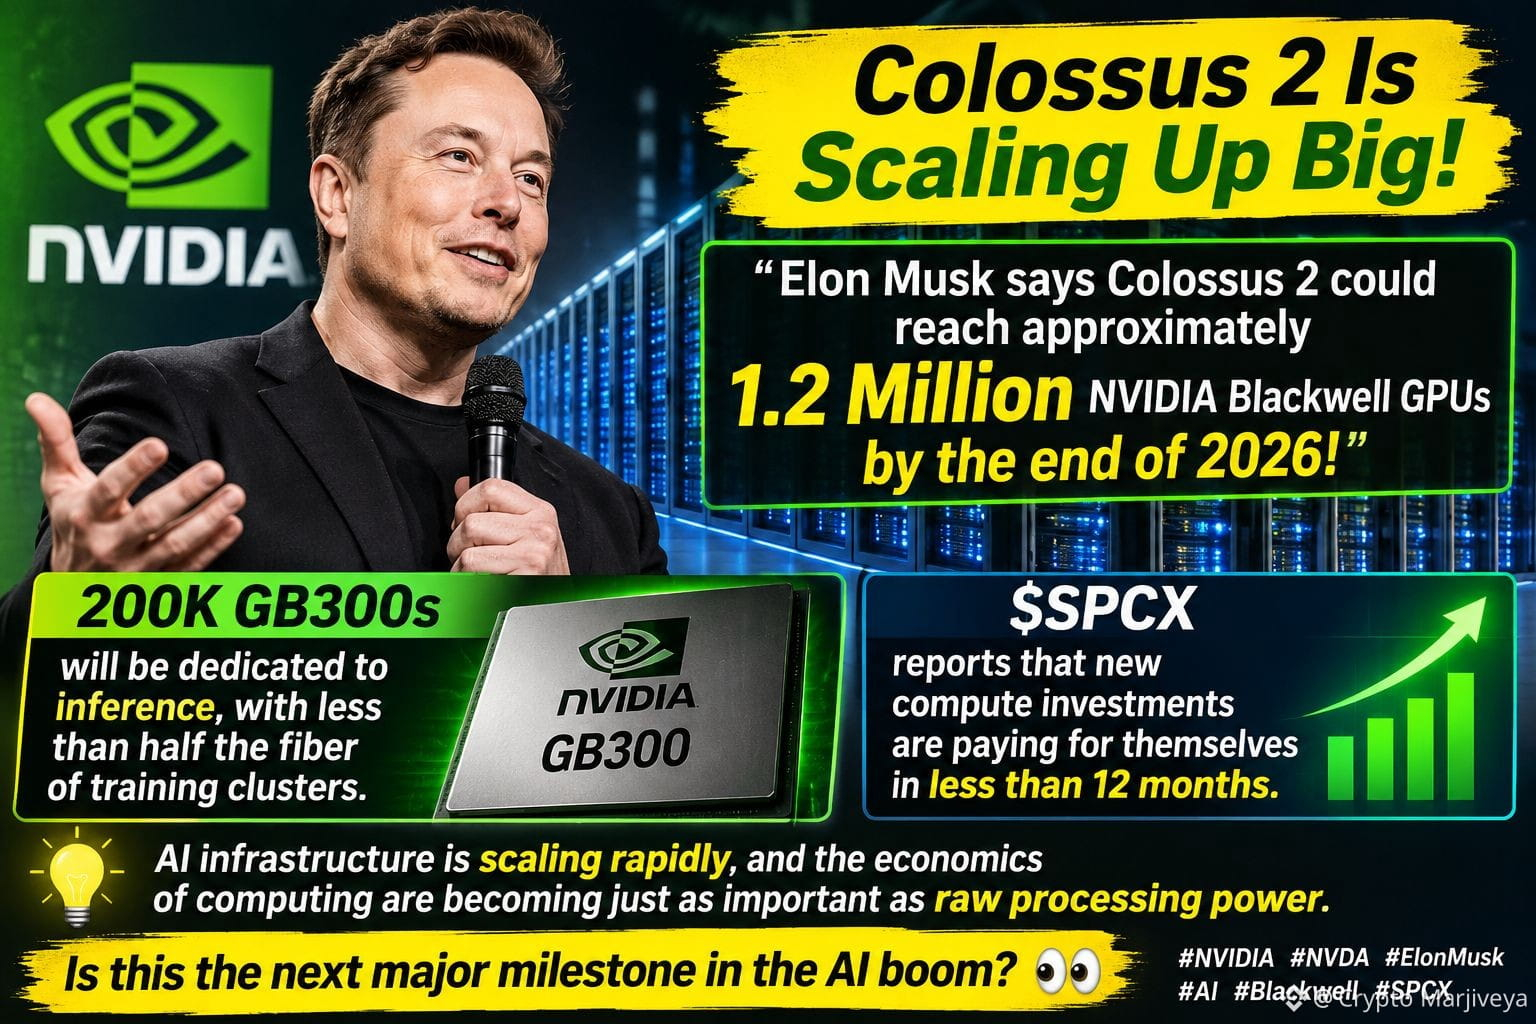
🚀 Colossus 2 Is Scaling Up Big!
Elon Musk says Colossus 2 could reach approximately 1.2 million $NVDA Blackwell GPUs by the end of 2026! 🔥
⚡ Around 200,000 GB300 GPUs will be dedicated to inference, with less than half the fiber infrastructure required by training clusters.
Meanwhile, $SPCX reports that new compute investments are paying for themselves in less than 12 months. 📈
💡 AI infrastructure is scaling rapidly, and the economics of computing are becoming just as important as raw processing power.
Is this the next major milestone in the AI boom? 👀
#NVIDIA #NVDA #ElonMusk #AI #SPCX
🚀 Colossus 2 Is Scaling Up Big!
Elon Musk says Colossus 2 could reach approximately 1.2 million $NVDA Blackwell GPUs by the end of 2026! 🔥
⚡ Around 200,000 GB300 GPUs will be dedicated to inference, with less than half the fiber infrastructure required by training clusters.
Meanwhile, $SPCX reports that new compute investments are paying for themselves in less than 12 months. 📈
💡 AI infrastructure is scaling rapidly, and the economics of computing are becoming just as important as raw processing power.
Is this the next major milestone in the AI boom? 👀
#NVIDIA #NVDA #ElonMusk #AI #SPCX
Elon Musk says Colossus 2 could reach approximately 1.2 million $NVDA Blackwell GPUs by the end of 2026! 🔥
⚡ Around 200,000 GB300 GPUs will be dedicated to inference, with less than half the fiber infrastructure required by training clusters.
Meanwhile, $SPCX reports that new compute investments are paying for themselves in less than 12 months. 📈
💡 AI infrastructure is scaling rapidly, and the economics of computing are becoming just as important as raw processing power.
Is this the next major milestone in the AI boom? 👀
#NVIDIA #NVDA #ElonMusk #AI #SPCX
594
·
--
Maqola
Tarjimani ko‘rish
NVDA Stock Analysis: Can NVIDIA Reclaim $210? 📈NVDA Stock Analysis: Can NVIDIA Reclaim $210?
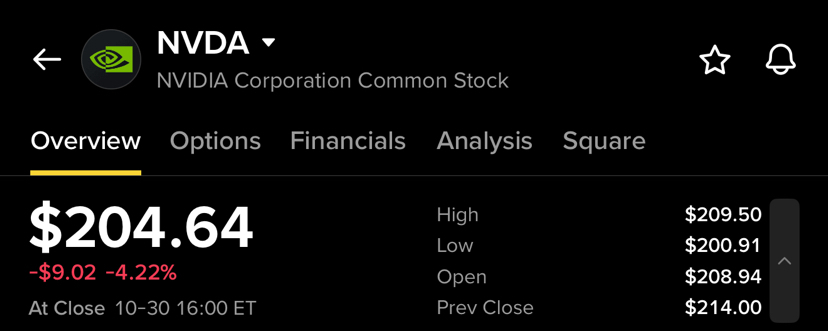
NVIDIA (NVDA) closed around $204.64, down approximately 4.22% in the latest session. The stock experienced a sharp sell-off, reaching an intraday low near $200.91, before buyers stepped in and pushed the price back above $204.
On the 30-minute chart, the recent price action shows an important short-term battle between buyers attempting to stabilize the stock and sellers maintaining pressure after the decline.
📉 Recent Price Action
NVDA opened around $208.94 and moved as high as approximately $209.06 before falling sharply.
The decline took the stock toward the $200.91 area, where buyers appeared to defend the psychological $200 level.
After touching that low, NVDA recovered toward the $205 area. This bounce is encouraging for short-term momentum, but the chart still needs confirmation before a stronger recovery can be considered.
🟢 Key Support Levels
The first major support is around $200–$201.
The recent low near $200.91 makes this zone particularly important. If buyers continue defending this area, it could become the foundation for another recovery attempt.
A decisive break below $200 could weaken the short-term structure and potentially bring additional selling pressure.
🔴 Key Resistance Levels
The first resistance zone is around $205–$206.
The chart’s MA(25) is near $205.25, making this an important short-term level.
Above that, $208–$209 is the next major resistance zone. This area coincides with the recent opening/high region.
A stronger recovery would require NVDA to reclaim $209–$210 and hold above it.
Further above, the $212 area is important because the MA(99) is around $212.12 on the displayed chart.
📊 Moving Averages
The 30-minute chart shows:
MA(7): ~$205.00
MA(25): ~$205.25
MA(99): ~$212.12
The short-term moving averages are currently clustered around $205, while the longer moving average remains considerably higher.
This means NVDA is attempting to stabilize, but the broader short-term chart structure has not fully turned bullish yet.
📈 Volume
The sell-off was accompanied by noticeable trading volume, while the subsequent rebound also showed increased activity.
This is an important area to watch. If another upward move occurs with stronger volume and price successfully breaks through $205–$209, it would provide better confirmation that buyers are returning.
On the other hand, weak volume during a bounce could indicate that the recovery is temporary.
🔎 Two Possible Scenarios
🟢 Bullish Scenario
If NVDA holds above $200–$201 and successfully reclaims $205–$206, buyers could attempt to push the price toward $208–$210.
A clean breakout above $210 could improve the short-term structure and put the $212 region into focus.
🔴 Bearish Scenario
If NVDA fails to hold the $200–$201 support zone, the recent recovery could lose momentum.
A decisive break below $200 would be a significant warning sign and could lead to further downside pressure.
🌐 Bigger Market Picture
The recent decline is also happening during a broader technology and semiconductor sell-off, with investors showing increased concern about the sustainability and cash requirements of the AI spending boom. (24/7 Wall St.)
At the same time, NVIDIA continues to be closely tied to the long-term AI infrastructure theme, so the stock remains highly sensitive to both AI-related developments and overall technology-market sentiment. (Simply Wall St)
🎯 Levels to Watch
Support: $200–$201
Resistance: $205–$206 → $208–$210 → ~$212
For now, the key question is whether NVDA can turn the recent bounce into a sustained recovery. Holding the $200 area and reclaiming $205–$210 would strengthen the bullish case, while losing $200 would make the chart more vulnerable to additional downside.
#NVIDIA #stocks #stockmarket #StockAnalysis #trading $NVDA
{future}(NVDAUSDT)
NVDA Stock Analysis: Can NVIDIA Reclaim $210? 📈
NVDA Stock Analysis: Can NVIDIA Reclaim $210?
NVIDIA (NVDA) closed around $204.64, down approximately 4.22% in the latest session. The stock experienced a sharp sell-off, reaching an intraday low near $200.91, before buyers stepped in and pushed the price back above $204.
On the 30-minute chart, the recent price action shows an important short-term battle between buyers attempting to stabilize the stock and sellers maintaining pressure after the decline.
📉 Recent Price Action
NVDA opened around $208.94 and moved as high as approximately $209.06 before falling sharply.
The decline took the stock toward the $200.91 area, where buyers appeared to defend the psychological $200 level.
After touching that low, NVDA recovered toward the $205 area. This bounce is encouraging for short-term momentum, but the chart still needs confirmation before a stronger recovery can be considered.
🟢 Key Support Levels
The first major support is around $200–$201.
The recent low near $200.91 makes this zone particularly important. If buyers continue defending this area, it could become the foundation for another recovery attempt.
A decisive break below $200 could weaken the short-term structure and potentially bring additional selling pressure.
🔴 Key Resistance Levels
The first resistance zone is around $205–$206.
The chart’s MA(25) is near $205.25, making this an important short-term level.
Above that, $208–$209 is the next major resistance zone. This area coincides with the recent opening/high region.
A stronger recovery would require NVDA to reclaim $209–$210 and hold above it.
Further above, the $212 area is important because the MA(99) is around $212.12 on the displayed chart.
📊 Moving Averages
The 30-minute chart shows:
MA(7): ~$205.00
MA(25): ~$205.25
MA(99): ~$212.12
The short-term moving averages are currently clustered around $205, while the longer moving average remains considerably higher.
This means NVDA is attempting to stabilize, but the broader short-term chart structure has not fully turned bullish yet.
📈 Volume
The sell-off was accompanied by noticeable trading volume, while the subsequent rebound also showed increased activity.
This is an important area to watch. If another upward move occurs with stronger volume and price successfully breaks through $205–$209, it would provide better confirmation that buyers are returning.
On the other hand, weak volume during a bounce could indicate that the recovery is temporary.
🔎 Two Possible Scenarios
🟢 Bullish Scenario
If NVDA holds above $200–$201 and successfully reclaims $205–$206, buyers could attempt to push the price toward $208–$210.
A clean breakout above $210 could improve the short-term structure and put the $212 region into focus.
🔴 Bearish Scenario
If NVDA fails to hold the $200–$201 support zone, the recent recovery could lose momentum.
A decisive break below $200 would be a significant warning sign and could lead to further downside pressure.
🌐 Bigger Market Picture
The recent decline is also happening during a broader technology and semiconductor sell-off, with investors showing increased concern about the sustainability and cash requirements of the AI spending boom. (24/7 Wall St.)
At the same time, NVIDIA continues to be closely tied to the long-term AI infrastructure theme, so the stock remains highly sensitive to both AI-related developments and overall technology-market sentiment. (Simply Wall St)
🎯 Levels to Watch
Support: $200–$201
Resistance: $205–$206 → $208–$210 → ~$212
For now, the key question is whether NVDA can turn the recent bounce into a sustained recovery. Holding the $200 area and reclaiming $205–$210 would strengthen the bullish case, while losing $200 would make the chart more vulnerable to additional downside.
#NVIDIA #stocks #stockmarket #StockAnalysis #trading $NVDA
NVIDIA (NVDA) closed around $204.64, down approximately 4.22% in the latest session. The stock experienced a sharp sell-off, reaching an intraday low near $200.91, before buyers stepped in and pushed the price back above $204.
On the 30-minute chart, the recent price action shows an important short-term battle between buyers attempting to stabilize the stock and sellers maintaining pressure after the decline.
📉 Recent Price Action
NVDA opened around $208.94 and moved as high as approximately $209.06 before falling sharply.
The decline took the stock toward the $200.91 area, where buyers appeared to defend the psychological $200 level.
After touching that low, NVDA recovered toward the $205 area. This bounce is encouraging for short-term momentum, but the chart still needs confirmation before a stronger recovery can be considered.
🟢 Key Support Levels
The first major support is around $200–$201.
The recent low near $200.91 makes this zone particularly important. If buyers continue defending this area, it could become the foundation for another recovery attempt.
A decisive break below $200 could weaken the short-term structure and potentially bring additional selling pressure.
🔴 Key Resistance Levels
The first resistance zone is around $205–$206.
The chart’s MA(25) is near $205.25, making this an important short-term level.
Above that, $208–$209 is the next major resistance zone. This area coincides with the recent opening/high region.
A stronger recovery would require NVDA to reclaim $209–$210 and hold above it.
Further above, the $212 area is important because the MA(99) is around $212.12 on the displayed chart.
📊 Moving Averages
The 30-minute chart shows:
MA(7): ~$205.00
MA(25): ~$205.25
MA(99): ~$212.12
The short-term moving averages are currently clustered around $205, while the longer moving average remains considerably higher.
This means NVDA is attempting to stabilize, but the broader short-term chart structure has not fully turned bullish yet.
📈 Volume
The sell-off was accompanied by noticeable trading volume, while the subsequent rebound also showed increased activity.
This is an important area to watch. If another upward move occurs with stronger volume and price successfully breaks through $205–$209, it would provide better confirmation that buyers are returning.
On the other hand, weak volume during a bounce could indicate that the recovery is temporary.
🔎 Two Possible Scenarios
🟢 Bullish Scenario
If NVDA holds above $200–$201 and successfully reclaims $205–$206, buyers could attempt to push the price toward $208–$210.
A clean breakout above $210 could improve the short-term structure and put the $212 region into focus.
🔴 Bearish Scenario
If NVDA fails to hold the $200–$201 support zone, the recent recovery could lose momentum.
A decisive break below $200 would be a significant warning sign and could lead to further downside pressure.
🌐 Bigger Market Picture
The recent decline is also happening during a broader technology and semiconductor sell-off, with investors showing increased concern about the sustainability and cash requirements of the AI spending boom. (24/7 Wall St.)
At the same time, NVIDIA continues to be closely tied to the long-term AI infrastructure theme, so the stock remains highly sensitive to both AI-related developments and overall technology-market sentiment. (Simply Wall St)
🎯 Levels to Watch
Support: $200–$201
Resistance: $205–$206 → $208–$210 → ~$212
For now, the key question is whether NVDA can turn the recent bounce into a sustained recovery. Holding the $200 area and reclaiming $205–$210 would strengthen the bullish case, while losing $200 would make the chart more vulnerable to additional downside.
#NVIDIA #stocks #stockmarket #StockAnalysis #trading $NVDA
213

🚀 $NVDA – O‘sish imkoniyati! 📈
🔥 Sun’iy intellekt rivoji NVIDIA aksiyalarini yanada ko‘tarishi mumkin!
🟢 Kirish: $201–$205
🎯 TP1: $215
🎯 TP2: $225
🚀 TP3: $240
🛑 SL: $195
💎 Narxning yuqoriga yorib chiqishi va o‘sish imkoniyatlarini kuzating!
{future}(NVDAUSDT)
#NVDA #NVIDIA #AI #Trading #BinanceSquare
🚀 $NVDA – O‘sish imkoniyati! 📈
🔥 Sun’iy intellekt rivoji NVIDIA aksiyalarini yanada ko‘tarishi mumkin!
🟢 Kirish: $201–$205
🎯 TP1: $215
🎯 TP2: $225
🚀 TP3: $240
🛑 SL: $195
💎 Narxning yuqoriga yorib chiqishi va o‘sish imkoniyatlarini kuzating!
#NVDA #NVIDIA #AI #Trading #BinanceSquare
🔥 Sun’iy intellekt rivoji NVIDIA aksiyalarini yanada ko‘tarishi mumkin!
🟢 Kirish: $201–$205
🎯 TP1: $215
🎯 TP2: $225
🚀 TP3: $240
🛑 SL: $195
💎 Narxning yuqoriga yorib chiqishi va o‘sish imkoniyatlarini kuzating!
#NVDA #NVIDIA #AI #Trading #BinanceSquare

3
105

·
--
Tarjimani ko‘rish
📊 NVIDIA (NVDA) : LES VENDEURS PRENNENT LA MAIN !
À la clôture du 30 octobre 2026, NVIDIA s'échangeait à 204,64 $, en baisse de 4,22 % sur la séance.
Le titre évolue dans un contexte de correction des valeurs technologiques, alimentée par les inquiétudes concernant le coût des investissements dans l'intelligence artificielle et leur rentabilité future.
📉 NIVEAUX À SURVEILLER :
• 200–201 $ : zone de soutien immédiate.
• 209 $ : première résistance à reconquérir.
🔎 SCÉNARIOS :
Une cassure confirmée sous 200 $ renforcerait le risque baissier. À l'inverse, une reprise durable au-dessus de 209 $ pourrait signaler un retour des acheteurs.
📌 MON AVIS : Malgré ses fondamentaux solides, NVIDIA n'est pas à l'abri des corrections. Je préfère attendre une confirmation du marché plutôt que d'anticiper un rebond
#NVIDIA #Trading #AnalyseTechnique #ShareWeekly
📊 NVIDIA (NVDA) : LES VENDEURS PRENNENT LA MAIN !
À la clôture du 30 octobre 2026, NVIDIA s'échangeait à 204,64 $, en baisse de 4,22 % sur la séance.
Le titre évolue dans un contexte de correction des valeurs technologiques, alimentée par les inquiétudes concernant le coût des investissements dans l'intelligence artificielle et leur rentabilité future.
📉 NIVEAUX À SURVEILLER :
• 200–201 $ : zone de soutien immédiate.
• 209 $ : première résistance à reconquérir.
🔎 SCÉNARIOS :
Une cassure confirmée sous 200 $ renforcerait le risque baissier. À l'inverse, une reprise durable au-dessus de 209 $ pourrait signaler un retour des acheteurs.
📌 MON AVIS : Malgré ses fondamentaux solides, NVIDIA n'est pas à l'abri des corrections. Je préfère attendre une confirmation du marché plutôt que d'anticiper un rebond
#NVIDIA #Trading #AnalyseTechnique #ShareWeekly
À la clôture du 30 octobre 2026, NVIDIA s'échangeait à 204,64 $, en baisse de 4,22 % sur la séance.
Le titre évolue dans un contexte de correction des valeurs technologiques, alimentée par les inquiétudes concernant le coût des investissements dans l'intelligence artificielle et leur rentabilité future.
📉 NIVEAUX À SURVEILLER :
• 200–201 $ : zone de soutien immédiate.
• 209 $ : première résistance à reconquérir.
🔎 SCÉNARIOS :
Une cassure confirmée sous 200 $ renforcerait le risque baissier. À l'inverse, une reprise durable au-dessus de 209 $ pourrait signaler un retour des acheteurs.
📌 MON AVIS : Malgré ses fondamentaux solides, NVIDIA n'est pas à l'abri des corrections. Je préfère attendre une confirmation du marché plutôt que d'anticiper un rebond
#NVIDIA #Trading #AnalyseTechnique #ShareWeekly
112

Tasdiqlangan
Tarjimani ko‘rish
The Persistent Question That’s Weighing on Nvidia’s Premium🤔
Nvidia is trading near $203, down 4.09%, as investors dig into whether hyperscaler custom chips threaten or simply complement its dominance. Amazon and Alphabet are scaling internal silicon, yet both still rely heavily on Nvidia GPUs for advanced AI workloads.
💡Now we can Accumulate fractions
{spot}(NVDABUSDT)
💡of NASDAQ listed stock - bStock
The stock has amplified the broader AI unwind, with Nvidia and Alphabet together shedding roughly $835 billion in market value. The core debate remains whether custom chips stay complementary or begin to erode incremental GPU demand. Upcoming results on data-center growth, backlog, and hyperscaler commentary will be critical in settling that question.
$NVDAB $GOOGLB $AMZNB #CoinVahini #AIChips #Nvidia #Semiconductors
The Persistent Question That’s Weighing on Nvidia’s Premium🤔
Nvidia is trading near $203, down 4.09%, as investors dig into whether hyperscaler custom chips threaten or simply complement its dominance. Amazon and Alphabet are scaling internal silicon, yet both still rely heavily on Nvidia GPUs for advanced AI workloads.
💡Now we can Accumulate fractions
💡of NASDAQ listed stock - bStock
The stock has amplified the broader AI unwind, with Nvidia and Alphabet together shedding roughly $835 billion in market value. The core debate remains whether custom chips stay complementary or begin to erode incremental GPU demand. Upcoming results on data-center growth, backlog, and hyperscaler commentary will be critical in settling that question.
$NVDAB $GOOGLB $AMZNB #CoinVahini #AIChips #Nvidia #Semiconductors
Nvidia is trading near $203, down 4.09%, as investors dig into whether hyperscaler custom chips threaten or simply complement its dominance. Amazon and Alphabet are scaling internal silicon, yet both still rely heavily on Nvidia GPUs for advanced AI workloads.
💡Now we can Accumulate fractions
💡of NASDAQ listed stock - bStock
The stock has amplified the broader AI unwind, with Nvidia and Alphabet together shedding roughly $835 billion in market value. The core debate remains whether custom chips stay complementary or begin to erode incremental GPU demand. Upcoming results on data-center growth, backlog, and hyperscaler commentary will be critical in settling that question.
$NVDAB $GOOGLB $AMZNB #CoinVahini #AIChips #Nvidia #Semiconductors
10

·
--
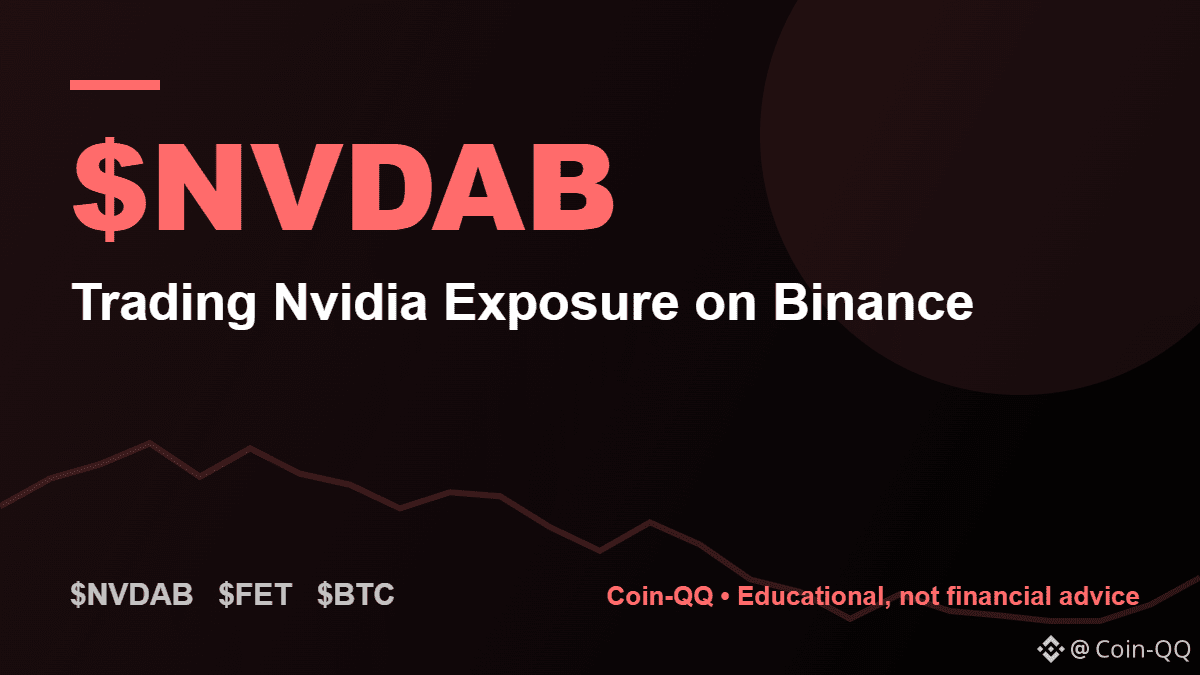
🟢 $NVDAB : Binance’da Nvidia aktivlariga sarmoya kiritish
Nvidia — sun’iy intellekt rivojining ramzi. Endi Binance’da Nvidia’ning bStock’i NVDAB orqali ushbu aktivga sarmoya kiritishingiz mumkin.
bStocks nima? 👇
bStocks — Binance guruhiga aloqador kompaniya tomonidan chiqariladigan va 1:1 nisbatda aktivlar bilan ta’minlangan tokenlashtirilgan qimmatli qog‘ozlar. Ular sertifikatlar shaklida tuzilgan. Muhim: ular aksiyalarning o‘zi emas, shuning uchun aksiyadorlarga tegishli bevosita huquqlarga ega bo‘lmaysiz.
Nega kripto treyderlari Nvidia’ni kuzatadi:
🔹 Sun’iy intellektga bo‘lgan talab texnologiya sohasidagi kayfiyatga ta’sir qiladi va $FET kabi AI kripto tokenlariga ham ta’sir ko‘rsatadi
🔹 Daromadlar e’lon qilinadigan kunlar butun riskli aktivlar bozoriga, jumladan $BTC ga ham ta’sir qilishi mumkin
📌 Savdo qilishdan oldin:
✅ Daromadlar e’lon qilinadigan sanani bilib oling
✅ Yangiliklar sababli aksiyalar narxida keskin uzilishlar bo‘lishi mumkinligini yodda tuting
✅ Pozitsiyalar hajmini har qanday o‘zgaruvchan aktiv kabi belgilang
💬 Aksiya va kriptovalyutalar bilan bitta ilovada savdo qilarmidingiz? 👇
⚠️ Bu faqat ma’lumot berish uchun, moliyaviy maslahat emas. O‘zingiz izlanish olib boring (DYOR).
#NVIDIA #bStocks #TokenizedStocks #BinanceSquare
🟢 $NVDAB : Binance’da Nvidia aktivlariga sarmoya kiritish
Nvidia — sun’iy intellekt rivojining ramzi. Endi Binance’da Nvidia’ning bStock’i NVDAB orqali ushbu aktivga sarmoya kiritishingiz mumkin.
bStocks nima? 👇
bStocks — Binance guruhiga aloqador kompaniya tomonidan chiqariladigan va 1:1 nisbatda aktivlar bilan ta’minlangan tokenlashtirilgan qimmatli qog‘ozlar. Ular sertifikatlar shaklida tuzilgan. Muhim: ular aksiyalarning o‘zi emas, shuning uchun aksiyadorlarga tegishli bevosita huquqlarga ega bo‘lmaysiz.
Nega kripto treyderlari Nvidia’ni kuzatadi:
🔹 Sun’iy intellektga bo‘lgan talab texnologiya sohasidagi kayfiyatga ta’sir qiladi va $FET kabi AI kripto tokenlariga ham ta’sir ko‘rsatadi
🔹 Daromadlar e’lon qilinadigan kunlar butun riskli aktivlar bozoriga, jumladan $BTC ga ham ta’sir qilishi mumkin
📌 Savdo qilishdan oldin:
✅ Daromadlar e’lon qilinadigan sanani bilib oling
✅ Yangiliklar sababli aksiyalar narxida keskin uzilishlar bo‘lishi mumkinligini yodda tuting
✅ Pozitsiyalar hajmini har qanday o‘zgaruvchan aktiv kabi belgilang
💬 Aksiya va kriptovalyutalar bilan bitta ilovada savdo qilarmidingiz? 👇
⚠️ Bu faqat ma’lumot berish uchun, moliyaviy maslahat emas. O‘zingiz izlanish olib boring (DYOR).
#NVIDIA #bStocks #TokenizedStocks #BinanceSquare
Nvidia — sun’iy intellekt rivojining ramzi. Endi Binance’da Nvidia’ning bStock’i NVDAB orqali ushbu aktivga sarmoya kiritishingiz mumkin.
bStocks nima? 👇
bStocks — Binance guruhiga aloqador kompaniya tomonidan chiqariladigan va 1:1 nisbatda aktivlar bilan ta’minlangan tokenlashtirilgan qimmatli qog‘ozlar. Ular sertifikatlar shaklida tuzilgan. Muhim: ular aksiyalarning o‘zi emas, shuning uchun aksiyadorlarga tegishli bevosita huquqlarga ega bo‘lmaysiz.
Nega kripto treyderlari Nvidia’ni kuzatadi:
🔹 Sun’iy intellektga bo‘lgan talab texnologiya sohasidagi kayfiyatga ta’sir qiladi va $FET kabi AI kripto tokenlariga ham ta’sir ko‘rsatadi
🔹 Daromadlar e’lon qilinadigan kunlar butun riskli aktivlar bozoriga, jumladan $BTC ga ham ta’sir qilishi mumkin
📌 Savdo qilishdan oldin:
✅ Daromadlar e’lon qilinadigan sanani bilib oling
✅ Yangiliklar sababli aksiyalar narxida keskin uzilishlar bo‘lishi mumkinligini yodda tuting
✅ Pozitsiyalar hajmini har qanday o‘zgaruvchan aktiv kabi belgilang
💬 Aksiya va kriptovalyutalar bilan bitta ilovada savdo qilarmidingiz? 👇
⚠️ Bu faqat ma’lumot berish uchun, moliyaviy maslahat emas. O‘zingiz izlanish olib boring (DYOR).
#NVIDIA #bStocks #TokenizedStocks #BinanceSquare
1
3
·
--
Maqola
Tarjimani ko‘rish
NVIDIA: THE COMPANY POWERING THE AI REVOLUTION 🚀$NVDAB #NVIDIA
I’ve been researching the AI industry, studying financial reports and following the companies shaping its future. One name keeps standing out: NVIDIA ($NVDA).
Here’s what caught my attention:
📊 $96.2 billion in quarterly revenue.
📈 106% year-over-year growth.
🏢 $89 billion generated by its Data Center business.
These figures come from NVIDIA’s August 2026 earnings report.
What interests me most is NVIDIA’s position in the infrastructure powering artificial intelligence.
But the real question is: Can this growth continue, and does the current stock valuation justify the expectations?
NVIDIA deserves a closer look. I’m keeping it firmly on my research radar.
What’s your outlook on NVDA? Bullish or cautious?
$NVDA | NASDAQ
#NVIDIA #AI #StockMarket #Investing #MarketResearch
NVIDIA: THE COMPANY POWERING THE AI REVOLUTION 🚀
$NVDAB #NVIDIA
I’ve been researching the AI industry, studying financial reports and following the companies shaping its future. One name keeps standing out: NVIDIA ($NVDA).
Here’s what caught my attention:
📊 $96.2 billion in quarterly revenue.
📈 106% year-over-year growth.
🏢 $89 billion generated by its Data Center business.
These figures come from NVIDIA’s August 2026 earnings report.
What interests me most is NVIDIA’s position in the infrastructure powering artificial intelligence.
But the real question is: Can this growth continue, and does the current stock valuation justify the expectations?
NVIDIA deserves a closer look. I’m keeping it firmly on my research radar.
What’s your outlook on NVDA? Bullish or cautious?
$NVDA | NASDAQ
#NVIDIA #AI #StockMarket #Investing #MarketResearch
I’ve been researching the AI industry, studying financial reports and following the companies shaping its future. One name keeps standing out: NVIDIA ($NVDA).
Here’s what caught my attention:
📊 $96.2 billion in quarterly revenue.
📈 106% year-over-year growth.
🏢 $89 billion generated by its Data Center business.
These figures come from NVIDIA’s August 2026 earnings report.
What interests me most is NVIDIA’s position in the infrastructure powering artificial intelligence.
But the real question is: Can this growth continue, and does the current stock valuation justify the expectations?
NVIDIA deserves a closer look. I’m keeping it firmly on my research radar.
What’s your outlook on NVDA? Bullish or cautious?
$NVDA | NASDAQ
#NVIDIA #AI #StockMarket #Investing #MarketResearch
1
93


·
--
Pasayuvchi
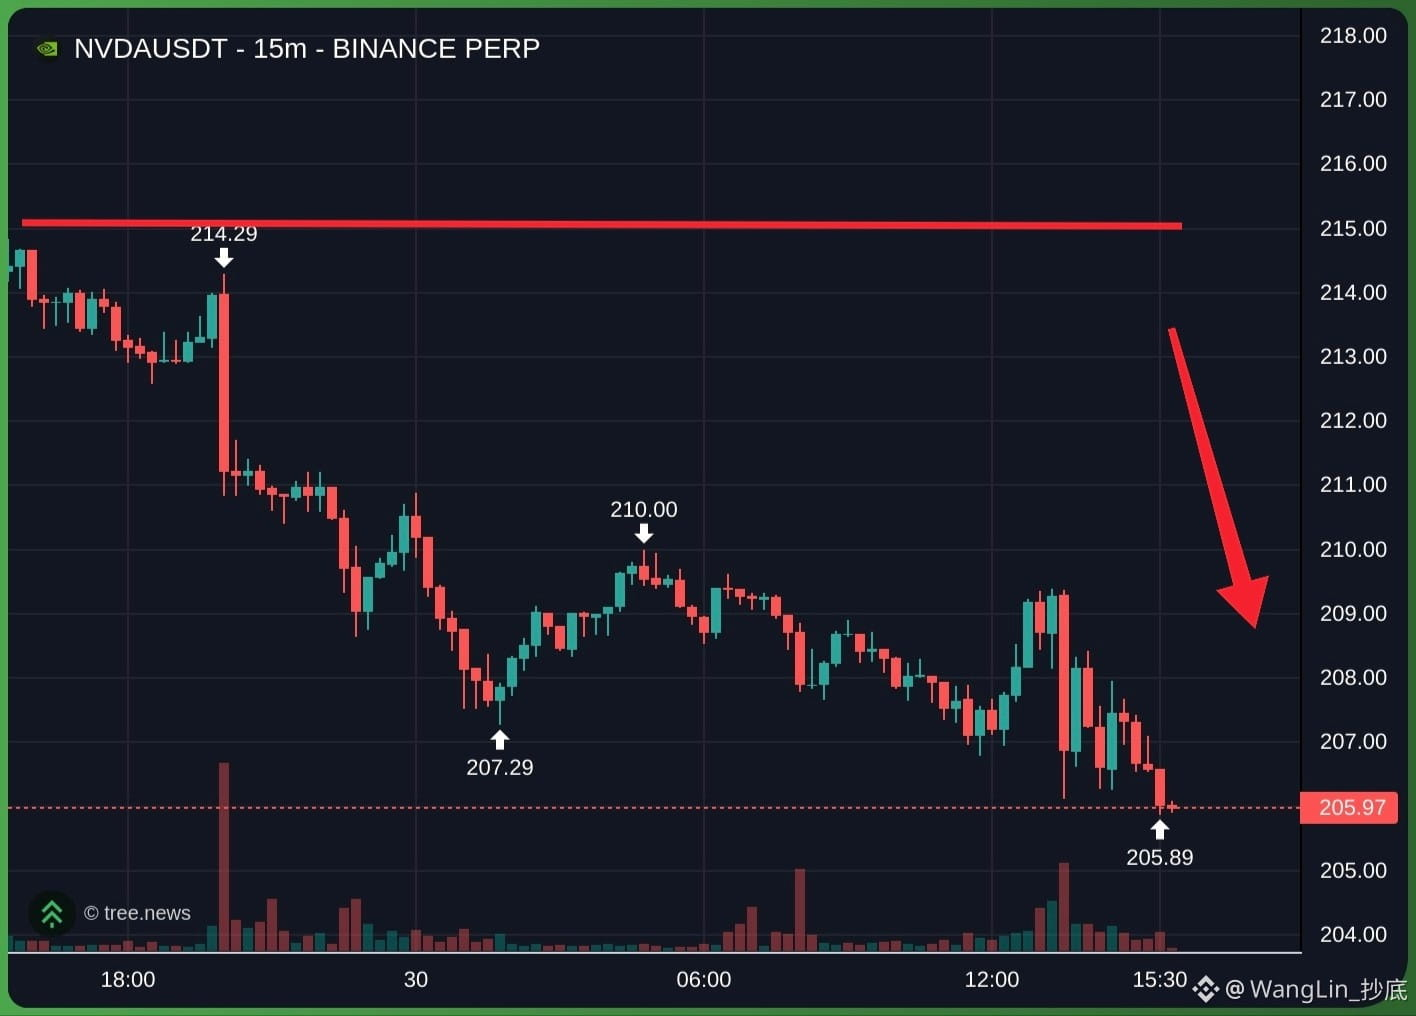
$NVDA NVIDIA bo‘yicha QISQA pozitsiya
Narx 215 qarshilik darajasidan pastda turgan ekan, umumiy tuzilma PASAYISH tomonda qoladi
Barcha vaqt oralig‘idagi so‘nggi narx harakati kuchli va davomli pasayish trendini ko‘rsatmoqda. Hozirgi qaytishlar kuchsiz
$NVDA QISQA POZITSIYA REJASI
· Qisqa pozitsiyaga kirish: 208–210 (narxning ushbu qarshilik zonasiga qaytishini kuting)
· Stop-loss: 216 dan yuqorida
· Foydani olish: 206 va 200
Meni qo‘llab-quvvatlash uchun shunchaki shu yerda savdo qiling👇$NVDA
{future}(NVDAUSDT)
#nvda #Nvidia
$NVDA NVIDIA bo‘yicha QISQA pozitsiya
Narx 215 qarshilik darajasidan pastda turgan ekan, umumiy tuzilma PASAYISH tomonda qoladi
Barcha vaqt oralig‘idagi so‘nggi narx harakati kuchli va davomli pasayish trendini ko‘rsatmoqda. Hozirgi qaytishlar kuchsiz
$NVDA QISQA POZITSIYA REJASI
· Qisqa pozitsiyaga kirish: 208–210 (narxning ushbu qarshilik zonasiga qaytishini kuting)
· Stop-loss: 216 dan yuqorida
· Foydani olish: 206 va 200
Meni qo‘llab-quvvatlash uchun shunchaki shu yerda savdo qiling👇$NVDA
#nvda #Nvidia
Narx 215 qarshilik darajasidan pastda turgan ekan, umumiy tuzilma PASAYISH tomonda qoladi
Barcha vaqt oralig‘idagi so‘nggi narx harakati kuchli va davomli pasayish trendini ko‘rsatmoqda. Hozirgi qaytishlar kuchsiz
$NVDA QISQA POZITSIYA REJASI
· Qisqa pozitsiyaga kirish: 208–210 (narxning ushbu qarshilik zonasiga qaytishini kuting)
· Stop-loss: 216 dan yuqorida
· Foydani olish: 206 va 200
Meni qo‘llab-quvvatlash uchun shunchaki shu yerda savdo qiling👇$NVDA
#nvda #Nvidia
1
339
·
--
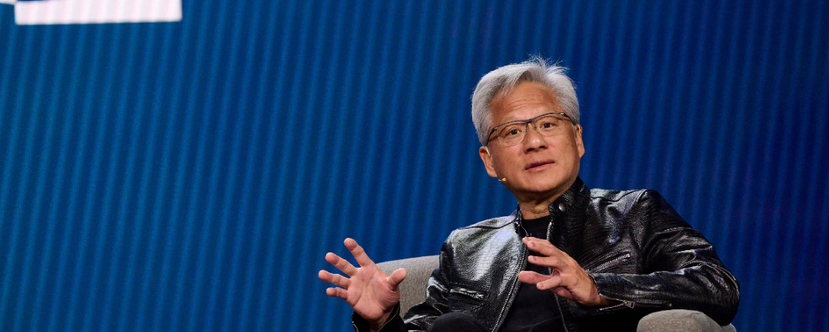
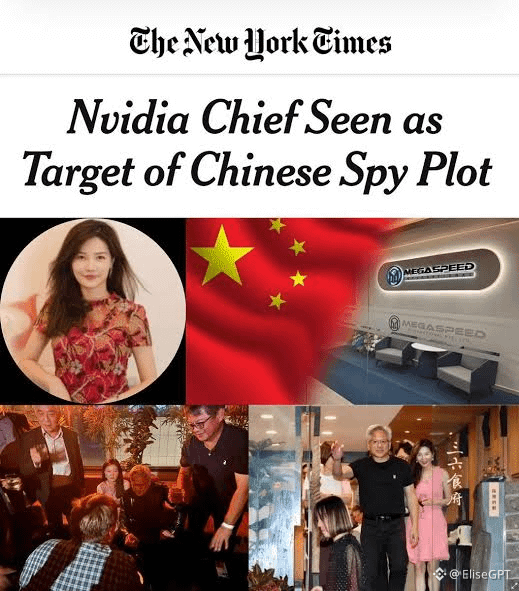
Voy-bo‘! Aytishlaricha, Jensen Huangning yonida ikki yildan ortiq josus aylanib yurgan🙉🙉
Uning ismi Alice Huang (yo‘q, ular qarindosh emas :)
U kichik bir kompaniyada rahbar bo‘lgan, o‘zini CEO deb tanishtirib yurgan va Jensen bilan tushgan suratlaridan pul yig‘ish uchun foydalangan. 2024 va 2025-yillardagi ichkilikli uchrashuvlaru kechki ovqatlarda u doim Jensenning yonida, qadahini ko‘tarib turgan
Xabarlarga ko‘ra, uning kompaniyasi ikki yildan kamroq vaqt ichida Nvidia’ning 4,8 milliard dollarlik uskunalarini sotib olgan. Keyin kimdir tekshirsa, qutilar hatto ochilmagan ekan...
Shu vaqt davomida AQSh razvedkasi u Pekinga ma’lumot uzatyapti deb o‘ylab, uni tinglab kelgan. Keyin yozuvlarda bir amerikalikning ovozi eshitiladi. Ismini aniqlashadi. Bu — Jensenning o‘zi 😳#NVIDIA #JensenHuang
Voy-bo‘! Aytishlaricha, Jensen Huangning yonida ikki yildan ortiq josus aylanib yurgan🙉🙉
Uning ismi Alice Huang (yo‘q, ular qarindosh emas :)
U kichik bir kompaniyada rahbar bo‘lgan, o‘zini CEO deb tanishtirib yurgan va Jensen bilan tushgan suratlaridan pul yig‘ish uchun foydalangan. 2024 va 2025-yillardagi ichkilikli uchrashuvlaru kechki ovqatlarda u doim Jensenning yonida, qadahini ko‘tarib turgan
Xabarlarga ko‘ra, uning kompaniyasi ikki yildan kamroq vaqt ichida Nvidia’ning 4,8 milliard dollarlik uskunalarini sotib olgan. Keyin kimdir tekshirsa, qutilar hatto ochilmagan ekan...
Shu vaqt davomida AQSh razvedkasi u Pekinga ma’lumot uzatyapti deb o‘ylab, uni tinglab kelgan. Keyin yozuvlarda bir amerikalikning ovozi eshitiladi. Ismini aniqlashadi. Bu — Jensenning o‘zi 😳#NVIDIA #JensenHuang
Uning ismi Alice Huang (yo‘q, ular qarindosh emas :)
U kichik bir kompaniyada rahbar bo‘lgan, o‘zini CEO deb tanishtirib yurgan va Jensen bilan tushgan suratlaridan pul yig‘ish uchun foydalangan. 2024 va 2025-yillardagi ichkilikli uchrashuvlaru kechki ovqatlarda u doim Jensenning yonida, qadahini ko‘tarib turgan
Xabarlarga ko‘ra, uning kompaniyasi ikki yildan kamroq vaqt ichida Nvidia’ning 4,8 milliard dollarlik uskunalarini sotib olgan. Keyin kimdir tekshirsa, qutilar hatto ochilmagan ekan...
Shu vaqt davomida AQSh razvedkasi u Pekinga ma’lumot uzatyapti deb o‘ylab, uni tinglab kelgan. Keyin yozuvlarda bir amerikalikning ovozi eshitiladi. Ismini aniqlashadi. Bu — Jensenning o‘zi 😳#NVIDIA #JensenHuang

4
2.9k

·
--
Tasdiqlangan
JENSEN HUANG YONIDA FBI OGOHLANTIRUVI NVDA AKSIYALARINI TANG AHVOLGA SOLDI
🚨 FBI Jensen Huangga yaqinlashgan xitoylik gumonlanuvchi agent haqida ogohlantirdi, NVDA esa 2,0% ga tushib, $213.66 bo‘ldi.
1. NYT yozishicha, Singapurda yashovchi ishbilarmon ayol Alice Huang Jensen Huang bilan ko‘p yillar davomida uchrashish imkoniga ega bo‘lgan. Trumpga bu haqda ma’lumot berilgan, ammo u hech qanday chora ko‘rmagan (NYT ma’lumotiga ko‘ra, Forbes orqali).
2. Nvidia bu da’volarni eski xabarlarni takrorlaydigan noto‘g‘ri talqinlar deb atadi. Xitoy Tashqi ishlar vazirligi esa bu xabarni asossiz tuhmat deb baholadi (Nvidia bayonotiga va Xitoy TIV brifingiga ko‘ra).
3. O‘sha haftaning o‘zida AQSh Adliya vazirligi Nvidia’ning Hugging Face’ga kiritgan $12.93B sarmoyasi yuzasidan monopoliyaga qarshi tekshiruv boshladi (Times Of AI ma’lumotiga ko‘ra).
Mening fikrim: bu sarlavha tezda unutiladi va kelasi juma kunigacha NVDA yana $217.94 ga chiqadi. Yoki josuslik xavfi uchun qo‘shimcha narx haqiqatdan ham bor, men esa adashyapman.
Nimani kuzatish kerak: Jensen Huangning nomi bevosita tilga olingan DOJ yoki SEC hujjatlarini, chunki bu shov-shuvni muvofiqlik masalasiga aylantiradi.
Bu pasayishdan foydalanib xarid qilasizmi yoki NVDA yanada arzonlashishini kutasizmi?
#Nvidia #AITrading #TechStocks #AI #CryptoAI
$NVDA
——
To‘liq miqdoriy savdo — bozordagi har bir imkoniyatdan foydalaning.
JENSEN HUANG YONIDA FBI OGOHLANTIRUVI NVDA AKSIYALARINI TANG AHVOLGA SOLDI
🚨 FBI Jensen Huangga yaqinlashgan xitoylik gumonlanuvchi agent haqida ogohlantirdi, NVDA esa 2,0% ga tushib, $213.66 bo‘ldi.
1. NYT yozishicha, Singapurda yashovchi ishbilarmon ayol Alice Huang Jensen Huang bilan ko‘p yillar davomida uchrashish imkoniga ega bo‘lgan. Trumpga bu haqda ma’lumot berilgan, ammo u hech qanday chora ko‘rmagan (NYT ma’lumotiga ko‘ra, Forbes orqali).
2. Nvidia bu da’volarni eski xabarlarni takrorlaydigan noto‘g‘ri talqinlar deb atadi. Xitoy Tashqi ishlar vazirligi esa bu xabarni asossiz tuhmat deb baholadi (Nvidia bayonotiga va Xitoy TIV brifingiga ko‘ra).
3. O‘sha haftaning o‘zida AQSh Adliya vazirligi Nvidia’ning Hugging Face’ga kiritgan $12.93B sarmoyasi yuzasidan monopoliyaga qarshi tekshiruv boshladi (Times Of AI ma’lumotiga ko‘ra).
Mening fikrim: bu sarlavha tezda unutiladi va kelasi juma kunigacha NVDA yana $217.94 ga chiqadi. Yoki josuslik xavfi uchun qo‘shimcha narx haqiqatdan ham bor, men esa adashyapman.
Nimani kuzatish kerak: Jensen Huangning nomi bevosita tilga olingan DOJ yoki SEC hujjatlarini, chunki bu shov-shuvni muvofiqlik masalasiga aylantiradi.
Bu pasayishdan foydalanib xarid qilasizmi yoki NVDA yanada arzonlashishini kutasizmi?
#Nvidia #AITrading #TechStocks #AI #CryptoAI
$NVDA
——
To‘liq miqdoriy savdo — bozordagi har bir imkoniyatdan foydalaning.
🚨 FBI Jensen Huangga yaqinlashgan xitoylik gumonlanuvchi agent haqida ogohlantirdi, NVDA esa 2,0% ga tushib, $213.66 bo‘ldi.
1. NYT yozishicha, Singapurda yashovchi ishbilarmon ayol Alice Huang Jensen Huang bilan ko‘p yillar davomida uchrashish imkoniga ega bo‘lgan. Trumpga bu haqda ma’lumot berilgan, ammo u hech qanday chora ko‘rmagan (NYT ma’lumotiga ko‘ra, Forbes orqali).
2. Nvidia bu da’volarni eski xabarlarni takrorlaydigan noto‘g‘ri talqinlar deb atadi. Xitoy Tashqi ishlar vazirligi esa bu xabarni asossiz tuhmat deb baholadi (Nvidia bayonotiga va Xitoy TIV brifingiga ko‘ra).
3. O‘sha haftaning o‘zida AQSh Adliya vazirligi Nvidia’ning Hugging Face’ga kiritgan $12.93B sarmoyasi yuzasidan monopoliyaga qarshi tekshiruv boshladi (Times Of AI ma’lumotiga ko‘ra).
Mening fikrim: bu sarlavha tezda unutiladi va kelasi juma kunigacha NVDA yana $217.94 ga chiqadi. Yoki josuslik xavfi uchun qo‘shimcha narx haqiqatdan ham bor, men esa adashyapman.
Nimani kuzatish kerak: Jensen Huangning nomi bevosita tilga olingan DOJ yoki SEC hujjatlarini, chunki bu shov-shuvni muvofiqlik masalasiga aylantiradi.
Bu pasayishdan foydalanib xarid qilasizmi yoki NVDA yanada arzonlashishini kutasizmi?
#Nvidia #AITrading #TechStocks #AI #CryptoAI
$NVDA
——
To‘liq miqdoriy savdo — bozordagi har bir imkoniyatdan foydalaning.

1
1
2.7k

·
--
NVIDIA’ning MILLIARD DOLLARLIK AI QADAMI! 🚀
Xabarlarga ko‘ra, NVIDIA bulutli xizmatlar provayderining Anthropic bilan tuzgan 45 milliard dollarlik bitimini qo‘llab-quvvatlash uchun milliardlab dollar kredit ajratish bo‘yicha muzokaralar olib bormoqda. Bu yirik o‘yinchilar hisoblash quvvati va ma’lumotlar markazlari infratuzilmasini ta’minlashga intilayotgan bir paytda NVIDIA’ning AI chiplari ortidagi ta’siri ham tobora ortib borayotganini ko‘rsatadi.
AI sohasidagi raqobat aqlliroq modellar yaratishdan ularni quvvatlantiradigan infratuzilmani nazorat qilishga qarab o‘zgarmoqda. Bu NVIDIA’ning AI sohasidagi ustunligi yo‘lidagi yana bir muhim qadam bo‘lishi mumkin.
#NVIDIA #Anthropic #AI
NVIDIA’ning MILLIARD DOLLARLIK AI QADAMI! 🚀
Xabarlarga ko‘ra, NVIDIA bulutli xizmatlar provayderining Anthropic bilan tuzgan 45 milliard dollarlik bitimini qo‘llab-quvvatlash uchun milliardlab dollar kredit ajratish bo‘yicha muzokaralar olib bormoqda. Bu yirik o‘yinchilar hisoblash quvvati va ma’lumotlar markazlari infratuzilmasini ta’minlashga intilayotgan bir paytda NVIDIA’ning AI chiplari ortidagi ta’siri ham tobora ortib borayotganini ko‘rsatadi.
AI sohasidagi raqobat aqlliroq modellar yaratishdan ularni quvvatlantiradigan infratuzilmani nazorat qilishga qarab o‘zgarmoqda. Bu NVIDIA’ning AI sohasidagi ustunligi yo‘lidagi yana bir muhim qadam bo‘lishi mumkin.
#NVIDIA #Anthropic #AI
Xabarlarga ko‘ra, NVIDIA bulutli xizmatlar provayderining Anthropic bilan tuzgan 45 milliard dollarlik bitimini qo‘llab-quvvatlash uchun milliardlab dollar kredit ajratish bo‘yicha muzokaralar olib bormoqda. Bu yirik o‘yinchilar hisoblash quvvati va ma’lumotlar markazlari infratuzilmasini ta’minlashga intilayotgan bir paytda NVIDIA’ning AI chiplari ortidagi ta’siri ham tobora ortib borayotganini ko‘rsatadi.
AI sohasidagi raqobat aqlliroq modellar yaratishdan ularni quvvatlantiradigan infratuzilmani nazorat qilishga qarab o‘zgarmoqda. Bu NVIDIA’ning AI sohasidagi ustunligi yo‘lidagi yana bir muhim qadam bo‘lishi mumkin.
#NVIDIA #Anthropic #AI

2
1.7k

Tarjimani ko‘rish
NVIDIA 新品发布:Nemotron 3.5 Super VL 与 Bolt 模型解析
NVIDIA 最新推出的 Nemotron 3.5 Super VL 和 Bolt 模型,Super VL 以120亿参数领先,速度与准确性并重;Bolt 模型则平衡智能与速度,优化智能体工作。技术分析,看智能体新篇章。#NVIDIA #Nemotron3.5
NVIDIA 新品发布:Nemotron 3.5 Super VL 与 Bolt 模型解析
NVIDIA 最新推出的 Nemotron 3.5 Super VL 和 Bolt 模型,Super VL 以120亿参数领先,速度与准确性并重;Bolt 模型则平衡智能与速度,优化智能体工作。技术分析,看智能体新篇章。#NVIDIA #Nemotron3.5
NVIDIA 最新推出的 Nemotron 3.5 Super VL 和 Bolt 模型,Super VL 以120亿参数领先,速度与准确性并重;Bolt 模型则平衡智能与速度,优化智能体工作。技术分析,看智能体新篇章。#NVIDIA #Nemotron3.5
1

Tarjimani ko‘rish
🔥 THE AI BOOM ISN'T OVER — BUT IS NVIDIA STOCK OVERVALUED?
$NVDAB remains a major player in AI chips and data-center technology. The big question is whether future growth justifies its valuation.
📊 Watch earnings, AI demand, and price momentum.
🚨 Great companies can still have market corrections!
👇 Is NVDA still worth watching? Check the latest data and share your outlook!
$NVDAB
#NVIDIA #NVDA #AIStocks #BinanceSquare
🔥 THE AI BOOM ISN'T OVER — BUT IS NVIDIA STOCK OVERVALUED?
$NVDAB remains a major player in AI chips and data-center technology. The big question is whether future growth justifies its valuation.
📊 Watch earnings, AI demand, and price momentum.
🚨 Great companies can still have market corrections!
👇 Is NVDA still worth watching? Check the latest data and share your outlook!
$NVDAB
#NVIDIA #NVDA #AIStocks #BinanceSquare
$NVDAB remains a major player in AI chips and data-center technology. The big question is whether future growth justifies its valuation.
📊 Watch earnings, AI demand, and price momentum.
🚨 Great companies can still have market corrections!
👇 Is NVDA still worth watching? Check the latest data and share your outlook!
$NVDAB
#NVIDIA #NVDA #AIStocks #BinanceSquare
32

·
--
Tarjimani ko‘rish
英伟达想买下 AI 圈的「GitHub」,DOJ 先来敲门了 👀
10-28 Reuters 独家(CNBC 随后向知情人士确认):美国司法部正在问询 Nvidia 以 $12.93B 收购 Hugging Face 这笔交易,会不会伤害 AI 竞争。
几个硬信息:
1️⃣ DOJ 关心的核心问题:这笔交易会不会让 Nvidia 拿下 AI 的一个「基础分发入口」,以及会不会借此打压对手、获得额外筹码;官员还在打听 Hugging Face 的竞争对手情况
2️⃣ 这是一个更大调查的一部分:问询范围覆盖 Nvidia 的收购、投资、销售方式,以及有没有向客户施压。调查从 Biden 时期开始,到 Trump 政府继续推进
3️⃣ 被翻出来的旧账:SchedMD、Run:ai,还有 Groq 技术授权那笔交易——官员在看 Nvidia 是否用 AI 芯片配额去捆绑网络设备和 Groq 处理器
4️⃣ Hugging Face 体量:按 Nvidia 9 月公告,超过 1800 万人、20 万家公司在上面分享至少 300 万个模型和 50 万个数据集
5️⃣ Nvidia 预计 2027 上半年完成交割,并表示 Hugging Face 会继续支持各家芯片、云和 AI 厂商。Nvidia 拒绝置评,DOJ 也不评论具体案件
我的看法:
调查 ≠ 违法,也不一定走到起诉,Reuters 原文也这么写。真正值得盯的是「开源模型的分发入口归谁」——卖铲子的想把铲子店也买下,监管多看两眼很正常。
对 AI 叙事和美股长期逻辑,我的判断不变:Nasdaq-100 这台机器靠的就是这些公司在竞争和监管里一路被打磨。短线情绪归情绪,别拿一条问询新闻去做空科技文明 😂
链上这边 AI agent、开源模型赛道的朋友,可以顺便关注一下 Hugging Face 中立性会不会被写进交易条件。
来源:Reuters(10-28 独家)、CNBC、Bloomberg 转述
不构成投资建议,DYOR。
#Nvidia #AI #HuggingFace #美股
英伟达想买下 AI 圈的「GitHub」,DOJ 先来敲门了 👀
10-28 Reuters 独家(CNBC 随后向知情人士确认):美国司法部正在问询 Nvidia 以 $12.93B 收购 Hugging Face 这笔交易,会不会伤害 AI 竞争。
几个硬信息:
1️⃣ DOJ 关心的核心问题:这笔交易会不会让 Nvidia 拿下 AI 的一个「基础分发入口」,以及会不会借此打压对手、获得额外筹码;官员还在打听 Hugging Face 的竞争对手情况
2️⃣ 这是一个更大调查的一部分:问询范围覆盖 Nvidia 的收购、投资、销售方式,以及有没有向客户施压。调查从 Biden 时期开始,到 Trump 政府继续推进
3️⃣ 被翻出来的旧账:SchedMD、Run:ai,还有 Groq 技术授权那笔交易——官员在看 Nvidia 是否用 AI 芯片配额去捆绑网络设备和 Groq 处理器
4️⃣ Hugging Face 体量:按 Nvidia 9 月公告,超过 1800 万人、20 万家公司在上面分享至少 300 万个模型和 50 万个数据集
5️⃣ Nvidia 预计 2027 上半年完成交割,并表示 Hugging Face 会继续支持各家芯片、云和 AI 厂商。Nvidia 拒绝置评,DOJ 也不评论具体案件
我的看法:
调查 ≠ 违法,也不一定走到起诉,Reuters 原文也这么写。真正值得盯的是「开源模型的分发入口归谁」——卖铲子的想把铲子店也买下,监管多看两眼很正常。
对 AI 叙事和美股长期逻辑,我的判断不变:Nasdaq-100 这台机器靠的就是这些公司在竞争和监管里一路被打磨。短线情绪归情绪,别拿一条问询新闻去做空科技文明 😂
链上这边 AI agent、开源模型赛道的朋友,可以顺便关注一下 Hugging Face 中立性会不会被写进交易条件。
来源:Reuters(10-28 独家)、CNBC、Bloomberg 转述
不构成投资建议,DYOR。
#Nvidia #AI #HuggingFace #美股
10-28 Reuters 独家(CNBC 随后向知情人士确认):美国司法部正在问询 Nvidia 以 $12.93B 收购 Hugging Face 这笔交易,会不会伤害 AI 竞争。
几个硬信息:
1️⃣ DOJ 关心的核心问题:这笔交易会不会让 Nvidia 拿下 AI 的一个「基础分发入口」,以及会不会借此打压对手、获得额外筹码;官员还在打听 Hugging Face 的竞争对手情况
2️⃣ 这是一个更大调查的一部分:问询范围覆盖 Nvidia 的收购、投资、销售方式,以及有没有向客户施压。调查从 Biden 时期开始,到 Trump 政府继续推进
3️⃣ 被翻出来的旧账:SchedMD、Run:ai,还有 Groq 技术授权那笔交易——官员在看 Nvidia 是否用 AI 芯片配额去捆绑网络设备和 Groq 处理器
4️⃣ Hugging Face 体量:按 Nvidia 9 月公告,超过 1800 万人、20 万家公司在上面分享至少 300 万个模型和 50 万个数据集
5️⃣ Nvidia 预计 2027 上半年完成交割,并表示 Hugging Face 会继续支持各家芯片、云和 AI 厂商。Nvidia 拒绝置评,DOJ 也不评论具体案件
我的看法:
调查 ≠ 违法,也不一定走到起诉,Reuters 原文也这么写。真正值得盯的是「开源模型的分发入口归谁」——卖铲子的想把铲子店也买下,监管多看两眼很正常。
对 AI 叙事和美股长期逻辑,我的判断不变:Nasdaq-100 这台机器靠的就是这些公司在竞争和监管里一路被打磨。短线情绪归情绪,别拿一条问询新闻去做空科技文明 😂
链上这边 AI agent、开源模型赛道的朋友,可以顺便关注一下 Hugging Face 中立性会不会被写进交易条件。
来源:Reuters(10-28 独家)、CNBC、Bloomberg 转述
不构成投资建议,DYOR。
#Nvidia #AI #HuggingFace #美股
197
Tarjimani ko‘rish
NVIDIA Nemotron 3.5 带来多语言转录新篇章
NVIDIA最新发布Nemotron 3.5,新增Granary v2数据管道,支持多语言转录、说话人识别、翻译及音频问答。技术驱动,功能全面,专业分析必备。#NVIDIA #AI转录
NVIDIA Nemotron 3.5 带来多语言转录新篇章
NVIDIA最新发布Nemotron 3.5,新增Granary v2数据管道,支持多语言转录、说话人识别、翻译及音频问答。技术驱动,功能全面,专业分析必备。#NVIDIA #AI转录
NVIDIA最新发布Nemotron 3.5,新增Granary v2数据管道,支持多语言转录、说话人识别、翻译及音频问答。技术驱动,功能全面,专业分析必备。#NVIDIA #AI转录

Tarjimani ko‘rish
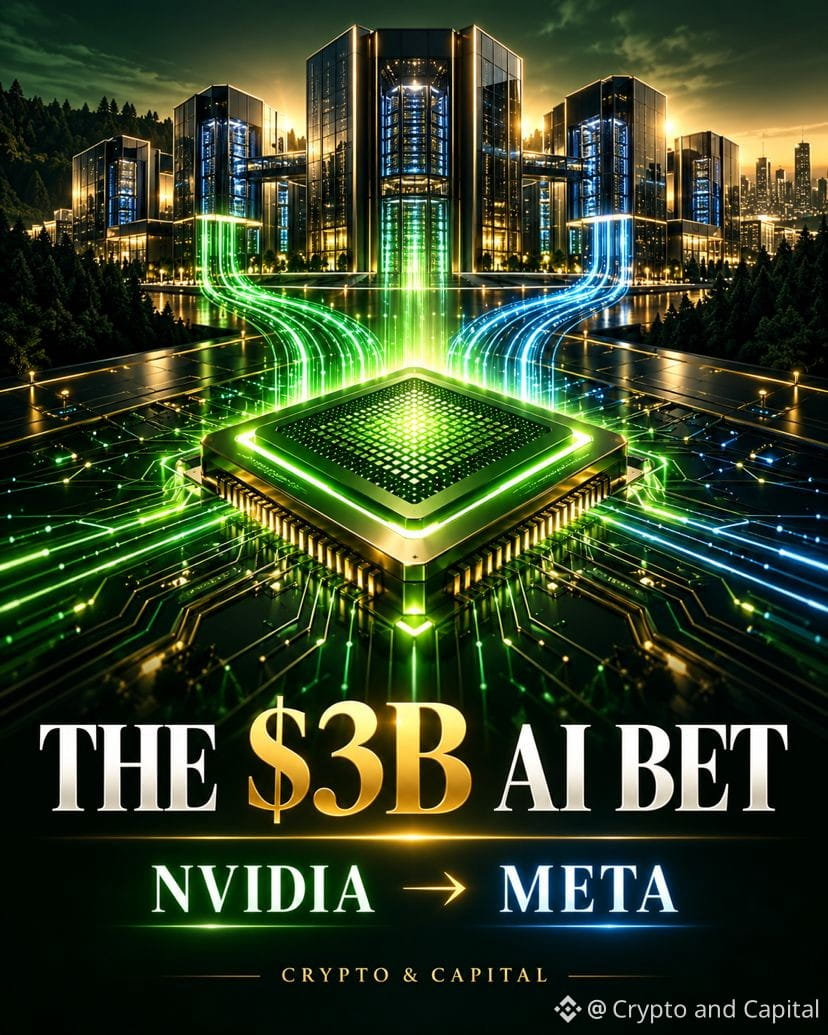
NVIDIA IS INVESTING $3 BILLION IN META’S AI FUNDRAISE 👀
NVIDIA and Meta are expanding their AI partnership and NVIDIA plans to invest $3 billion in Meta’s share offering.
Meta says its current stock and preferred-share offerings total about $35 billion, with a separate share-sale programme of up to $60 billion planned for 2027. The money will help fund Meta’s AI infrastructure buildout.
Here’s the question investors are asking: Could this create a circular flow of capital?
NVIDIA supplies the chips powering Meta’s AI ambitions, while also investing in Meta as it raises money to expand that infrastructure. That does not prove anything is wrong, but it does make the economics worth watching.
The real test is whether AI revenue can eventually justify the massive spending.
Smart move to secure the AI partnership, or a warning sign about how expensive the AI race has become?
#NVIDIA #Meta #Aİ #TechStocks #Investing
NVIDIA IS INVESTING $3 BILLION IN META’S AI FUNDRAISE 👀
NVIDIA and Meta are expanding their AI partnership and NVIDIA plans to invest $3 billion in Meta’s share offering.
Meta says its current stock and preferred-share offerings total about $35 billion, with a separate share-sale programme of up to $60 billion planned for 2027. The money will help fund Meta’s AI infrastructure buildout.
Here’s the question investors are asking: Could this create a circular flow of capital?
NVIDIA supplies the chips powering Meta’s AI ambitions, while also investing in Meta as it raises money to expand that infrastructure. That does not prove anything is wrong, but it does make the economics worth watching.
The real test is whether AI revenue can eventually justify the massive spending.
Smart move to secure the AI partnership, or a warning sign about how expensive the AI race has become?
#NVIDIA #Meta #Aİ #TechStocks #Investing
NVIDIA and Meta are expanding their AI partnership and NVIDIA plans to invest $3 billion in Meta’s share offering.
Meta says its current stock and preferred-share offerings total about $35 billion, with a separate share-sale programme of up to $60 billion planned for 2027. The money will help fund Meta’s AI infrastructure buildout.
Here’s the question investors are asking: Could this create a circular flow of capital?
NVIDIA supplies the chips powering Meta’s AI ambitions, while also investing in Meta as it raises money to expand that infrastructure. That does not prove anything is wrong, but it does make the economics worth watching.
The real test is whether AI revenue can eventually justify the massive spending.
Smart move to secure the AI partnership, or a warning sign about how expensive the AI race has become?
#NVIDIA #Meta #Aİ #TechStocks #Investing
121

·
--
O‘suvchi
Sun’iy intellekt va texnologiyalar sohasidagi yirik yangilik!
Xabarga ko‘ra, SpaceX’ning 40 milliard dollarlik ijara kelishuvi Nvidia’ning yangi avlod Vera Rubin chiplarini o‘z ma’lumotlar markazi infratuzilmasiga joriy etishga qaratilgan. Muhim jihati shundaki, ijara SpaceX’ga barcha xarajatlarni oldindan to‘lamasdan hisoblash quvvatini oshirish imkonini berishi mumkin.
Moliyaviy xulosa: Nvidia mahsulotlariga talab ortishi mumkin, SpaceX esa katta kapital majburiyatlari va ijara to‘lovlarini o‘z zimmasiga oladi. Haqiqiy ta’sir kelishuvning tasdiqlanishi va amalga oshirilishiga bog‘liq.
#NVIDIA #SpaceX #AI #Finance
$NVDAB
{spot}(NVDABUSDT)
$SPCXB
{spot}(SPCXBUSDT)
Sun’iy intellekt va texnologiyalar sohasidagi yirik yangilik!
Xabarga ko‘ra, SpaceX’ning 40 milliard dollarlik ijara kelishuvi Nvidia’ning yangi avlod Vera Rubin chiplarini o‘z ma’lumotlar markazi infratuzilmasiga joriy etishga qaratilgan. Muhim jihati shundaki, ijara SpaceX’ga barcha xarajatlarni oldindan to‘lamasdan hisoblash quvvatini oshirish imkonini berishi mumkin.
Moliyaviy xulosa: Nvidia mahsulotlariga talab ortishi mumkin, SpaceX esa katta kapital majburiyatlari va ijara to‘lovlarini o‘z zimmasiga oladi. Haqiqiy ta’sir kelishuvning tasdiqlanishi va amalga oshirilishiga bog‘liq.
#NVIDIA #SpaceX #AI #Finance
$NVDAB
$SPCXB
Xabarga ko‘ra, SpaceX’ning 40 milliard dollarlik ijara kelishuvi Nvidia’ning yangi avlod Vera Rubin chiplarini o‘z ma’lumotlar markazi infratuzilmasiga joriy etishga qaratilgan. Muhim jihati shundaki, ijara SpaceX’ga barcha xarajatlarni oldindan to‘lamasdan hisoblash quvvatini oshirish imkonini berishi mumkin.
Moliyaviy xulosa: Nvidia mahsulotlariga talab ortishi mumkin, SpaceX esa katta kapital majburiyatlari va ijara to‘lovlarini o‘z zimmasiga oladi. Haqiqiy ta’sir kelishuvning tasdiqlanishi va amalga oshirilishiga bog‘liq.
#NVIDIA #SpaceX #AI #Finance
$NVDAB
$SPCXB
131

·
--
Tarjimani ko‘rish
NVIDIA × META | KOLABORASI AI
🚀EKOSISTEM AI TERUS BERKEMBANG!
Kolaborasi Nvidia dan Meta menyoroti besarnya kebutuhan komputasi untuk pengembangan AI. Ekspansi infrastruktur dan pusat data berpotensi membuka peluang bagi perusahaan teknologi terkait.
🎯Saham yang perlu dipantau:
- NVDA: Chip dan komputasi AI.
- META: Pengembangan AI dan pusat data.
- CRWV: Infrastruktur cloud berbasis GPU.
💡Fokus pasar: Permintaan chip AI, belanja pusat data, dan prospek pertumbuhan bisnis.
⚠️Pantau volatilitas dan lakukan riset sebelum mengambil keputusan investasi. #NVIDIA #META #CRWV #AI
NVIDIA × META | KOLABORASI AI
🚀EKOSISTEM AI TERUS BERKEMBANG!
Kolaborasi Nvidia dan Meta menyoroti besarnya kebutuhan komputasi untuk pengembangan AI. Ekspansi infrastruktur dan pusat data berpotensi membuka peluang bagi perusahaan teknologi terkait.
🎯Saham yang perlu dipantau:
- NVDA: Chip dan komputasi AI.
- META: Pengembangan AI dan pusat data.
- CRWV: Infrastruktur cloud berbasis GPU.
💡Fokus pasar: Permintaan chip AI, belanja pusat data, dan prospek pertumbuhan bisnis.
⚠️Pantau volatilitas dan lakukan riset sebelum mengambil keputusan investasi. #NVIDIA #META #CRWV #AI
🚀EKOSISTEM AI TERUS BERKEMBANG!
Kolaborasi Nvidia dan Meta menyoroti besarnya kebutuhan komputasi untuk pengembangan AI. Ekspansi infrastruktur dan pusat data berpotensi membuka peluang bagi perusahaan teknologi terkait.
🎯Saham yang perlu dipantau:
- NVDA: Chip dan komputasi AI.
- META: Pengembangan AI dan pusat data.
- CRWV: Infrastruktur cloud berbasis GPU.
💡Fokus pasar: Permintaan chip AI, belanja pusat data, dan prospek pertumbuhan bisnis.
⚠️Pantau volatilitas dan lakukan riset sebelum mengambil keputusan investasi. #NVIDIA #META #CRWV #AI
117
Tarjimani ko‘rish
NVIDIA (NVDA) is around $217.94, up about 2.4% today.
NVIDIA and Meta just expanded their AI partnership: Meta plans to deploy more NVIDIA systems, and NVIDIA will invest $3B in Meta.
That’s a powerful vote of confidence in AI agents—but when a supplier also invests in a major customer, investors may ask how much demand is truly independent.
My lean: bullish on the expanding AI ecosystem, with that customer-funding question worth watching.
Does this deal confirm durable demand—or blur the line between customer growth and supplier support?
#NVDA #NVIDIA #Semiconductors #meta
NVIDIA (NVDA) is around $217.94, up about 2.4% today.
NVIDIA and Meta just expanded their AI partnership: Meta plans to deploy more NVIDIA systems, and NVIDIA will invest $3B in Meta.
That’s a powerful vote of confidence in AI agents—but when a supplier also invests in a major customer, investors may ask how much demand is truly independent.
My lean: bullish on the expanding AI ecosystem, with that customer-funding question worth watching.
Does this deal confirm durable demand—or blur the line between customer growth and supplier support?
#NVDA #NVIDIA #Semiconductors #meta
NVIDIA and Meta just expanded their AI partnership: Meta plans to deploy more NVIDIA systems, and NVIDIA will invest $3B in Meta.
That’s a powerful vote of confidence in AI agents—but when a supplier also invests in a major customer, investors may ask how much demand is truly independent.
My lean: bullish on the expanding AI ecosystem, with that customer-funding question worth watching.
Does this deal confirm durable demand—or blur the line between customer growth and supplier support?
#NVDA #NVIDIA #Semiconductors #meta
124
Ko‘proq kontentni ko‘rish uchun tizimga kiring
Binance Square'da global kriptovalyuta foydalanuvchilariga qo‘shiling
⚡️ Kriptovalyuta haqida eng so‘nggi va foydali ma’lumotlarni oling.
💬 Dunyoning eng yirik kriptovalyuta birjasi tomonidan ishonchli deb topilgan.
👍 Tasdiqlangan mualliflardan haqiqiy tahlillarni kashf eting.
Email / telefon raqami
Trenddagi mavzular
1
#BinanceProcesses$4.65BWithdrawals
56,378 marta koʻrilgan
239 muhokama qilmoqda
2
#WithdrawalsBack: 15 networks live
12,843 marta koʻrilgan
179 muhokama qilmoqda
3
#EthereumSurpasses$2300
2,234 marta koʻrilgan
48 muhokama qilmoqda
4
#BitcoinSpotETFsPost$203MWeeklyOutflow
2,753 marta koʻrilgan
30 muhokama qilmoqda
5
#SouthKoreanLawmakerProposesReviewOfAllListedDigitalAssets
1,155 marta koʻrilgan
33 muhokama qilmoqda
6
#BrazilVirtualAssetLicenseDeadlineDrawsAbout40Firms
21,890 marta koʻrilgan
375 muhokama qilmoqda
7
#BTCPayServerUrgesOperatorsToShutDownInstances
17,258 marta koʻrilgan
320 muhokama qilmoqda
8
#BankOfKoreaSurveysFinancialFirmsOnVirtualAssetRisks
562 marta koʻrilgan
18 muhokama qilmoqda
9
#StudyFindsCircleAIAgentWalletLimitsCanBeBypassed
11,669 marta koʻrilgan
201 muhokama qilmoqda
10
#BinanceHadAlreadyCovered$6BofHackLoss
14,583 marta koʻrilgan
147 muhokama qilmoqda