
#stockanalysis
stockanalysis
37,129 views
185 Discussing
Hot
Latest

·
--
Bullish
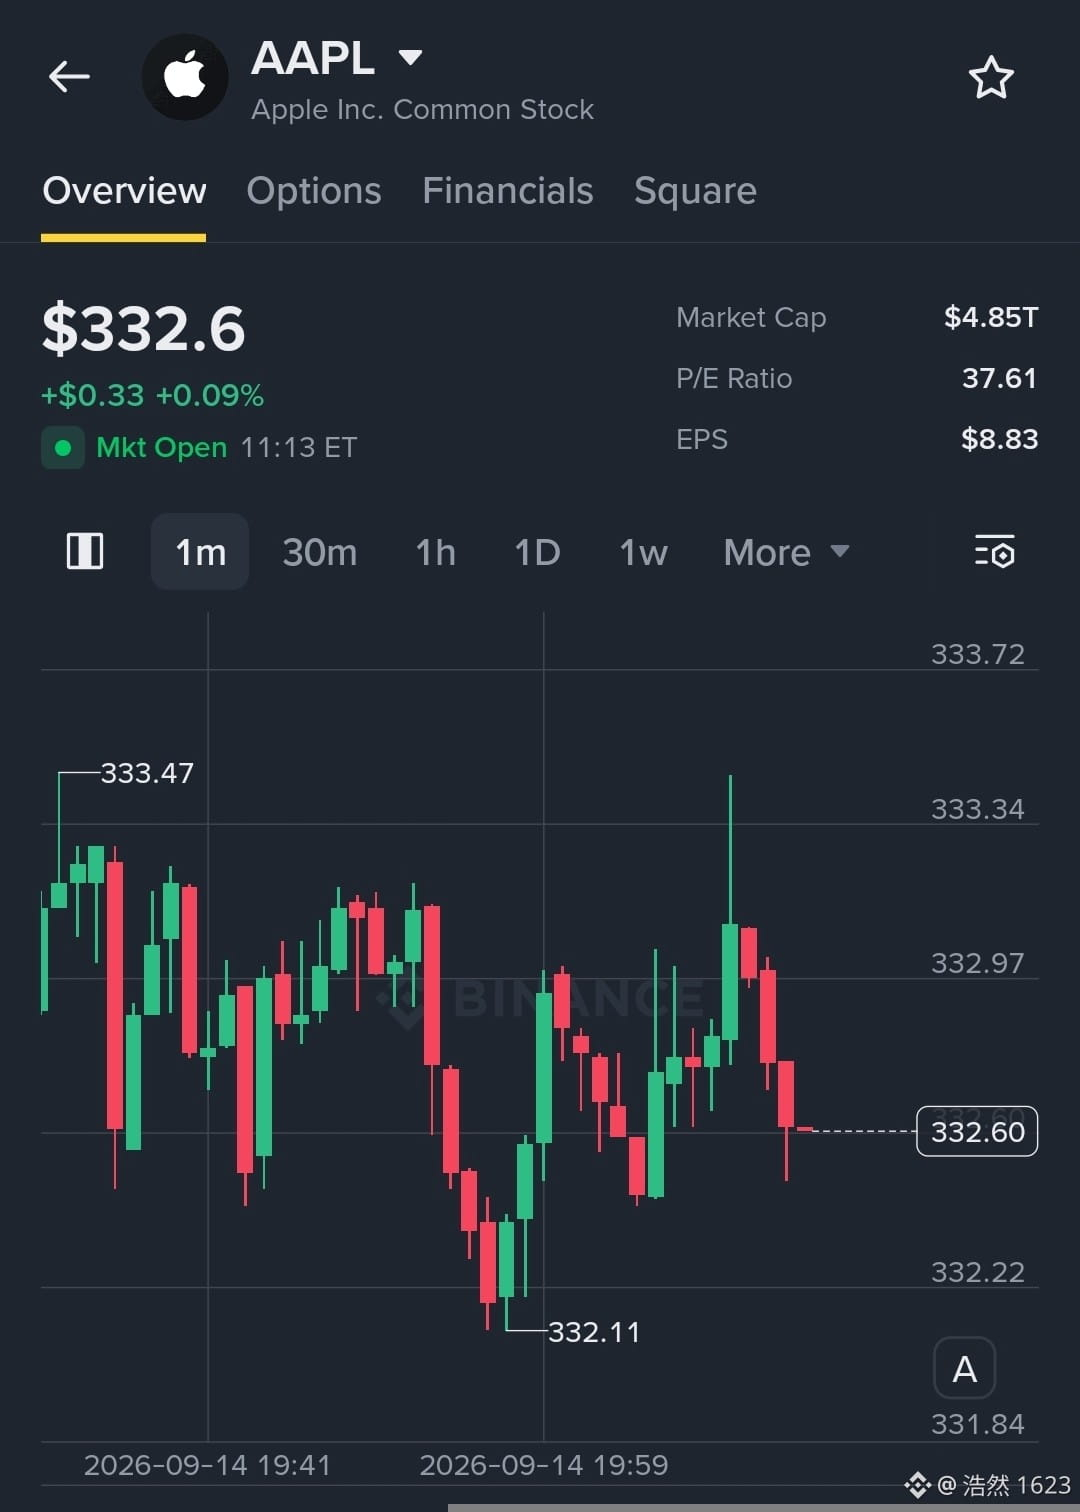
$AAPL is consolidating inside a tight intra-day range, trading near 332.60 after finding solid dynamic support around 332.11. The 1-minute chart indicates active buyer defense at lower levels, with price attempting to build momentum for a retest of upper local resistance around 333.47. Sustaining above the current consolidation floor keeps short-term bullish continuation scenarios in play.
Target 1: 333.50
Target 2: 335.00
Target 3: 337.20
#AAPL #StockAnalysis #TradingSetup
$ZEC
{future}(ZECUSDT)
$GOOGL.US
{stock_us}(GOOGL.US)
{future}(AAPLUSDT)
$AAPL is consolidating inside a tight intra-day range, trading near 332.60 after finding solid dynamic support around 332.11. The 1-minute chart indicates active buyer defense at lower levels, with price attempting to build momentum for a retest of upper local resistance around 333.47. Sustaining above the current consolidation floor keeps short-term bullish continuation scenarios in play.
Target 1: 333.50
Target 2: 335.00
Target 3: 337.20
#AAPL #StockAnalysis #TradingSetup
$ZEC
$GOOGL.US
Target 1: 333.50
Target 2: 335.00
Target 3: 337.20
#AAPL #StockAnalysis #TradingSetup
$ZEC
$GOOGL.US
2
73

🎮 $TTWO : The Calm Before the GTA 6 Storm?
Take-Two Interactive ($TTWO) is currently caught between short-term weakness and a potentially massive medium-term catalyst.
📉 SHORT-TERM: Bearish
📈 MEDIUM-TERM: Constructive into GTA 6
After falling sharply from the July highs near $265, TTWO is now trading below its 9 EMA at $222.49. Sellers still have control — but the stock is approaching an important demand zone.
🎯 KEY LEVELS TO WATCH
🟢 $211–214.50 → Demand / POI
This is the current base and recent low zone. Buyers need to defend it.
🔴 $208–210 → Invalidation
A sustained daily close below this area could open the door toward $200–205.
🚀 $220–222.50 → Key Reclaim Zone
If TTWO reclaims this level with strong volume, the next potential targets are $230–235.
🔥 BUT HERE'S THE BIG STORY…
The chart isn't the only thing traders are watching.
GTA 6 is scheduled for November 19, 2026. 🎮
That makes the next few months extremely important for TTWO.
The upcoming Fiscal Q2 2027 earnings, expected around early November, could become the final major fundamental checkpoint before launch.
Traders will be watching for:
• GTA 6 launch-readiness updates
• Pre-order/marketing momentum
• Bookings guidance
• Management commentary
• GTA Online monetization expectations
🧠 THE BIG PICTURE
TTWO could remain volatile as the market tries to price in the GTA 6 opportunity.
The stock has already experienced a significant correction from ~$265, while Wall Street expectations remain considerably higher, with average targets around $290–300.
A great catalyst doesn't guarantee a straight-line move higher.
Expect volatility, profit-taking, and potentially aggressive moves
📌 MY BIAS
$211–222 = Key battle zone
Above $222.50 → momentum could shift bullish toward $230–235.
Below $208–210 → risk of deeper downside toward $200–205.
Above all, November 19, 2026 remains the date everyone is watching. 👀
$TTWO
{future}(TTWOUSDT)
#TradingCommunity
#StockAnalysis
#stockmarketnews
#GTA6trailer
🎮 $TTWO : The Calm Before the GTA 6 Storm?
Take-Two Interactive ($TTWO ) is currently caught between short-term weakness and a potentially massive medium-term catalyst.
📉 SHORT-TERM: Bearish
📈 MEDIUM-TERM: Constructive into GTA 6
After falling sharply from the July highs near $265, TTWO is now trading below its 9 EMA at $222.49. Sellers still have control — but the stock is approaching an important demand zone.
🎯 KEY LEVELS TO WATCH
🟢 $211–214.50 → Demand / POI
This is the current base and recent low zone. Buyers need to defend it.
🔴 $208–210 → Invalidation
A sustained daily close below this area could open the door toward $200–205.
🚀 $220–222.50 → Key Reclaim Zone
If TTWO reclaims this level with strong volume, the next potential targets are $230–235.
🔥 BUT HERE'S THE BIG STORY…
The chart isn't the only thing traders are watching.
GTA 6 is scheduled for November 19, 2026. 🎮
That makes the next few months extremely important for TTWO.
The upcoming Fiscal Q2 2027 earnings, expected around early November, could become the final major fundamental checkpoint before launch.
Traders will be watching for:
• GTA 6 launch-readiness updates
• Pre-order/marketing momentum
• Bookings guidance
• Management commentary
• GTA Online monetization expectations
🧠 THE BIG PICTURE
TTWO could remain volatile as the market tries to price in the GTA 6 opportunity.
The stock has already experienced a significant correction from ~$265, while Wall Street expectations remain considerably higher, with average targets around $290–300.
A great catalyst doesn't guarantee a straight-line move higher.
Expect volatility, profit-taking, and potentially aggressive moves
📌 MY BIAS
$211–222 = Key battle zone
Above $222.50 → momentum could shift bullish toward $230–235.
Below $208–210 → risk of deeper downside toward $200–205.
Above all, November 19, 2026 remains the date everyone is watching. 👀
$TTWO
#TradingCommunity
#StockAnalysis
#stockmarketnews
#GTA6trailer
Take-Two Interactive ($TTWO ) is currently caught between short-term weakness and a potentially massive medium-term catalyst.
📉 SHORT-TERM: Bearish
📈 MEDIUM-TERM: Constructive into GTA 6
After falling sharply from the July highs near $265, TTWO is now trading below its 9 EMA at $222.49. Sellers still have control — but the stock is approaching an important demand zone.
🎯 KEY LEVELS TO WATCH
🟢 $211–214.50 → Demand / POI
This is the current base and recent low zone. Buyers need to defend it.
🔴 $208–210 → Invalidation
A sustained daily close below this area could open the door toward $200–205.
🚀 $220–222.50 → Key Reclaim Zone
If TTWO reclaims this level with strong volume, the next potential targets are $230–235.
🔥 BUT HERE'S THE BIG STORY…
The chart isn't the only thing traders are watching.
GTA 6 is scheduled for November 19, 2026. 🎮
That makes the next few months extremely important for TTWO.
The upcoming Fiscal Q2 2027 earnings, expected around early November, could become the final major fundamental checkpoint before launch.
Traders will be watching for:
• GTA 6 launch-readiness updates
• Pre-order/marketing momentum
• Bookings guidance
• Management commentary
• GTA Online monetization expectations
🧠 THE BIG PICTURE
TTWO could remain volatile as the market tries to price in the GTA 6 opportunity.
The stock has already experienced a significant correction from ~$265, while Wall Street expectations remain considerably higher, with average targets around $290–300.
A great catalyst doesn't guarantee a straight-line move higher.
Expect volatility, profit-taking, and potentially aggressive moves
📌 MY BIAS
$211–222 = Key battle zone
Above $222.50 → momentum could shift bullish toward $230–235.
Below $208–210 → risk of deeper downside toward $200–205.
Above all, November 19, 2026 remains the date everyone is watching. 👀
$TTWO
#TradingCommunity
#StockAnalysis
#stockmarketnews
#GTA6trailer

1
209

·
--
Bullish
$NVDA.US
{stock_us}(NVDA.US)
📈 Market & Stock Update
Current Price:
Nvidia stock is hovering around $230.11 USD (+0.73% in recent trading), which aligns almost exactly with the $230.3 mark.
Near All-Time Highs:
Spurred by massive AI investments, the stock is currently trading just a few dollars away from its closing all-time record of $235.74.
#BinanceSquareTalks #NVIDIA #StockAnalysis
$NVDA.US
📈 Market & Stock Update
Current Price:
Nvidia stock is hovering around $230.11 USD (+0.73% in recent trading), which aligns almost exactly with the $230.3 mark.
Near All-Time Highs:
Spurred by massive AI investments, the stock is currently trading just a few dollars away from its closing all-time record of $235.74.
#BinanceSquareTalks #NVIDIA #StockAnalysis
📈 Market & Stock Update
Current Price:
Nvidia stock is hovering around $230.11 USD (+0.73% in recent trading), which aligns almost exactly with the $230.3 mark.
Near All-Time Highs:
Spurred by massive AI investments, the stock is currently trading just a few dollars away from its closing all-time record of $235.74.
#BinanceSquareTalks #NVIDIA #StockAnalysis
NVDAUS+0.83%
100

·
--
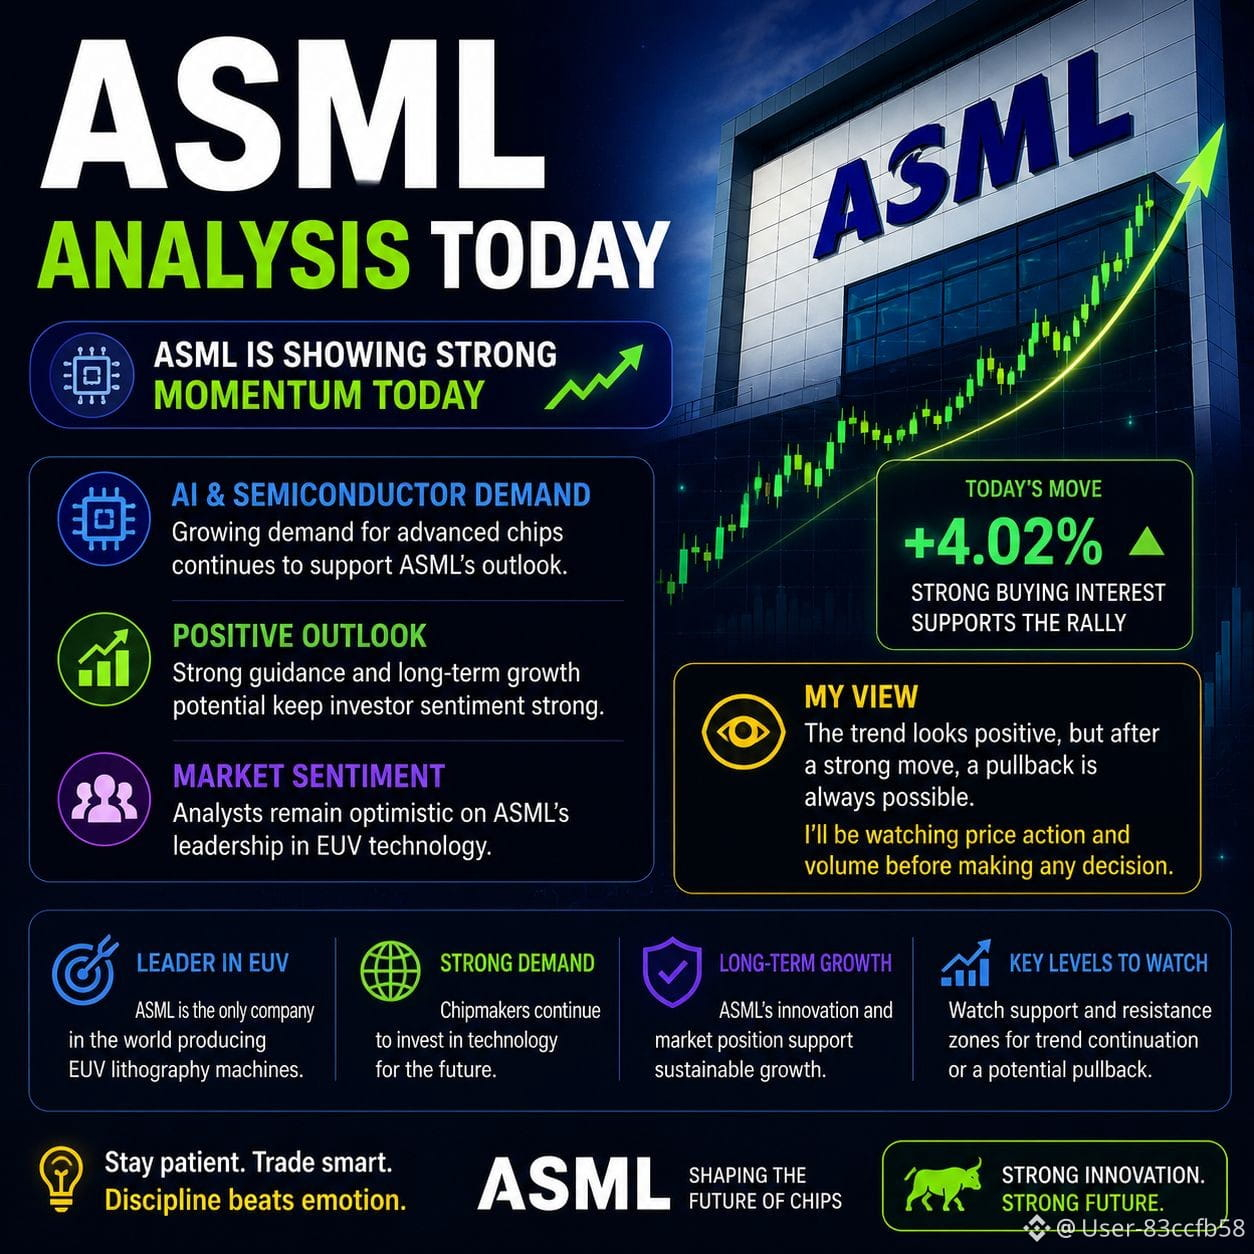
🚀 ASML Analysis Today
$ASML is showing strong momentum today 📈
AI and semiconductor demand continue to support the company, while renewed buying interest is pushing the stock higher.
My view: The trend looks positive, but after a strong move, a pullback is always possible. 👀
I’ll be watching price action and volume before making any decision.
Stay patient. Trade smart. 🧠
#ASML #Stocks #AI #Semiconductors #StockAnalysis
{spot}(ASMLBUSDT)
🚀 ASML Analysis Today
$ASML is showing strong momentum today 📈
AI and semiconductor demand continue to support the company, while renewed buying interest is pushing the stock higher.
My view: The trend looks positive, but after a strong move, a pullback is always possible. 👀
I’ll be watching price action and volume before making any decision.
Stay patient. Trade smart. 🧠
#ASML #Stocks #AI #Semiconductors #StockAnalysis
$ASML is showing strong momentum today 📈
AI and semiconductor demand continue to support the company, while renewed buying interest is pushing the stock higher.
My view: The trend looks positive, but after a strong move, a pullback is always possible. 👀
I’ll be watching price action and volume before making any decision.
Stay patient. Trade smart. 🧠
#ASML #Stocks #AI #Semiconductors #StockAnalysis
53

·
--
💾 SanDisk at $1,481 (-0.83%) — the flash storage OG is in a downtrend, but here's why bears should be cautious.
RSI at 49.1, price 36.6% off highs but 45.8% above lows. This isn't a stock in freefall — it's a stock finding its floor. The MACD histogram just turned positive (+2.57), and when momentum shifts while price is near support, reversals often follow.
📊 Technical Snapshot:
Price: $1,480.77 | SMA5: $1,548 | SMA20: $1,411 | SMA50: $1,636
Trend: Downtrend | Volume: 0.85x average (normal, not panic selling)
Key observation: Price above SMA20 ($1,411) but below SMA5/SMA10 — short-term bearish, medium-term stabilizing
Support at $1,271 is the line in the sand. If that holds, we're looking at a base-building pattern. If it breaks, $1,015 (3-month low) becomes the target.
🎯 Key Levels:
Support: $1,271 (critical — must hold)
Resistance: $2,050 (the mountain to climb)
Strategy: Wait for $1,271 to hold or break before committing. No catching this knife yet.
🤔 Flash storage demand should be growing with AI data centers. Is SNDK a value trap or a value opportunity at these levels?
#SanDisk #FlashStorage #StockAnalysis
⚠️ Disclaimer: Personal market observations, not investment advice. Always conduct your own research before trading stocks.
💾 SanDisk at $1,481 (-0.83%) — the flash storage OG is in a downtrend, but here's why bears should be cautious.
RSI at 49.1, price 36.6% off highs but 45.8% above lows. This isn't a stock in freefall — it's a stock finding its floor. The MACD histogram just turned positive (+2.57), and when momentum shifts while price is near support, reversals often follow.
📊 Technical Snapshot:
Price: $1,480.77 | SMA5: $1,548 | SMA20: $1,411 | SMA50: $1,636
Trend: Downtrend | Volume: 0.85x average (normal, not panic selling)
Key observation: Price above SMA20 ($1,411) but below SMA5/SMA10 — short-term bearish, medium-term stabilizing
Support at $1,271 is the line in the sand. If that holds, we're looking at a base-building pattern. If it breaks, $1,015 (3-month low) becomes the target.
🎯 Key Levels:
Support: $1,271 (critical — must hold)
Resistance: $2,050 (the mountain to climb)
Strategy: Wait for $1,271 to hold or break before committing. No catching this knife yet.
🤔 Flash storage demand should be growing with AI data centers. Is SNDK a value trap or a value opportunity at these levels?
#SanDisk #FlashStorage #StockAnalysis
⚠️ Disclaimer: Personal market observations, not investment advice. Always conduct your own research before trading stocks.
RSI at 49.1, price 36.6% off highs but 45.8% above lows. This isn't a stock in freefall — it's a stock finding its floor. The MACD histogram just turned positive (+2.57), and when momentum shifts while price is near support, reversals often follow.
📊 Technical Snapshot:
Price: $1,480.77 | SMA5: $1,548 | SMA20: $1,411 | SMA50: $1,636
Trend: Downtrend | Volume: 0.85x average (normal, not panic selling)
Key observation: Price above SMA20 ($1,411) but below SMA5/SMA10 — short-term bearish, medium-term stabilizing
Support at $1,271 is the line in the sand. If that holds, we're looking at a base-building pattern. If it breaks, $1,015 (3-month low) becomes the target.
🎯 Key Levels:
Support: $1,271 (critical — must hold)
Resistance: $2,050 (the mountain to climb)
Strategy: Wait for $1,271 to hold or break before committing. No catching this knife yet.
🤔 Flash storage demand should be growing with AI data centers. Is SNDK a value trap or a value opportunity at these levels?
#SanDisk #FlashStorage #StockAnalysis
⚠️ Disclaimer: Personal market observations, not investment advice. Always conduct your own research before trading stocks.
87
·
--
💽 SanDisk (SNDK) at $1,480.77 (-0.83%) in a confirmed downtrend. RSI 49.1 and trading below both the 5-day and 10-day MAs. The storage sector is showing cracks. 🔻
Technical Snapshot:
• Price: $1,480.77 | RSI: 49.1 (neutral-bearish)
• Support: $1,271 | Resistance: $2,050
• 37% below 3-month high — significant weakness
• Volume normal (0.85x) — no capitulation yet
Why This Matters?
When a stock is in a downtrend with neutral RSI, it means the selling isn't panic yet. That's actually dangerous — it means there's still room for more downside before we see a real bottom. The 50-day MA at $1,636 is acting as resistance, not support.
Key Levels: $1,271 support must hold or we test the 3-month low near $1,015. Only a break above $1,636 changes the bearish structure.
Are you brave enough to catch this knife? Or waiting for confirmation? 👇
#SanDisk #StorageTech #StockAnalysis #DYOR
⚠️ Not financial advice. Always manage risk.
💽 SanDisk (SNDK) at $1,480.77 (-0.83%) in a confirmed downtrend. RSI 49.1 and trading below both the 5-day and 10-day MAs. The storage sector is showing cracks. 🔻
Technical Snapshot:
• Price: $1,480.77 | RSI: 49.1 (neutral-bearish)
• Support: $1,271 | Resistance: $2,050
• 37% below 3-month high — significant weakness
• Volume normal (0.85x) — no capitulation yet
Why This Matters?
When a stock is in a downtrend with neutral RSI, it means the selling isn't panic yet. That's actually dangerous — it means there's still room for more downside before we see a real bottom. The 50-day MA at $1,636 is acting as resistance, not support.
Key Levels: $1,271 support must hold or we test the 3-month low near $1,015. Only a break above $1,636 changes the bearish structure.
Are you brave enough to catch this knife? Or waiting for confirmation? 👇
#SanDisk #StorageTech #StockAnalysis #DYOR
⚠️ Not financial advice. Always manage risk.
Technical Snapshot:
• Price: $1,480.77 | RSI: 49.1 (neutral-bearish)
• Support: $1,271 | Resistance: $2,050
• 37% below 3-month high — significant weakness
• Volume normal (0.85x) — no capitulation yet
Why This Matters?
When a stock is in a downtrend with neutral RSI, it means the selling isn't panic yet. That's actually dangerous — it means there's still room for more downside before we see a real bottom. The 50-day MA at $1,636 is acting as resistance, not support.
Key Levels: $1,271 support must hold or we test the 3-month low near $1,015. Only a break above $1,636 changes the bearish structure.
Are you brave enough to catch this knife? Or waiting for confirmation? 👇
#SanDisk #StorageTech #StockAnalysis #DYOR
⚠️ Not financial advice. Always manage risk.
13
·
--
SanDisk down 6.45% — the worst performer in storage today. But the chart tells a more nuanced story.
When SanDisk drops this hard while the broader market is only slightly red, you need to ask: company-specific or sector-wide? The answer matters because SNDK is still above its 20-day SMA.
📊 Technical Snapshot:
• Price: $1,493.12 (down from $1,596.08)
• RSI: 49.6 — neutral territory
• SMA20: $1,391.88 — still holding above
• SMA50: $1,646.41 — resistance overhead
• Volume: 0.98x average — normal, no panic
• 3-month range: $1,016 - $2,335 (36% off highs, 47% above lows)
💡 Key Logic:
Flash memory pricing is the swing factor. The -6.45% drop could be pricing concerns or sector rotation. But stock is holding above the 20-day SMA with normal volume — suggesting a shakeout, not a breakdown.
📍 Key Levels:
• Support: $1,271 (break here targets $1,100)
• Resistance: $2,050 (next major supply zone)
• Buy zone: $1,390-$1,400 (SMA20 retest)
Storage sector: temporary pain or structural shift? What's your read? 📊
⚠️ This is not financial advice. Always do your own research.
#SanDisk #Storage #StockAnalysis #DYOR
SanDisk down 6.45% — the worst performer in storage today. But the chart tells a more nuanced story.
When SanDisk drops this hard while the broader market is only slightly red, you need to ask: company-specific or sector-wide? The answer matters because SNDK is still above its 20-day SMA.
📊 Technical Snapshot:
• Price: $1,493.12 (down from $1,596.08)
• RSI: 49.6 — neutral territory
• SMA20: $1,391.88 — still holding above
• SMA50: $1,646.41 — resistance overhead
• Volume: 0.98x average — normal, no panic
• 3-month range: $1,016 - $2,335 (36% off highs, 47% above lows)
💡 Key Logic:
Flash memory pricing is the swing factor. The -6.45% drop could be pricing concerns or sector rotation. But stock is holding above the 20-day SMA with normal volume — suggesting a shakeout, not a breakdown.
📍 Key Levels:
• Support: $1,271 (break here targets $1,100)
• Resistance: $2,050 (next major supply zone)
• Buy zone: $1,390-$1,400 (SMA20 retest)
Storage sector: temporary pain or structural shift? What's your read? 📊
⚠️ This is not financial advice. Always do your own research.
#SanDisk #Storage #StockAnalysis #DYOR
When SanDisk drops this hard while the broader market is only slightly red, you need to ask: company-specific or sector-wide? The answer matters because SNDK is still above its 20-day SMA.
📊 Technical Snapshot:
• Price: $1,493.12 (down from $1,596.08)
• RSI: 49.6 — neutral territory
• SMA20: $1,391.88 — still holding above
• SMA50: $1,646.41 — resistance overhead
• Volume: 0.98x average — normal, no panic
• 3-month range: $1,016 - $2,335 (36% off highs, 47% above lows)
💡 Key Logic:
Flash memory pricing is the swing factor. The -6.45% drop could be pricing concerns or sector rotation. But stock is holding above the 20-day SMA with normal volume — suggesting a shakeout, not a breakdown.
📍 Key Levels:
• Support: $1,271 (break here targets $1,100)
• Resistance: $2,050 (next major supply zone)
• Buy zone: $1,390-$1,400 (SMA20 retest)
Storage sector: temporary pain or structural shift? What's your read? 📊
⚠️ This is not financial advice. Always do your own research.
#SanDisk #Storage #StockAnalysis #DYOR
27
·
--
Semiconductors are getting crushed today. Micron down 5.83% — buying opportunity or warning sign? 📉
The entire chip sector is in the red: MU -5.83%, SK Hynix -4.55%, SanDisk -6.45%. But Micron is still trading above its 20-day SMA ($896.75), which has been rising. Today's drop could be profit-taking, not a trend reversal.
📊 Technical Snapshot:
• Price: $910.43 (down from $966.78)
• RSI: 48.4 — dead neutral
• SMA20: $896.75 — price above this key support
• SMA50: $962.88 — resistance overhead
• Volume: 0.59x average — declining, no panic selling
• 3-month range: $739 - $1,214 (25% off highs)
💡 Key Logic:
HBM demand from AI data centers is Micron's growth engine. The -5.83% drop on BELOW-average volume tells me this is sector rotation, not fundamental deterioration. $861 support is the line in the sand.
📍 Key Levels:
• Support: $861 (must hold for bullish thesis)
• Resistance: $1,088 (next major supply zone)
• Breakout trigger: close above $963 (SMA50)
Are you buying this semiconductor dip or waiting for more downside? 🤔
⚠️ This is not financial advice. Always do your own research before trading.
#Micron #Semiconductors #StockAnalysis #DYOR
Semiconductors are getting crushed today. Micron down 5.83% — buying opportunity or warning sign? 📉
The entire chip sector is in the red: MU -5.83%, SK Hynix -4.55%, SanDisk -6.45%. But Micron is still trading above its 20-day SMA ($896.75), which has been rising. Today's drop could be profit-taking, not a trend reversal.
📊 Technical Snapshot:
• Price: $910.43 (down from $966.78)
• RSI: 48.4 — dead neutral
• SMA20: $896.75 — price above this key support
• SMA50: $962.88 — resistance overhead
• Volume: 0.59x average — declining, no panic selling
• 3-month range: $739 - $1,214 (25% off highs)
💡 Key Logic:
HBM demand from AI data centers is Micron's growth engine. The -5.83% drop on BELOW-average volume tells me this is sector rotation, not fundamental deterioration. $861 support is the line in the sand.
📍 Key Levels:
• Support: $861 (must hold for bullish thesis)
• Resistance: $1,088 (next major supply zone)
• Breakout trigger: close above $963 (SMA50)
Are you buying this semiconductor dip or waiting for more downside? 🤔
⚠️ This is not financial advice. Always do your own research before trading.
#Micron #Semiconductors #StockAnalysis #DYOR
The entire chip sector is in the red: MU -5.83%, SK Hynix -4.55%, SanDisk -6.45%. But Micron is still trading above its 20-day SMA ($896.75), which has been rising. Today's drop could be profit-taking, not a trend reversal.
📊 Technical Snapshot:
• Price: $910.43 (down from $966.78)
• RSI: 48.4 — dead neutral
• SMA20: $896.75 — price above this key support
• SMA50: $962.88 — resistance overhead
• Volume: 0.59x average — declining, no panic selling
• 3-month range: $739 - $1,214 (25% off highs)
💡 Key Logic:
HBM demand from AI data centers is Micron's growth engine. The -5.83% drop on BELOW-average volume tells me this is sector rotation, not fundamental deterioration. $861 support is the line in the sand.
📍 Key Levels:
• Support: $861 (must hold for bullish thesis)
• Resistance: $1,088 (next major supply zone)
• Breakout trigger: close above $963 (SMA50)
Are you buying this semiconductor dip or waiting for more downside? 🤔
⚠️ This is not financial advice. Always do your own research before trading.
#Micron #Semiconductors #StockAnalysis #DYOR
50
·
--
💿 SanDisk at $1,596 -- up 57% from lows and the storage narrative is just getting started.
SNDK pulled back slightly (-0.28%) with RSI at 53.8 -- textbook neutral territory. The stock is trading between its 10-day MA ($1,520) and 50-day MA ($1,654), creating a decision zone. Volume is normal, suggesting no urgency to sell.
💡 Why Watch This?
Flash storage demand is surging thanks to AI data centers, enterprise SSD adoption, and edge computing. SNDK bounced from $1,016 lows and has been grinding higher. The pullback from $1,635 highs to $1,596 is healthy profit-taking, not trend reversal.
📊 Key Levels:
- Support: $1,271 (major breakout level)
- Resistance: $2,050 (3-month high zone)
- Hold above $1,500 = bullish continuation
Storage stocks: overlooked gem or value trap? Drop your take 👇
#SanDisk #Storage #StockAnalysis
⚠️ Disclaimer: This is not financial advice. Always do your own research (DYOR) before making any investment decisions. Trade responsibly and only risk what you can afford to lose.
💿 SanDisk at $1,596 -- up 57% from lows and the storage narrative is just getting started.
SNDK pulled back slightly (-0.28%) with RSI at 53.8 -- textbook neutral territory. The stock is trading between its 10-day MA ($1,520) and 50-day MA ($1,654), creating a decision zone. Volume is normal, suggesting no urgency to sell.
💡 Why Watch This?
Flash storage demand is surging thanks to AI data centers, enterprise SSD adoption, and edge computing. SNDK bounced from $1,016 lows and has been grinding higher. The pullback from $1,635 highs to $1,596 is healthy profit-taking, not trend reversal.
📊 Key Levels:
- Support: $1,271 (major breakout level)
- Resistance: $2,050 (3-month high zone)
- Hold above $1,500 = bullish continuation
Storage stocks: overlooked gem or value trap? Drop your take 👇
#SanDisk #Storage #StockAnalysis
⚠️ Disclaimer: This is not financial advice. Always do your own research (DYOR) before making any investment decisions. Trade responsibly and only risk what you can afford to lose.
SNDK pulled back slightly (-0.28%) with RSI at 53.8 -- textbook neutral territory. The stock is trading between its 10-day MA ($1,520) and 50-day MA ($1,654), creating a decision zone. Volume is normal, suggesting no urgency to sell.
💡 Why Watch This?
Flash storage demand is surging thanks to AI data centers, enterprise SSD adoption, and edge computing. SNDK bounced from $1,016 lows and has been grinding higher. The pullback from $1,635 highs to $1,596 is healthy profit-taking, not trend reversal.
📊 Key Levels:
- Support: $1,271 (major breakout level)
- Resistance: $2,050 (3-month high zone)
- Hold above $1,500 = bullish continuation
Storage stocks: overlooked gem or value trap? Drop your take 👇
#SanDisk #Storage #StockAnalysis
⚠️ Disclaimer: This is not financial advice. Always do your own research (DYOR) before making any investment decisions. Trade responsibly and only risk what you can afford to lose.
57
·
--
💾 Micron at $967 -- semiconductor memory cycle is turning and the market isn't fully pricing it in.
MU pulled back 0.77% to $966.78, sitting right on its 50-day MA ($964). RSI at 54.5 is dead neutral, which means the next big move could come from here. Volume is declining -- that's actually bullish consolidation.
💡 Why Watch This?
AI demand for HBM (High Bandwidth Memory) is exploding and Micron is one of only three companies that can supply it. The stock bounced from $739 to $967 (+30%) and is now digesting gains. Memory pricing is inflecting upward -- classic cycle turn.
📊 Key Levels:
- Support: $853 (50-day MA zone)
- Resistance: $1,088 (recent highs)
- Breakout above $1,000 = new leg up
Is the memory supercycle just beginning or already priced in? 👇
#Micron #Semiconductors #StockAnalysis
⚠️ Disclaimer: This is not financial advice. Always do your own research (DYOR) before making any investment decisions. Trade responsibly and only risk what you can afford to lose.
💾 Micron at $967 -- semiconductor memory cycle is turning and the market isn't fully pricing it in.
MU pulled back 0.77% to $966.78, sitting right on its 50-day MA ($964). RSI at 54.5 is dead neutral, which means the next big move could come from here. Volume is declining -- that's actually bullish consolidation.
💡 Why Watch This?
AI demand for HBM (High Bandwidth Memory) is exploding and Micron is one of only three companies that can supply it. The stock bounced from $739 to $967 (+30%) and is now digesting gains. Memory pricing is inflecting upward -- classic cycle turn.
📊 Key Levels:
- Support: $853 (50-day MA zone)
- Resistance: $1,088 (recent highs)
- Breakout above $1,000 = new leg up
Is the memory supercycle just beginning or already priced in? 👇
#Micron #Semiconductors #StockAnalysis
⚠️ Disclaimer: This is not financial advice. Always do your own research (DYOR) before making any investment decisions. Trade responsibly and only risk what you can afford to lose.
MU pulled back 0.77% to $966.78, sitting right on its 50-day MA ($964). RSI at 54.5 is dead neutral, which means the next big move could come from here. Volume is declining -- that's actually bullish consolidation.
💡 Why Watch This?
AI demand for HBM (High Bandwidth Memory) is exploding and Micron is one of only three companies that can supply it. The stock bounced from $739 to $967 (+30%) and is now digesting gains. Memory pricing is inflecting upward -- classic cycle turn.
📊 Key Levels:
- Support: $853 (50-day MA zone)
- Resistance: $1,088 (recent highs)
- Breakout above $1,000 = new leg up
Is the memory supercycle just beginning or already priced in? 👇
#Micron #Semiconductors #StockAnalysis
⚠️ Disclaimer: This is not financial advice. Always do your own research (DYOR) before making any investment decisions. Trade responsibly and only risk what you can afford to lose.
13

·
--
$SNDKB
{spot}(SNDKBUSDT)
SNDK Are go the Moon
🔥 SNDK Stock Price Action Analysis: Rebound or Trap? 📈
Looking at the latest chart for $SNDK, we are seeing intense price movement following a notable shift in momentum!
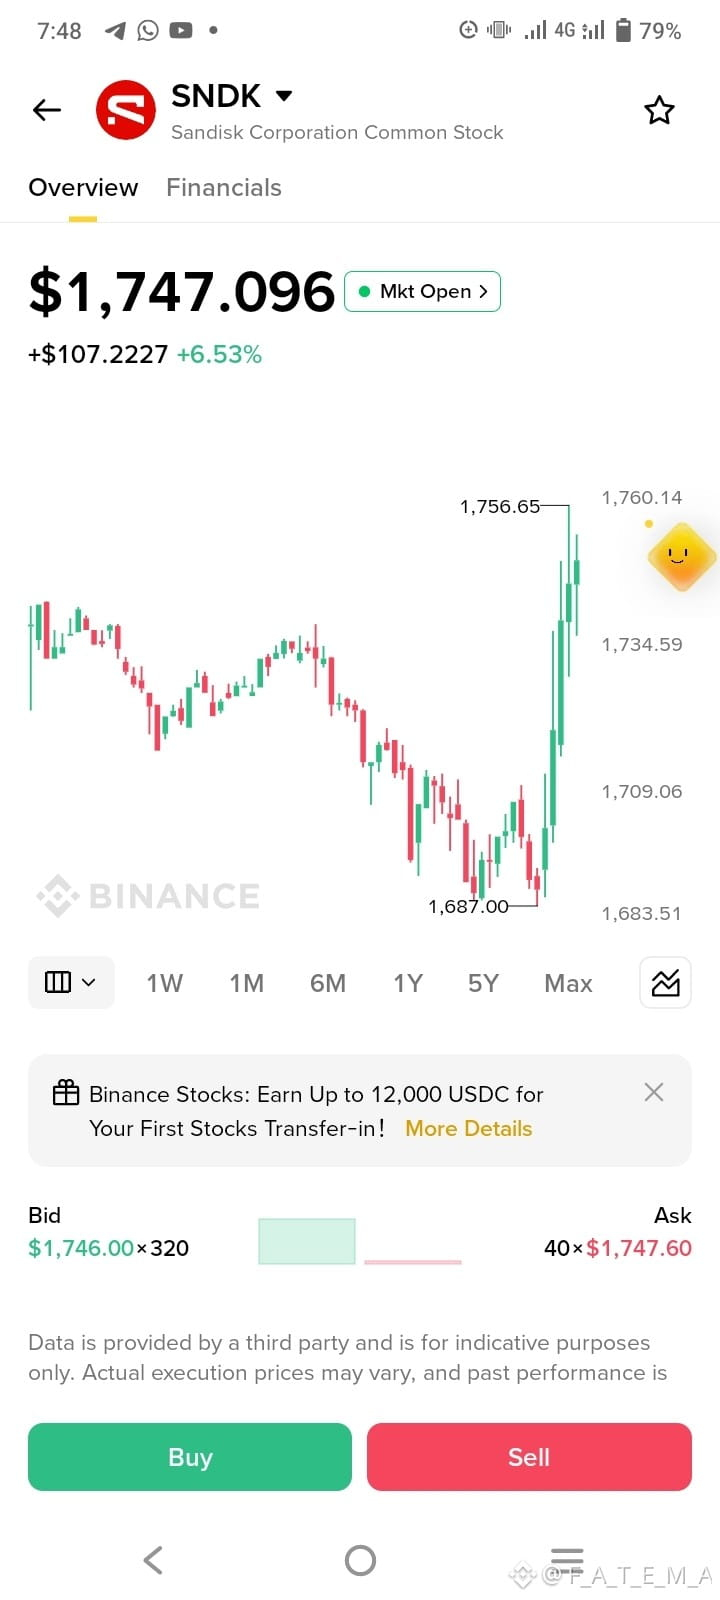
After bottoming out near the 1,687.00 support level, buyers stepped in aggressively, pushing the price up by +6.53% to test the current level around **$1,747.096**.
📊 **Technical Breakdown:
Recent Low:
1,687.00 (Strong accumulation and buyer defense zone)
Local Peak / Resistance:
1,756.65 — 1,760.14 (Immediate overhead supply zone where sellers are defending)
Current Trend:
Sharp bullish recovery candles indicating strong short-term momentum, though approaching critical resistance.
🎯 **What to Watch Next:**
1. **Bullish Scenario:
A clean break and consolidation above the 1,760 resistance level could pave the way for continued upward momentum.
2. Bearish / Pullback Scenario:
If buying pressure stalls here, expect a healthy retracement to test lower support levels before the next leg up.
Always manage your risk tightly and wait for confirmation before opening positions during high volatility.
Disclaimer:
This analysis is for educational and informational purposes only and does not constitute financial advice. Always DYOR!*
#BinanceSquareFamily #StockAnalysis #trading #MarketUpdate #Investing
$SNDKB
SNDK Are go the Moon
🔥 SNDK Stock Price Action Analysis: Rebound or Trap? 📈
Looking at the latest chart for $SNDK, we are seeing intense price movement following a notable shift in momentum!
After bottoming out near the 1,687.00 support level, buyers stepped in aggressively, pushing the price up by +6.53% to test the current level around **$1,747.096**.
📊 **Technical Breakdown:
Recent Low:
1,687.00 (Strong accumulation and buyer defense zone)
Local Peak / Resistance:
1,756.65 — 1,760.14 (Immediate overhead supply zone where sellers are defending)
Current Trend:
Sharp bullish recovery candles indicating strong short-term momentum, though approaching critical resistance.
🎯 **What to Watch Next:**
1. **Bullish Scenario:
A clean break and consolidation above the 1,760 resistance level could pave the way for continued upward momentum.
2. Bearish / Pullback Scenario:
If buying pressure stalls here, expect a healthy retracement to test lower support levels before the next leg up.
Always manage your risk tightly and wait for confirmation before opening positions during high volatility.
Disclaimer:
This analysis is for educational and informational purposes only and does not constitute financial advice. Always DYOR!*
#BinanceSquareFamily #StockAnalysis #trading #MarketUpdate #Investing
SNDK Are go the Moon
🔥 SNDK Stock Price Action Analysis: Rebound or Trap? 📈
Looking at the latest chart for $SNDK, we are seeing intense price movement following a notable shift in momentum!
After bottoming out near the 1,687.00 support level, buyers stepped in aggressively, pushing the price up by +6.53% to test the current level around **$1,747.096**.
📊 **Technical Breakdown:
Recent Low:
1,687.00 (Strong accumulation and buyer defense zone)
Local Peak / Resistance:
1,756.65 — 1,760.14 (Immediate overhead supply zone where sellers are defending)
Current Trend:
Sharp bullish recovery candles indicating strong short-term momentum, though approaching critical resistance.
🎯 **What to Watch Next:**
1. **Bullish Scenario:
A clean break and consolidation above the 1,760 resistance level could pave the way for continued upward momentum.
2. Bearish / Pullback Scenario:
If buying pressure stalls here, expect a healthy retracement to test lower support levels before the next leg up.
Always manage your risk tightly and wait for confirmation before opening positions during high volatility.
Disclaimer:
This analysis is for educational and informational purposes only and does not constitute financial advice. Always DYOR!*
#BinanceSquareFamily #StockAnalysis #trading #MarketUpdate #Investing
105

·
--
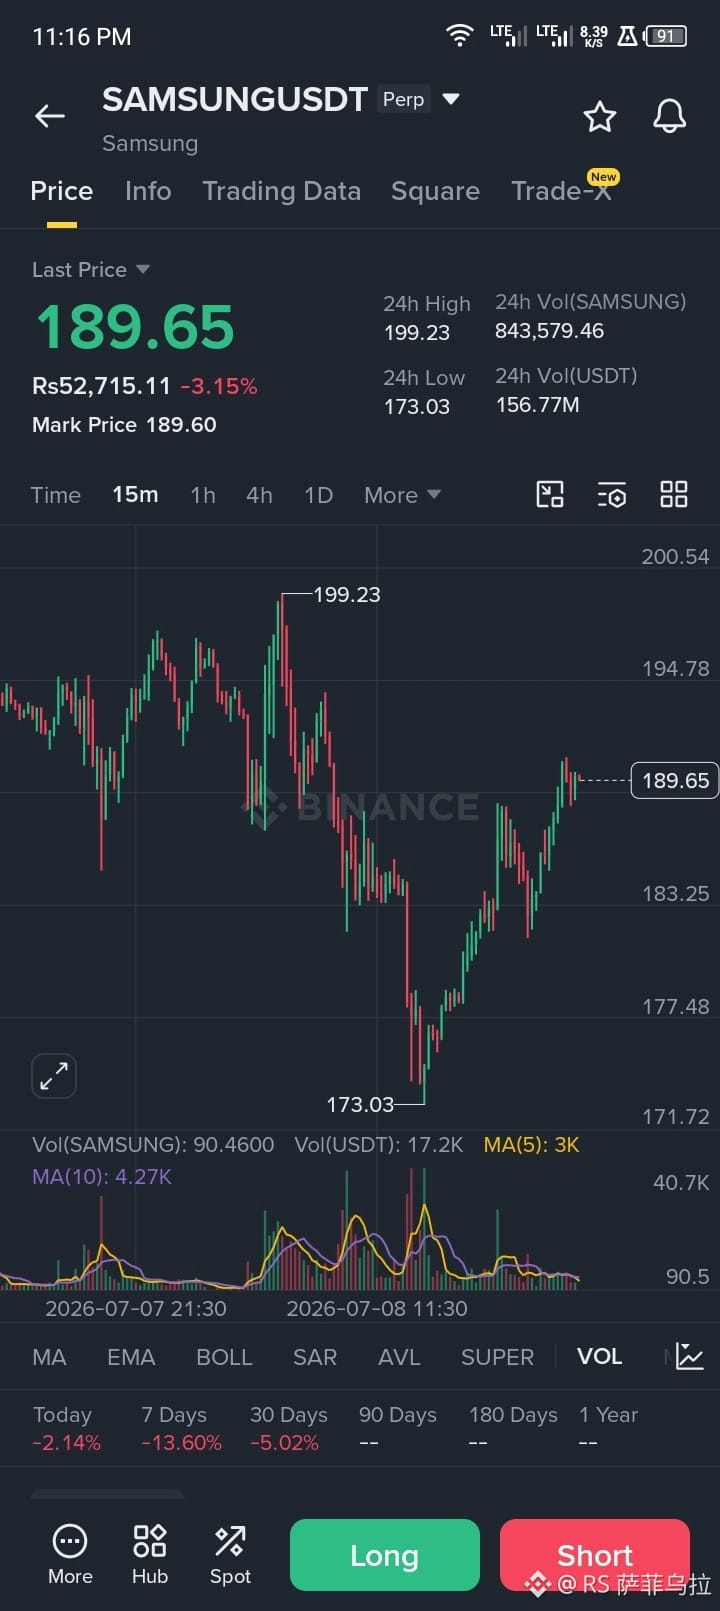
SAMSUNGUSDT Perpetual Contract tracks the stock price of Samsung Electronics Co., Ltd. Samsung Electronics is a global technology leader with businesses spanning semiconductors, smartphones, consumer electronics, and display panels, holding strong positions in memory chips, mobile devices, and home appliances.$SAMSUNG
{future}(SAMSUNGUSDT)
#rssafi #Samsung #StockAnalysis
SAMSUNGUSDT Perpetual Contract tracks the stock price of Samsung Electronics Co., Ltd. Samsung Electronics is a global technology leader with businesses spanning semiconductors, smartphones, consumer electronics, and display panels, holding strong positions in memory chips, mobile devices, and home appliances.$SAMSUNG
#rssafi #Samsung #StockAnalysis
#rssafi #Samsung #StockAnalysis
87
·
--
SanDisk: Down 45% from highs but volume just surged 60% above average. Someone's buying 👀
SNDK at $1,288 (+0.63%) — barely green on the day, but the volume story is what caught my attention. 14.3M shares traded vs 8.9M average. That's institutional activity.
🔬 Technical Snapshot:
• Trend: Downtrend
• RSI: 40.7 (bearish but approaching oversold)
• MACD: -161.74 (negative)
• Volume: 14.3M (1.6x normal — significant!)
📊 Key Levels:
• Support: $1,333 (immediate floor)
• Resistance: $2,050 (the comeback target)
• 3-month low: $1,015.89
High volume on a small green day after a massive selloff? That's the pattern smart money leaves behind when they're quietly accumulating.
The storage sector is cyclical. We might be early in the bottoming process.
Storage sector: bottom is in or more pain ahead? 📦
#SanDisk #Storage #StockAnalysis #DYOR
⚠️ Disclaimer: This is not financial advice. Always do your own research.
SanDisk: Down 45% from highs but volume just surged 60% above average. Someone's buying 👀
SNDK at $1,288 (+0.63%) — barely green on the day, but the volume story is what caught my attention. 14.3M shares traded vs 8.9M average. That's institutional activity.
🔬 Technical Snapshot:
• Trend: Downtrend
• RSI: 40.7 (bearish but approaching oversold)
• MACD: -161.74 (negative)
• Volume: 14.3M (1.6x normal — significant!)
📊 Key Levels:
• Support: $1,333 (immediate floor)
• Resistance: $2,050 (the comeback target)
• 3-month low: $1,015.89
High volume on a small green day after a massive selloff? That's the pattern smart money leaves behind when they're quietly accumulating.
The storage sector is cyclical. We might be early in the bottoming process.
Storage sector: bottom is in or more pain ahead? 📦
#SanDisk #Storage #StockAnalysis #DYOR
⚠️ Disclaimer: This is not financial advice. Always do your own research.
SNDK at $1,288 (+0.63%) — barely green on the day, but the volume story is what caught my attention. 14.3M shares traded vs 8.9M average. That's institutional activity.
🔬 Technical Snapshot:
• Trend: Downtrend
• RSI: 40.7 (bearish but approaching oversold)
• MACD: -161.74 (negative)
• Volume: 14.3M (1.6x normal — significant!)
📊 Key Levels:
• Support: $1,333 (immediate floor)
• Resistance: $2,050 (the comeback target)
• 3-month low: $1,015.89
High volume on a small green day after a massive selloff? That's the pattern smart money leaves behind when they're quietly accumulating.
The storage sector is cyclical. We might be early in the bottoming process.
Storage sector: bottom is in or more pain ahead? 📦
#SanDisk #Storage #StockAnalysis #DYOR
⚠️ Disclaimer: This is not financial advice. Always do your own research.
6
·
--
Memory stocks are WAKING UP 💾 Micron (MU) just ripped +7.6% — and this isn't random.
The semiconductor cycle is turning, and memory chips are leading the charge. AI data centers don't build themselves.
📊 Technical Snapshot:
• Price: $892.67 (+7.62%)
• RSI: 48.8 (neutral — plenty of room to run)
• Price above SMA5 ($832) and SMA10 ($875) ✅
• MACD improving — momentum shifting bullish
• Volume: 37.3M shares (normal — could be stronger)
Still -26.4% from 3-month high ($1,214). If the memory recovery thesis plays out, there's significant upside from here.
📌 Key Levels:
Support: $830 (recent low) → then $732 (3-month floor)
Resistance: $901 (SMA20) → then $1,088
Why This Matters:
HBM (High Bandwidth Memory) demand for AI training is insatiable. Every new AI data center = more MU chips. The cycle is early.
MU breaking above $900 (SMA20) would be a major bullish confirmation. Watch for it.
Are memory stocks the smartest semiconductor play right now? 🤔
#Micron #Semiconductors #StockAnalysis
⚠️ This is not financial advice. Always do your own research. Past performance does not guarantee future results.
Memory stocks are WAKING UP 💾 Micron (MU) just ripped +7.6% — and this isn't random.
The semiconductor cycle is turning, and memory chips are leading the charge. AI data centers don't build themselves.
📊 Technical Snapshot:
• Price: $892.67 (+7.62%)
• RSI: 48.8 (neutral — plenty of room to run)
• Price above SMA5 ($832) and SMA10 ($875) ✅
• MACD improving — momentum shifting bullish
• Volume: 37.3M shares (normal — could be stronger)
Still -26.4% from 3-month high ($1,214). If the memory recovery thesis plays out, there's significant upside from here.
📌 Key Levels:
Support: $830 (recent low) → then $732 (3-month floor)
Resistance: $901 (SMA20) → then $1,088
Why This Matters:
HBM (High Bandwidth Memory) demand for AI training is insatiable. Every new AI data center = more MU chips. The cycle is early.
MU breaking above $900 (SMA20) would be a major bullish confirmation. Watch for it.
Are memory stocks the smartest semiconductor play right now? 🤔
#Micron #Semiconductors #StockAnalysis
⚠️ This is not financial advice. Always do your own research. Past performance does not guarantee future results.
The semiconductor cycle is turning, and memory chips are leading the charge. AI data centers don't build themselves.
📊 Technical Snapshot:
• Price: $892.67 (+7.62%)
• RSI: 48.8 (neutral — plenty of room to run)
• Price above SMA5 ($832) and SMA10 ($875) ✅
• MACD improving — momentum shifting bullish
• Volume: 37.3M shares (normal — could be stronger)
Still -26.4% from 3-month high ($1,214). If the memory recovery thesis plays out, there's significant upside from here.
📌 Key Levels:
Support: $830 (recent low) → then $732 (3-month floor)
Resistance: $901 (SMA20) → then $1,088
Why This Matters:
HBM (High Bandwidth Memory) demand for AI training is insatiable. Every new AI data center = more MU chips. The cycle is early.
MU breaking above $900 (SMA20) would be a major bullish confirmation. Watch for it.
Are memory stocks the smartest semiconductor play right now? 🤔
#Micron #Semiconductors #StockAnalysis
⚠️ This is not financial advice. Always do your own research. Past performance does not guarantee future results.
4
·
--
💾 SanDisk (SNDK) down -3.68% today — the storage sector is getting hammered alongside its chip peers. Is this a buying opportunity?
$1,212.21 with RSI at 41.6 — leaning bearish. Price is well below SMA20 ($1,393) and SMA50 ($1,688), confirming the strong downtrend. But volume at 1.15x average shows conviction behind the selling.
📊 Technical Snapshot:
• Price: $1,212.21 | Trend: Strong Downtrend
• RSI: 41.6 (bearish, approaching oversold)
• MACD: Negative and expanding
• 48.1% below 3-month high
• Volume: Slightly above average (1.15x)
🧠 Key Logic:
SanDisk benefits from the same AI/data center tail as Micron and SK Hynix, but it's getting caught in the sector-wide rotation out of semiconductors. The elevated volume suggests institutional selling, not just retail panic. When institutions sell into strength, it usually means they see a longer correction ahead.
📍 Key Levels:
• Support: $1,280 (SMA20 — broken, now resistance)
• Actual support: $1,016 (3-month low)
• Resistance: $1,307 (SMA5) → $1,393 (SMA20)
The memory chip sector is in pain. Temporary shakeout or structural shift? 👇
#SanDisk #Storage #StockAnalysis
⚠️ Disclaimer: Not financial advice. Always DYOR before investing. Sector rotations can last longer than expected.
💾 SanDisk (SNDK) down -3.68% today — the storage sector is getting hammered alongside its chip peers. Is this a buying opportunity?
$1,212.21 with RSI at 41.6 — leaning bearish. Price is well below SMA20 ($1,393) and SMA50 ($1,688), confirming the strong downtrend. But volume at 1.15x average shows conviction behind the selling.
📊 Technical Snapshot:
• Price: $1,212.21 | Trend: Strong Downtrend
• RSI: 41.6 (bearish, approaching oversold)
• MACD: Negative and expanding
• 48.1% below 3-month high
• Volume: Slightly above average (1.15x)
🧠 Key Logic:
SanDisk benefits from the same AI/data center tail as Micron and SK Hynix, but it's getting caught in the sector-wide rotation out of semiconductors. The elevated volume suggests institutional selling, not just retail panic. When institutions sell into strength, it usually means they see a longer correction ahead.
📍 Key Levels:
• Support: $1,280 (SMA20 — broken, now resistance)
• Actual support: $1,016 (3-month low)
• Resistance: $1,307 (SMA5) → $1,393 (SMA20)
The memory chip sector is in pain. Temporary shakeout or structural shift? 👇
#SanDisk #Storage #StockAnalysis
⚠️ Disclaimer: Not financial advice. Always DYOR before investing. Sector rotations can last longer than expected.
$1,212.21 with RSI at 41.6 — leaning bearish. Price is well below SMA20 ($1,393) and SMA50 ($1,688), confirming the strong downtrend. But volume at 1.15x average shows conviction behind the selling.
📊 Technical Snapshot:
• Price: $1,212.21 | Trend: Strong Downtrend
• RSI: 41.6 (bearish, approaching oversold)
• MACD: Negative and expanding
• 48.1% below 3-month high
• Volume: Slightly above average (1.15x)
🧠 Key Logic:
SanDisk benefits from the same AI/data center tail as Micron and SK Hynix, but it's getting caught in the sector-wide rotation out of semiconductors. The elevated volume suggests institutional selling, not just retail panic. When institutions sell into strength, it usually means they see a longer correction ahead.
📍 Key Levels:
• Support: $1,280 (SMA20 — broken, now resistance)
• Actual support: $1,016 (3-month low)
• Resistance: $1,307 (SMA5) → $1,393 (SMA20)
The memory chip sector is in pain. Temporary shakeout or structural shift? 👇
#SanDisk #Storage #StockAnalysis
⚠️ Disclaimer: Not financial advice. Always DYOR before investing. Sector rotations can last longer than expected.
1
·
--
🔬 Micron (MU) at $877.57 — the semiconductor sector is under pressure, but here's why this chipmaker might be setting up for a reversal.
MU is down just -0.44% today, consolidating after a brutal run from its 3-month high of $1,213. RSI at 47.5 is neutral, and price is sitting right at its 5-day SMA ($874.88).
📊 Technical Snapshot:
• Price: $877.57 | Trend: Consolidation
• RSI: 47.5 (neutral — room in both directions)
• SMA5: $874.88 (price just above — bullish micro-signal)
• SMA50: $970.95 (27% below — shows the downtrend severity)
• Volume: Declining at 71% of average
🧠 Key Logic:
MU has dropped 27.7% from its 3-month high. The semiconductor cycle is turning — HBM demand for AI is accelerating, and Micron is a primary beneficiary. The consolidation near $877 with declining volume suggests sellers are exhausting. A break above SMA20 ($888) would confirm the reversal.
📍 Key Levels:
• Support: $751 (major)
• Resistance: $888 (SMA20) → $971 (SMA50)
• Entry zone: $853-875 (current consolidation)
Is the semiconductor selloff overdone or just beginning? 🤔
#Micron #Semiconductors #StockAnalysis
⚠️ Disclaimer: Not financial advice. Always do your own research before investing. Past performance ≠ future results.
🔬 Micron (MU) at $877.57 — the semiconductor sector is under pressure, but here's why this chipmaker might be setting up for a reversal.
MU is down just -0.44% today, consolidating after a brutal run from its 3-month high of $1,213. RSI at 47.5 is neutral, and price is sitting right at its 5-day SMA ($874.88).
📊 Technical Snapshot:
• Price: $877.57 | Trend: Consolidation
• RSI: 47.5 (neutral — room in both directions)
• SMA5: $874.88 (price just above — bullish micro-signal)
• SMA50: $970.95 (27% below — shows the downtrend severity)
• Volume: Declining at 71% of average
🧠 Key Logic:
MU has dropped 27.7% from its 3-month high. The semiconductor cycle is turning — HBM demand for AI is accelerating, and Micron is a primary beneficiary. The consolidation near $877 with declining volume suggests sellers are exhausting. A break above SMA20 ($888) would confirm the reversal.
📍 Key Levels:
• Support: $751 (major)
• Resistance: $888 (SMA20) → $971 (SMA50)
• Entry zone: $853-875 (current consolidation)
Is the semiconductor selloff overdone or just beginning? 🤔
#Micron #Semiconductors #StockAnalysis
⚠️ Disclaimer: Not financial advice. Always do your own research before investing. Past performance ≠ future results.
MU is down just -0.44% today, consolidating after a brutal run from its 3-month high of $1,213. RSI at 47.5 is neutral, and price is sitting right at its 5-day SMA ($874.88).
📊 Technical Snapshot:
• Price: $877.57 | Trend: Consolidation
• RSI: 47.5 (neutral — room in both directions)
• SMA5: $874.88 (price just above — bullish micro-signal)
• SMA50: $970.95 (27% below — shows the downtrend severity)
• Volume: Declining at 71% of average
🧠 Key Logic:
MU has dropped 27.7% from its 3-month high. The semiconductor cycle is turning — HBM demand for AI is accelerating, and Micron is a primary beneficiary. The consolidation near $877 with declining volume suggests sellers are exhausting. A break above SMA20 ($888) would confirm the reversal.
📍 Key Levels:
• Support: $751 (major)
• Resistance: $888 (SMA20) → $971 (SMA50)
• Entry zone: $853-875 (current consolidation)
Is the semiconductor selloff overdone or just beginning? 🤔
#Micron #Semiconductors #StockAnalysis
⚠️ Disclaimer: Not financial advice. Always do your own research before investing. Past performance ≠ future results.
11
·
--
SK Hynix is down 51% from its 3-month high. The world's #2 memory chipmaker is screaming "value trap" or "generational buy" — and the chart is giving us clues. 🔍
📊 Technical Snapshot:
Price: ₩1,422,000 (-4.88% today)
RSI: 39 (bearish but approaching oversold)
Trend: Strong downtrend — price below ALL moving averages
Volume: 5M shares, normal range (0.83x avg) — no capitulation yet
SMA50: ₩2,124,500 — that's 49% ABOVE current price. Brutal.
🧠 The Bear Case:
Memory pricing is cyclical, and we're clearly in a downturn phase. SK Hynix's HBM dominance for AI is real, but the market is pricing in a deeper trough than expected. The -51% decline from highs suggests the market expects memory ASPs to bottom later than consensus.
🧠 The Bull Case:
RSI at 39 is approaching oversold. At ₩1,322,000 (the 3-month low), we're only 7.6% away. If that level holds, a mean reversion to SMA20 (₩1,725,300) represents a +21% trade.
📋 Key Levels:
Support: ₩1,322,000 (3-month low — do or die)
Resistance: ₩1,577,000 (first bounce target)
Major resistance: ₩2,628,000 (long-term target)
⚠️ Don't buy here. Wait for either: (a) a confirmed bounce off ₩1,322K with volume, or (b) a break below ₩1,322K to reset your thesis entirely.
Is the memory downturn almost over, or are we just getting started? 💾
#SKHynix #Memory #StockAnalysis
⚠️ This is not financial advice. Korean equities carry currency and market risk. Always DYOR.
SK Hynix is down 51% from its 3-month high. The world's #2 memory chipmaker is screaming "value trap" or "generational buy" — and the chart is giving us clues. 🔍
📊 Technical Snapshot:
Price: ₩1,422,000 (-4.88% today)
RSI: 39 (bearish but approaching oversold)
Trend: Strong downtrend — price below ALL moving averages
Volume: 5M shares, normal range (0.83x avg) — no capitulation yet
SMA50: ₩2,124,500 — that's 49% ABOVE current price. Brutal.
🧠 The Bear Case:
Memory pricing is cyclical, and we're clearly in a downturn phase. SK Hynix's HBM dominance for AI is real, but the market is pricing in a deeper trough than expected. The -51% decline from highs suggests the market expects memory ASPs to bottom later than consensus.
🧠 The Bull Case:
RSI at 39 is approaching oversold. At ₩1,322,000 (the 3-month low), we're only 7.6% away. If that level holds, a mean reversion to SMA20 (₩1,725,300) represents a +21% trade.
📋 Key Levels:
Support: ₩1,322,000 (3-month low — do or die)
Resistance: ₩1,577,000 (first bounce target)
Major resistance: ₩2,628,000 (long-term target)
⚠️ Don't buy here. Wait for either: (a) a confirmed bounce off ₩1,322K with volume, or (b) a break below ₩1,322K to reset your thesis entirely.
Is the memory downturn almost over, or are we just getting started? 💾
#SKHynix #Memory #StockAnalysis
⚠️ This is not financial advice. Korean equities carry currency and market risk. Always DYOR.
📊 Technical Snapshot:
Price: ₩1,422,000 (-4.88% today)
RSI: 39 (bearish but approaching oversold)
Trend: Strong downtrend — price below ALL moving averages
Volume: 5M shares, normal range (0.83x avg) — no capitulation yet
SMA50: ₩2,124,500 — that's 49% ABOVE current price. Brutal.
🧠 The Bear Case:
Memory pricing is cyclical, and we're clearly in a downturn phase. SK Hynix's HBM dominance for AI is real, but the market is pricing in a deeper trough than expected. The -51% decline from highs suggests the market expects memory ASPs to bottom later than consensus.
🧠 The Bull Case:
RSI at 39 is approaching oversold. At ₩1,322,000 (the 3-month low), we're only 7.6% away. If that level holds, a mean reversion to SMA20 (₩1,725,300) represents a +21% trade.
📋 Key Levels:
Support: ₩1,322,000 (3-month low — do or die)
Resistance: ₩1,577,000 (first bounce target)
Major resistance: ₩2,628,000 (long-term target)
⚠️ Don't buy here. Wait for either: (a) a confirmed bounce off ₩1,322K with volume, or (b) a break below ₩1,322K to reset your thesis entirely.
Is the memory downturn almost over, or are we just getting started? 💾
#SKHynix #Memory #StockAnalysis
⚠️ This is not financial advice. Korean equities carry currency and market risk. Always DYOR.
58
·
--
🔻 SK Hynix just dropped -4.88% and is now 51% below its 3-month high. The world's #2 memory maker is in freefall — is this a buying opportunity or a falling knife?
Technical Snapshot:
→ Price: ₩1,422,000
→ RSI: 39 — approaching oversold
→ Trend: Strong downtrend (price < SMA5 < SMA10 < SMA20 < SMA50)
→ Volume: 83% of average — no panic selling, but no conviction buying either
→ 3-month range: ₩1,322,000 (low) to ₩2,919,000 (high)
📊 Why This Is A Watchlist Stock:
SK Hynix is the purest play on HBM for AI chips. Nvidia's demand for HBM3e is growing, and Hynix is the primary supplier. Yet the stock is down 51% from its peak — a massive disconnect between fundamentals and price action.
The chart is ugly: all moving averages are stacked bearishly. But RSI at 39 is approaching the zone where mean-reversion trades start working.
Key levels:
→ Support: ₩1,322,000 (3-month low — THIS is the line)
→ Resistance: ₩1,577,000 (SMA5 area) → ₩2,124,500 (SMA50)
💬 Would you catch this knife at ₩1.42M, or wait for it to test the 3-month low? The AI thesis is intact, but the chart is brutal. 👇
#SKHynix #Memory #StockAnalysis
⚠️ Disclaimer: This is analysis, not financial advice. Always do your own research and manage risk accordingly.
🔻 SK Hynix just dropped -4.88% and is now 51% below its 3-month high. The world's #2 memory maker is in freefall — is this a buying opportunity or a falling knife?
Technical Snapshot:
→ Price: ₩1,422,000
→ RSI: 39 — approaching oversold
→ Trend: Strong downtrend (price < SMA5 < SMA10 < SMA20 < SMA50)
→ Volume: 83% of average — no panic selling, but no conviction buying either
→ 3-month range: ₩1,322,000 (low) to ₩2,919,000 (high)
📊 Why This Is A Watchlist Stock:
SK Hynix is the purest play on HBM for AI chips. Nvidia's demand for HBM3e is growing, and Hynix is the primary supplier. Yet the stock is down 51% from its peak — a massive disconnect between fundamentals and price action.
The chart is ugly: all moving averages are stacked bearishly. But RSI at 39 is approaching the zone where mean-reversion trades start working.
Key levels:
→ Support: ₩1,322,000 (3-month low — THIS is the line)
→ Resistance: ₩1,577,000 (SMA5 area) → ₩2,124,500 (SMA50)
💬 Would you catch this knife at ₩1.42M, or wait for it to test the 3-month low? The AI thesis is intact, but the chart is brutal. 👇
#SKHynix #Memory #StockAnalysis
⚠️ Disclaimer: This is analysis, not financial advice. Always do your own research and manage risk accordingly.
Technical Snapshot:
→ Price: ₩1,422,000
→ RSI: 39 — approaching oversold
→ Trend: Strong downtrend (price < SMA5 < SMA10 < SMA20 < SMA50)
→ Volume: 83% of average — no panic selling, but no conviction buying either
→ 3-month range: ₩1,322,000 (low) to ₩2,919,000 (high)
📊 Why This Is A Watchlist Stock:
SK Hynix is the purest play on HBM for AI chips. Nvidia's demand for HBM3e is growing, and Hynix is the primary supplier. Yet the stock is down 51% from its peak — a massive disconnect between fundamentals and price action.
The chart is ugly: all moving averages are stacked bearishly. But RSI at 39 is approaching the zone where mean-reversion trades start working.
Key levels:
→ Support: ₩1,322,000 (3-month low — THIS is the line)
→ Resistance: ₩1,577,000 (SMA5 area) → ₩2,124,500 (SMA50)
💬 Would you catch this knife at ₩1.42M, or wait for it to test the 3-month low? The AI thesis is intact, but the chart is brutal. 👇
#SKHynix #Memory #StockAnalysis
⚠️ Disclaimer: This is analysis, not financial advice. Always do your own research and manage risk accordingly.
7
·
--
🧠 Micron ($MU) at $877 — stuck between a rock and a hard place. Here's why traders should care.
Technical Snapshot:
→ Price: $877.57 (-0.44%)
→ RSI: 47.5 — dead neutral
→ Trend: Consolidation after a sharp drop from $1,213 (27.7% off 3-month high)
→ Volume: 71% of average — declining interest
→ SMA50: $970 — massive overhead resistance
📊 The Memory Stock Story:
MU is in a tricky spot. It's bounced 28.8% from its 3-month low of $681, but the rally has stalled hard. Price is now below SMA20 ($888) and far below SMA50 ($970). The MACD is negative and deepening — bears still control the medium-term trend.
HBM (High Bandwidth Memory) demand from AI is the bull thesis. But the stock hasn't been able to translate that narrative into price action. Key levels:
→ Support: $751 (critical floor)
→ Resistance: $971 (SMA50) → $1,088 (prior breakout level)
💬 Are you accumulating MU on weakness or staying away until it reclaims $970? The AI memory thesis is strong, but the chart says patience. 👇
#Micron #MU #StockAnalysis
⚠️ Disclaimer: This is analysis, not financial advice. Always do your own research and manage risk accordingly.
🧠 Micron ($MU ) at $877 — stuck between a rock and a hard place. Here's why traders should care.
Technical Snapshot:
→ Price: $877.57 (-0.44%)
→ RSI: 47.5 — dead neutral
→ Trend: Consolidation after a sharp drop from $1,213 (27.7% off 3-month high)
→ Volume: 71% of average — declining interest
→ SMA50: $970 — massive overhead resistance
📊 The Memory Stock Story:
MU is in a tricky spot. It's bounced 28.8% from its 3-month low of $681, but the rally has stalled hard. Price is now below SMA20 ($888) and far below SMA50 ($970). The MACD is negative and deepening — bears still control the medium-term trend.
HBM (High Bandwidth Memory) demand from AI is the bull thesis. But the stock hasn't been able to translate that narrative into price action. Key levels:
→ Support: $751 (critical floor)
→ Resistance: $971 (SMA50) → $1,088 (prior breakout level)
💬 Are you accumulating MU on weakness or staying away until it reclaims $970? The AI memory thesis is strong, but the chart says patience. 👇
#Micron #MU #StockAnalysis
⚠️ Disclaimer: This is analysis, not financial advice. Always do your own research and manage risk accordingly.
Technical Snapshot:
→ Price: $877.57 (-0.44%)
→ RSI: 47.5 — dead neutral
→ Trend: Consolidation after a sharp drop from $1,213 (27.7% off 3-month high)
→ Volume: 71% of average — declining interest
→ SMA50: $970 — massive overhead resistance
📊 The Memory Stock Story:
MU is in a tricky spot. It's bounced 28.8% from its 3-month low of $681, but the rally has stalled hard. Price is now below SMA20 ($888) and far below SMA50 ($970). The MACD is negative and deepening — bears still control the medium-term trend.
HBM (High Bandwidth Memory) demand from AI is the bull thesis. But the stock hasn't been able to translate that narrative into price action. Key levels:
→ Support: $751 (critical floor)
→ Resistance: $971 (SMA50) → $1,088 (prior breakout level)
💬 Are you accumulating MU on weakness or staying away until it reclaims $970? The AI memory thesis is strong, but the chart says patience. 👇
#Micron #MU #StockAnalysis
⚠️ Disclaimer: This is analysis, not financial advice. Always do your own research and manage risk accordingly.
48
·
--
🧠 Micron (MU) at $868 — memory stocks are bottoming, but is it time to buy?
The semiconductor memory sector has been brutal this quarter. MU is down 28% from its 3-month high. But here's why smart money is watching this level closely.
📊 Technical Snapshot:
• Price: $868.52 | +0.87%
• RSI: 47 (neutral — room to move either way)
• Trend: Downtrend, but volume declining (sellers exhausting)
• SMA20: $878.73 (price below = still bearish)
• Support: $762 | Resistance: $1,088
💡 Why Watch MU Now?
1. Memory pricing cycle is bottoming — HBM demand is real
2. RSI at 47 = not oversold yet, but approaching accumulation zone
3. Volume declining in a downtrend = selling pressure fading
4. SK Hynix (peer) rallied 7.3% today — sector rotation starting?
🔑 Key Levels:
• If $854 (SMA10) holds as support → bullish reversal signal
• Break above $879 (SMA20) → trend change confirmation
• Lose $762 → deeper correction to $680
⚠️ This is a patient trade. Wait for confirmation before entering.
Are semiconductor stocks a buy here or still falling knives? Your take 👇
#MU #Semiconductors #StockAnalysis
⚠️ Disclaimer: This is not financial advice. Always do your own research before investing.
🧠 Micron (MU) at $868 — memory stocks are bottoming, but is it time to buy?
The semiconductor memory sector has been brutal this quarter. MU is down 28% from its 3-month high. But here's why smart money is watching this level closely.
📊 Technical Snapshot:
• Price: $868.52 | +0.87%
• RSI: 47 (neutral — room to move either way)
• Trend: Downtrend, but volume declining (sellers exhausting)
• SMA20: $878.73 (price below = still bearish)
• Support: $762 | Resistance: $1,088
💡 Why Watch MU Now?
1. Memory pricing cycle is bottoming — HBM demand is real
2. RSI at 47 = not oversold yet, but approaching accumulation zone
3. Volume declining in a downtrend = selling pressure fading
4. SK Hynix (peer) rallied 7.3% today — sector rotation starting?
🔑 Key Levels:
• If $854 (SMA10) holds as support → bullish reversal signal
• Break above $879 (SMA20) → trend change confirmation
• Lose $762 → deeper correction to $680
⚠️ This is a patient trade. Wait for confirmation before entering.
Are semiconductor stocks a buy here or still falling knives? Your take 👇
#MU #Semiconductors #StockAnalysis
⚠️ Disclaimer: This is not financial advice. Always do your own research before investing.
The semiconductor memory sector has been brutal this quarter. MU is down 28% from its 3-month high. But here's why smart money is watching this level closely.
📊 Technical Snapshot:
• Price: $868.52 | +0.87%
• RSI: 47 (neutral — room to move either way)
• Trend: Downtrend, but volume declining (sellers exhausting)
• SMA20: $878.73 (price below = still bearish)
• Support: $762 | Resistance: $1,088
💡 Why Watch MU Now?
1. Memory pricing cycle is bottoming — HBM demand is real
2. RSI at 47 = not oversold yet, but approaching accumulation zone
3. Volume declining in a downtrend = selling pressure fading
4. SK Hynix (peer) rallied 7.3% today — sector rotation starting?
🔑 Key Levels:
• If $854 (SMA10) holds as support → bullish reversal signal
• Break above $879 (SMA20) → trend change confirmation
• Lose $762 → deeper correction to $680
⚠️ This is a patient trade. Wait for confirmation before entering.
Are semiconductor stocks a buy here or still falling knives? Your take 👇
#MU #Semiconductors #StockAnalysis
⚠️ Disclaimer: This is not financial advice. Always do your own research before investing.
2
Log in to explore more content
Join global crypto users on Binance Square
⚡️ Get latest and useful information about crypto.
💬 Trusted by the world’s largest crypto exchange.
👍 Discover real insights from verified creators.
Email / Phone number
Trending Topics
1
#BitcoinReboundsTo$79K
13,536 views
128 Discussing
2
#SouthKoreaCryptoTaxDelayPetitionTops50000
128 views
33 Discussing
3
#SolanaTransactionV1GoesLiveOnMainnet
179 views
21 Discussing
4
#RussianCentralBankFlagsCryptoAsFinancialRisk
1,723 views
88 Discussing
5
#GrayscalePutsXRPAt26.11%InAdvisorPortfolio
5,720 views
173 Discussing
6
#PhiladelphiaSemiconductorIndexFalls5.9%
2,799 views
103 Discussing
7
#SECChairUrgesCongressToAdvanceClarityAct
5,588 views
108 Discussing
8
#FedHikeOddsRiseTo89%
87,782 views
1,117 Discussing
9
#RLUSDSupplyHitsRecord$2.442B
6,682 views
66 Discussing
10
#AvalancheIntegratesIntoUAEPassDigitalVault
78,874 views
1,035 Discussing