

daily_post
55 Postlar
daily_post
Shikoyat qilish
Foydalanuvchini bloklash
Crypto and Market Updates - BTC, Altcoins and Charts - Daily Market Insights - DYOR
3 Kuzatilmoqda
2 Kuzatuvchilar
5 Yoqdi
Postlar
·
--
Maqola
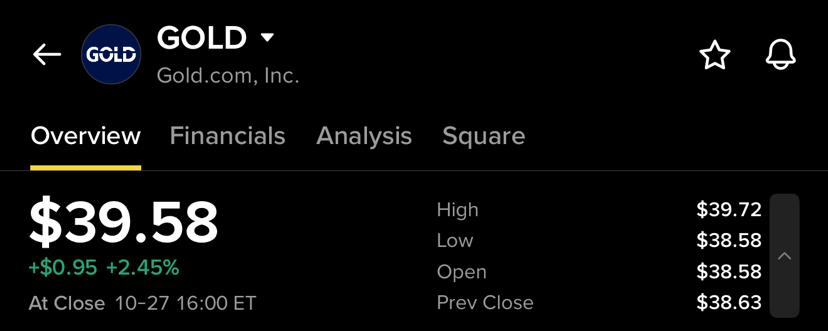
🟡 OLTIN narxi prognozi: keyingi marrami — $40? �🟡 OLTIN narxi tahlili: xaridorlar narxni $40 tomon ko‘tarmoqda!
Oltin ijobiy momentumni namoyish etmoqda: grafikda narx $39.58 atrofida savdo qilinib, taxminan 2.45% ga oshgan. 📈 Xaridorlar narxni yuqoriga ko‘tardi, so‘nggi shamlar esa Oltin $40 darajasiga yaqinlashayotganini ko‘rsatmoqda.
📊 Bozorda nima bo‘lyapti?
Grafikda narx $38.00 atrofidan $39.73 tomon tiklangani ko‘rsatilgan. Hozir narx $39.58 atrofida barqaror turibdi, harakatlanuvchi o‘rtacha ko‘rsatkichlar esa qisqa muddatli momentum yaxshilanganini ko‘rsatmoqda.
🟢 Qarshilik zonasi: $39.73–$40.00
🟡 OLTIN narxi prognozi: keyingi marrami — $40? �
🟡 OLTIN narxi tahlili: xaridorlar narxni $40 tomon ko‘tarmoqda!
Oltin ijobiy momentumni namoyish etmoqda: grafikda narx $39.58 atrofida savdo qilinib, taxminan 2.45% ga oshgan. 📈 Xaridorlar narxni yuqoriga ko‘tardi, so‘nggi shamlar esa Oltin $40 darajasiga yaqinlashayotganini ko‘rsatmoqda.
📊 Bozorda nima bo‘lyapti?
Grafikda narx $38.00 atrofidan $39.73 tomon tiklangani ko‘rsatilgan. Hozir narx $39.58 atrofida barqaror turibdi, harakatlanuvchi o‘rtacha ko‘rsatkichlar esa qisqa muddatli momentum yaxshilanganini ko‘rsatmoqda.
🟢 Qarshilik zonasi: $39.73–$40.00
101
·
--
Maqola
Tarjimani ko‘rish
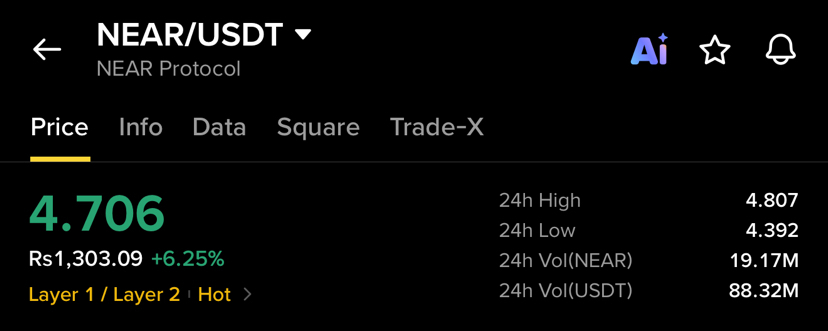
🚀 NEAR Protocol Analysis: Can Bulls Break $4.80?🚀 NEAR Protocol Price Analysis: Is $4.80 the Next Target?
NEAR Protocol is showing positive momentum in the crypto market! 📈 According to the shared Binance chart, NEAR is trading around $4.706, with a 24-hour gain of approximately 6.25%.
📊 Bulls Are Still Fighting
The chart shows a strong recovery from the $4.40–$4.50 zone, with buyers pushing the price toward $4.80. After this upward move, NEAR is consolidating around $4.70, as traders watch for the next breakout.
🎯 Important Price Levels
🟢 Resistance: $4.80–$4.81
🛡️ Support: $4.60
📍 Next Support: $4.50
If buyers push NEAR above $4.80 with strong volume, the bullish momentum could continue. However, if the price falls below $4.60, sellers may push it toward the $4.50 support area.
🔥 What Should Traders Watch?
The current price action shows that NEAR is holding near its recent highs. The next move depends on whether buyers can break the resistance zone or sellers take control.
Trading volume will be important to watch. A strong breakout with increasing volume could show renewed buying interest, while weaker momentum may lead to sideways movement or a pullback.
💬 Let’s Talk Crypto!
Will NEAR break above $4.80 and move higher, or will we see a pullback first?
Drop your thoughts in the comments! 🚀
#Near #nearprotocol #CryptoAnalysis📈📉🐋📅🚀 #BinanceSquare #CryptoMarket $NEAR
{spot}(NEARUSDT)
🚀 NEAR Protocol Analysis: Can Bulls Break $4.80?
🚀 NEAR Protocol Price Analysis: Is $4.80 the Next Target?
NEAR Protocol is showing positive momentum in the crypto market! 📈 According to the shared Binance chart, NEAR is trading around $4.706, with a 24-hour gain of approximately 6.25%.
📊 Bulls Are Still Fighting
The chart shows a strong recovery from the $4.40–$4.50 zone, with buyers pushing the price toward $4.80. After this upward move, NEAR is consolidating around $4.70, as traders watch for the next breakout.
🎯 Important Price Levels
🟢 Resistance: $4.80–$4.81
🛡️ Support: $4.60
📍 Next Support: $4.50
If buyers push NEAR above $4.80 with strong volume, the bullish momentum could continue. However, if the price falls below $4.60, sellers may push it toward the $4.50 support area.
🔥 What Should Traders Watch?
The current price action shows that NEAR is holding near its recent highs. The next move depends on whether buyers can break the resistance zone or sellers take control.
Trading volume will be important to watch. A strong breakout with increasing volume could show renewed buying interest, while weaker momentum may lead to sideways movement or a pullback.
💬 Let’s Talk Crypto!
Will NEAR break above $4.80 and move higher, or will we see a pullback first?
Drop your thoughts in the comments! 🚀
#Near #nearprotocol #CryptoAnalysis📈📉🐋📅🚀 #BinanceSquare #CryptoMarket $NEAR
47
·
--
Tarjimani ko‘rish
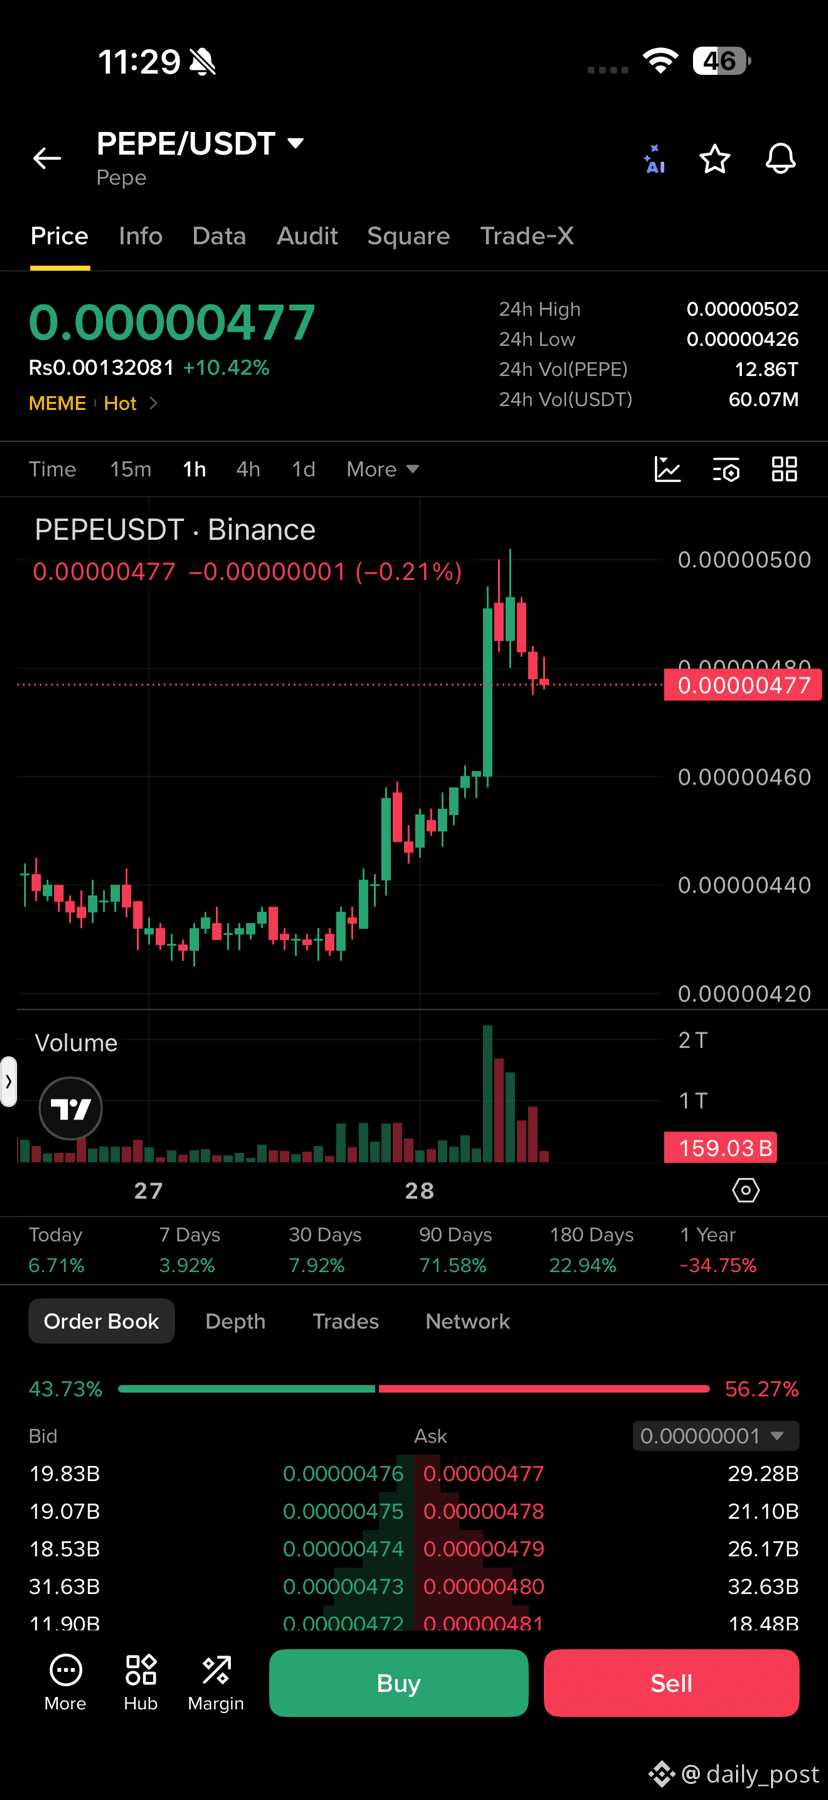
$PEPE 🐸 PEPE Coin Surges 10%+! Is Another Big Move Coming?
PEPE is catching attention in the crypto market! 🚀 According to the shared Binance chart, PEPE/USDT is trading around $0.00000477, with a 24-hour gain of approximately 10.42%.
📈 Bulls Make a Strong Move
The chart shows PEPE moving upward from the $0.00000430 area before making a sharp jump toward $0.00000500. Trading volume also increased during this move, showing strong market activity.
However, after reaching the higher price zone, several red candles appeared. This suggests that some traders may be taking profits, while the market looks for its next direction.
🎯 Key Levels to Watch
🟢 Resistance: $0.00000490–$0.00000500
🛡️ Support: $0.00000460
📊 Next Support: $0.00000440
If PEPE moves above $0.00000500 with strong buying pressure, traders may watch for another upward move. If the price falls below $0.00000460, a deeper pullback could follow.
🔥 What Happens Next?
PEPE has shown impressive momentum, but the recent red candles indicate that the market is not moving upward in a straight line. The next move will depend on whether buyers return and support the price or sellers continue taking profits.
For now, the $0.00000460 support zone and $0.00000500 resistance zone are worth watching closely.
💬 Your Turn!
Can PEPE break $0.00000500 and continue its rally, or will it pull back first?
Share your opinion below! 🐸🚀
#PEPE #pepecoin #crypto #BinanceSquare $PEPE #Memecoin
{spot}(PEPEUSDT)
$PEPE 🐸 PEPE Coin Surges 10%+! Is Another Big Move Coming?
PEPE is catching attention in the crypto market! 🚀 According to the shared Binance chart, PEPE/USDT is trading around $0.00000477, with a 24-hour gain of approximately 10.42%.
📈 Bulls Make a Strong Move
The chart shows PEPE moving upward from the $0.00000430 area before making a sharp jump toward $0.00000500. Trading volume also increased during this move, showing strong market activity.
However, after reaching the higher price zone, several red candles appeared. This suggests that some traders may be taking profits, while the market looks for its next direction.
🎯 Key Levels to Watch
🟢 Resistance: $0.00000490–$0.00000500
🛡️ Support: $0.00000460
📊 Next Support: $0.00000440
If PEPE moves above $0.00000500 with strong buying pressure, traders may watch for another upward move. If the price falls below $0.00000460, a deeper pullback could follow.
🔥 What Happens Next?
PEPE has shown impressive momentum, but the recent red candles indicate that the market is not moving upward in a straight line. The next move will depend on whether buyers return and support the price or sellers continue taking profits.
For now, the $0.00000460 support zone and $0.00000500 resistance zone are worth watching closely.
💬 Your Turn!
Can PEPE break $0.00000500 and continue its rally, or will it pull back first?
Share your opinion below! 🐸🚀
#PEPE #pepecoin #crypto #BinanceSquare $PEPE #Memecoin
87
·
--
Maqola
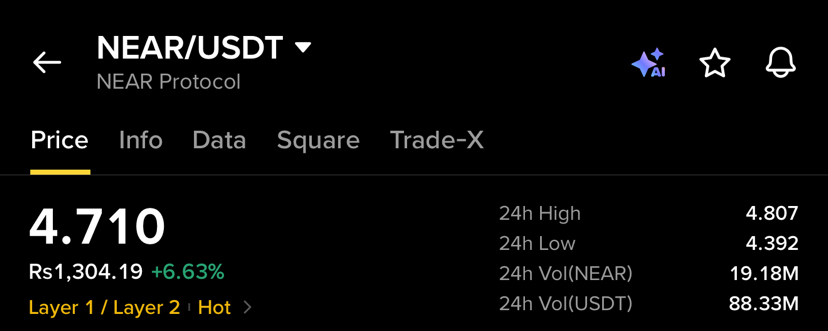
NEAR Protocol narxi tahlili 🚀 NEAR keyingi bosqichda $4.80 dan oshadimi?🚀 NEAR Protocol (NEAR) narxi tahlili: xaridorlar narxni $4.80 tomon ko‘tara oladimi?
Ulashilgan Binance grafigiga ko‘ra, NEAR Protocol kuchli o‘sish sur’atini namoyish etmoqda va narxi $4.71 atrofida savdo qilinmoqda. 📈 Token so‘nggi 24 soat ichida taxminan 6.63% ga qimmatlab, kripto bozori ishtirokchilarining e’tiborini tortdi.
📊 Bozorning joriy holati
Grafikda $4.40–$4.50 oralig‘idan kuchli tiklanish, so‘ngra narxning ketma-ket ko‘tarilishi ko‘rsatilgan. Xaridorlar NEAR narxini $4.70 zonasiga yaqinlashtirdi, hozir esa bozorda biroz konsolidatsiya kuzatilmoqda.
NEAR Protocol narxi tahlili 🚀 NEAR keyingi bosqichda $4.80 dan oshadimi?
🚀 NEAR Protocol (NEAR) narxi tahlili: xaridorlar narxni $4.80 tomon ko‘tara oladimi?
Ulashilgan Binance grafigiga ko‘ra, NEAR Protocol kuchli o‘sish sur’atini namoyish etmoqda va narxi $4.71 atrofida savdo qilinmoqda. 📈 Token so‘nggi 24 soat ichida taxminan 6.63% ga qimmatlab, kripto bozori ishtirokchilarining e’tiborini tortdi.
📊 Bozorning joriy holati
Grafikda $4.40–$4.50 oralig‘idan kuchli tiklanish, so‘ngra narxning ketma-ket ko‘tarilishi ko‘rsatilgan. Xaridorlar NEAR narxini $4.70 zonasiga yaqinlashtirdi, hozir esa bozorda biroz konsolidatsiya kuzatilmoqda.
1
290
·
--
Tarjimani ko‘rish
$TSLA.US 📊 TSLA Short-Term Candle Analysis
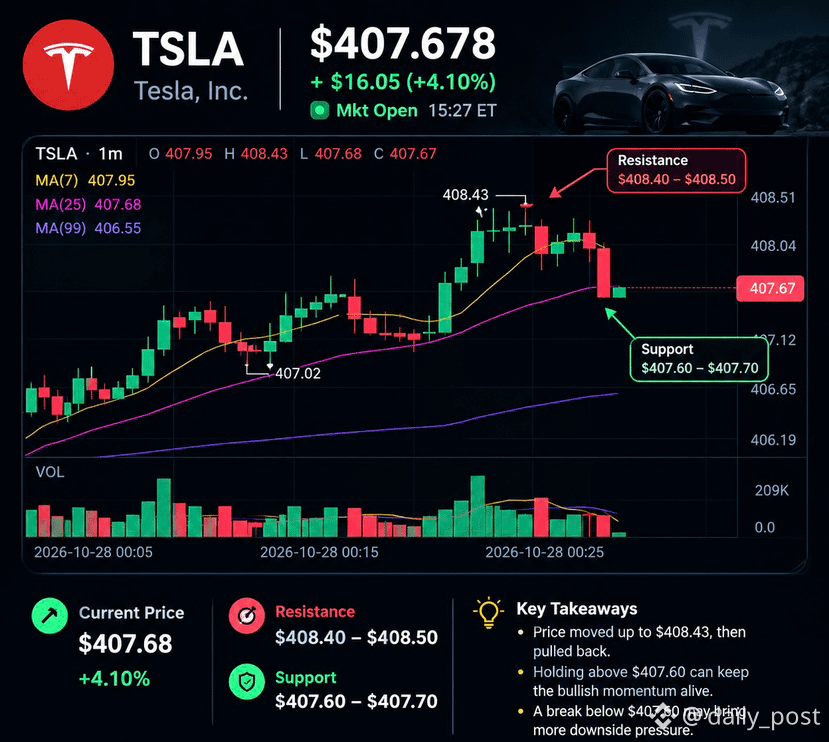
TSLA is trading around $407.68, up about 4.10%. The 1-minute chart shows a strong push toward $408.43, followed by a pullback.
🟢 Support: $407.60–$407.70
🔴 Resistance: $408.40–$408.50
If candles break and hold above $408.50, short-term bullish momentum could continue. A move below $407.60 may bring further pullback pressure.
Watch the next few candles for confirmation. 📈
Not financial advice.
#TSLA #stocks #TradingTales #CandleChart
{stock_us}(TSLA.US)
$TSLA.US 📊 TSLA Short-Term Candle Analysis
TSLA is trading around $407.68, up about 4.10%. The 1-minute chart shows a strong push toward $408.43, followed by a pullback.
🟢 Support: $407.60–$407.70
🔴 Resistance: $408.40–$408.50
If candles break and hold above $408.50, short-term bullish momentum could continue. A move below $407.60 may bring further pullback pressure.
Watch the next few candles for confirmation. 📈
Not financial advice.
#TSLA #stocks #TradingTales #CandleChart
TSLAUS-1,23%
227
·
--
Maqola
Tarjimani ko‘rish
CELO/USDT 4H Analysis: Strong Bounce With Rising Volume — Can CELO Continue Higher?CELO/USDT 4H Analysis 📊
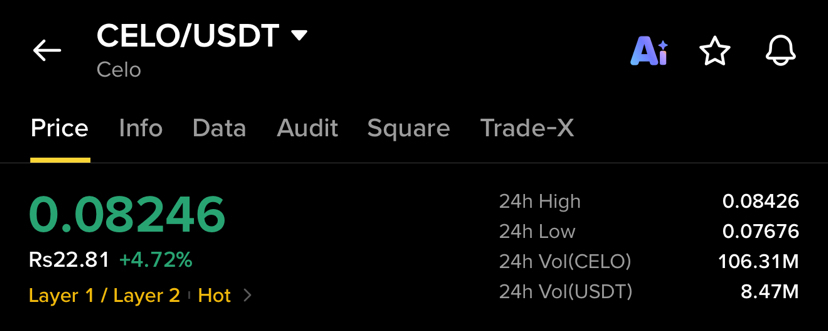
CELO is currently trading around 0.08246 USDT, showing a strong short-term recovery after spending several sessions in a declining trend.
Looking at the 4-hour chart, CELO recently found support around the 0.0760–0.0780 area before making a sharp upward move. The latest green candles show increased buying activity, while the volume has also picked up noticeably.
📈 Recent Price Action
CELO previously moved down from the 0.0860–0.0870 area and formed a series of lower levels. However, after reaching the 0.0760–0.0770 zone, buyers started stepping in.
The latest move is particularly interesting because the price pushed strongly above 0.0800 and reached approximately 0.0840 before pulling back slightly toward 0.08246.
This suggests that buyers are currently attempting to regain short-term control.
🔥 Volume Confirmation
One of the most important things visible on the chart is the increase in trading volume during the recent upward move.
A strong price move accompanied by higher volume can indicate increased market participation. However, volume alone does not guarantee that the price will continue upward, so the next few 4H candles will be important.
🎯 Important Resistance Levels
The first important resistance zone is around:
0.0840–0.0845
If CELO can break and hold above this area with strong volume, the next level to watch could be around:
0.0860–0.0880
The 0.0880 area is especially important because it is close to the upper part of the recent chart range.
A clean breakout above this zone could improve the short-term bullish structure.
🛡️ Important Support Levels
On the downside, the first support area is around:
0.0800–0.0810
Below that, the next important zone is approximately:
0.0770–0.0780
The 0.0760–0.0770 region acted as a recent buying area, so losing this zone could weaken the current recovery setup.
📊 Market Structure
The bigger picture still needs caution because CELO has experienced significant weakness over longer periods. The chart shows that the recent bounce is strong, but it is still important to see whether buyers can establish a higher high and maintain the price above previous resistance areas.
At the moment, CELO is showing short-term bullish momentum, but confirmation is still needed.
The key question is whether buyers can push CELO above 0.0840–0.0845 and maintain that level.
🔎 What I’m Watching Next
For the next few 4H candles, I would mainly watch:
• 0.0840–0.0845: Immediate resistance
• 0.0860–0.0880: Next resistance zone
• 0.0800–0.0810: First support
• 0.0770–0.0780: Stronger support
• Volume: Important for confirming any breakout
If price breaks resistance with strong volume, bullish momentum could continue.
On the other hand, if CELO gets rejected around resistance and falls back below 0.0800, the recent breakout attempt could lose strength.
⚠️ Final View
CELO/USDT is showing an interesting 4H recovery setup after finding support near the lower range. The recent green candles and increased volume suggest that buyers have returned to the market.
However, confirmation remains important. A sustained move above 0.0840–0.0845 would make the short-term structure more interesting, while a rejection followed by a move below 0.0800 could bring selling pressure back into focus.
For now, 0.0840–0.0845 is the key area to watch. 👀
This is chart-based market analysis for educational purposes and is not financial advice. Always manage risk and do your own research before making any trading decision.
#CELO #CELOUSDT #Crypto #CryptoAnalysis #trading $CELO
{spot}(CELOUSDT)
CELO/USDT 4H Analysis: Strong Bounce With Rising Volume — Can CELO Continue Higher?
CELO/USDT 4H Analysis 📊
CELO is currently trading around 0.08246 USDT, showing a strong short-term recovery after spending several sessions in a declining trend.
Looking at the 4-hour chart, CELO recently found support around the 0.0760–0.0780 area before making a sharp upward move. The latest green candles show increased buying activity, while the volume has also picked up noticeably.
📈 Recent Price Action
CELO previously moved down from the 0.0860–0.0870 area and formed a series of lower levels. However, after reaching the 0.0760–0.0770 zone, buyers started stepping in.
The latest move is particularly interesting because the price pushed strongly above 0.0800 and reached approximately 0.0840 before pulling back slightly toward 0.08246.
This suggests that buyers are currently attempting to regain short-term control.
🔥 Volume Confirmation
One of the most important things visible on the chart is the increase in trading volume during the recent upward move.
A strong price move accompanied by higher volume can indicate increased market participation. However, volume alone does not guarantee that the price will continue upward, so the next few 4H candles will be important.
🎯 Important Resistance Levels
The first important resistance zone is around:
0.0840–0.0845
If CELO can break and hold above this area with strong volume, the next level to watch could be around:
0.0860–0.0880
The 0.0880 area is especially important because it is close to the upper part of the recent chart range.
A clean breakout above this zone could improve the short-term bullish structure.
🛡️ Important Support Levels
On the downside, the first support area is around:
0.0800–0.0810
Below that, the next important zone is approximately:
0.0770–0.0780
The 0.0760–0.0770 region acted as a recent buying area, so losing this zone could weaken the current recovery setup.
📊 Market Structure
The bigger picture still needs caution because CELO has experienced significant weakness over longer periods. The chart shows that the recent bounce is strong, but it is still important to see whether buyers can establish a higher high and maintain the price above previous resistance areas.
At the moment, CELO is showing short-term bullish momentum, but confirmation is still needed.
The key question is whether buyers can push CELO above 0.0840–0.0845 and maintain that level.
🔎 What I’m Watching Next
For the next few 4H candles, I would mainly watch:
• 0.0840–0.0845: Immediate resistance
• 0.0860–0.0880: Next resistance zone
• 0.0800–0.0810: First support
• 0.0770–0.0780: Stronger support
• Volume: Important for confirming any breakout
If price breaks resistance with strong volume, bullish momentum could continue.
On the other hand, if CELO gets rejected around resistance and falls back below 0.0800, the recent breakout attempt could lose strength.
⚠️ Final View
CELO/USDT is showing an interesting 4H recovery setup after finding support near the lower range. The recent green candles and increased volume suggest that buyers have returned to the market.
However, confirmation remains important. A sustained move above 0.0840–0.0845 would make the short-term structure more interesting, while a rejection followed by a move below 0.0800 could bring selling pressure back into focus.
For now, 0.0840–0.0845 is the key area to watch. 👀
This is chart-based market analysis for educational purposes and is not financial advice. Always manage risk and do your own research before making any trading decision.
#CELO #CELOUSDT #Crypto #CryptoAnalysis #trading $CELO
121
·
--
🐶 DOGE/USDT 📊
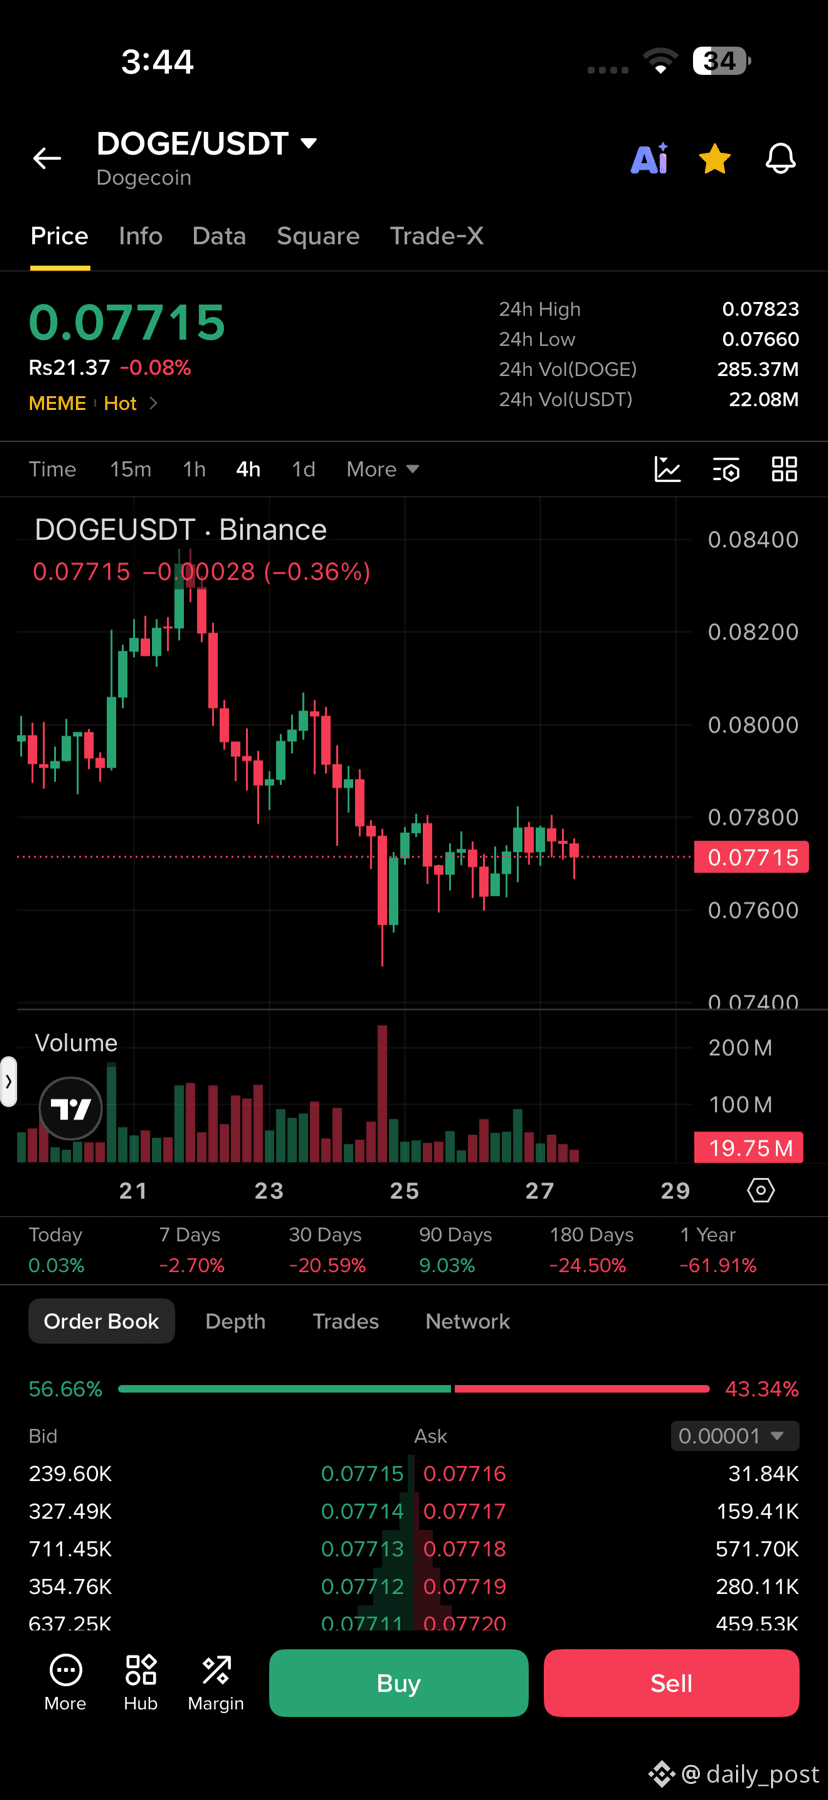
DOGE 0.07715 USDT atrofida savdo qilinmoqda. 🔴
📉 Qo‘llab-quvvatlash: 0.0770
📈 Qarshilik: 0.0780
DOGE qayta ko‘tariladimi yoki yanada pasayadimi? 👀
🟢 KO‘TARILISH yoki 🔴 PASAYISH? Izohlarda yozing!
#DOGE #BinanceSquare #Crypto $DOGE
{spot}(DOGEUSDT)
🐶 DOGE/USDT 📊
DOGE 0.07715 USDT atrofida savdo qilinmoqda. 🔴
📉 Qo‘llab-quvvatlash: 0.0770
📈 Qarshilik: 0.0780
DOGE qayta ko‘tariladimi yoki yanada pasayadimi? 👀
🟢 KO‘TARILISH yoki 🔴 PASAYISH? Izohlarda yozing!
#DOGE #BinanceSquare #Crypto $DOGE
DOGE 0.07715 USDT atrofida savdo qilinmoqda. 🔴
📉 Qo‘llab-quvvatlash: 0.0770
📈 Qarshilik: 0.0780
DOGE qayta ko‘tariladimi yoki yanada pasayadimi? 👀
🟢 KO‘TARILISH yoki 🔴 PASAYISH? Izohlarda yozing!
#DOGE #BinanceSquare #Crypto $DOGE
57
·
--
Maqola
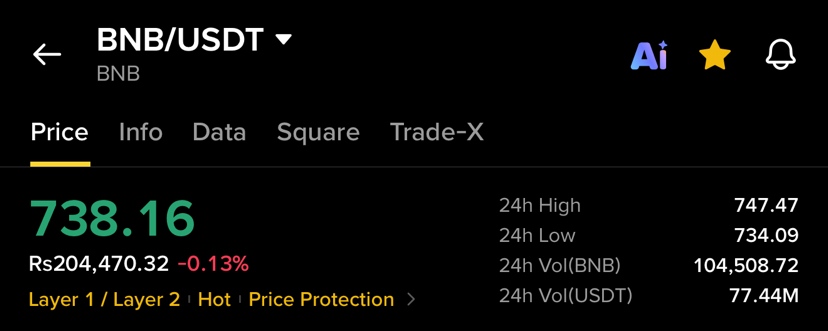
BNB narxi prognozi 🚀 BNB 745 dollar chegarasidan oshib ketadimi?📊 BNB narxi tahlili: Buqalar nazoratni qo‘lga oladimi?
BNB taxminan 738 USDT atrofida savdo qilinmoqda, bu qisqa muddatli bozor noaniqligini ko‘rsatadi. 📉📈
🔹 Qarshilik: 740–745 USDT
🔹 Qo‘llab-quvvatlash: 734–730 USDT
🔹 O‘sish ssenariysi: 745 dan yuqoriga kuchli ko‘tarilish narxning yana o‘sishidan darak berishi mumkin.
🔹 Pasayish ssenariysi: 734 dan pastga tushish sotuv bosimini kuchaytirishi mumkin.
👀 Qaror qabul qilishdan oldin tasdiq olish uchun keyingi sham va savdo hajmini kuzating.
Siz nima deb o‘ylaysiz? BNB ko‘tariladimi 📈 yoki pasayadimi 📉? <t-32/><t-33/>#CryptoAnalysis #BNBUSDT $BNB
BNB narxi prognozi 🚀 BNB 745 dollar chegarasidan oshib ketadimi?
📊 BNB narxi tahlili: Buqalar nazoratni qo‘lga oladimi?
BNB taxminan 738 USDT atrofida savdo qilinmoqda, bu qisqa muddatli bozor noaniqligini ko‘rsatadi. 📉📈
🔹 Qarshilik: 740–745 USDT
🔹 Qo‘llab-quvvatlash: 734–730 USDT
🔹 O‘sish ssenariysi: 745 dan yuqoriga kuchli ko‘tarilish narxning yana o‘sishidan darak berishi mumkin.
🔹 Pasayish ssenariysi: 734 dan pastga tushish sotuv bosimini kuchaytirishi mumkin.
👀 Qaror qabul qilishdan oldin tasdiq olish uchun keyingi sham va savdo hajmini kuzating.
Siz nima deb o‘ylaysiz? BNB ko‘tariladimi 📈 yoki pasayadimi 📉? <t-32/><t-33/>#CryptoAnalysis #BNBUSDT $BNB
68
·
--
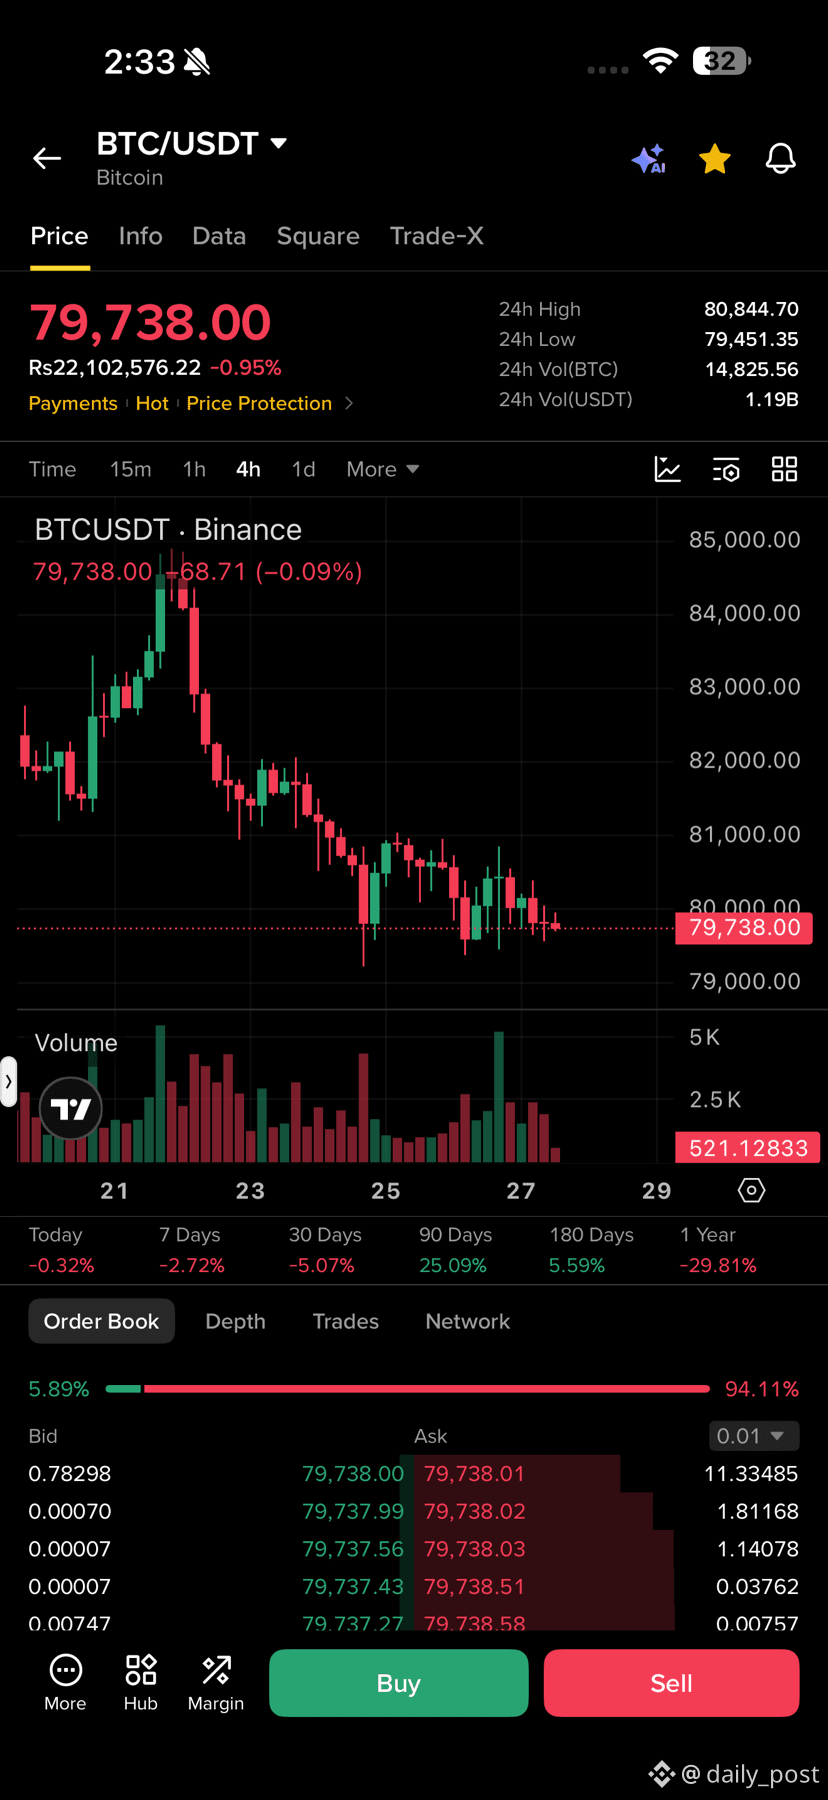
📉 BTC bozori yangilanishi 🚨
BTC taxminan $79,738 atrofida savdo qilinmoqda va grafikda pasayish bosimi kuzatilmoqda.
🔴 Qo‘llab-quvvatlash: $79,000–$79,450
🟢 Qarshilik: $80,000–$80,500
BTC qayta ko‘tariladimi yoki yanada pasayadimi? 🤔
Fikrlaringizni quyida yozing! 👇
#bitcoin #CryptoAnalysis #BinanceSquare $BTC
{spot}(BTCUSDT)
📉 BTC bozori yangilanishi 🚨
BTC taxminan $79,738 atrofida savdo qilinmoqda va grafikda pasayish bosimi kuzatilmoqda.
🔴 Qo‘llab-quvvatlash: $79,000–$79,450
🟢 Qarshilik: $80,000–$80,500
BTC qayta ko‘tariladimi yoki yanada pasayadimi? 🤔
Fikrlaringizni quyida yozing! 👇
#bitcoin #CryptoAnalysis #BinanceSquare $BTC
BTC taxminan $79,738 atrofida savdo qilinmoqda va grafikda pasayish bosimi kuzatilmoqda.
🔴 Qo‘llab-quvvatlash: $79,000–$79,450
🟢 Qarshilik: $80,000–$80,500
BTC qayta ko‘tariladimi yoki yanada pasayadimi? 🤔
Fikrlaringizni quyida yozing! 👇
#bitcoin #CryptoAnalysis #BinanceSquare $BTC
56
·
--
Maqola
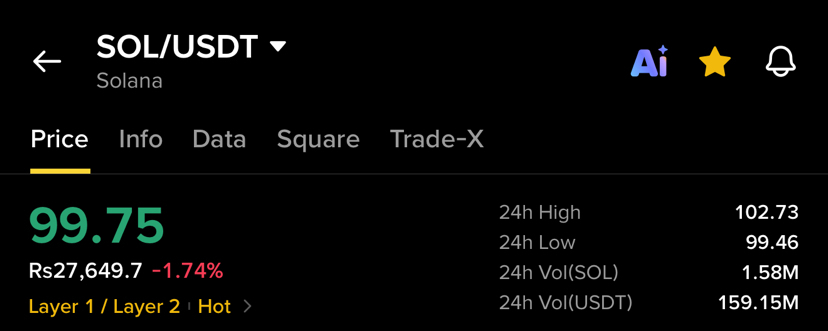
🚨 SOLANA NARXI HAQIDA OGOHLANTIRISH! Keyingi narx $98 yoki $102 bo‘ladimi? 📊�🚨 Solana (SOL) narxi tahlili: SOL $99 dan pastga tushadimi?
📊 SOL’ning joriy narxi: $99.75 USDT
Grafikda Solana narxining pasayish sur’ati kuzatilmoqda: narx $107–$108 oralig‘idan $99.75 gacha tushdi. Sotuvchilar bozorga bosim o‘tkazayotganga o‘xshaydi, treyderlar esa keyingi muhim darajalarni diqqat bilan kuzatishlari kerak.
🔴 Muhim qo‘llab-quvvatlash darajalari
* $99.45 — Yaqin muddatli qo‘llab-quvvatlash
* $98.00 — Keyingi ehtimoliy qo‘llab-quvvatlash
🟢 Qarshilik darajalari
* $101.00 — Birinchi qarshilik zonasi
* $102.00 — Keyingi qarshilik zonasi
📉 Pasayish ssenariysi: Agar SOL kuchli sotuvlar hajmi bilan $99.45 dan pastga tushsa, narx yanada pasayishi mumkin.
🚨 SOLANA NARXI HAQIDA OGOHLANTIRISH! Keyingi narx $98 yoki $102 bo‘ladimi? 📊�
🚨 Solana (SOL) narxi tahlili: SOL $99 dan pastga tushadimi?
📊 SOL’ning joriy narxi: $99.75 USDT
Grafikda Solana narxining pasayish sur’ati kuzatilmoqda: narx $107–$108 oralig‘idan $99.75 gacha tushdi. Sotuvchilar bozorga bosim o‘tkazayotganga o‘xshaydi, treyderlar esa keyingi muhim darajalarni diqqat bilan kuzatishlari kerak.
🔴 Muhim qo‘llab-quvvatlash darajalari
* $99.45 — Yaqin muddatli qo‘llab-quvvatlash
* $98.00 — Keyingi ehtimoliy qo‘llab-quvvatlash
🟢 Qarshilik darajalari
* $101.00 — Birinchi qarshilik zonasi
* $102.00 — Keyingi qarshilik zonasi
📉 Pasayish ssenariysi: Agar SOL kuchli sotuvlar hajmi bilan $99.45 dan pastga tushsa, narx yanada pasayishi mumkin.
143
·
--
Maqola
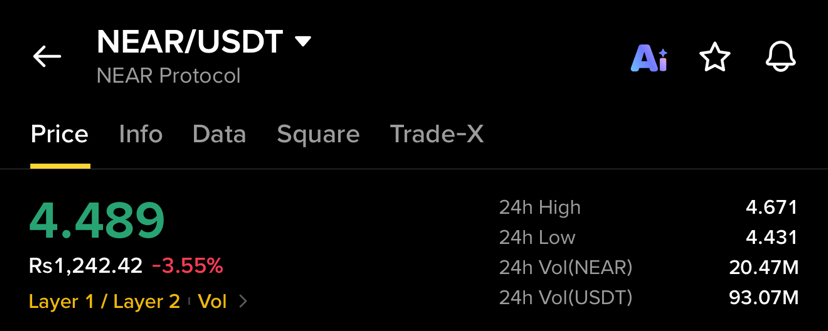
NEAR/USDT: NEAR 5 dollarni qaytara oladimi? 🚀NEAR/USDT: NEAR keyingi harakatini aniqlay oladimi? 📊
NEAR/USDT so‘nggi cho‘qqilardan sezilarli pasayganidan keyin hozirda 4.489 USDT atrofida savdo qilinmoqda. 1D grafikda NEAR avval keskin ko‘tarilgan, keyin esa 4.5–5.3 oralig‘ida bir muddat konsolidatsiyalangan.
Hozirda narxda biroz zaiflik kuzatilmoqda, kunlik o‘zgarish manfiy hududda. Biroq grafik hanuz muhim 4.0 darajasidan yuqorida turibdi, shu bois joriy zonani diqqat bilan kuzatish kerak.
📉 Joriy bozor tuzilmasi
Avval NEAR 2–3 USDT atrofidagi quyi zonadan keskin ko‘tarilib, 5 USDT dan yuqoriga yetgan edi. Ushbu o‘sishdan so‘ng narx bir necha bor yuqorilashga urinib, yonlama harakatlana boshladi.
NEAR/USDT: NEAR 5 dollarni qaytara oladimi? 🚀
NEAR/USDT: NEAR keyingi harakatini aniqlay oladimi? 📊
NEAR/USDT so‘nggi cho‘qqilardan sezilarli pasayganidan keyin hozirda 4.489 USDT atrofida savdo qilinmoqda. 1D grafikda NEAR avval keskin ko‘tarilgan, keyin esa 4.5–5.3 oralig‘ida bir muddat konsolidatsiyalangan.
Hozirda narxda biroz zaiflik kuzatilmoqda, kunlik o‘zgarish manfiy hududda. Biroq grafik hanuz muhim 4.0 darajasidan yuqorida turibdi, shu bois joriy zonani diqqat bilan kuzatish kerak.
📉 Joriy bozor tuzilmasi
Avval NEAR 2–3 USDT atrofidagi quyi zonadan keskin ko‘tarilib, 5 USDT dan yuqoriga yetgan edi. Ushbu o‘sishdan so‘ng narx bir necha bor yuqorilashga urinib, yonlama harakatlana boshladi.
1
609
·
--
Maqola
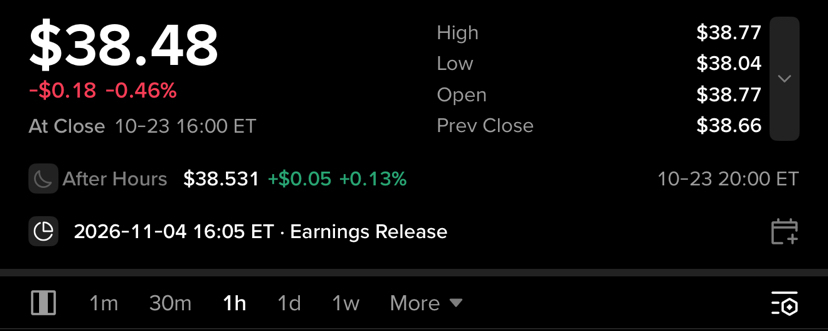
🟡 Oltin: 1 soatlik grafik tahlili — xaridorlar narxni yuqoriga ko‘tara oladimi?🟡 Oltin: 1 soatlik grafik tahlili — xaridorlar narxni yuqoriga ko‘tara oladimi?
Oltin hozir 1 soatlik grafikda $38.48 atrofida savdo qilinmoqda. Yaqindagi o‘zgaruvchanlikdan so‘ng narx konsolidatsiya bosqichida.
Texnik jihatdan, MA(7) taxminan $38.48, MA(25) esa $38.51 atrofida, MA(99) esa taxminan $38.89 darajasida. Bu narx hali ham uzoqroq muddatli harakatlanuvchi o‘rtacha ko‘rsatkichlardan past ekanini va qisqa muddatli momentum biroz ehtiyotkor bo‘lib qolayotganini ko‘rsatadi.
📊 Kuzatish kerak bo‘lgan muhim darajalar
Qarshilik darajalari:
$38.52 — qisqa muddatli ilk to‘siq
$38.81 — muhim qarshilik hududi
$38.89–$38.94 — kuchliroq qarshilik zonasi
🟡 Oltin: 1 soatlik grafik tahlili — xaridorlar narxni yuqoriga ko‘tara oladimi?
🟡 Oltin: 1 soatlik grafik tahlili — xaridorlar narxni yuqoriga ko‘tara oladimi?
Oltin hozir 1 soatlik grafikda $38.48 atrofida savdo qilinmoqda. Yaqindagi o‘zgaruvchanlikdan so‘ng narx konsolidatsiya bosqichida.
Texnik jihatdan, MA(7) taxminan $38.48, MA(25) esa $38.51 atrofida, MA(99) esa taxminan $38.89 darajasida. Bu narx hali ham uzoqroq muddatli harakatlanuvchi o‘rtacha ko‘rsatkichlardan past ekanini va qisqa muddatli momentum biroz ehtiyotkor bo‘lib qolayotganini ko‘rsatadi.
📊 Kuzatish kerak bo‘lgan muhim darajalar
Qarshilik darajalari:
$38.52 — qisqa muddatli ilk to‘siq
$38.81 — muhim qarshilik hududi
$38.89–$38.94 — kuchliroq qarshilik zonasi
XAU-0,52%
GOLDUS-0,15%
212
·
--
Maqola
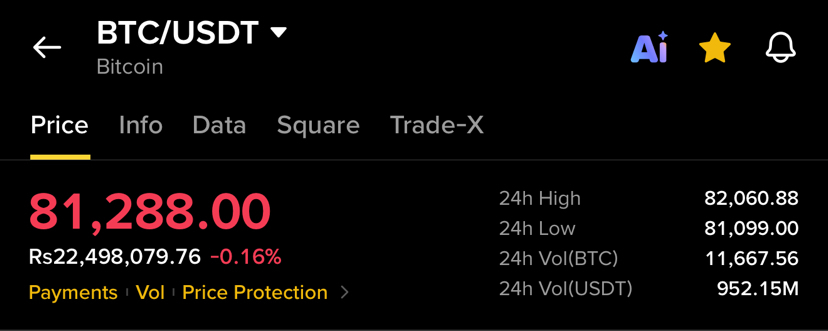
Bitcoin (BTC) 4 soatlik tahlili: BTC $82K darajasini qaytara oladimi?Bitcoin (BTC) 4 soatlik bozor tahlili 📊
Bitcoin hozir taxminan $81,288 narxda savdo qilinmoqda. 4 soatlik grafikda $84K–$85K oralig‘idan kuchli qaytishdan keyin narx bir muddat konsolidatsiyada ekani ko‘rinmoqda.
So‘nggi harakatda BTC $84K dan yuqoridan keskin tushib ketdi va hozir $81K–$82K oralig‘ida barqarorlashishga urinmoqda. Joriy narx harakati ushbu darajada xaridorlar ham, sotuvchilar ham faol ekanini ko‘rsatmoqda.
🔹 Muhim qarshilik: $82,000–$82,500
🔹 Asosiy qarshilik: $84,000–$85,000
🔹 Muhim tayanch: $81,000
🔹 Keyingi tayanch: $80,000 atrofida
Bitcoin (BTC) 4 soatlik tahlili: BTC $82K darajasini qaytara oladimi?
Bitcoin (BTC) 4 soatlik bozor tahlili 📊
Bitcoin hozir taxminan $81,288 narxda savdo qilinmoqda. 4 soatlik grafikda $84K–$85K oralig‘idan kuchli qaytishdan keyin narx bir muddat konsolidatsiyada ekani ko‘rinmoqda.
So‘nggi harakatda BTC $84K dan yuqoridan keskin tushib ketdi va hozir $81K–$82K oralig‘ida barqarorlashishga urinmoqda. Joriy narx harakati ushbu darajada xaridorlar ham, sotuvchilar ham faol ekanini ko‘rsatmoqda.
🔹 Muhim qarshilik: $82,000–$82,500
🔹 Asosiy qarshilik: $84,000–$85,000
🔹 Muhim tayanch: $81,000
🔹 Keyingi tayanch: $80,000 atrofida
57
·
--
Maqola
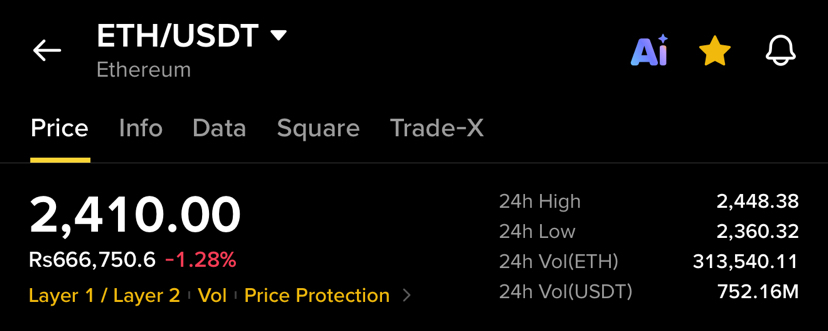
Ethereum (ETH) 1 kunlik tahlili: 2 400 dollar navbatdagi muhim burilish nuqtasimi? 📊ETH/USDT 1 kunlik tahlil: Ethereum muhim qaror zonasida 📊
Ethereum (ETH) hozirda 2 410 dollar atrofida savdo qilmoqda, 24 soat ichidagi narx o‘zgarishi esa taxminan -1,28% ni ko‘rsatmoqda.
1 kunlik grafikda ETH oy boshida kuzatilgan yuqori darajalardan sezilarli darajada ortga chekingani ko‘rinadi. Narx 2 700–2 800 dollar oralig‘iga yetganidan so‘ng kuchli sotuv bosimiga uchradi va pasayishda davom etib, oxir-oqibat hozirgi 2 400 dollar atrofidagi hududga tushdi.
Ayni paytda Ethereum nisbatan muhim diapazonda savdo qilayotganga o‘xshaydi, shu bois keyingi bir necha kunlik shamlarni diqqat bilan kuzatish kerak.
Ethereum (ETH) 1 kunlik tahlili: 2 400 dollar navbatdagi muhim burilish nuqtasimi? 📊
ETH/USDT 1 kunlik tahlil: Ethereum muhim qaror zonasida 📊
Ethereum (ETH) hozirda 2 410 dollar atrofida savdo qilmoqda, 24 soat ichidagi narx o‘zgarishi esa taxminan -1,28% ni ko‘rsatmoqda.
1 kunlik grafikda ETH oy boshida kuzatilgan yuqori darajalardan sezilarli darajada ortga chekingani ko‘rinadi. Narx 2 700–2 800 dollar oralig‘iga yetganidan so‘ng kuchli sotuv bosimiga uchradi va pasayishda davom etib, oxir-oqibat hozirgi 2 400 dollar atrofidagi hududga tushdi.
Ayni paytda Ethereum nisbatan muhim diapazonda savdo qilayotganga o‘xshaydi, shu bois keyingi bir necha kunlik shamlarni diqqat bilan kuzatish kerak.
131
·
--
Maqola
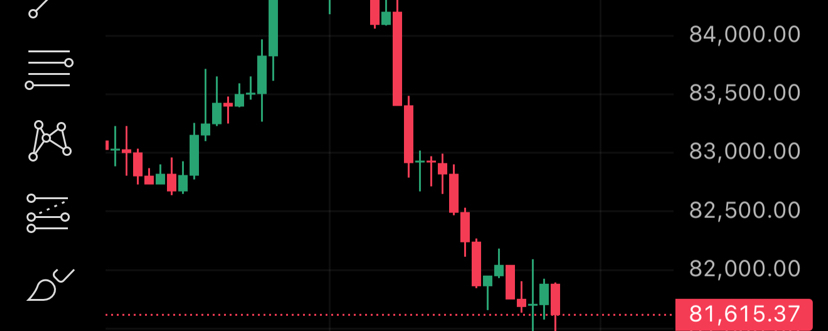
Bitcoin bozori istiqbollari: treyderlar keyin nimalarni kuzatishlari kerak? 📊Bitcoin bozori istiqbollari: treyderlar keyin nimalarni kuzatishlari kerak? 📊
Bitcoin ($BTC) butun dunyodagi treyderlar va kriptoinvestorlar e’tiborini jalb qilishda davom etmoqda. Bozor tez o‘zgarayotgan bir paytda, narx harakati va bozor kayfiyatini tushunish qisqa muddatli shov-shuvga ergashishdan ko‘ra foydaliroq bo‘lishi mumkin.
📈 Grafikda nimalarga e’tibor berish kerak
Bitcoin grafigini kuzatganda, treyderlar quyidagilarga e’tibor berishlari kerak:
• Qo‘llab-quvvatlash darajalari — xaridorlar faollashishi mumkin bo‘lgan hududlar.
• Qarshilik darajalari — sotuv bosimi kuchayishi mumkin bo‘lgan hududlar.
Bitcoin bozori istiqbollari: treyderlar keyin nimalarni kuzatishlari kerak? 📊
Bitcoin bozori istiqbollari: treyderlar keyin nimalarni kuzatishlari kerak? 📊
Bitcoin ($BTC ) butun dunyodagi treyderlar va kriptoinvestorlar e’tiborini jalb qilishda davom etmoqda. Bozor tez o‘zgarayotgan bir paytda, narx harakati va bozor kayfiyatini tushunish qisqa muddatli shov-shuvga ergashishdan ko‘ra foydaliroq bo‘lishi mumkin.
📈 Grafikda nimalarga e’tibor berish kerak
Bitcoin grafigini kuzatganda, treyderlar quyidagilarga e’tibor berishlari kerak:
• Qo‘llab-quvvatlash darajalari — xaridorlar faollashishi mumkin bo‘lgan hududlar.
• Qarshilik darajalari — sotuv bosimi kuchayishi mumkin bo‘lgan hududlar.
72
·
--
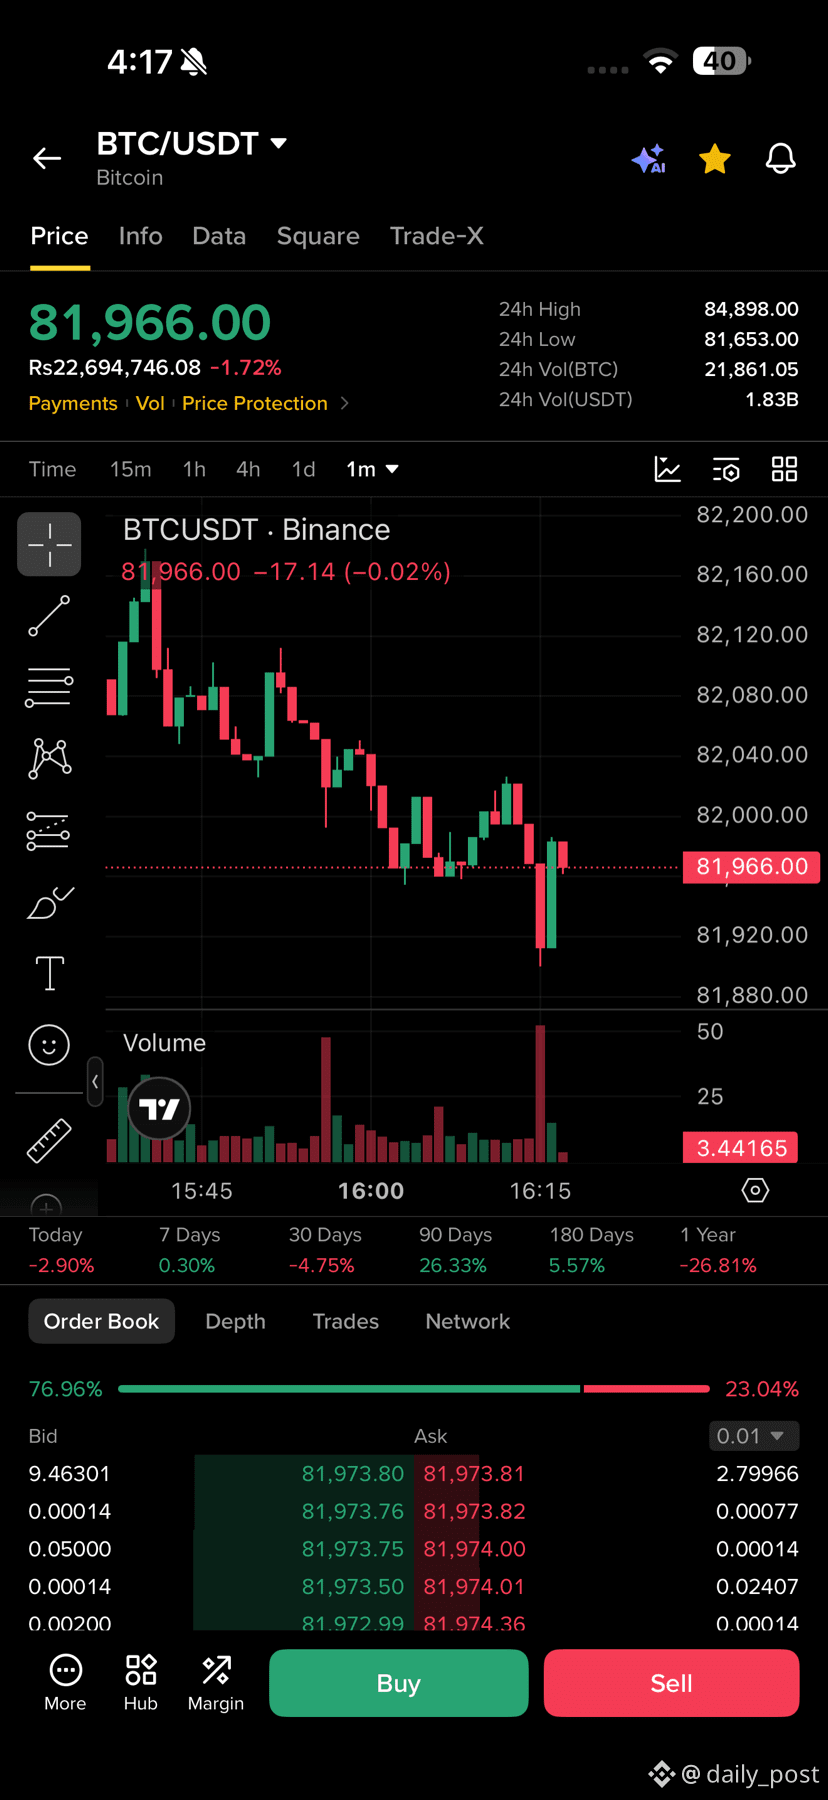
BTC/USDT 📉
Qisqa muddatli bosim davom etmoqda.
Keyingi harakatni kuzatib turibman.
$BTC
{spot}(BTCUSDT)
BTC/USDT 📉
Qisqa muddatli bosim davom etmoqda.
Keyingi harakatni kuzatib turibman.
$BTC
Qisqa muddatli bosim davom etmoqda.
Keyingi harakatni kuzatib turibman.
$BTC
96
·
--
Binance Pick bugun qiziqarli ko‘rinmoqda! #BinancePick
Binance Pick bugun qiziqarli ko‘rinmoqda! #BinancePick

56
·
--
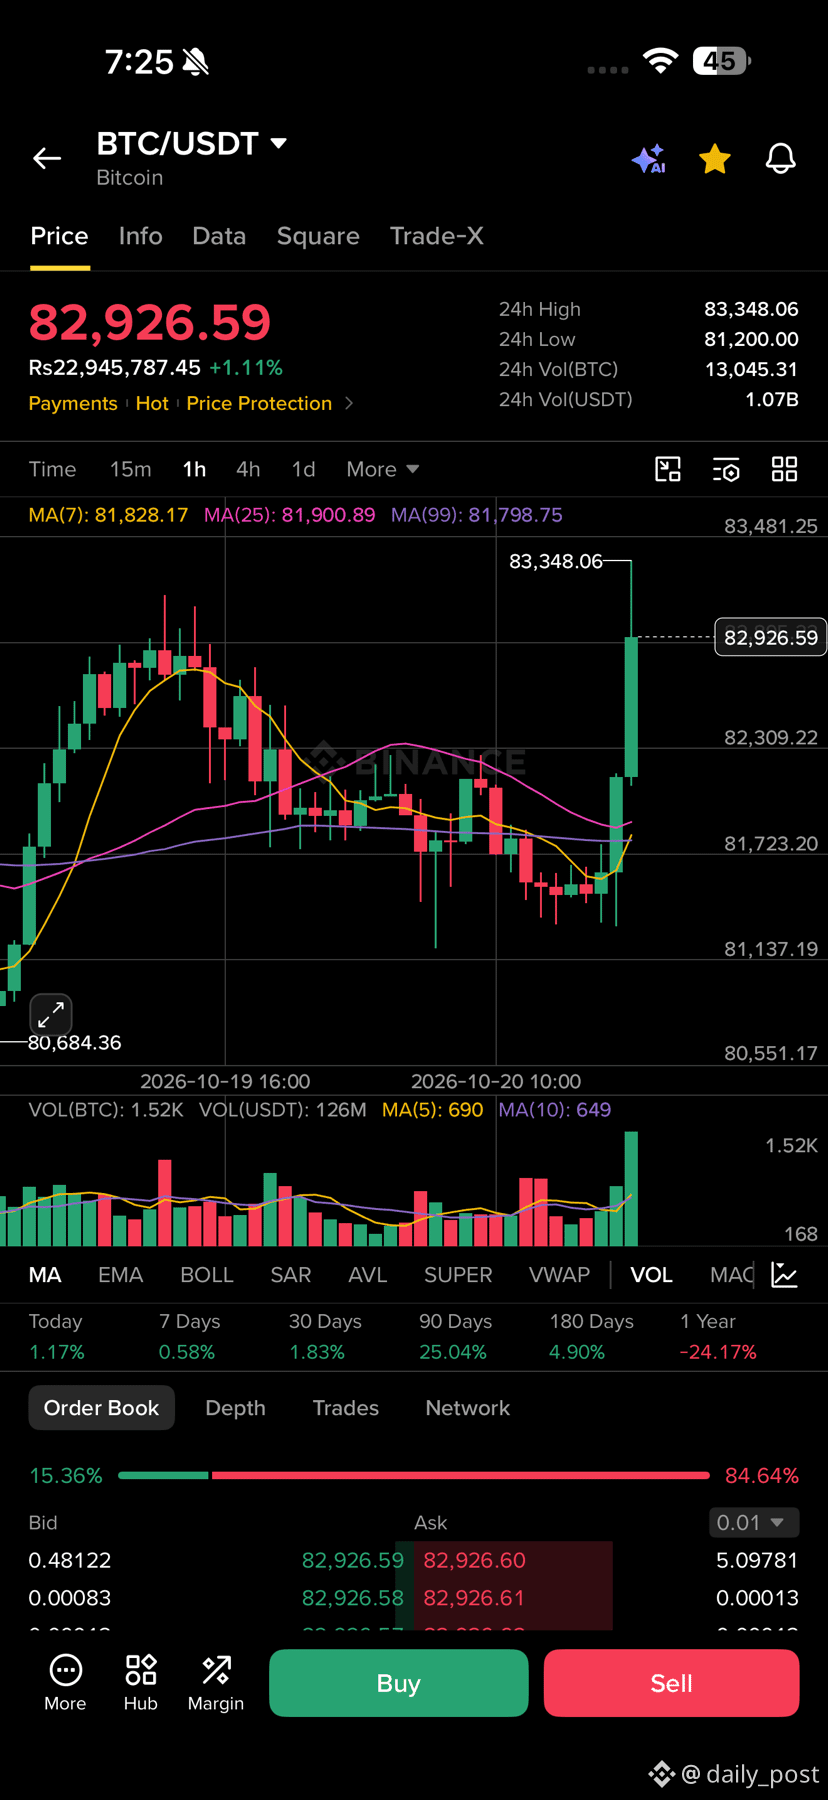
📊 BTC bozori sharhi | ETFlarga mablag‘ oqimi va sotuv bosimi
Ulashilgan hisobotga ko‘ra, AQShdagi spot Bitcoin ETFlariga sof mablag‘ oqimi taxminan 526,7 mln dollarni tashkil etganiga qaramay, Bitcoin sotuv bosimiga duch keldi.
🔹 BTC narxi taxminan 81 383 dollar atrofida ekani xabar qilindi.
🔹 Narx 81 481 dollar atrofidagi 50 kunlik harakatlanuvchi o‘rtacha ko‘rsatkichdan past edi.
🔹 Treyderlar narx pasayishi xavfini hisobga olayotgani sababli, 80 000 dollarlik put opsioni e’tiborni tortmoqda.
📈 Bozor haqidagi fikrim: ETFlarga mablag‘ oqimi ijobiy, ammo bu narx darhol ko‘tarilishini kafolatlamaydi. Kuchliroq o‘sish harakati tasdiqlanishidan oldin BTC muhim qarshilik darajalaridan yana yuqoriga ko‘tarilishi kerak.
💬 Siz nima deb o‘ylaysiz?
BTC tiklanadimi yoki sotuvchilar narxni yanada tushiradimi?
#BTC走势分析 #BinanceSquare #CryptoNews🔒📰🚫 #BitcoinAnalysis $BTC
{spot}(BTCUSDT)
📊 BTC bozori sharhi | ETFlarga mablag‘ oqimi va sotuv bosimi
Ulashilgan hisobotga ko‘ra, AQShdagi spot Bitcoin ETFlariga sof mablag‘ oqimi taxminan 526,7 mln dollarni tashkil etganiga qaramay, Bitcoin sotuv bosimiga duch keldi.
🔹 BTC narxi taxminan 81 383 dollar atrofida ekani xabar qilindi.
🔹 Narx 81 481 dollar atrofidagi 50 kunlik harakatlanuvchi o‘rtacha ko‘rsatkichdan past edi.
🔹 Treyderlar narx pasayishi xavfini hisobga olayotgani sababli, 80 000 dollarlik put opsioni e’tiborni tortmoqda.
📈 Bozor haqidagi fikrim: ETFlarga mablag‘ oqimi ijobiy, ammo bu narx darhol ko‘tarilishini kafolatlamaydi. Kuchliroq o‘sish harakati tasdiqlanishidan oldin BTC muhim qarshilik darajalaridan yana yuqoriga ko‘tarilishi kerak.
💬 Siz nima deb o‘ylaysiz?
BTC tiklanadimi yoki sotuvchilar narxni yanada tushiradimi?
#BTC走势分析 #BinanceSquare #CryptoNews🔒📰🚫 #BitcoinAnalysis $BTC
77
·
--
$CLF 📈 Daromadlar kutilganidan yuqori!
Kutilgan daromad ko‘rsatkichlaridan oshib ketgach, Cleveland-Cliffs aksiyalari 16% ga ko‘tarildi.
👀 O‘sish sur’atining davom etishini kuzatamiz.
$CLF.US
{stock_us}(CLF.US)
$CLF 📈 Daromadlar kutilganidan yuqori!
Kutilgan daromad ko‘rsatkichlaridan oshib ketgach, Cleveland-Cliffs aksiyalari 16% ga ko‘tarildi.
👀 O‘sish sur’atining davom etishini kuzatamiz.
$CLF.US
Kutilgan daromad ko‘rsatkichlaridan oshib ketgach, Cleveland-Cliffs aksiyalari 16% ga ko‘tarildi.
👀 O‘sish sur’atining davom etishini kuzatamiz.
$CLF.US
CLFUS-1,80%
89
Ko‘proq kontentni ko‘rish uchun tizimga kiring
Binance Square'da global kriptovalyuta foydalanuvchilariga qo‘shiling
⚡️ Kriptovalyuta haqida eng so‘nggi va foydali ma’lumotlarni oling.
💬 Dunyoning eng yirik kriptovalyuta birjasi tomonidan ishonchli deb topilgan.
👍 Tasdiqlangan mualliflardan haqiqiy tahlillarni kashf eting.
Email / telefon raqami
Trenddagi mavzular
CanMicrosoftDeliverOnAI
353,256 marta koʻrilgan
2,789 muhokama qilmoqda
Daromadlar mavsumining 3-sessiyasi: Google va Microsoft moliyaviy natijalari kutilganidan yaxshiroq bo‘ladimi?
Binance Square Official
·140 ta layk
·67.8k marta koʻrilgan
CanGoogleDefindItsCore
209,558 marta koʻrilgan
1,979 muhokama qilmoqda
EarningsSeason
5.9M marta koʻrilgan
28,823 muhokama qilmoqda