

#us30yearyieldhitshighestsince2007
us30yearyieldhitshighestsince2007
117,288 views
389 Discussing
Hot
Latest

One of the biggest stories in crypto right now isn't happening on a crypto exchange.
The U.S. 30-year Treasury yield recently reached levels not seen since 2004, amid a broader bond-market selloff.
Why should crypto people care?
Because long-term Treasury yields influence how investors value almost every risk asset.
Think of it simply:
If safer government debt offers increasingly attractive yields, investors have another place to put capital.
That doesn't automatically mean crypto loses.
But it changes the competition for capital.
And the 30-year yield is especially interesting because it reflects long-term expectations around inflation, borrowing costs and government financing.
For crypto, this creates a bigger macro question:
How much risk appetite remains when traditional yields become more attractive?
That is a much more useful question than simply asking whether Bitcoin is bullish or bearish today.
Markets are connected.
Sometimes the bond market speaks first.
Crypto simply reacts later.
This is my personal opinion, not financial advice. Do your own research.
Why rising Treasury yields can change the psychology of crypto investors.
$ZEC
{spot}(ZECUSDT)
$BTC
{spot}(BTCUSDT)
$QNT
{spot}(QNTUSDT)
#US30YearYieldHighestSince2004
#US30YearYieldHitsHighestSince2007
#US30YTreasuryYieldTops5.40%
#US30YearYieldClimbsToNear5.23%
One of the biggest stories in crypto right now isn't happening on a crypto exchange.
The U.S. 30-year Treasury yield recently reached levels not seen since 2004, amid a broader bond-market selloff.
Why should crypto people care?
Because long-term Treasury yields influence how investors value almost every risk asset.
Think of it simply:
If safer government debt offers increasingly attractive yields, investors have another place to put capital.
That doesn't automatically mean crypto loses.
But it changes the competition for capital.
And the 30-year yield is especially interesting because it reflects long-term expectations around inflation, borrowing costs and government financing.
For crypto, this creates a bigger macro question:
How much risk appetite remains when traditional yields become more attractive?
That is a much more useful question than simply asking whether Bitcoin is bullish or bearish today.
Markets are connected.
Sometimes the bond market speaks first.
Crypto simply reacts later.
This is my personal opinion, not financial advice. Do your own research.
Why rising Treasury yields can change the psychology of crypto investors.
$ZEC
$BTC
$QNT
#US30YearYieldHighestSince2004
#US30YearYieldHitsHighestSince2007
#US30YTreasuryYieldTops5.40%
#US30YearYieldClimbsToNear5.23%
The U.S. 30-year Treasury yield recently reached levels not seen since 2004, amid a broader bond-market selloff.
Why should crypto people care?
Because long-term Treasury yields influence how investors value almost every risk asset.
Think of it simply:
If safer government debt offers increasingly attractive yields, investors have another place to put capital.
That doesn't automatically mean crypto loses.
But it changes the competition for capital.
And the 30-year yield is especially interesting because it reflects long-term expectations around inflation, borrowing costs and government financing.
For crypto, this creates a bigger macro question:
How much risk appetite remains when traditional yields become more attractive?
That is a much more useful question than simply asking whether Bitcoin is bullish or bearish today.
Markets are connected.
Sometimes the bond market speaks first.
Crypto simply reacts later.
This is my personal opinion, not financial advice. Do your own research.
Why rising Treasury yields can change the psychology of crypto investors.
$ZEC
$BTC
$QNT
#US30YearYieldHighestSince2004
#US30YearYieldHitsHighestSince2007
#US30YTreasuryYieldTops5.40%
#US30YearYieldClimbsToNear5.23%
1
256

#us30yearyieldhitshighestsince2007
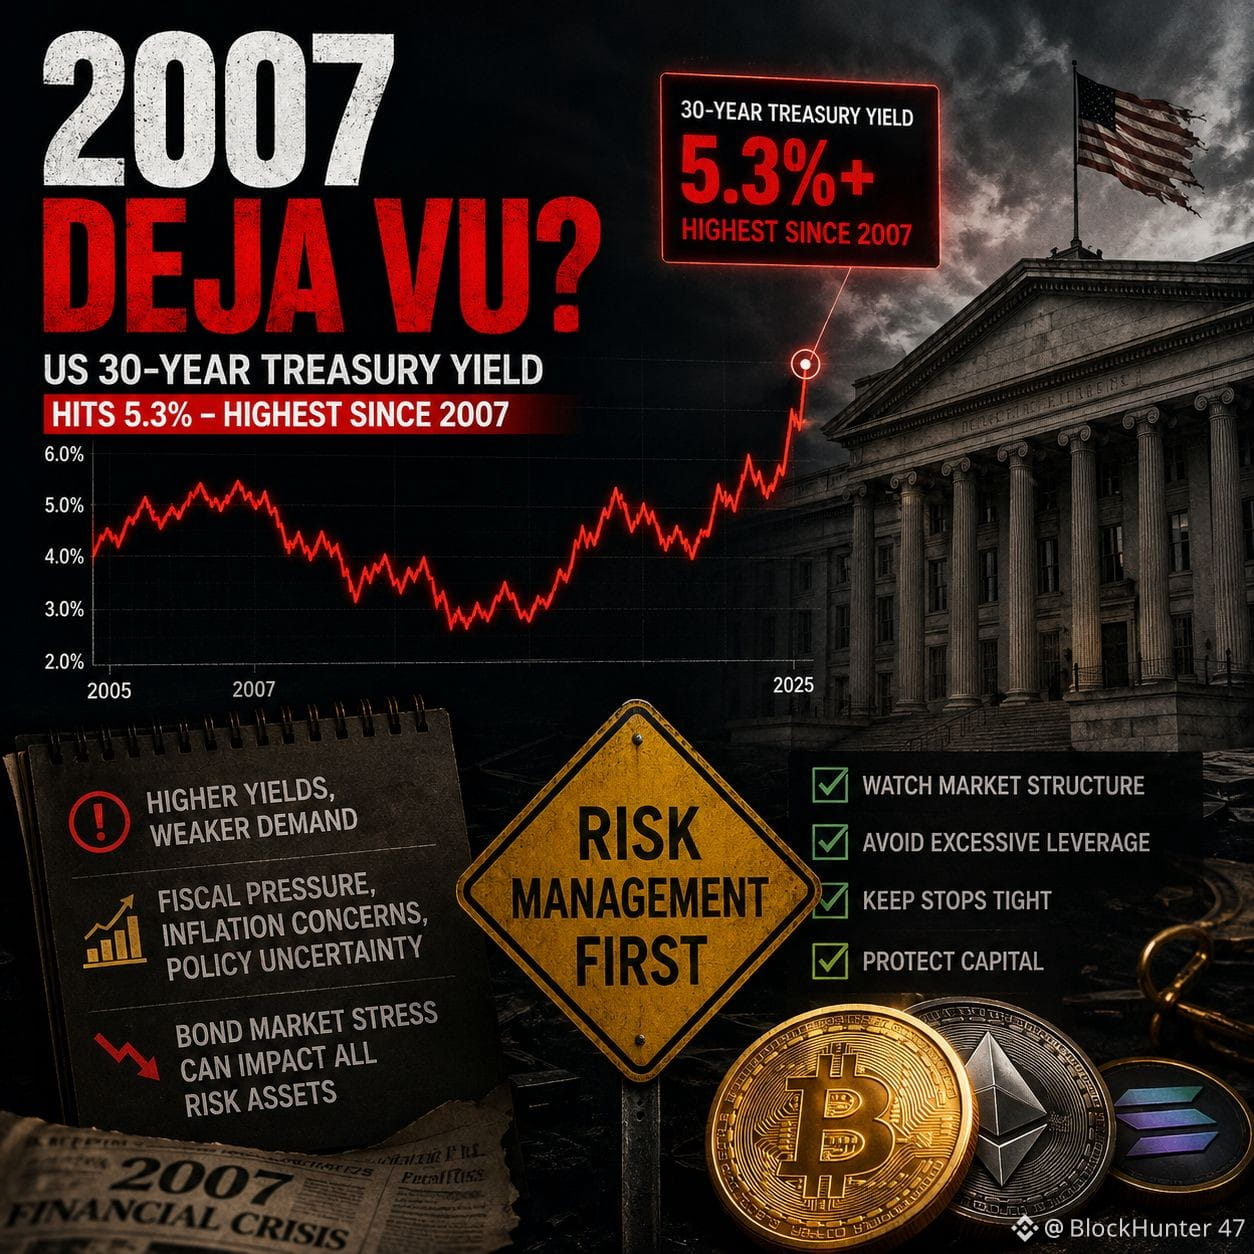
The bond market is giving traders a reason to pay attention — and the number 2007 keeps coming up.
The US 30-year Treasury yield has moved above 5.3%, reaching territory last seen before the Global Financial Crisis. But the yield itself isn't the only thing worth watching. The bigger question is why investors are demanding such a high return to hold long-term US government debt.
That points to a market dealing with more than just interest-rate expectations. Inflation risk, massive fiscal needs and uncertainty around future policy are all competing for attention.
And eventually, bond-market stress can spill into everything else.
Crypto is especially sensitive because liquidity can disappear quickly when traders start reducing risk. That's why I wouldn't read this setup as a simple “sell crypto” signal either.
I'd rather treat it as a risk-management signal: watch BTC structure, avoid excessive leverage, keep stops realistic and don't let one violent move force an emotional decision.
The 2007 comparison is interesting, but history doesn't repeat tick-for-tick.
Still, when the world's largest bond market starts behaving unusually, I think it's worth listening before the rest of the market catches up.
⚠️ Market commentary only. Not financial advice.
#MacroEconomy #BondYield #tradingStrategy
$HEMI
{future}(HEMIUSDT)
$OPG
{future}(OPGUSDT)
$BTC
{future}(BTCUSDT)
#us30yearyieldhitshighestsince2007
The bond market is giving traders a reason to pay attention — and the number 2007 keeps coming up.
The US 30-year Treasury yield has moved above 5.3%, reaching territory last seen before the Global Financial Crisis. But the yield itself isn't the only thing worth watching. The bigger question is why investors are demanding such a high return to hold long-term US government debt.
That points to a market dealing with more than just interest-rate expectations. Inflation risk, massive fiscal needs and uncertainty around future policy are all competing for attention.
And eventually, bond-market stress can spill into everything else.
Crypto is especially sensitive because liquidity can disappear quickly when traders start reducing risk. That's why I wouldn't read this setup as a simple “sell crypto” signal either.
I'd rather treat it as a risk-management signal: watch BTC structure, avoid excessive leverage, keep stops realistic and don't let one violent move force an emotional decision.
The 2007 comparison is interesting, but history doesn't repeat tick-for-tick.
Still, when the world's largest bond market starts behaving unusually, I think it's worth listening before the rest of the market catches up.
⚠️ Market commentary only. Not financial advice.
#MacroEconomy #BondYield #tradingStrategy
$HEMI
$OPG
$BTC
The bond market is giving traders a reason to pay attention — and the number 2007 keeps coming up.
The US 30-year Treasury yield has moved above 5.3%, reaching territory last seen before the Global Financial Crisis. But the yield itself isn't the only thing worth watching. The bigger question is why investors are demanding such a high return to hold long-term US government debt.
That points to a market dealing with more than just interest-rate expectations. Inflation risk, massive fiscal needs and uncertainty around future policy are all competing for attention.
And eventually, bond-market stress can spill into everything else.
Crypto is especially sensitive because liquidity can disappear quickly when traders start reducing risk. That's why I wouldn't read this setup as a simple “sell crypto” signal either.
I'd rather treat it as a risk-management signal: watch BTC structure, avoid excessive leverage, keep stops realistic and don't let one violent move force an emotional decision.
The 2007 comparison is interesting, but history doesn't repeat tick-for-tick.
Still, when the world's largest bond market starts behaving unusually, I think it's worth listening before the rest of the market catches up.
⚠️ Market commentary only. Not financial advice.
#MacroEconomy #BondYield #tradingStrategy
$HEMI
$OPG
$BTC
116

Verified
#us30yearyieldhitshighestsince2007
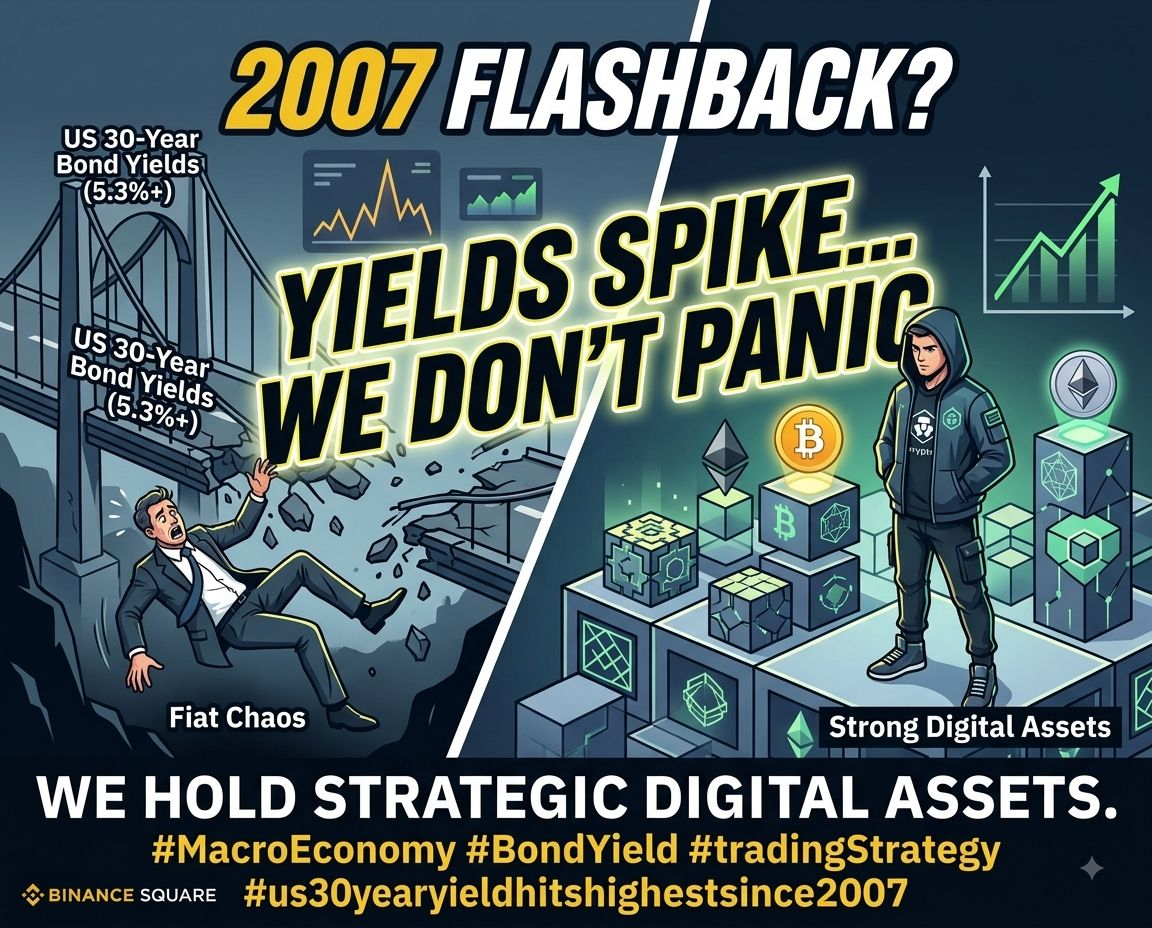
🚨 Macro Market Update: The 2007 Bond Market Deja Vu
The US Treasury market is currently mirroring the days leading up to the global financial crisis. The yield on the 30-year US Treasury bond has violently spiked to its highest level since 2007, climbing above 5.3%. Despite these surging payouts, buyers for long-term government debt are notably absent as macroeconomic and fiscal concerns mount.
The Strategic Play:
Extreme turbulence in sovereign bond markets inevitably impacts broader risk assets. To navigate this chaos effectively, traders must remain disciplined:
Avoid Capitulation: Do not panic-sell your digital asset portfolios to rotate into struggling fiat instruments.
Protect Capital: Monitor your charts closely, respect market structure, and aggressively tighten your stop-loss orders.
⚠️ Disclaimer: This is market commentary and does not constitute financial advice.
#MacroEconomy #BondYield #tradingStrategy
$TUT
{future}(TUTUSDT)
$ACU
{future}(ACUUSDT)
$ETH
{future}(ETHUSDT)
#us30yearyieldhitshighestsince2007
🚨 Macro Market Update: The 2007 Bond Market Deja Vu
The US Treasury market is currently mirroring the days leading up to the global financial crisis. The yield on the 30-year US Treasury bond has violently spiked to its highest level since 2007, climbing above 5.3%. Despite these surging payouts, buyers for long-term government debt are notably absent as macroeconomic and fiscal concerns mount.
The Strategic Play:
Extreme turbulence in sovereign bond markets inevitably impacts broader risk assets. To navigate this chaos effectively, traders must remain disciplined:
Avoid Capitulation: Do not panic-sell your digital asset portfolios to rotate into struggling fiat instruments.
Protect Capital: Monitor your charts closely, respect market structure, and aggressively tighten your stop-loss orders.
⚠️ Disclaimer: This is market commentary and does not constitute financial advice.
#MacroEconomy #BondYield #tradingStrategy
$TUT
$ACU
$ETH
🚨 Macro Market Update: The 2007 Bond Market Deja Vu
The US Treasury market is currently mirroring the days leading up to the global financial crisis. The yield on the 30-year US Treasury bond has violently spiked to its highest level since 2007, climbing above 5.3%. Despite these surging payouts, buyers for long-term government debt are notably absent as macroeconomic and fiscal concerns mount.
The Strategic Play:
Extreme turbulence in sovereign bond markets inevitably impacts broader risk assets. To navigate this chaos effectively, traders must remain disciplined:
Avoid Capitulation: Do not panic-sell your digital asset portfolios to rotate into struggling fiat instruments.
Protect Capital: Monitor your charts closely, respect market structure, and aggressively tighten your stop-loss orders.
⚠️ Disclaimer: This is market commentary and does not constitute financial advice.
#MacroEconomy #BondYield #tradingStrategy
$TUT
$ACU
$ETH

7
11.6k
Verified
#us30yearyieldhitshighestsince2007
🚨 Red Alert in Macro Markets: 2007 All Over Again?
The US debt landscape is flashing severe warning signs that directly echo the pre-2008 crash. Yields on 30-year US Treasuries have surged past 5.3%, touching peaks not seen in nearly two decades. Yet, even with these massive returns, institutional buyers are completely walking away as economic uncertainty escalates.
How to Play This Volatility:
Unprecedented instability in government debt spills over into every risk asset class, including crypto. Surviving this storm requires absolute strategy:
Hold the Line: Resist the urge to dump your crypto holdings out of fear just to flee back into failing paper assets.
Defend Your Risk: Watch price action like a hawk, respect key support zones, and tighten your risk management with strict stop-losses.
⚠️ Disclaimer: Market commentary only—not financial advice.
#macroeconomy #bondyield #tradingStrategy
$VVV
{future}(VVVUSDT)
$PRL
{future}(PRLUSDT)
$SOL
{future}(SOLUSDT)
#us30yearyieldhitshighestsince2007
🚨 Red Alert in Macro Markets: 2007 All Over Again?
The US debt landscape is flashing severe warning signs that directly echo the pre-2008 crash. Yields on 30-year US Treasuries have surged past 5.3%, touching peaks not seen in nearly two decades. Yet, even with these massive returns, institutional buyers are completely walking away as economic uncertainty escalates.
How to Play This Volatility:
Unprecedented instability in government debt spills over into every risk asset class, including crypto. Surviving this storm requires absolute strategy:
Hold the Line: Resist the urge to dump your crypto holdings out of fear just to flee back into failing paper assets.
Defend Your Risk: Watch price action like a hawk, respect key support zones, and tighten your risk management with strict stop-losses.
⚠️ Disclaimer: Market commentary only—not financial advice.
#macroeconomy #bondyield #tradingStrategy
$VVV
$PRL
$SOL
🚨 Red Alert in Macro Markets: 2007 All Over Again?
The US debt landscape is flashing severe warning signs that directly echo the pre-2008 crash. Yields on 30-year US Treasuries have surged past 5.3%, touching peaks not seen in nearly two decades. Yet, even with these massive returns, institutional buyers are completely walking away as economic uncertainty escalates.
How to Play This Volatility:
Unprecedented instability in government debt spills over into every risk asset class, including crypto. Surviving this storm requires absolute strategy:
Hold the Line: Resist the urge to dump your crypto holdings out of fear just to flee back into failing paper assets.
Defend Your Risk: Watch price action like a hawk, respect key support zones, and tighten your risk management with strict stop-losses.
⚠️ Disclaimer: Market commentary only—not financial advice.
#macroeconomy #bondyield #tradingStrategy
$VVV
$PRL
$SOL
3
4.6k

·
--
Bullish
Partly True
#us30yearyieldhitshighestsince2007
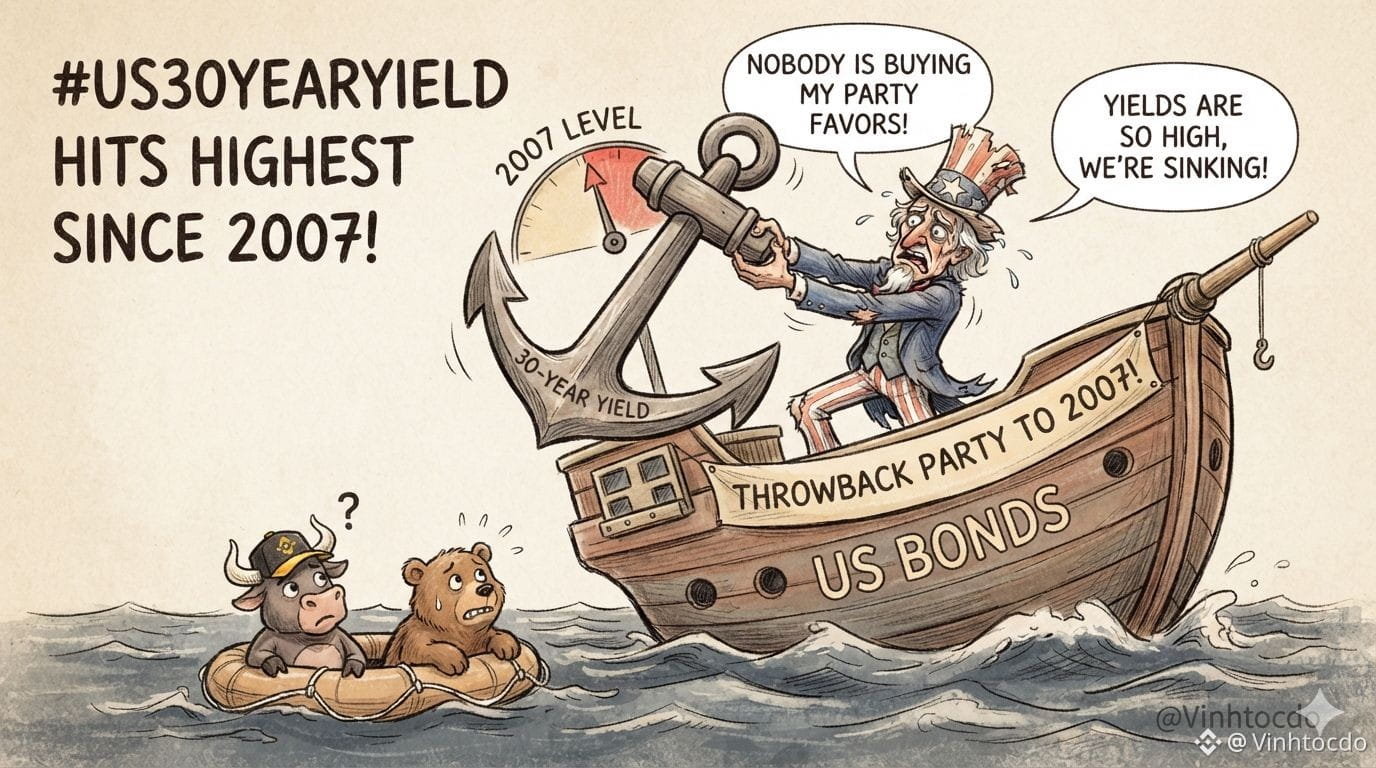
US bonds are throwing a throwback party to 2007, and nobody is buying it—literally! 😂 #us30yearyieldhitshighestsince2007
The buy rate for Uncle Sam’s 30-year debt is so low right now that the yields just spiked straight back to 2007 global financial crisis levels! Are we resetting the simulation or what? 💀
So, what should crypto traders do? Keep your eyes locked on the charts, tighten your stop-losses, and don't panic-sell your bags to buy boomer paper. 📉
⚠️ This is NOT financial advice!
If you want to trade through this chaos, grab my referral code VINHTOCDO or register directly at [Binance](https://www.binance.com/register?ref=VINHTOCDO) to lock in those fee discounts! 🚀
#MacroEconomy #BondYield #VINHTOCDO #tradingStrategy
$BTC
{future}(BTCUSDT)
$ETH
{future}(ETHUSDT)
$BNB
{future}(BNBUSDT)
#us30yearyieldhitshighestsince2007
US bonds are throwing a throwback party to 2007, and nobody is buying it—literally! 😂 #us30yearyieldhitshighestsince2007
The buy rate for Uncle Sam’s 30-year debt is so low right now that the yields just spiked straight back to 2007 global financial crisis levels! Are we resetting the simulation or what? 💀
So, what should crypto traders do? Keep your eyes locked on the charts, tighten your stop-losses, and don't panic-sell your bags to buy boomer paper. 📉
⚠️ This is NOT financial advice!
If you want to trade through this chaos, grab my referral code VINHTOCDO or register directly at Binance to lock in those fee discounts! 🚀
#MacroEconomy #BondYield #VINHTOCDO #tradingStrategy
$BTC
$ETH
$BNB
US bonds are throwing a throwback party to 2007, and nobody is buying it—literally! 😂 #us30yearyieldhitshighestsince2007
The buy rate for Uncle Sam’s 30-year debt is so low right now that the yields just spiked straight back to 2007 global financial crisis levels! Are we resetting the simulation or what? 💀
So, what should crypto traders do? Keep your eyes locked on the charts, tighten your stop-losses, and don't panic-sell your bags to buy boomer paper. 📉
⚠️ This is NOT financial advice!
If you want to trade through this chaos, grab my referral code VINHTOCDO or register directly at Binance to lock in those fee discounts! 🚀
#MacroEconomy #BondYield #VINHTOCDO #tradingStrategy
$BTC
$ETH
$BNB
4
543

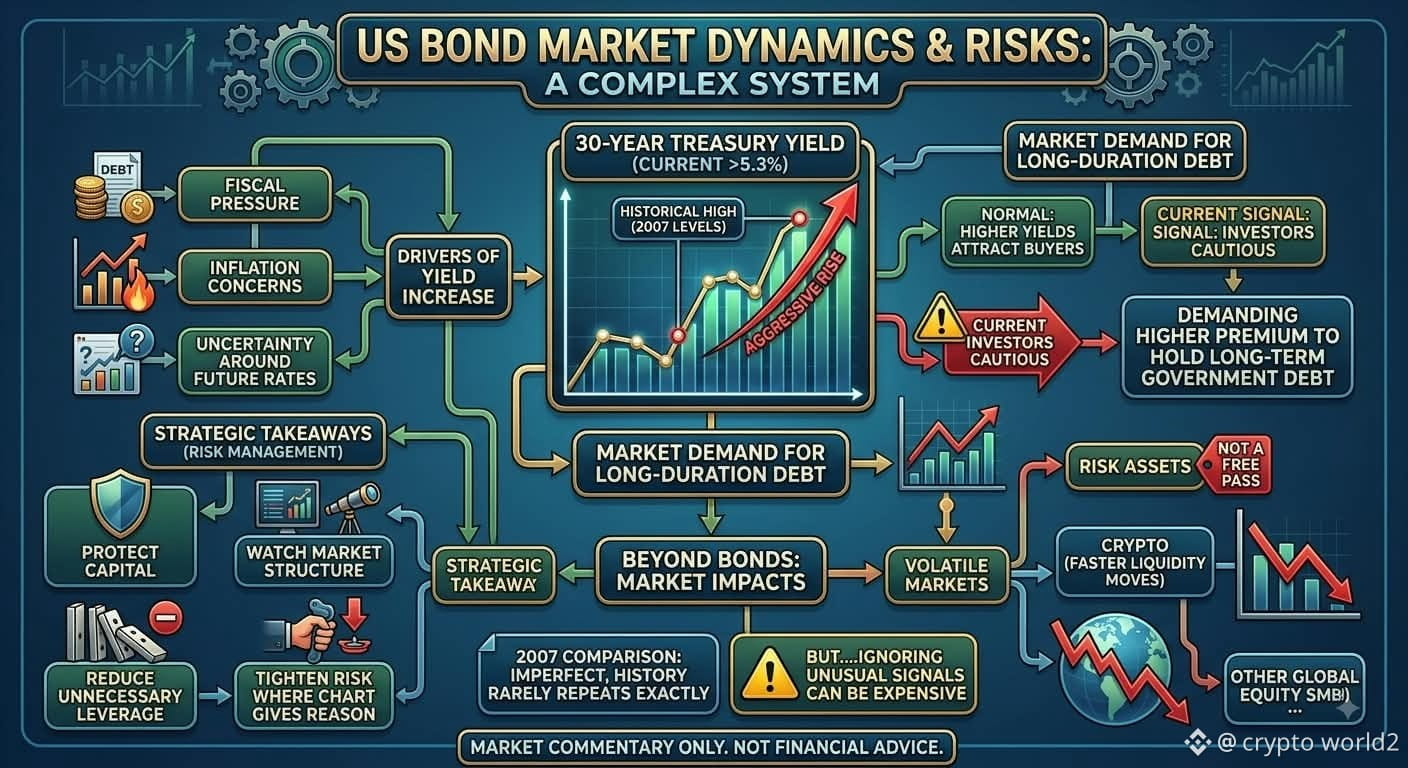
#us30yearyieldhitshighestsince2007 Something feels strangely familiar in the US bond market right now.
The 30-year Treasury yield has pushed above 5.3% — levels not seen since 2007. That comparison alone is enough to get attention, but the more interesting signal is what it says about demand for long-duration US debt.
Higher yields normally attract buyers. When yields are rising this aggressively while investors remain cautious, the market is basically demanding a bigger premium to hold long-term government debt. Fiscal pressure, inflation concerns and uncertainty around future rates are all part of that equation.
And this matters beyond bonds.
When the world’s biggest bond market becomes this volatile, risk assets usually don’t get a free pass. Crypto can react quickly because liquidity moves faster there than in traditional markets.
For me, the takeaway isn’t “panic and sell everything.”
It’s the opposite: protect capital, watch market structure, reduce unnecessary leverage and tighten risk where the chart gives you a reason to.
The 2007 comparison may be imperfect — history rarely repeats exactly.
But when the bond market starts flashing unusual signals, ignoring them can be more expensive than paying attention.
⚠️ Market commentary only. Not financial advice.#MacroEconomy #BondYield #tradingStrategy .
$TUT
{future}(TUTUSDT)
$ACU
{future}(ACUUSDT)
$ETH
{spot}(ETHUSDT)
#us30yearyieldhitshighestsince2007 Something feels strangely familiar in the US bond market right now.
The 30-year Treasury yield has pushed above 5.3% — levels not seen since 2007. That comparison alone is enough to get attention, but the more interesting signal is what it says about demand for long-duration US debt.
Higher yields normally attract buyers. When yields are rising this aggressively while investors remain cautious, the market is basically demanding a bigger premium to hold long-term government debt. Fiscal pressure, inflation concerns and uncertainty around future rates are all part of that equation.
And this matters beyond bonds.
When the world’s biggest bond market becomes this volatile, risk assets usually don’t get a free pass. Crypto can react quickly because liquidity moves faster there than in traditional markets.
For me, the takeaway isn’t “panic and sell everything.”
It’s the opposite: protect capital, watch market structure, reduce unnecessary leverage and tighten risk where the chart gives you a reason to.
The 2007 comparison may be imperfect — history rarely repeats exactly.
But when the bond market starts flashing unusual signals, ignoring them can be more expensive than paying attention.
⚠️ Market commentary only. Not financial advice.#MacroEconomy #BondYield #tradingStrategy .
$TUT
$ACU
$ETH
The 30-year Treasury yield has pushed above 5.3% — levels not seen since 2007. That comparison alone is enough to get attention, but the more interesting signal is what it says about demand for long-duration US debt.
Higher yields normally attract buyers. When yields are rising this aggressively while investors remain cautious, the market is basically demanding a bigger premium to hold long-term government debt. Fiscal pressure, inflation concerns and uncertainty around future rates are all part of that equation.
And this matters beyond bonds.
When the world’s biggest bond market becomes this volatile, risk assets usually don’t get a free pass. Crypto can react quickly because liquidity moves faster there than in traditional markets.
For me, the takeaway isn’t “panic and sell everything.”
It’s the opposite: protect capital, watch market structure, reduce unnecessary leverage and tighten risk where the chart gives you a reason to.
The 2007 comparison may be imperfect — history rarely repeats exactly.
But when the bond market starts flashing unusual signals, ignoring them can be more expensive than paying attention.
⚠️ Market commentary only. Not financial advice.#MacroEconomy #BondYield #tradingStrategy .
$TUT
$ACU
$ETH
1
1
66


·
--
#US30YearYieldHitsHighestSince2007
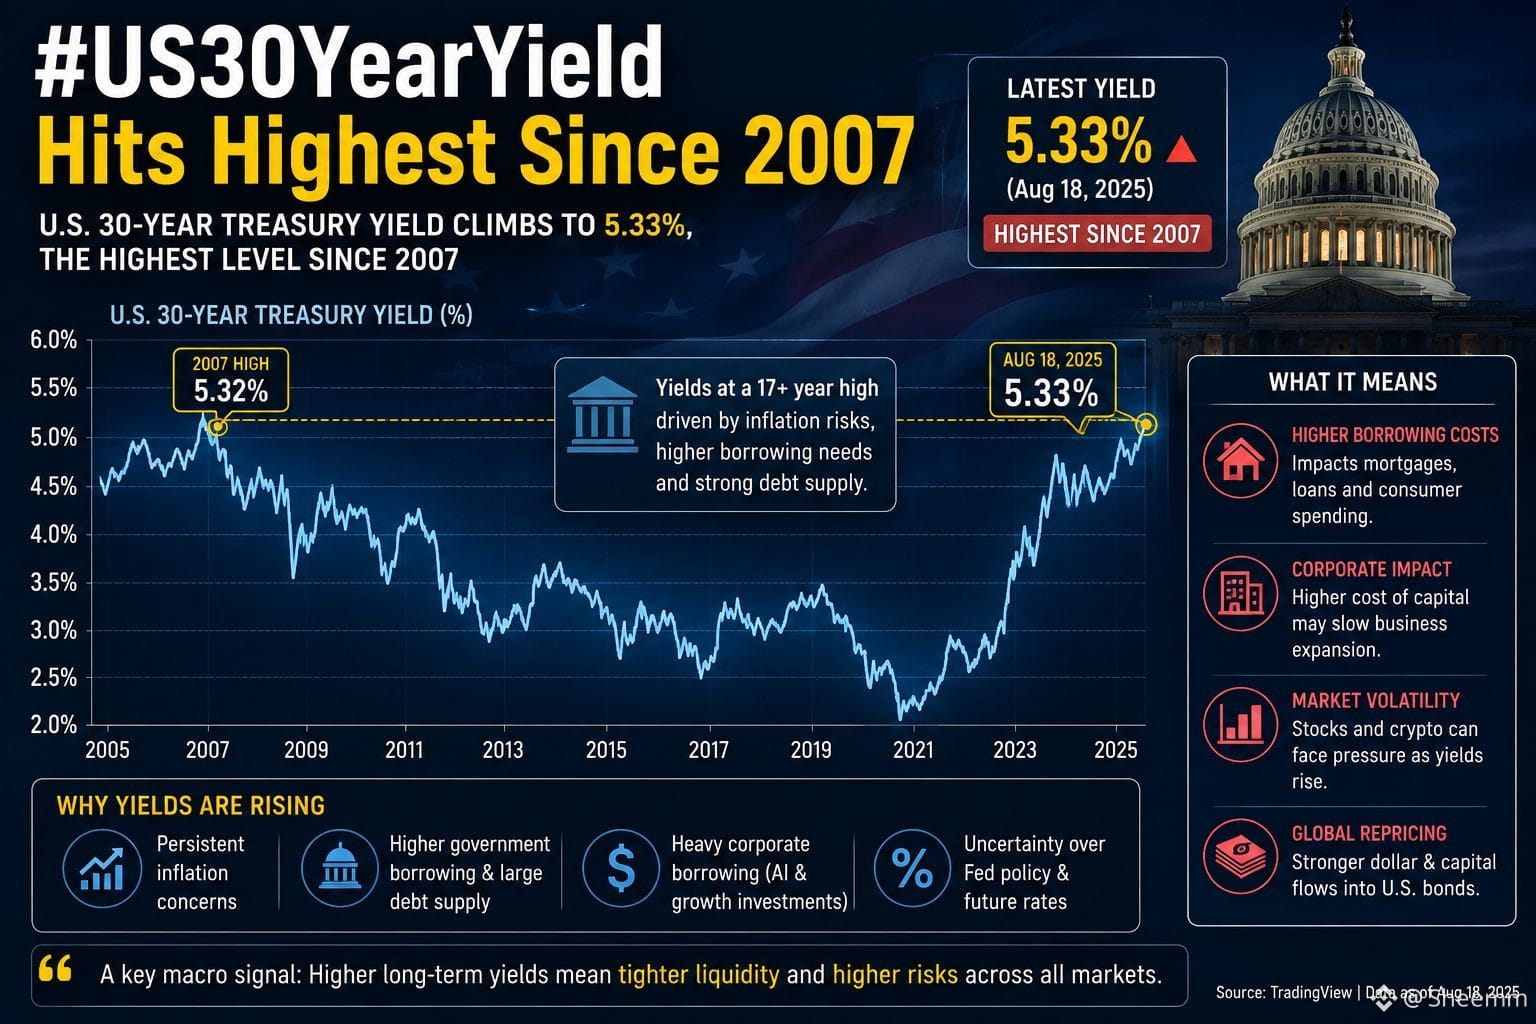
The U.S. bond market is sending a signal I’m not ignoring. The 30-year Treasury yield has climbed to around 5.33%, its highest level since 2007.
What stands out to me is that this isn’t just about the Fed. Investors are increasingly focused on government borrowing, persistent inflation risks and the growing supply of long-term debt. Heavy corporate borrowing, including AI-related financing, is adding another layer of pressure.
Higher long-term yields mean a higher cost of capital across the economy. That can eventually affect mortgages, corporate financing, stocks and crypto.
For me, this is a macro signal worth watching closely—not necessarily a crash warning, but definitely a reminder that liquidity and borrowing costs still matter.
$EDEN
{future}(EDENUSDT)
$CLO
{alpha}(560x81d3a238b02827f62b9f390f947d36d4a5bf89d2)
$XPL
{future}(XPLUSDT)
#VIXFallsTo2026Low
#Write2Earn!
#US30YearYieldHitsHighestSince2007
The U.S. bond market is sending a signal I’m not ignoring. The 30-year Treasury yield has climbed to around 5.33%, its highest level since 2007.
What stands out to me is that this isn’t just about the Fed. Investors are increasingly focused on government borrowing, persistent inflation risks and the growing supply of long-term debt. Heavy corporate borrowing, including AI-related financing, is adding another layer of pressure.
Higher long-term yields mean a higher cost of capital across the economy. That can eventually affect mortgages, corporate financing, stocks and crypto.
For me, this is a macro signal worth watching closely—not necessarily a crash warning, but definitely a reminder that liquidity and borrowing costs still matter.
$EDEN
$CLO
$XPL
#VIXFallsTo2026Low
#Write2Earn!
The U.S. bond market is sending a signal I’m not ignoring. The 30-year Treasury yield has climbed to around 5.33%, its highest level since 2007.
What stands out to me is that this isn’t just about the Fed. Investors are increasingly focused on government borrowing, persistent inflation risks and the growing supply of long-term debt. Heavy corporate borrowing, including AI-related financing, is adding another layer of pressure.
Higher long-term yields mean a higher cost of capital across the economy. That can eventually affect mortgages, corporate financing, stocks and crypto.
For me, this is a macro signal worth watching closely—not necessarily a crash warning, but definitely a reminder that liquidity and borrowing costs still matter.
$EDEN
$CLO
$XPL
#VIXFallsTo2026Low
#Write2Earn!
3
499

🔥💵 WHY 5.3% TREASURY YIELDS MATTER
The U.S. 30-year yield has climbed to roughly 5.33%, its highest since 2007.
That means the market is demanding significantly more return to hold long-term U.S. government debt.
The pressure is coming from several directions: inflation risks, oil above $90, fiscal concerns and heavy bond supply.
If yields remain elevated, valuations across markets could face a tougher environment.
$BTC $ETH $BNB — watch the macro, not just the candles. 📊
#us30yearyieldhitshighestsince2007
🔥💵 WHY 5.3% TREASURY YIELDS MATTER
The U.S. 30-year yield has climbed to roughly 5.33%, its highest since 2007.
That means the market is demanding significantly more return to hold long-term U.S. government debt.
The pressure is coming from several directions: inflation risks, oil above $90, fiscal concerns and heavy bond supply.
If yields remain elevated, valuations across markets could face a tougher environment.
$BTC $ETH $BNB — watch the macro, not just the candles. 📊
#us30yearyieldhitshighestsince2007
The U.S. 30-year yield has climbed to roughly 5.33%, its highest since 2007.
That means the market is demanding significantly more return to hold long-term U.S. government debt.
The pressure is coming from several directions: inflation risks, oil above $90, fiscal concerns and heavy bond supply.
If yields remain elevated, valuations across markets could face a tougher environment.
$BTC $ETH $BNB — watch the macro, not just the candles. 📊
#us30yearyieldhitshighestsince2007
46

·
--
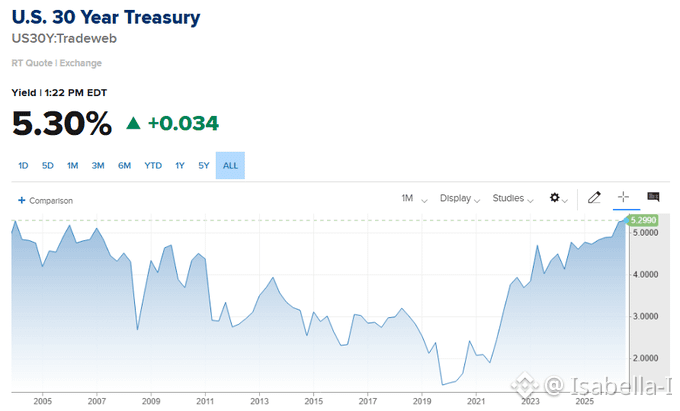
#us30yearyieldhitshighestsince2007 U.S. 30-Year Treasury Yield Hits 5.30%The yield on the 30-year U.S. Treasury bond climbed to about 5.31% on Monday, its highest level since 2007 and the run-up to the Global Financial Crisis
The rise reflects investor concerns over heavy government borrowing, sticky inflation, and increased long-term bond issuance.$SEI $CYBER $ARK
#us30yearyieldhitshighestsince2007 U.S. 30-Year Treasury Yield Hits 5.30%The yield on the 30-year U.S. Treasury bond climbed to about 5.31% on Monday, its highest level since 2007 and the run-up to the Global Financial Crisis
The rise reflects investor concerns over heavy government borrowing, sticky inflation, and increased long-term bond issuance.$SEI $CYBER $ARK
The rise reflects investor concerns over heavy government borrowing, sticky inflation, and increased long-term bond issuance.$SEI $CYBER $ARK
156

#US30YearYieldHitsHighestSince2007
🚨 The bond market is sending a serious signal.
The U.S. 30-year Treasury yield has climbed above 5.3% — its highest level since 2007. 📈 That means investors are demanding higher returns to hold long-term U.S. debt, amid concerns about inflation, oil prices, government borrowing and geopolitical risks.
In simple terms: borrowing just got more expensive for longer. 💸 And when long-term yields rise this much, stocks, housing and other risk assets can feel the pressure.
The big question: Is 5.3% the warning… or just the beginning? 👀
#TreasuryYields #US30Y #Bonds #Inflation
$BTC
{spot}(BTCUSDT)
$ETH
{spot}(ETHUSDT)
$XRP
{spot}(XRPUSDT)
#US30YearYieldHitsHighestSince2007
🚨 The bond market is sending a serious signal.
The U.S. 30-year Treasury yield has climbed above 5.3% — its highest level since 2007. 📈 That means investors are demanding higher returns to hold long-term U.S. debt, amid concerns about inflation, oil prices, government borrowing and geopolitical risks.
In simple terms: borrowing just got more expensive for longer. 💸 And when long-term yields rise this much, stocks, housing and other risk assets can feel the pressure.
The big question: Is 5.3% the warning… or just the beginning? 👀
#TreasuryYields #US30Y #Bonds #Inflation
$BTC
$ETH
$XRP
🚨 The bond market is sending a serious signal.
The U.S. 30-year Treasury yield has climbed above 5.3% — its highest level since 2007. 📈 That means investors are demanding higher returns to hold long-term U.S. debt, amid concerns about inflation, oil prices, government borrowing and geopolitical risks.
In simple terms: borrowing just got more expensive for longer. 💸 And when long-term yields rise this much, stocks, housing and other risk assets can feel the pressure.
The big question: Is 5.3% the warning… or just the beginning? 👀
#TreasuryYields #US30Y #Bonds #Inflation
$BTC
$ETH
$XRP
50

·
--
📈 US Debt obligations: the 30-year yield at its highest since 2007!
In the US bond market, the yield on 30-year Treasury notes has reached unprecedented highs since 2007. This pressure in long-term rates reflects the ongoing adjustment by markets to macroeconomic expectations and the Federal Reserve’s trajectory.
What to remember:
Long rates: This rise in sovereign debt weighs on the overall cost of credit and the valuations of risky assets.
Macroeconomic vigilance: A key indicator of institutional investors’ confidence.
The strategy of the moment: Don’t endure the volatility of interest-rate markets. Analyze the major macroeconomic imbalances and manage your exposures with rigor and discipline. ⚔️🔋
---
Verification is automatic; discretion protects intent; efficiency validates profit.
#DrYo242 : Your shield against volatility 🛡️
$XPL $ETH $RED
#us30yearyieldhitshighestsince2007
📈 US Debt obligations: the 30-year yield at its highest since 2007!
In the US bond market, the yield on 30-year Treasury notes has reached unprecedented highs since 2007. This pressure in long-term rates reflects the ongoing adjustment by markets to macroeconomic expectations and the Federal Reserve’s trajectory.
What to remember:
Long rates: This rise in sovereign debt weighs on the overall cost of credit and the valuations of risky assets.
Macroeconomic vigilance: A key indicator of institutional investors’ confidence.
The strategy of the moment: Don’t endure the volatility of interest-rate markets. Analyze the major macroeconomic imbalances and manage your exposures with rigor and discipline. ⚔️🔋
---
Verification is automatic; discretion protects intent; efficiency validates profit.
#DrYo242 : Your shield against volatility 🛡️
$XPL $ETH $RED
#us30yearyieldhitshighestsince2007
In the US bond market, the yield on 30-year Treasury notes has reached unprecedented highs since 2007. This pressure in long-term rates reflects the ongoing adjustment by markets to macroeconomic expectations and the Federal Reserve’s trajectory.
What to remember:
Long rates: This rise in sovereign debt weighs on the overall cost of credit and the valuations of risky assets.
Macroeconomic vigilance: A key indicator of institutional investors’ confidence.
The strategy of the moment: Don’t endure the volatility of interest-rate markets. Analyze the major macroeconomic imbalances and manage your exposures with rigor and discipline. ⚔️🔋
---
Verification is automatic; discretion protects intent; efficiency validates profit.
#DrYo242 : Your shield against volatility 🛡️
$XPL $ETH $RED
#us30yearyieldhitshighestsince2007

5
454

·
--
Bullish
#US30YearYieldHitsHighestSince2007
The U.S. 30-year Treasury yield rose nearly 6 basis points on Monday to 5.31%, the highest since 2007; the 10-year yield stood around 4.72%. Last week’s 30-year new-issue auction cleared at 5.216%, the highest since 2001.
Market concerns center on nearly $2 trillion in annual fiscal deficits continuously boosting supply, combined with inflation remaining above target and rising corporate issuance linked to $AI infrastructure.
The rapid rise in long-end yields increases financing costs and puts pressure on high-valuation growth stocks, while reinforcing cautious pricing of the Fed’s policy path.
$KII
$DOS
#US30YearYieldHitsHighestSince2007
The U.S. 30-year Treasury yield rose nearly 6 basis points on Monday to 5.31%, the highest since 2007; the 10-year yield stood around 4.72%. Last week’s 30-year new-issue auction cleared at 5.216%, the highest since 2001.
Market concerns center on nearly $2 trillion in annual fiscal deficits continuously boosting supply, combined with inflation remaining above target and rising corporate issuance linked to $AI infrastructure.
The rapid rise in long-end yields increases financing costs and puts pressure on high-valuation growth stocks, while reinforcing cautious pricing of the Fed’s policy path.
$KII
$DOS
The U.S. 30-year Treasury yield rose nearly 6 basis points on Monday to 5.31%, the highest since 2007; the 10-year yield stood around 4.72%. Last week’s 30-year new-issue auction cleared at 5.216%, the highest since 2001.
Market concerns center on nearly $2 trillion in annual fiscal deficits continuously boosting supply, combined with inflation remaining above target and rising corporate issuance linked to $AI infrastructure.
The rapid rise in long-end yields increases financing costs and puts pressure on high-valuation growth stocks, while reinforcing cautious pricing of the Fed’s policy path.
$KII
$DOS
75
⚠️🌍 BOND MARKET JUST SENT A WARNING
The 30-year U.S. Treasury yield has reached its highest level since 2007, climbing above 5.3%.
Higher oil prices are reviving inflation concerns, while fiscal pressures and increased debt supply are adding another layer of uncertainty.
When long-term yields rise this quickly, investors have to reassess the cost of money across the economy.
That makes $BTC, $ETH and $BNB worth monitoring—not blindly chasing. 👀📉
#us30yearyieldhitshighestsince2007
⚠️🌍 BOND MARKET JUST SENT A WARNING
The 30-year U.S. Treasury yield has reached its highest level since 2007, climbing above 5.3%.
Higher oil prices are reviving inflation concerns, while fiscal pressures and increased debt supply are adding another layer of uncertainty.
When long-term yields rise this quickly, investors have to reassess the cost of money across the economy.
That makes $BTC, $ETH and $BNB worth monitoring—not blindly chasing. 👀📉
#us30yearyieldhitshighestsince2007
The 30-year U.S. Treasury yield has reached its highest level since 2007, climbing above 5.3%.
Higher oil prices are reviving inflation concerns, while fiscal pressures and increased debt supply are adding another layer of uncertainty.
When long-term yields rise this quickly, investors have to reassess the cost of money across the economy.
That makes $BTC, $ETH and $BNB worth monitoring—not blindly chasing. 👀📉
#us30yearyieldhitshighestsince2007
60

·
--
Bullish
Verified
#us30yearyieldhitshighestsince2007 US 30-Year Treasury Yield Hits Highest Level Since 2007 🇺🇸📈
The US 30-year Treasury yield has climbed to its highest level since 2007, signaling renewed pressure in the long-term bond market.
Higher long-term yields can tighten financial conditions, increase borrowing costs, and put pressure on risk assets such as stocks and crypto. 📉
Markets will now be watching inflation, government borrowing, Treasury supply and upcoming Federal Reserve signals closely.#US30YearYieldHitsHighestSince2007 $XAUT
{spot}(XAUTUSDT)
$BTC
{spot}(BTCUSDT)
$BZ.US
{stock_us}(BZ.US)
#us30yearyieldhitshighestsince2007 US 30-Year Treasury Yield Hits Highest Level Since 2007 🇺🇸📈
The US 30-year Treasury yield has climbed to its highest level since 2007, signaling renewed pressure in the long-term bond market.
Higher long-term yields can tighten financial conditions, increase borrowing costs, and put pressure on risk assets such as stocks and crypto. 📉
Markets will now be watching inflation, government borrowing, Treasury supply and upcoming Federal Reserve signals closely.#US30YearYieldHitsHighestSince2007 $XAUT
$BTC
$BZ.US
The US 30-year Treasury yield has climbed to its highest level since 2007, signaling renewed pressure in the long-term bond market.
Higher long-term yields can tighten financial conditions, increase borrowing costs, and put pressure on risk assets such as stocks and crypto. 📉
Markets will now be watching inflation, government borrowing, Treasury supply and upcoming Federal Reserve signals closely.#US30YearYieldHitsHighestSince2007 $XAUT
$BTC
$BZ.US

1
6
3k
🚨📈 30-YEAR TREASURY YIELD HITS A 19-YEAR HIGH
The U.S. 30-year Treasury yield has climbed above 5.3%, reaching its highest level since 2007.
Rising oil prices, inflation concerns and worries about U.S. fiscal conditions are pushing long-term borrowing costs higher.
This matters far beyond bonds: higher long-term yields can pressure stocks, housing and other risk assets.
For spot-market investors, $BTC, $ETH and $BNB are worth watching as liquidity conditions change. 👀
#us30yearyieldhitshighestsince2007
🚨📈 30-YEAR TREASURY YIELD HITS A 19-YEAR HIGH
The U.S. 30-year Treasury yield has climbed above 5.3%, reaching its highest level since 2007.
Rising oil prices, inflation concerns and worries about U.S. fiscal conditions are pushing long-term borrowing costs higher.
This matters far beyond bonds: higher long-term yields can pressure stocks, housing and other risk assets.
For spot-market investors, $BTC, $ETH and $BNB are worth watching as liquidity conditions change. 👀
#us30yearyieldhitshighestsince2007
The U.S. 30-year Treasury yield has climbed above 5.3%, reaching its highest level since 2007.
Rising oil prices, inflation concerns and worries about U.S. fiscal conditions are pushing long-term borrowing costs higher.
This matters far beyond bonds: higher long-term yields can pressure stocks, housing and other risk assets.
For spot-market investors, $BTC, $ETH and $BNB are worth watching as liquidity conditions change. 👀
#us30yearyieldhitshighestsince2007
36
📊🚨 2007 LEVELS ARE BACK IN THE BOND MARKET
The U.S. 30-year Treasury yield has crossed 5.3%, reaching territory last seen in 2007.
This isn't simply a bond-market headline.
Higher long-term yields can increase borrowing costs and make investors rethink how much they're willing to pay for stocks and other risk assets.
For crypto, the important variable is whether tighter financial conditions eventually reduce risk appetite.
$BTC, $ETH and $BNB are now part of a much bigger macro story. 🌐
#us30yearyieldhitshighestsince2007
📊🚨 2007 LEVELS ARE BACK IN THE BOND MARKET
The U.S. 30-year Treasury yield has crossed 5.3%, reaching territory last seen in 2007.
This isn't simply a bond-market headline.
Higher long-term yields can increase borrowing costs and make investors rethink how much they're willing to pay for stocks and other risk assets.
For crypto, the important variable is whether tighter financial conditions eventually reduce risk appetite.
$BTC, $ETH and $BNB are now part of a much bigger macro story. 🌐
#us30yearyieldhitshighestsince2007
The U.S. 30-year Treasury yield has crossed 5.3%, reaching territory last seen in 2007.
This isn't simply a bond-market headline.
Higher long-term yields can increase borrowing costs and make investors rethink how much they're willing to pay for stocks and other risk assets.
For crypto, the important variable is whether tighter financial conditions eventually reduce risk appetite.
$BTC, $ETH and $BNB are now part of a much bigger macro story. 🌐
#us30yearyieldhitshighestsince2007
60

·
--
#US30YearYieldHitsHighestSince2007
US Treasury Yields Hit 19-Year High🚀
U.S. 30-year Treasury yield reaches 5.33%, highest level since 2007, as fiscal and inflation concerns weigh on long-term bonds. Rising yields adding pressure to risk assets including Bitcoin, creating challenging macro environment for cryptocurrency markets and investor sentiment.$RED $CLO $VVV
#US30YearYieldHitsHighestSince2007
US Treasury Yields Hit 19-Year High🚀
U.S. 30-year Treasury yield reaches 5.33%, highest level since 2007, as fiscal and inflation concerns weigh on long-term bonds. Rising yields adding pressure to risk assets including Bitcoin, creating challenging macro environment for cryptocurrency markets and investor sentiment.$RED $CLO $VVV
US Treasury Yields Hit 19-Year High🚀
U.S. 30-year Treasury yield reaches 5.33%, highest level since 2007, as fiscal and inflation concerns weigh on long-term bonds. Rising yields adding pressure to risk assets including Bitcoin, creating challenging macro environment for cryptocurrency markets and investor sentiment.$RED $CLO $VVV

1
85

·
--
Bullish
Verified
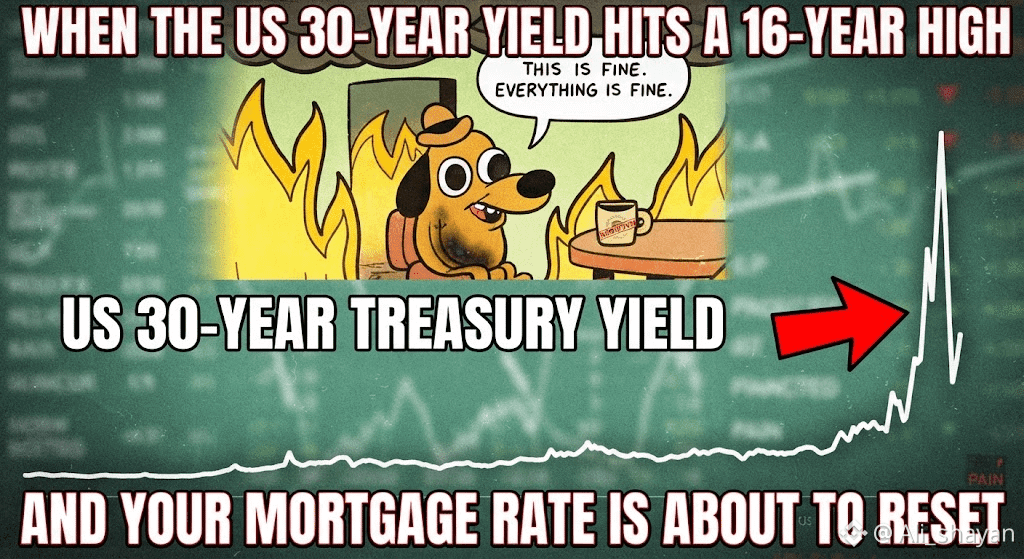
#us30yearyieldhitshighestsince2007 The yield on the US 30-year Treasury bond has climbed above 5.3%, hitting its highest level since June 2007. This major jump happens as investors worry about rising oil prices, growing inflation risks, and heavy government borrowing. When these long-term yields go up, it usually means that everyday borrowing costs like mortgages and business loans will also become more expensive. Markets are reacting closely as financial pressures continue to grow globally.
CLICK BELOW TO TRADE : $BTC $SOL $SPCX
{future}(SPCXUSDT)
{future}(SOLUSDT)
{future}(BTCUSDT)
#us30yearyieldhitshighestsince2007 The yield on the US 30-year Treasury bond has climbed above 5.3%, hitting its highest level since June 2007. This major jump happens as investors worry about rising oil prices, growing inflation risks, and heavy government borrowing. When these long-term yields go up, it usually means that everyday borrowing costs like mortgages and business loans will also become more expensive. Markets are reacting closely as financial pressures continue to grow globally.
CLICK BELOW TO TRADE : $BTC $SOL $SPCX
CLICK BELOW TO TRADE : $BTC $SOL $SPCX
1
1.2k

·
--
US 30-Year Yield Hits Highest Since 2007
The US 30-year Treasury yield jumped to 5.31% on August 17, 2026
its highest level in nearly 20 years.
Investors are selling bonds over worries about big government debt, heavy new bond sales, and inflation that stays above the Fed’s target.
Corporate borrowing for AI projects is adding more pressure.
Similar moves hit Canadian and European bonds too. Higher long-term rates raise borrowing costs for the government and can affect mortgages and loans over time.
Markets are watching if this trend continues.
$SNDK
{future}(SNDKUSDT)
{stock_us}(SNDK.US)
{spot}(SNDKBUSDT)
$SOL $ETH
#us30yearyieldhitshighestsince2007
US 30-Year Yield Hits Highest Since 2007
The US 30-year Treasury yield jumped to 5.31% on August 17, 2026
its highest level in nearly 20 years.
Investors are selling bonds over worries about big government debt, heavy new bond sales, and inflation that stays above the Fed’s target.
Corporate borrowing for AI projects is adding more pressure.
Similar moves hit Canadian and European bonds too. Higher long-term rates raise borrowing costs for the government and can affect mortgages and loans over time.
Markets are watching if this trend continues.
$SNDK
$SOL $ETH
#us30yearyieldhitshighestsince2007
The US 30-year Treasury yield jumped to 5.31% on August 17, 2026
its highest level in nearly 20 years.
Investors are selling bonds over worries about big government debt, heavy new bond sales, and inflation that stays above the Fed’s target.
Corporate borrowing for AI projects is adding more pressure.
Similar moves hit Canadian and European bonds too. Higher long-term rates raise borrowing costs for the government and can affect mortgages and loans over time.
Markets are watching if this trend continues.
$SNDK
$SOL $ETH
#us30yearyieldhitshighestsince2007
1
347

#US30YearYieldHitsHighestSince2007 The trending hashtag **#US30YearYieldHitsHighestSince2007** follows a sharp surge in the 30-year U.S. Treasury yield above **5.31%**—reaching its highest level in 19 years (since June 2007).
What makes this long-duration selloff notable is that yields spiked even as soft domestic data (such as falling retail sales and cooling job growth) lowered expectations for near-term Federal Reserve rate hikes.
---
### Key Drivers Behind the Yield Spike
* **Fiscal Deficits & Massive Supply:** The U.S. government faces significant debt-servicing demands and a fiscal deficit that reached $432 billion in July alone. The market is demanding a higher term premium to absorb heavy Treasury bond issuance.
* **Foreign Central Bank Selling:** Key global holders—including Japan and China—reduced their U.S. Treasury stockpiles. Japan's central bank sold Treasuries to support the Japanese yen, dampening baseline foreign demand for long-duration U.S. debt.
* **Energy Inflation Concerns:** Brent crude rising above $90/barrel amid ongoing geopolitical friction has fueled worries that sticky energy costs could prevent the Fed from easing policy as fast as expected.
* **Capital Competition from Corporate Issuance:** Rapid corporate bond issuance—particularly heavy debt borrowing to fund artificial intelligence infrastructure and capital projects—has created extra competition for long-term capital.
---
### Broad Economic & Market Impacts
| Market / Sector | Direct Impact | Underlying Mechanism |
| --- | --- | --- |
| **Housing & Mortgages** | Mortgage rates push higher | 30-year fixed mortgages directly benchmark against 10-year and 30-year Treasury yields. |
| **Equities & Valuations** | Growth & tech stock pressure | Higher discount rates reduce the present value of future corporate earnings. |
| **Federal Debt Service** | Annual interest costs surge | Refinancing older, lower-rate government debt at ~5.3% increases annual deficit obligation$BNB
{spot}(BNBUSDT)
$BTC
{spot}(BTCUSDT)
$ETH
{spot}(ETHUSDT)
#US30YearYieldHitsHighestSince2007 The trending hashtag **#US30YearYieldHitsHighestSince2007** follows a sharp surge in the 30-year U.S. Treasury yield above **5.31%**—reaching its highest level in 19 years (since June 2007).
What makes this long-duration selloff notable is that yields spiked even as soft domestic data (such as falling retail sales and cooling job growth) lowered expectations for near-term Federal Reserve rate hikes.
---
### Key Drivers Behind the Yield Spike
* **Fiscal Deficits & Massive Supply:** The U.S. government faces significant debt-servicing demands and a fiscal deficit that reached $432 billion in July alone. The market is demanding a higher term premium to absorb heavy Treasury bond issuance.
* **Foreign Central Bank Selling:** Key global holders—including Japan and China—reduced their U.S. Treasury stockpiles. Japan's central bank sold Treasuries to support the Japanese yen, dampening baseline foreign demand for long-duration U.S. debt.
* **Energy Inflation Concerns:** Brent crude rising above $90/barrel amid ongoing geopolitical friction has fueled worries that sticky energy costs could prevent the Fed from easing policy as fast as expected.
* **Capital Competition from Corporate Issuance:** Rapid corporate bond issuance—particularly heavy debt borrowing to fund artificial intelligence infrastructure and capital projects—has created extra competition for long-term capital.
---
### Broad Economic & Market Impacts
| Market / Sector | Direct Impact | Underlying Mechanism |
| --- | --- | --- |
| **Housing & Mortgages** | Mortgage rates push higher | 30-year fixed mortgages directly benchmark against 10-year and 30-year Treasury yields. |
| **Equities & Valuations** | Growth & tech stock pressure | Higher discount rates reduce the present value of future corporate earnings. |
| **Federal Debt Service** | Annual interest costs surge | Refinancing older, lower-rate government debt at ~5.3% increases annual deficit obligation$BNB
$BTC
$ETH
What makes this long-duration selloff notable is that yields spiked even as soft domestic data (such as falling retail sales and cooling job growth) lowered expectations for near-term Federal Reserve rate hikes.
---
### Key Drivers Behind the Yield Spike
* **Fiscal Deficits & Massive Supply:** The U.S. government faces significant debt-servicing demands and a fiscal deficit that reached $432 billion in July alone. The market is demanding a higher term premium to absorb heavy Treasury bond issuance.
* **Foreign Central Bank Selling:** Key global holders—including Japan and China—reduced their U.S. Treasury stockpiles. Japan's central bank sold Treasuries to support the Japanese yen, dampening baseline foreign demand for long-duration U.S. debt.
* **Energy Inflation Concerns:** Brent crude rising above $90/barrel amid ongoing geopolitical friction has fueled worries that sticky energy costs could prevent the Fed from easing policy as fast as expected.
* **Capital Competition from Corporate Issuance:** Rapid corporate bond issuance—particularly heavy debt borrowing to fund artificial intelligence infrastructure and capital projects—has created extra competition for long-term capital.
---
### Broad Economic & Market Impacts
| Market / Sector | Direct Impact | Underlying Mechanism |
| --- | --- | --- |
| **Housing & Mortgages** | Mortgage rates push higher | 30-year fixed mortgages directly benchmark against 10-year and 30-year Treasury yields. |
| **Equities & Valuations** | Growth & tech stock pressure | Higher discount rates reduce the present value of future corporate earnings. |
| **Federal Debt Service** | Annual interest costs surge | Refinancing older, lower-rate government debt at ~5.3% increases annual deficit obligation$BNB
$BTC
$ETH

1
66
Log in to explore more content
Join global crypto users on Binance Square
⚡️ Get latest and useful information about crypto.
💬 Trusted by the world’s largest crypto exchange.
👍 Discover real insights from verified creators.
Email / Phone number
Trending Topics
1
#NFPWatch
10.8M views
19,038 Discussing
2
#BitcoinFundingRateTriplesTo10%
120,122 views
1,021 Discussing
3
#BitcoinSurpasses$86KUp2.99%
36,479 views
99 Discussing
4
#ZcashFalls21%FromSeptemberPeak
71,162 views
764 Discussing
5
#USSeptemberPayrollsAdd29KUnemploymentRises4.2%
58,931 views
458 Discussing
6
#XRPPostsFirstThreeGreenMonthsInQ3
47,238 views
636 Discussing
7
#BNBChainTokenizedStocksTop$1BAt30%Share
20,997 views
35 Discussing
8
#BitcoinRisesToward$85K
106,313 views
150 Discussing
9
#AmazonPlansToSell$8BNvidiaChips
7,434 views
88 Discussing
10
#NEARFallsToAround$4.70Down14%
46,994 views
116 Discussing