

#tia
tia
114.7M views
232,443 Discussing
Hot
Latest

·
--
Bearish
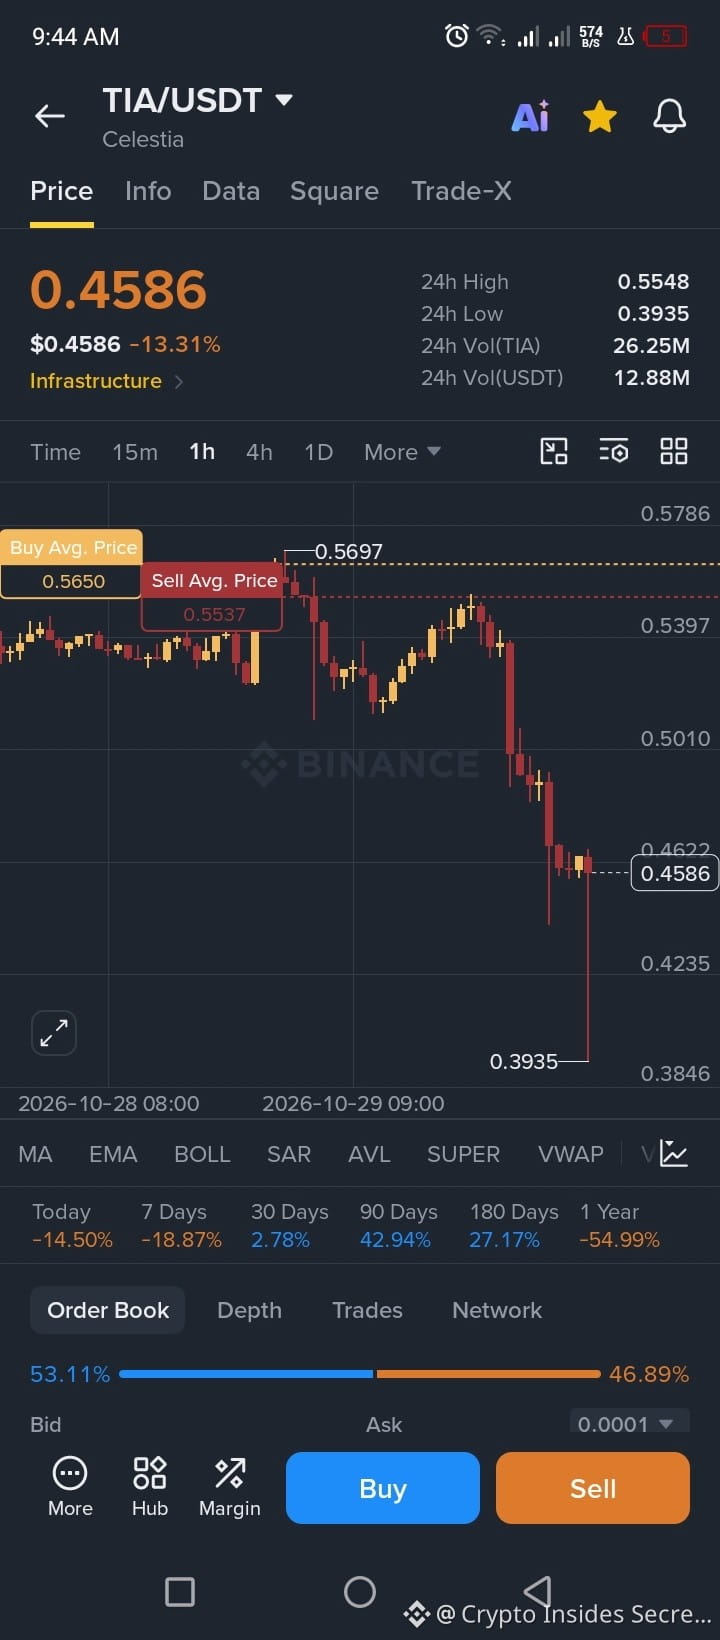
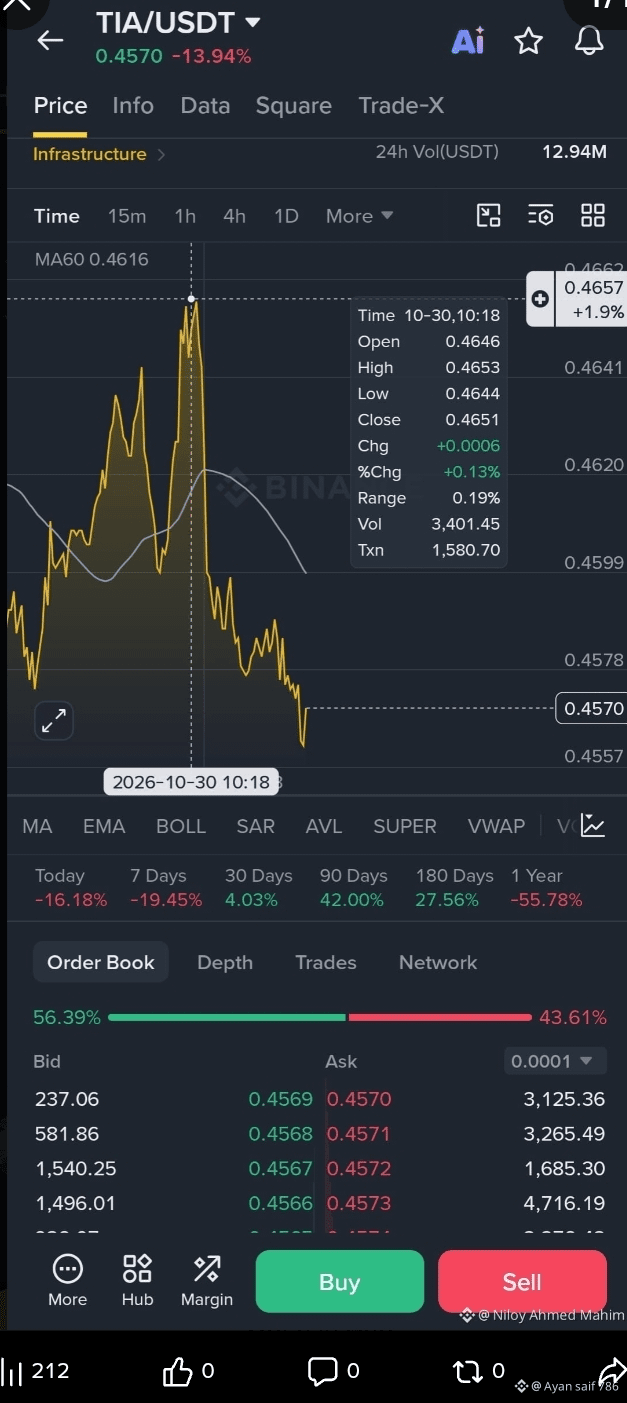
🚨 $TIA BRUTAL LIQUIDATION HUNT! 💀
TIA crashed to $0.3935, wiping out leveraged positions and triggering panic among traders.
But what happened next?
BOOM! Price suddenly bounced to $0.4578!
First, bulls got trapped. Then bears may have been caught off guard.
Was this a calculated liquidity grab or just extreme market volatility?
⚠️ TIA is becoming a nightmare for leveraged traders!
WHO'S NEXT? BULLS OR BEARS?
#TIA #celestia #cryptouniverseofficial
$LDO $NEAR
2
746

·
--
Bearish
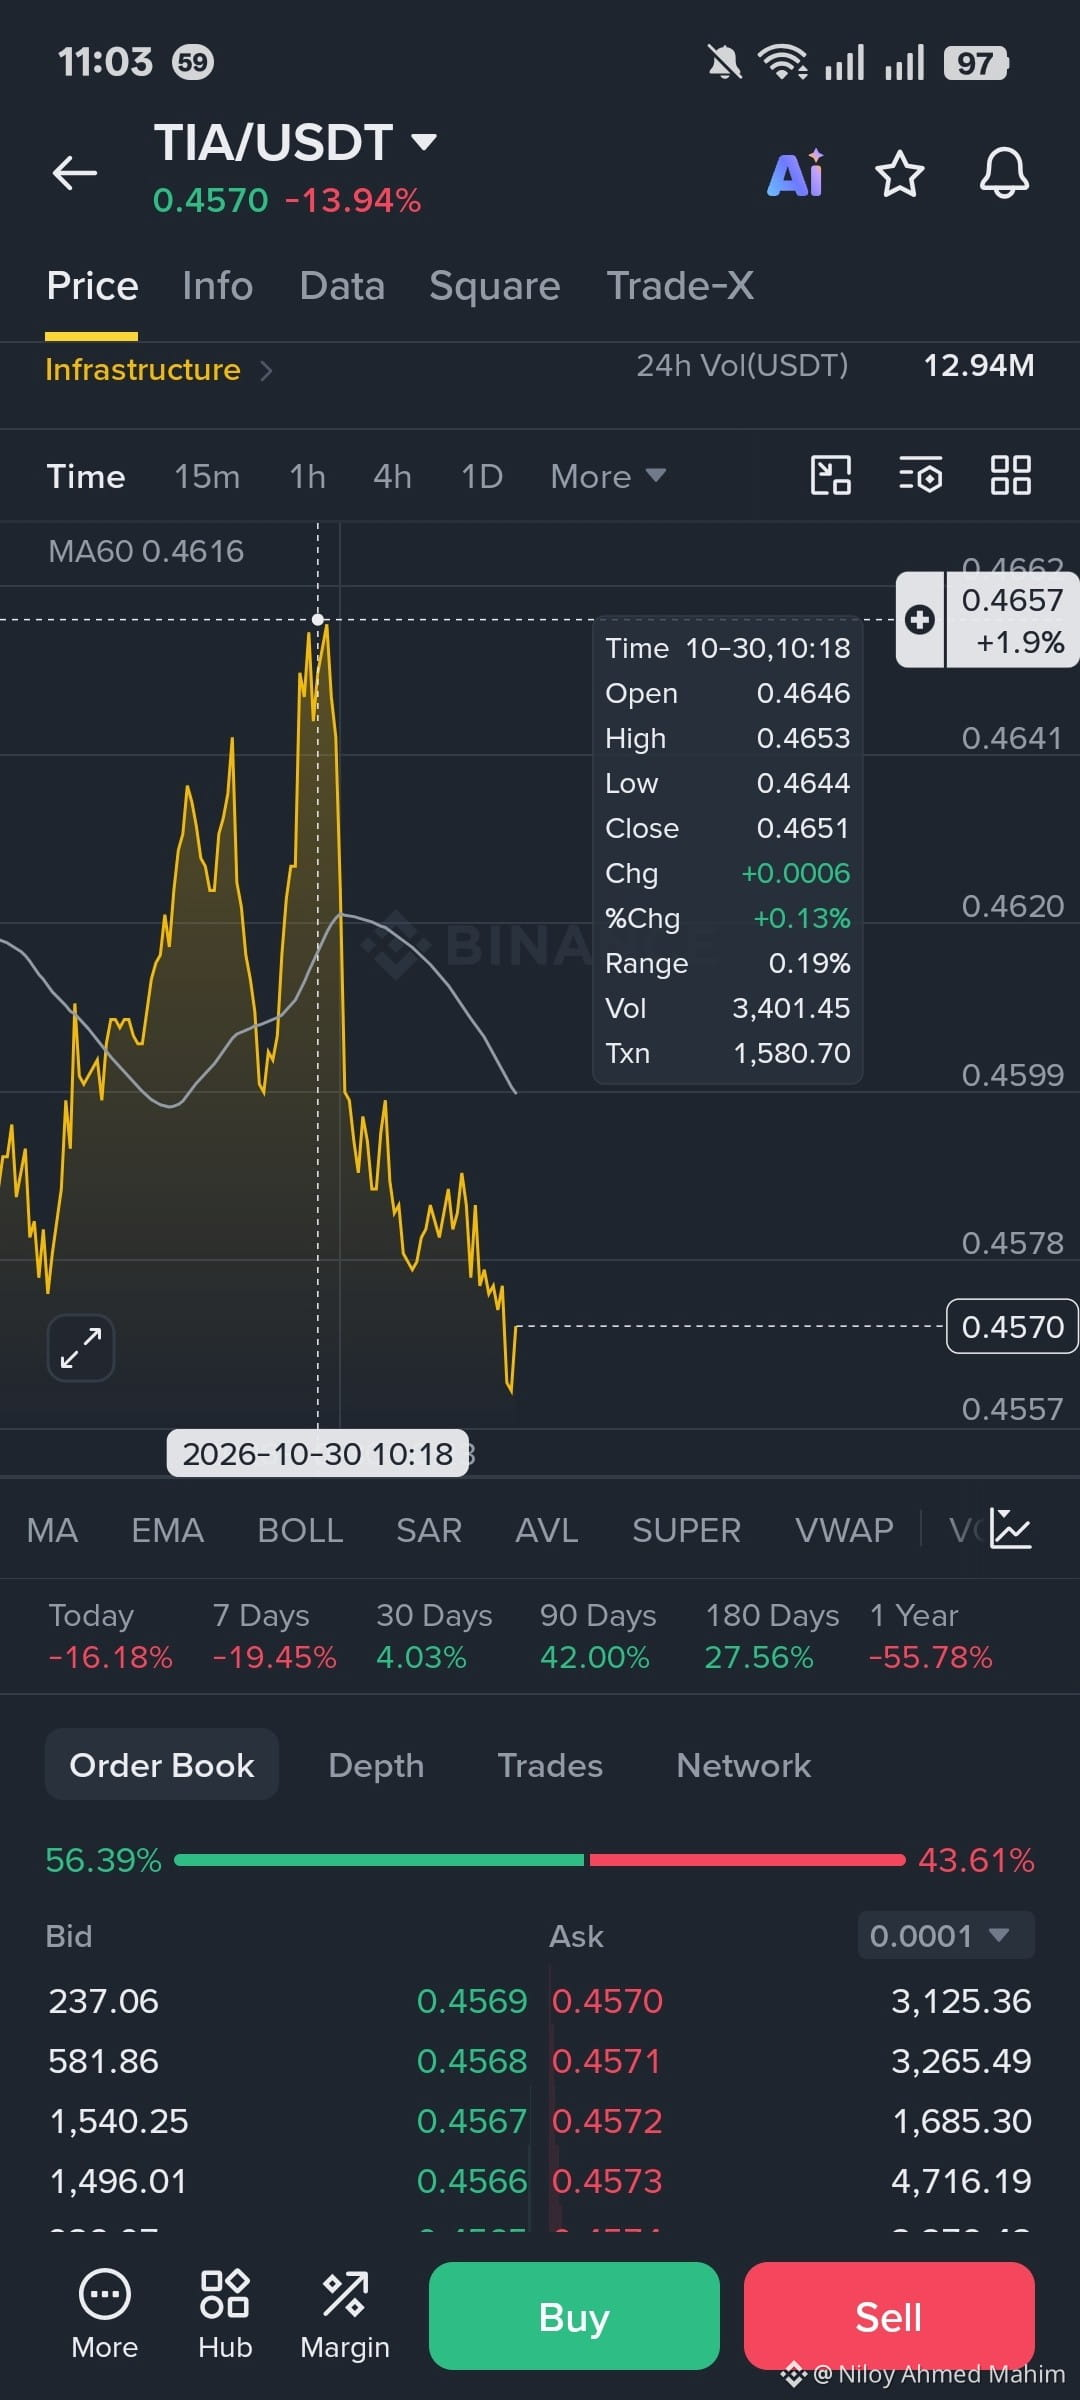
$TIA LIQUIDITY CHAOS!
TIA experienced a massive sell-off, dropping to $0.4557 and forcing leveraged traders into liquidation.
But the real surprise came next!
A sudden price reaction caught the market off guard, leaving both bulls and bears questioning their positions.
Was it a strategic liquidity sweep or simply aggressive market volatility?
One thing is clear: trading $TIA with high leverage is getting increasingly risky!
WHO WILL GET CAUGHT NEXT — BULLS OR BEARS? 👀
#tia #celestia #CryptoMarket #LiquidityHunt $LDO #EarningsSeason
{spot}(TIAUSDT)
$TIA LIQUIDITY CHAOS!
TIA experienced a massive sell-off, dropping to $0.4557 and forcing leveraged traders into liquidation.
But the real surprise came next!
A sudden price reaction caught the market off guard, leaving both bulls and bears questioning their positions.
Was it a strategic liquidity sweep or simply aggressive market volatility?
One thing is clear: trading $TIA with high leverage is getting increasingly risky!
WHO WILL GET CAUGHT NEXT — BULLS OR BEARS? 👀
#tia #celestia #CryptoMarket #LiquidityHunt $LDO #EarningsSeason
277

·
--
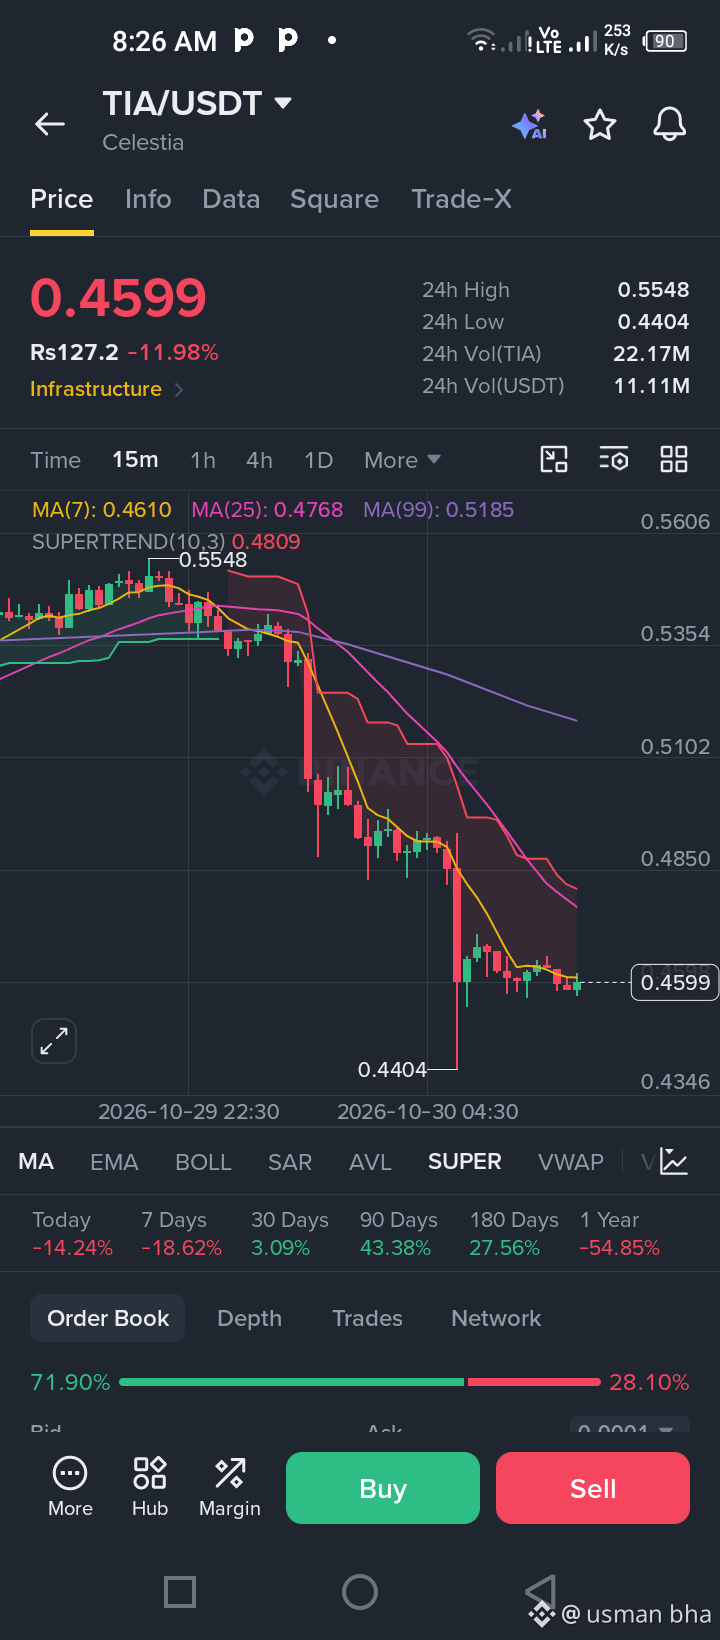
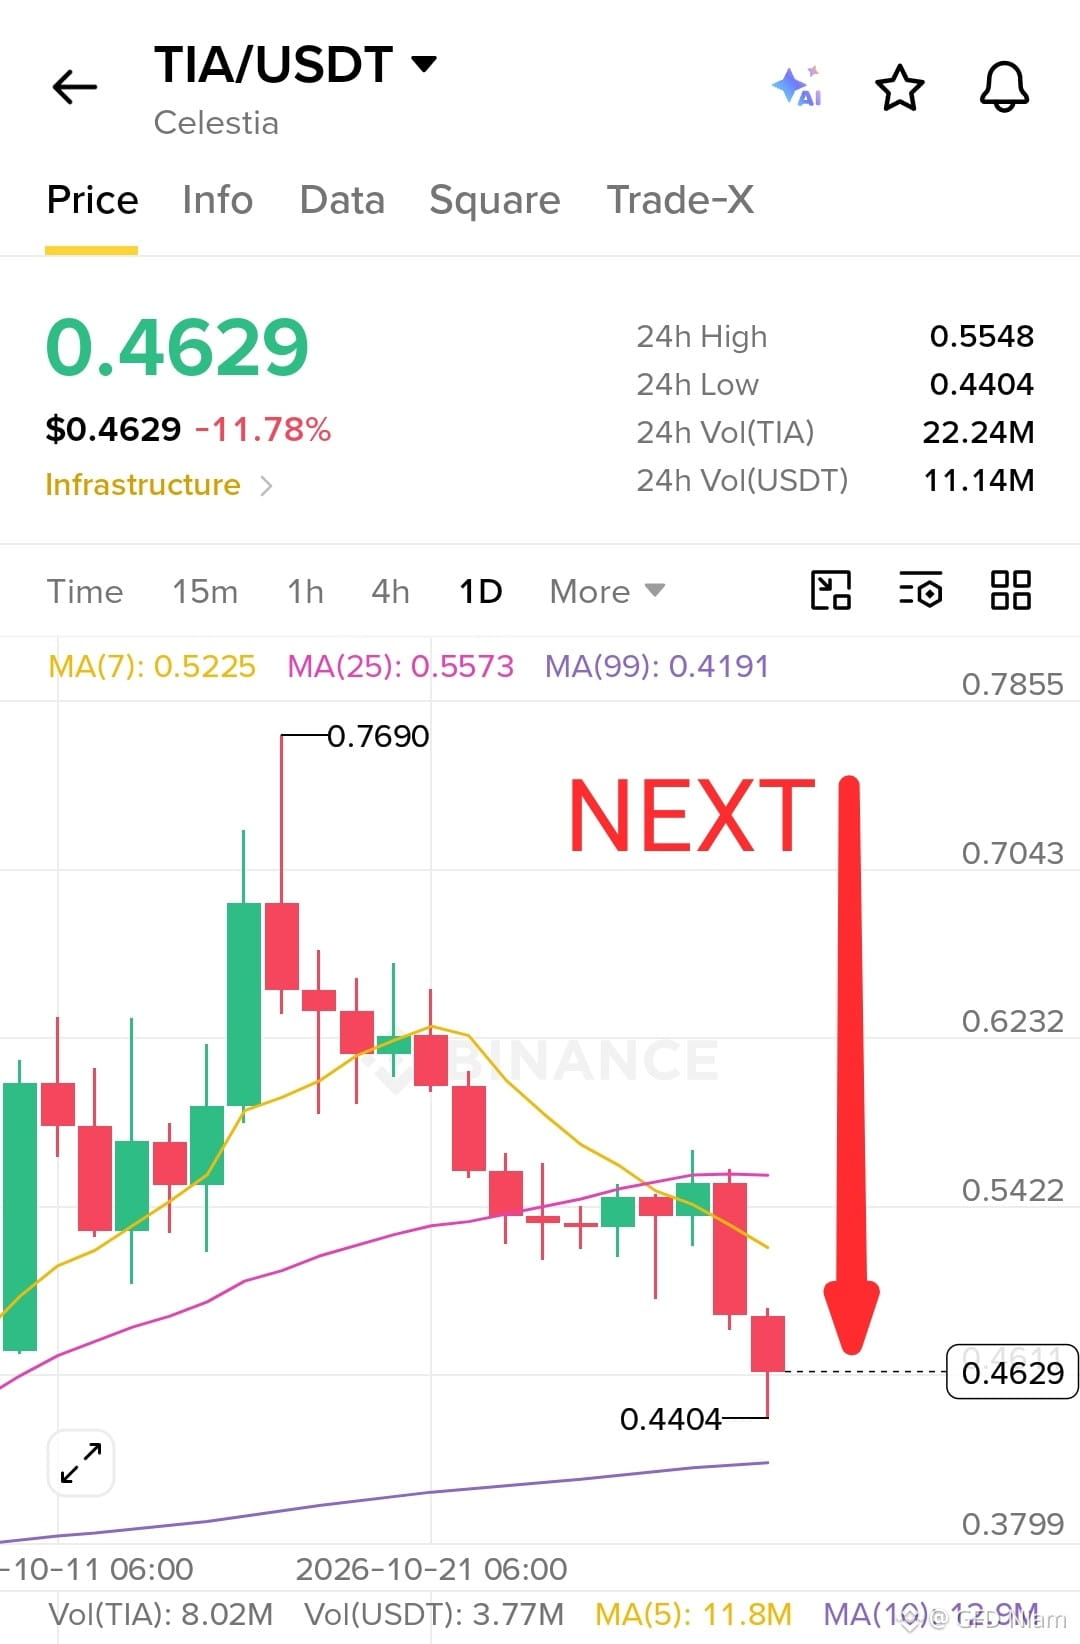
🚨 $TIA IS TAKING A SERIOUS HIT! HOW MUCH LOWER CAN IT GO? 📉
This is more than just a normal correction — $TIA is under heavy selling pressure! 💀
📉 $0.7690 → $0.4404 🔥 Down 42.7% in just 14 days!
And the selling pressure isn't letting up yet.
Bitcoin’s latest drop is adding even more pressure to the market, leaving TIA holders feeling the pain.
⚠️ Will $TIA find support and bounce back, or is more downside ahead?
Keep a close eye on the market and manage your risk carefully! 👀
#TIA
387


·
--
Bullish
$TIA
{future}(TIAUSDT)
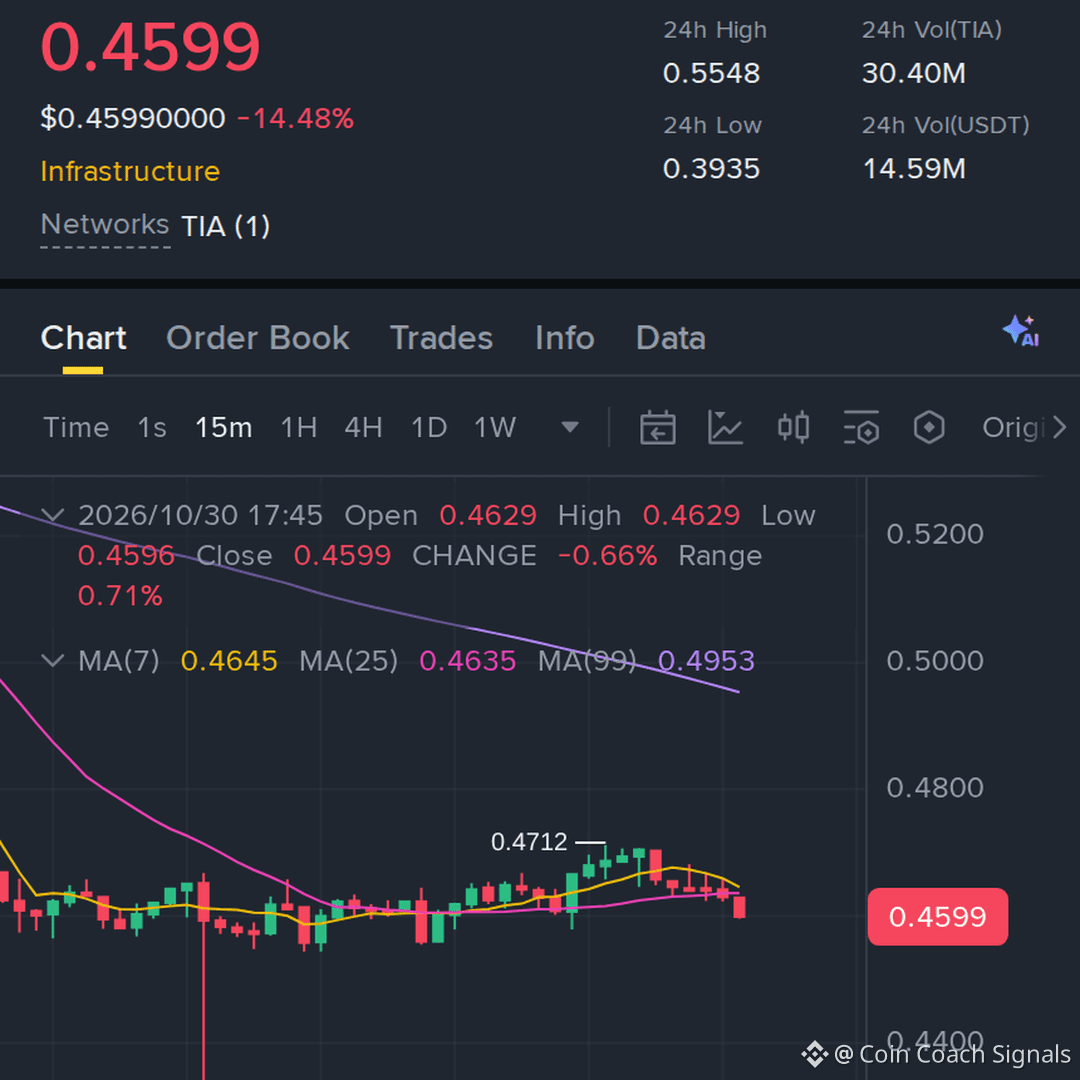
Reality Check: Technical indicators show a 66% Bearish market feeling with a Fear & Greed Index score at a completely neutral 50. This is exactly the zone where contrarian accumulation pattern start to form
#tia #Binance #CryptoDawar #Ripple
$TIA
Reality Check: Technical indicators show a 66% Bearish market feeling with a Fear & Greed Index score at a completely neutral 50. This is exactly the zone where contrarian accumulation pattern start to form
#tia #Binance #CryptoDawar #Ripple
Reality Check: Technical indicators show a 66% Bearish market feeling with a Fear & Greed Index score at a completely neutral 50. This is exactly the zone where contrarian accumulation pattern start to form
#tia #Binance #CryptoDawar #Ripple

1
194

·
--
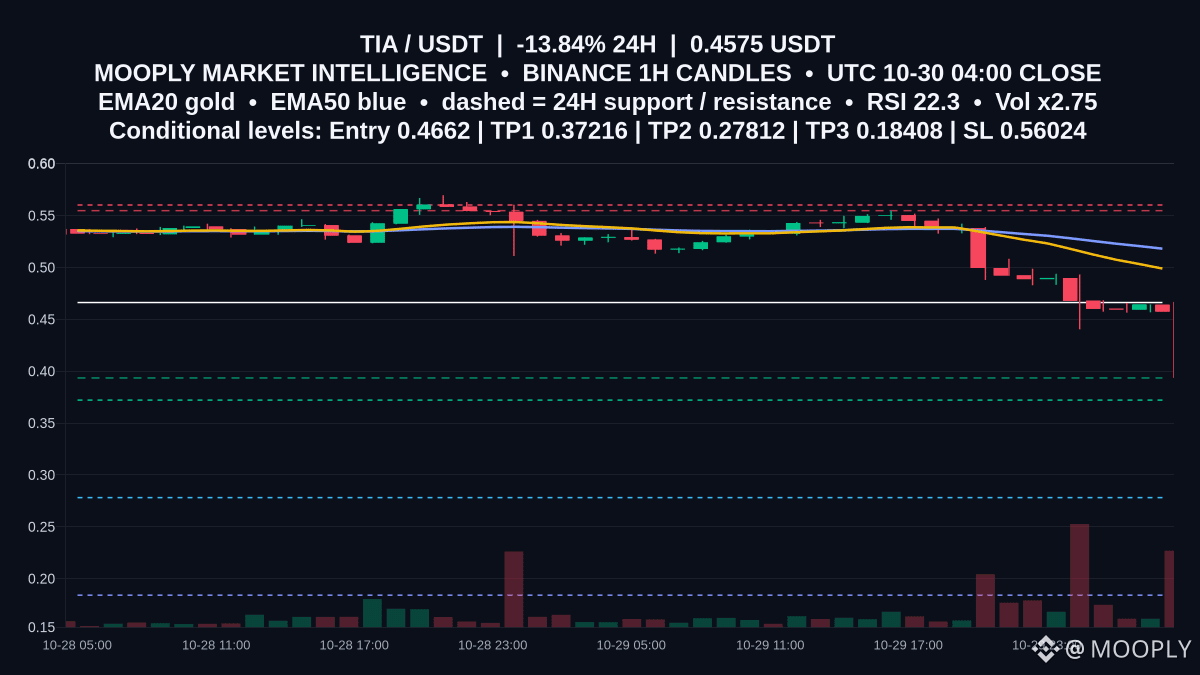
Fresh downside momentum: -13.838% in 24h puts $TIA at 0.4575, with volume running 2.75x its recent pace.
RSI 22.27 is stretched, yet price sits under EMA20 0.49896 and EMA50 0.51815—trend still skewed lower. Key resistance is 0.5548; nearest support 0.3935.
📍 Potential entry: 0.4662
🎯 Target 1: 0.37216
🎯 Target 2: 0.27812
🛑 Stop / invalidation: 0.56024
Bearish continuation is favored if a bounce toward 0.4662 fails and hourly closes stay beneath 0.49896/0.51815, keeping 0.3935 in play. A firm close above 0.5548 or a move to 0.56024 would invalidate.
Would you wait for a rejection near 0.4662, or prefer a clean breakdown toward 0.3935 before engaging?
Not financial advice.
#TIA #PriceActionNotes #DownsideLevels
115

·
--
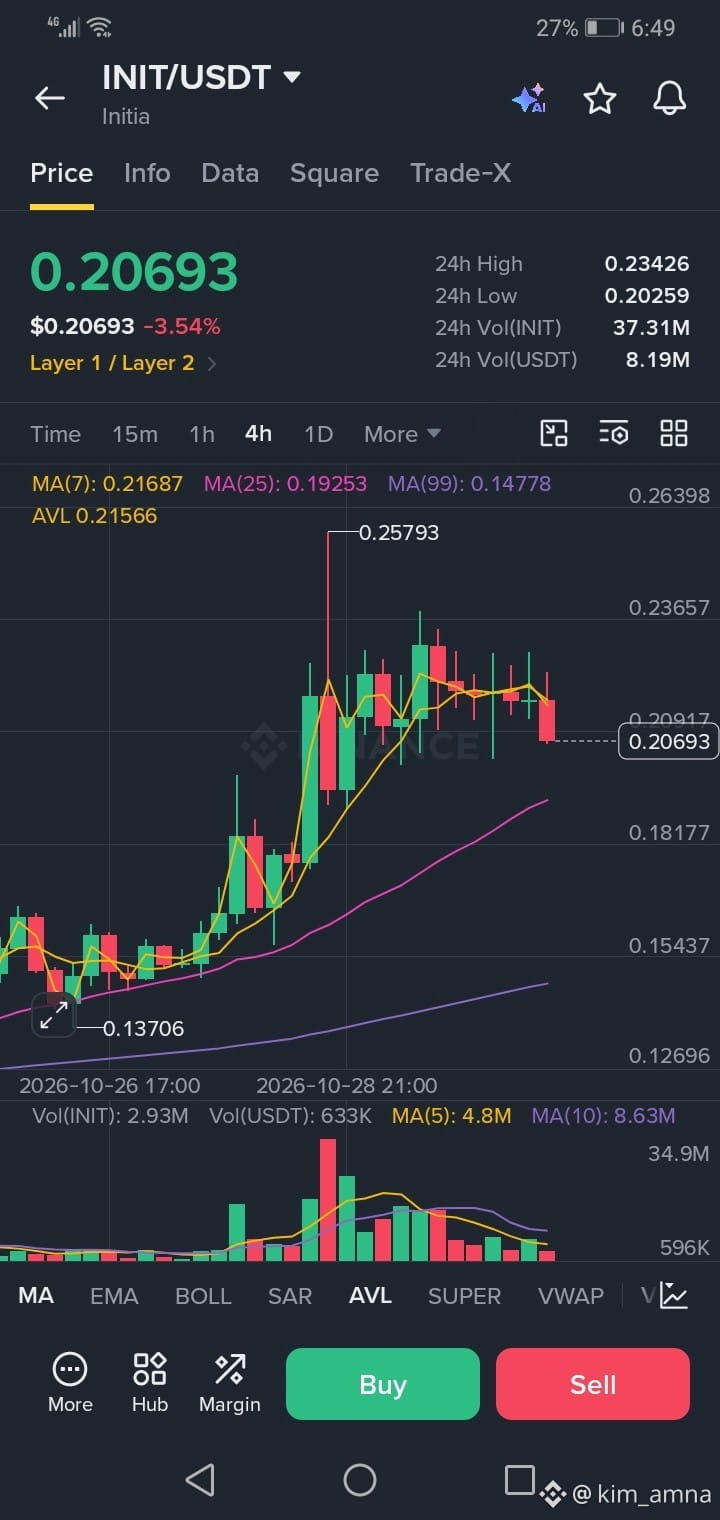
INIT & TIA — Market Analysis & Trading Strategy
October 30, 2026 | Market prices in USD
$INIT Market Price: $0.2228
Resistance: $0.2290 | $0.2542
Support: $0.2036 | $0.1824
Outlook: INIT is showing strong upward momentum, trading above its key moving averages. However, RSI is around 82.7, indicating overbought conditions and a possible short-term correction.
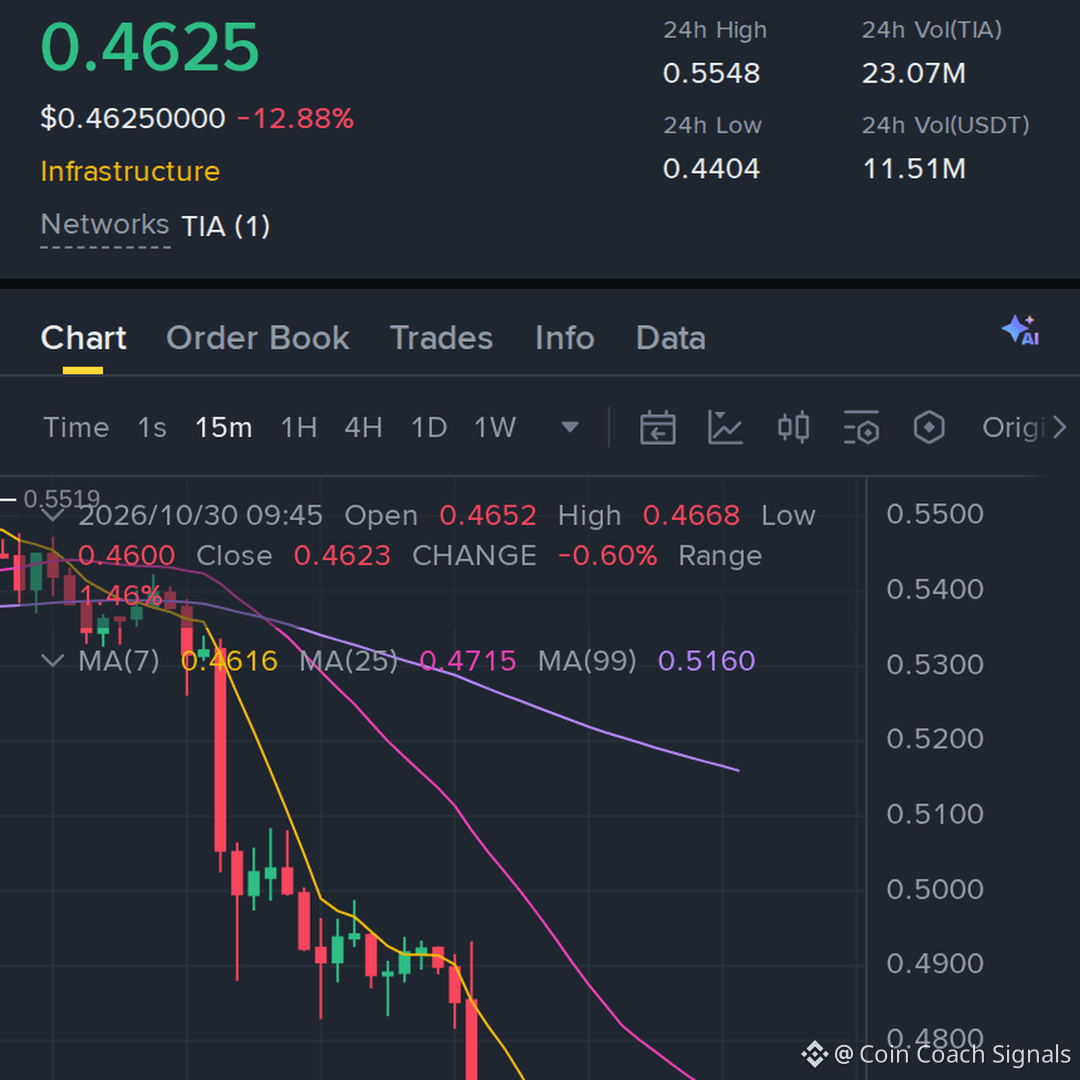
$TIA Market Price: $0.4658
Resistance: $0.5035 | $0.5327
Support: $0.4594 | $0.4052
Outlook: TIA is facing short-term selling pressure, down around 12.36% over 24 hours. Its longer-term recovery structure still has potential, but buyers need to defend support and reclaim $0.5035.
STRONGER TRADING TAKEAWAY
INIT bullish entry: Watch for a confirmed breakout above $0.2290, followed by a successful retest. Next target: $0.2542.
TIA recovery entry: Look for a bounce around $0.4594 or a confirmed breakout above $0.5035.
Bearish signal: INIT losing $0.2036 or TIA breaking below $0.4594 could trigger further downside.
Risk management: Use stop-losses and avoid chasing sudden pumps. Wait for volume confirmation.
My view: INIT currently has stronger bullish momentum, while TIA is a recovery setup that needs confirmation. Between these two, INIT has the stronger short-term chart, but its overbought RSI makes patience important.
#tia #INIT #USMidtermElections #BinanceWillListPredictPREDICT #Write2Earn!
{spot}(TIAUSDT)
{spot}(INITUSDT)
INIT & TIA — Market Analysis & Trading Strategy
October 30, 2026 | Market prices in USD
$INIT Market Price: $0.2228
Resistance: $0.2290 | $0.2542
Support: $0.2036 | $0.1824
Outlook: INIT is showing strong upward momentum, trading above its key moving averages. However, RSI is around 82.7, indicating overbought conditions and a possible short-term correction.
$TIA Market Price: $0.4658
Resistance: $0.5035 | $0.5327
Support: $0.4594 | $0.4052
Outlook: TIA is facing short-term selling pressure, down around 12.36% over 24 hours. Its longer-term recovery structure still has potential, but buyers need to defend support and reclaim $0.5035.
STRONGER TRADING TAKEAWAY
INIT bullish entry: Watch for a confirmed breakout above $0.2290, followed by a successful retest. Next target: $0.2542.
TIA recovery entry: Look for a bounce around $0.4594 or a confirmed breakout above $0.5035.
Bearish signal: INIT losing $0.2036 or TIA breaking below $0.4594 could trigger further downside.
Risk management: Use stop-losses and avoid chasing sudden pumps. Wait for volume confirmation.
My view: INIT currently has stronger bullish momentum, while TIA is a recovery setup that needs confirmation. Between these two, INIT has the stronger short-term chart, but its overbought RSI makes patience important.
#tia #INIT #USMidtermElections #BinanceWillListPredictPREDICT #Write2Earn!

📉 $TIA IS UNDER PRESSURE — IS BUYING THE DIP TOO EARLY?
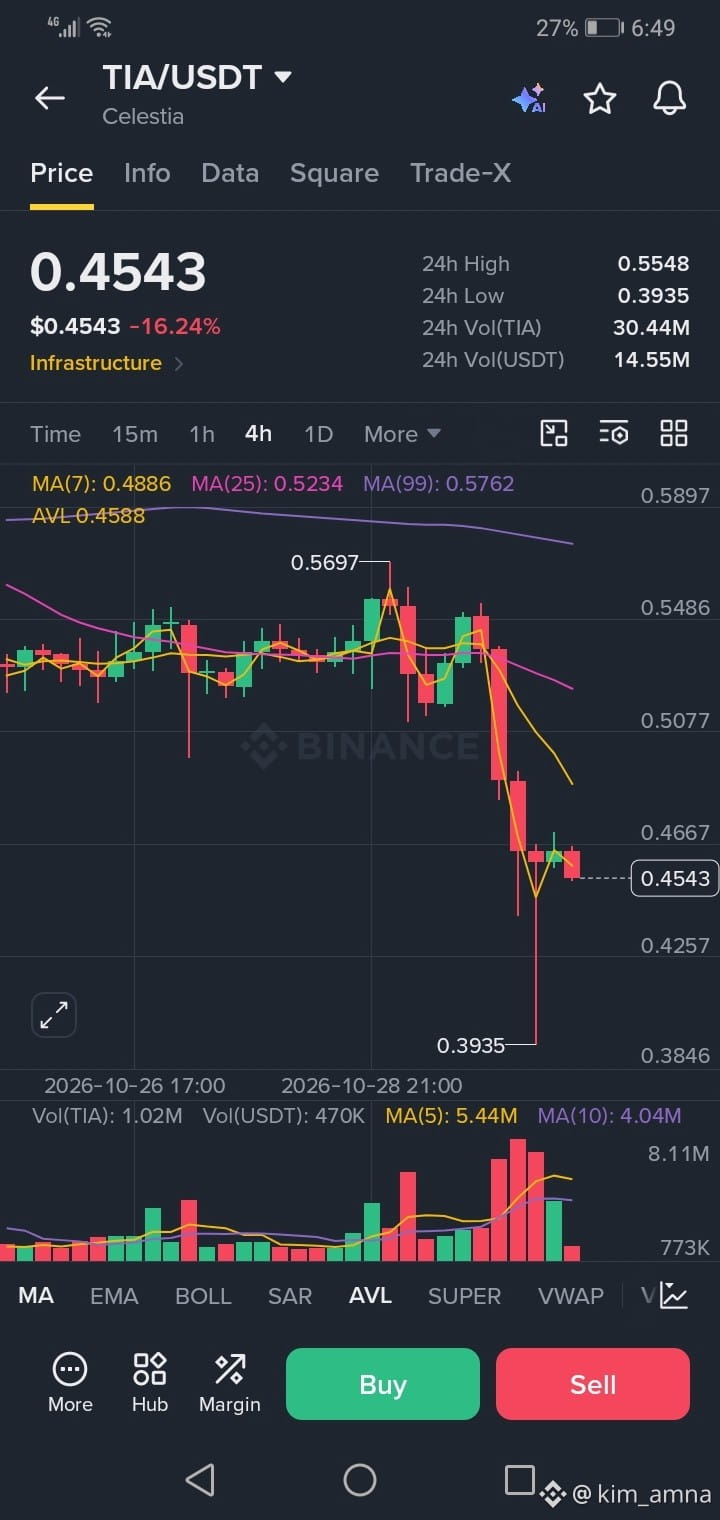
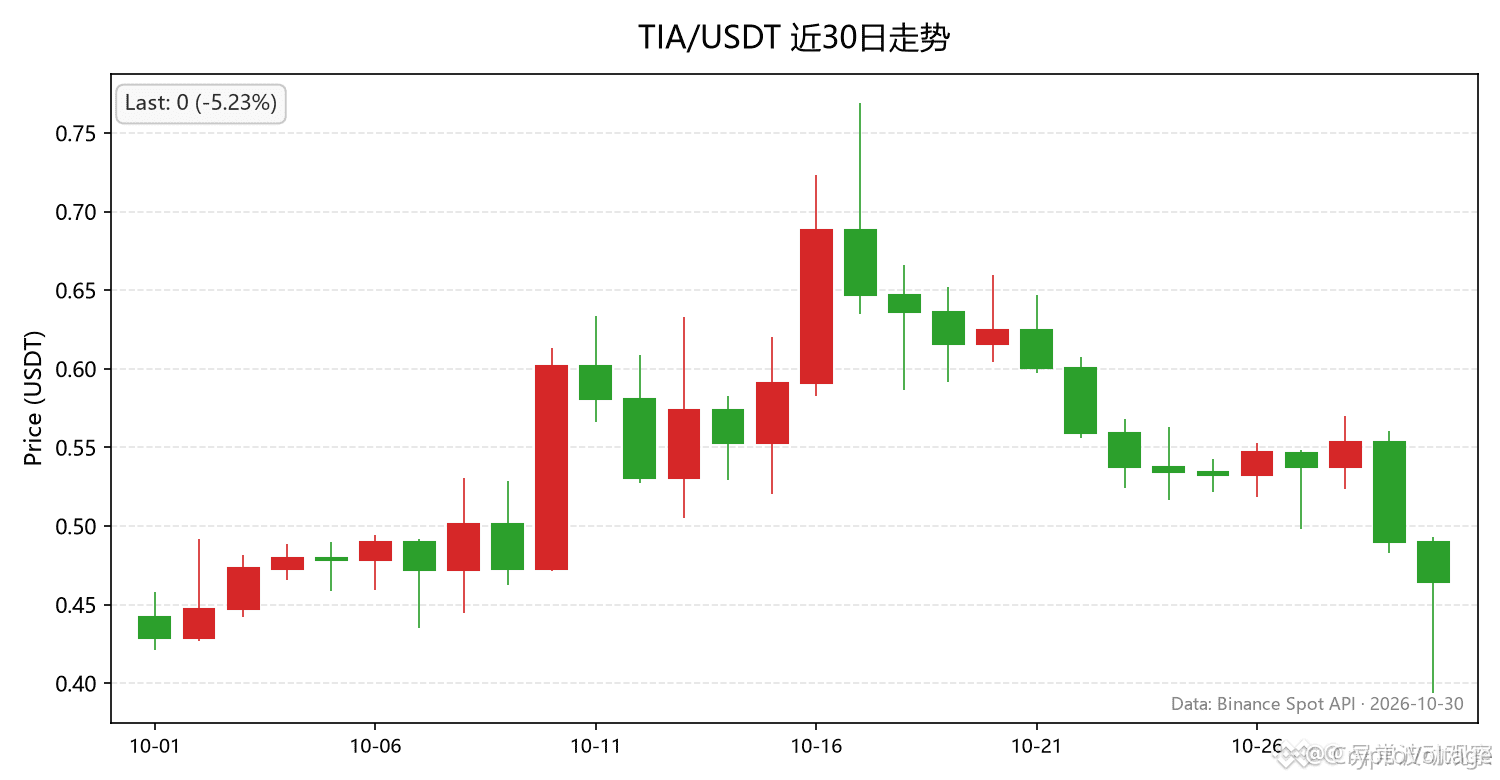
$TIA has been struggling recently, with its price falling around 11% over the last 24 hours to approximately $0.4664.
But the price decline isn't the only thing worth watching.
{future}(TIAUSDT)
📊 What the market data shows:
- Price: $0.4664
- 24H Change: -11.21%
- 24H Volume: Approximately $14M
- Trend: Below the 30-day moving average
Two things stand out:
1️⃣ Price trading below its 30-day moving average suggests the medium-term trend is weakening.
2️⃣ Elevated trading volume alongside falling prices indicates increased selling activity.
A bounce during a downtrend doesn't automatically mean the bottom is in. Sometimes these recoveries are short-lived.
My approach: Wait for selling pressure to cool down, price to stabilize, and buyers to demonstrate some strength before considering a long position.
🔥 Would you buy $TIA at these levels, or wait for further confirmation?
#TIA #celestia #CryptoTrading #USMidtermElections #Altcoins #BinanceSquare
📉 $TIA IS UNDER PRESSURE — IS BUYING THE DIP TOO EARLY?
$TIA has been struggling recently, with its price falling around 11% over the last 24 hours to approximately $0.4664.
But the price decline isn't the only thing worth watching.
📊 What the market data shows:
- Price: $0.4664
- 24H Change: -11.21%
- 24H Volume: Approximately $14M
- Trend: Below the 30-day moving average
Two things stand out:
1️⃣ Price trading below its 30-day moving average suggests the medium-term trend is weakening.
2️⃣ Elevated trading volume alongside falling prices indicates increased selling activity.
A bounce during a downtrend doesn't automatically mean the bottom is in. Sometimes these recoveries are short-lived.
My approach: Wait for selling pressure to cool down, price to stabilize, and buyers to demonstrate some strength before considering a long position.
🔥 Would you buy $TIA at these levels, or wait for further confirmation?
#TIA #celestia #CryptoTrading #USMidtermElections #Altcoins #BinanceSquare
136

·
--
$TIA
🔻 $TIA SHORT SETUP 🔴 Sellers are stepping in — here's the setup. ⚡
$TIA is experiencing strong bearish momentum, dropping -11.34% as selling pressure intensifies following a rejection from higher levels. The significant trading volume suggests that the downward move is well-supported by market participants as the price heads toward its recent lows.
📊 24h: -11.34% | Vol: $13,626,989.26
📉 TRADE PLAN
🔹 Entry: 0.4622
🛑 Stop Loss: 0.4850
🎯 TP1: 0.4280
🎯 TP2: 0.4100
🎯 TP3: 0.3950
⚖️ Risk:Reward (TP1): 1:1.50
🔔 Trigger: Sustained price action below 0.4700 alongside a spike in sell-side volume.
⚠️ Risk Note: High volatility in the current market can lead to sharp retracements; manage your position carefully.
Ensure all technical signals align with your personal strategy before executing any trades.
Click below 👇🏻 to trade
$TIA
Follow @TZX_Crypto for more updates...
#TIA #CryptoTrading #MarketAnalysis #BinanceSquare
$TIA
🔻 $TIA SHORT SETUP 🔴 Sellers are stepping in — here's the setup. ⚡
$TIA is experiencing strong bearish momentum, dropping -11.34% as selling pressure intensifies following a rejection from higher levels. The significant trading volume suggests that the downward move is well-supported by market participants as the price heads toward its recent lows.
📊 24h: -11.34% | Vol: $13,626,989.26
📉 TRADE PLAN
🔹 Entry: 0.4622
🛑 Stop Loss: 0.4850
🎯 TP1: 0.4280
🎯 TP2: 0.4100
🎯 TP3: 0.3950
⚖️ Risk:Reward (TP1): 1:1.50
🔔 Trigger: Sustained price action below 0.4700 alongside a spike in sell-side volume.
⚠️ Risk Note: High volatility in the current market can lead to sharp retracements; manage your position carefully.
Ensure all technical signals align with your personal strategy before executing any trades.
Click below 👇🏻 to trade
$TIA
Follow @TZX_Crypto for more updates...
#TIA #CryptoTrading #MarketAnalysis #BinanceSquare
34

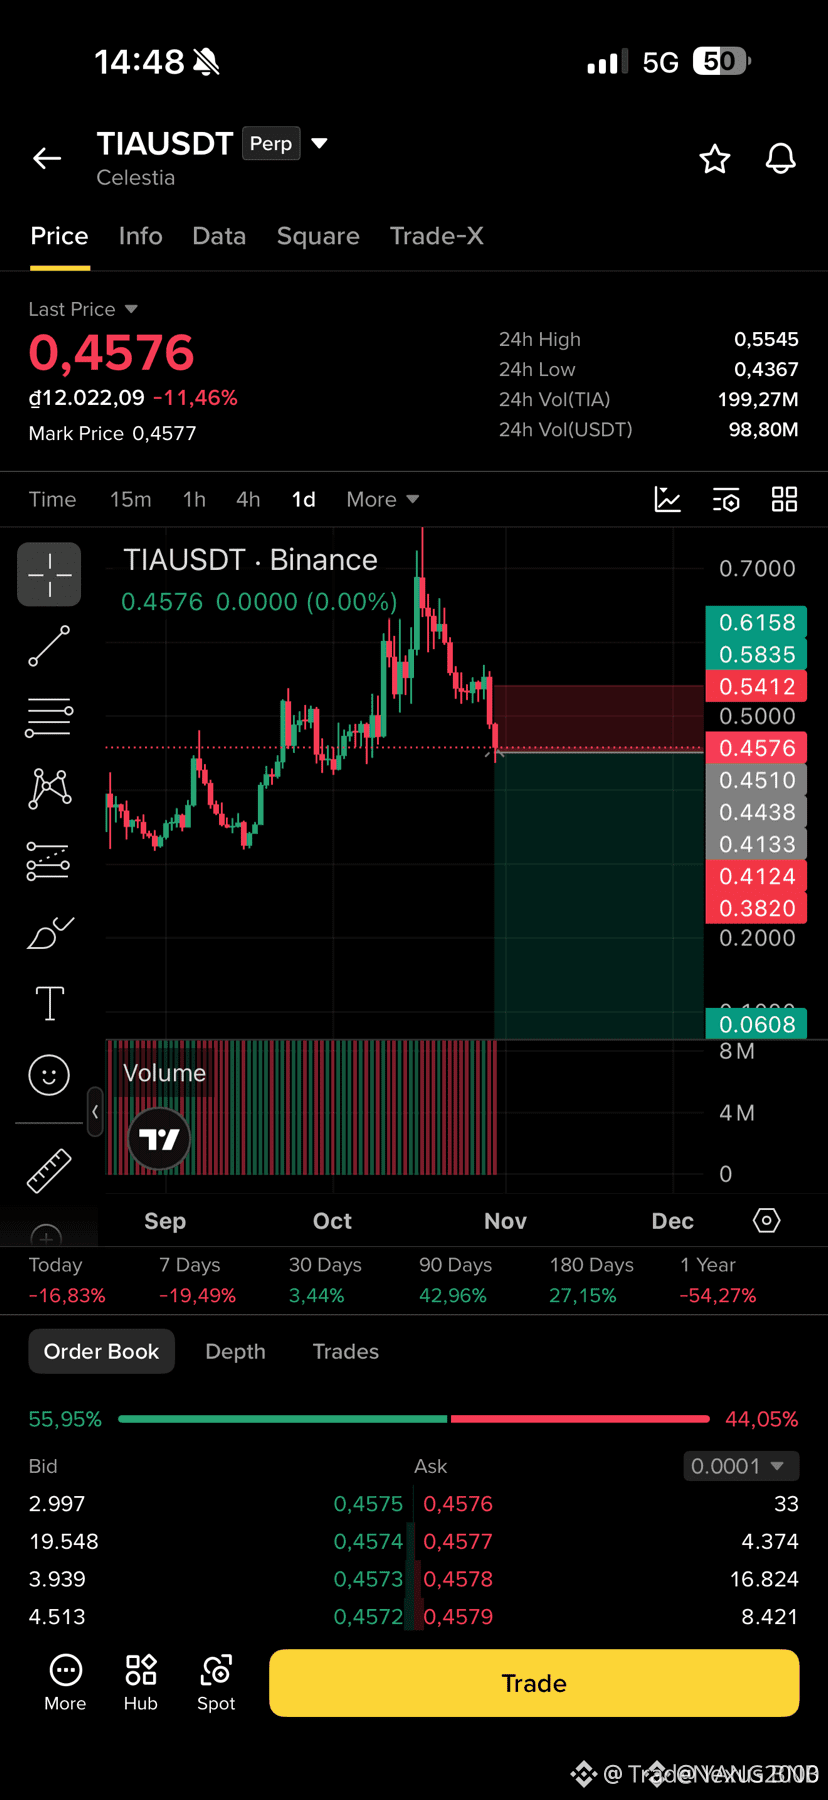
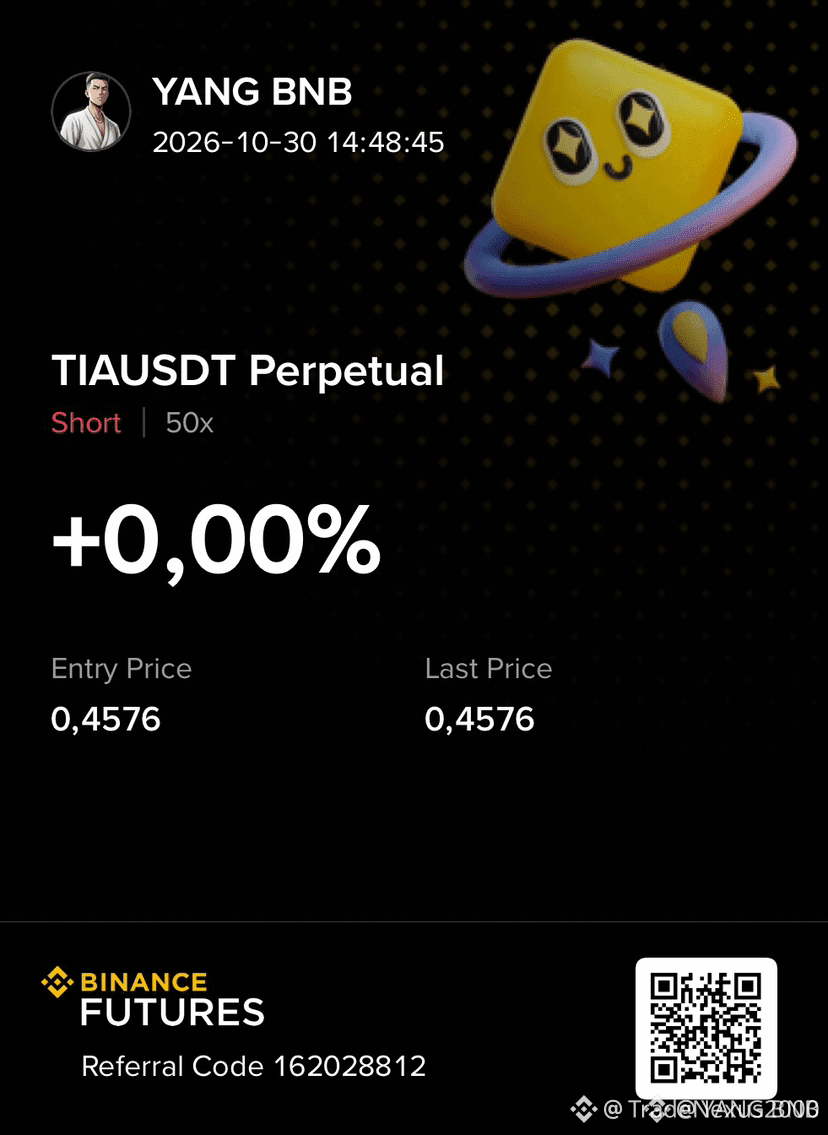
🔻 $TIA REJECTION AT PREMIUM SUPPLY UNLOCKS DEEP LIQUIDITY TARGETS! 📉
Entry: 0.4550 – 0.4650 ⚡
Target: 0.4133, 0.3820, 0.3000 🎯
Stop Loss: 0.5412 🛑
📌 Institutional sellers defended key resistance, precipitating an 11% distribution phase over the past 24 hours. 🌊 Price failed to sustain higher structure, confirming that smart money is actively seeking sell-side liquidity below.
🔍 With bearish order flow dominating the tape, momentum favors a continuation toward open fair value gaps. 💡 This shift in market structure provides a high-probability framework to capitalize on the ongoing correction.
💬 Will $TIA sweep straight through the lower targets, or should we anticipate a short-covering bounce first? 👇
⚠️ Not financial advice. Always manage your risk. 🛡️
🏷️ #TIA #ShortSetup #PriceAction #Crypto #MarketStructure
🎯 🦈
13
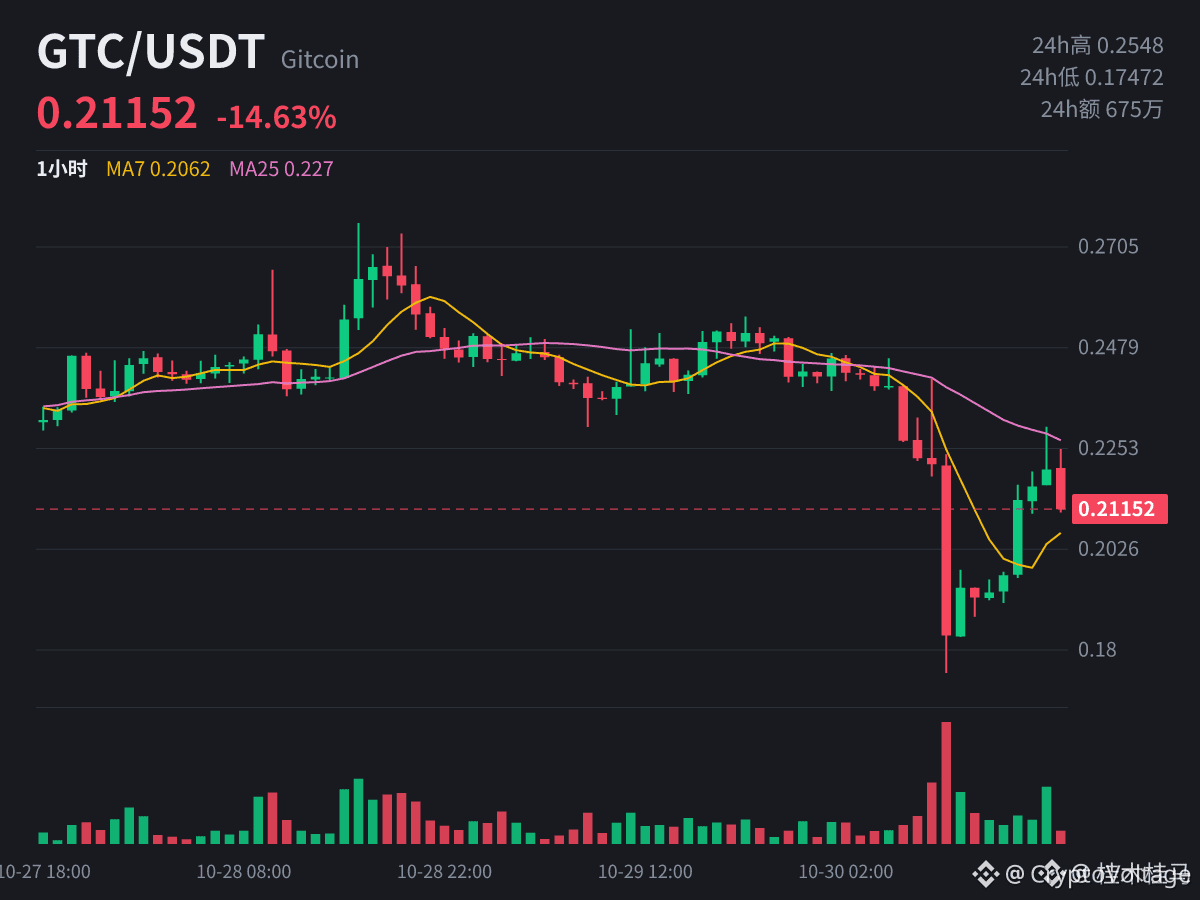
👀 I FOLLOWED THE CROWD AND OPENED A SHORT... AND NOW I'M THINKING TWICE!
$TIA has been showing weakness, and I decided to join the bearish side with a short position.
Meanwhile, $GTC funding turned more than 1‰ negative.
{spot}(TIAUSDT)
{spot}(GTCUSDT)
But here's something worth thinking about:
When too many traders position themselves in the same direction, the market can become unpredictable.
Crowded short positions can create conditions for sudden short squeezes if buyers step in.
📉 Bearish momentum may still continue, but blindly following the crowd is never a solid trading strategy.
Sometimes the biggest risk isn't being wrong about the direction. It's entering when everyone has already made the same decision.
What's your view?
Are you still bearish on Tia and $GTC, or could a short squeeze surprise everyone?
#tia #GTC #cryptotrading #MarketSentiment #BinanceSquare
👀 I FOLLOWED THE CROWD AND OPENED A SHORT... AND NOW I'M THINKING TWICE!
$TIA has been showing weakness, and I decided to join the bearish side with a short position.
Meanwhile, $GTC funding turned more than 1‰ negative.
But here's something worth thinking about:
When too many traders position themselves in the same direction, the market can become unpredictable.
Crowded short positions can create conditions for sudden short squeezes if buyers step in.
📉 Bearish momentum may still continue, but blindly following the crowd is never a solid trading strategy.
Sometimes the biggest risk isn't being wrong about the direction. It's entering when everyone has already made the same decision.
What's your view?
Are you still bearish on Tia and $GTC , or could a short squeeze surprise everyone?
#tia #GTC #cryptotrading #MarketSentiment #BinanceSquare
441

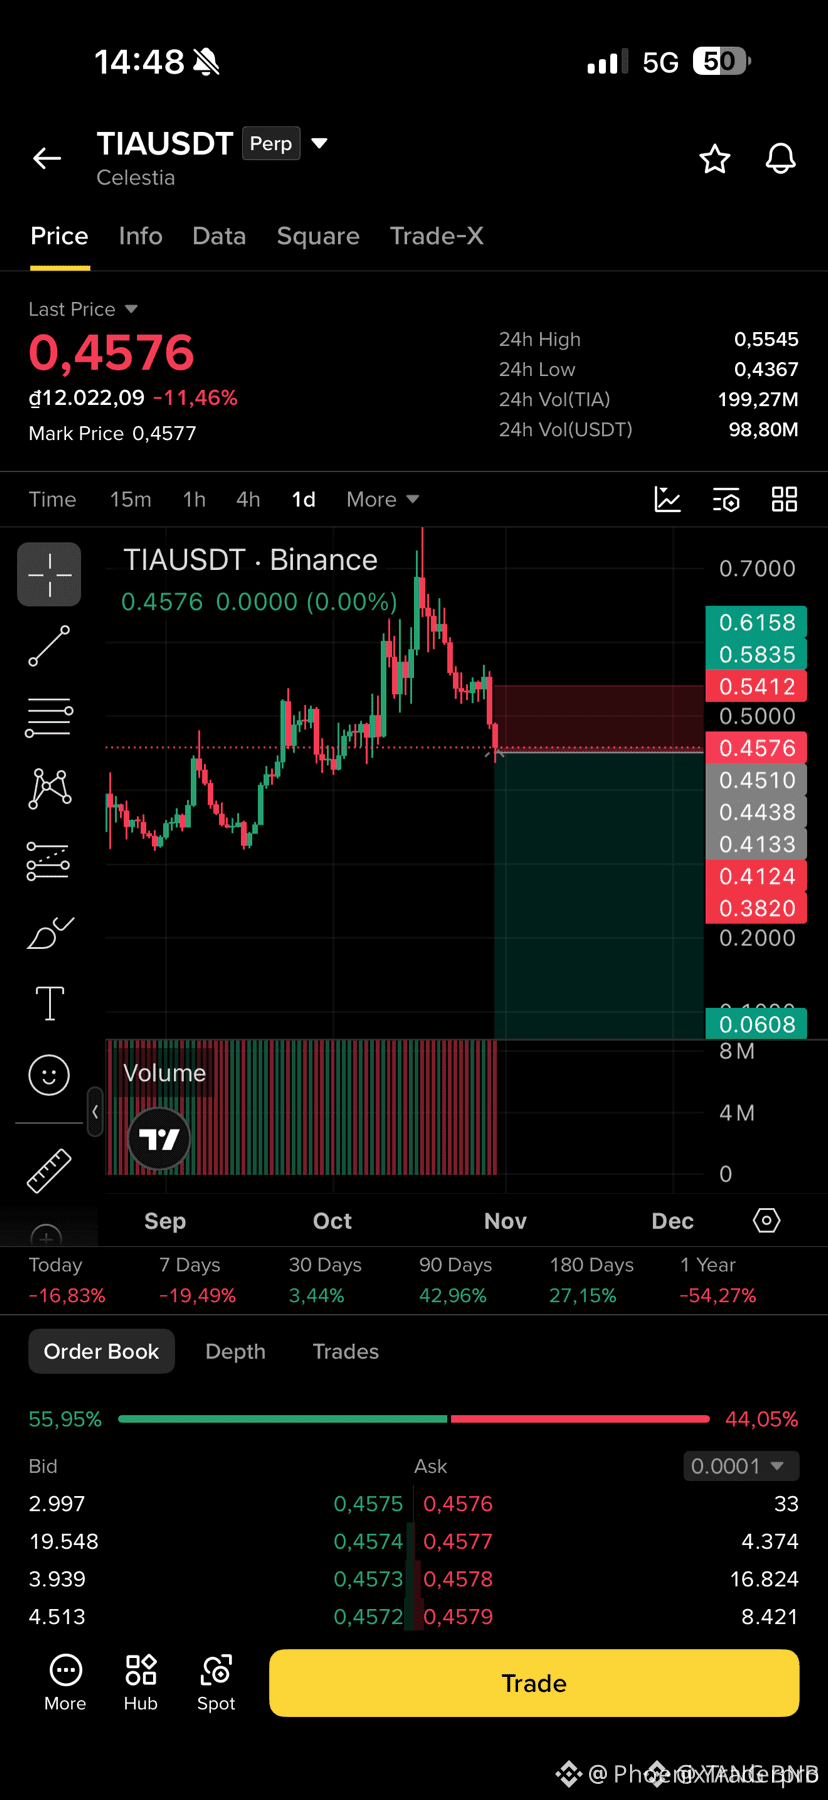
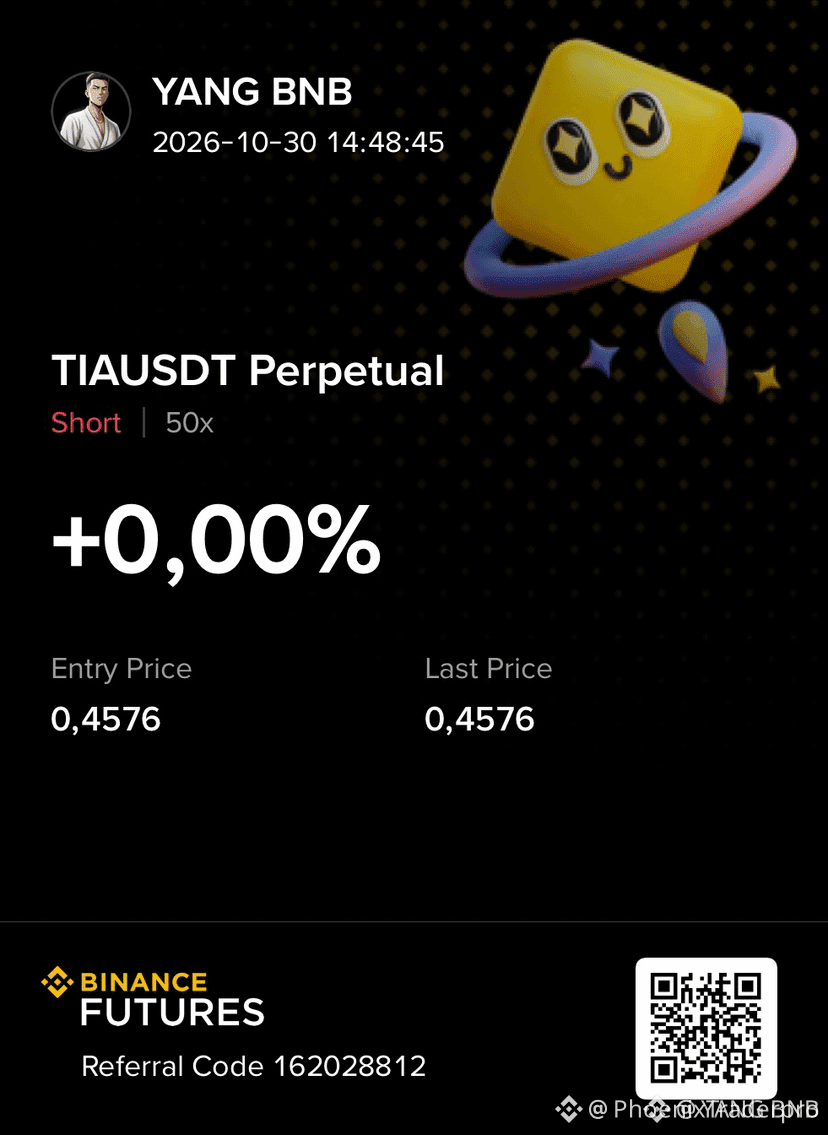
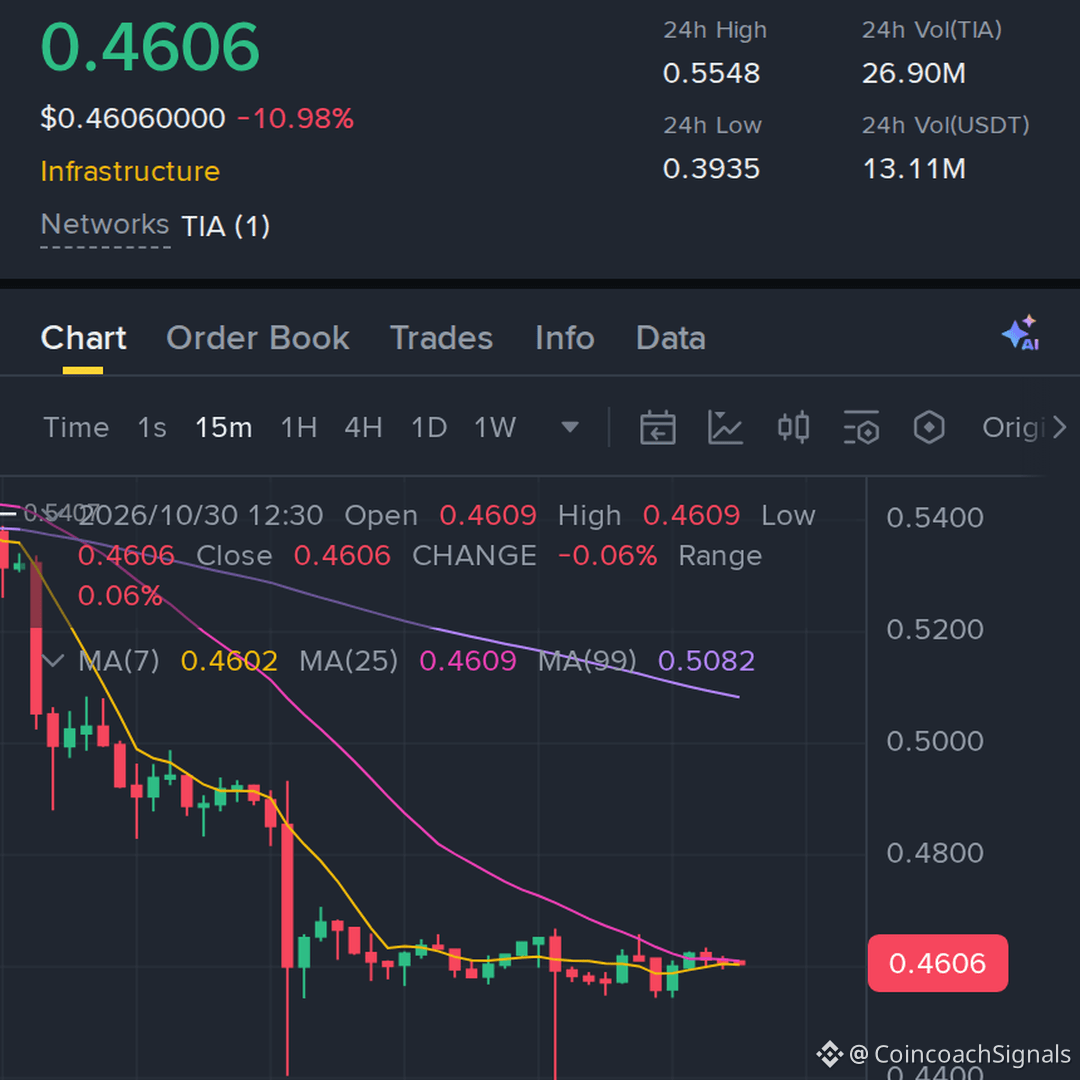
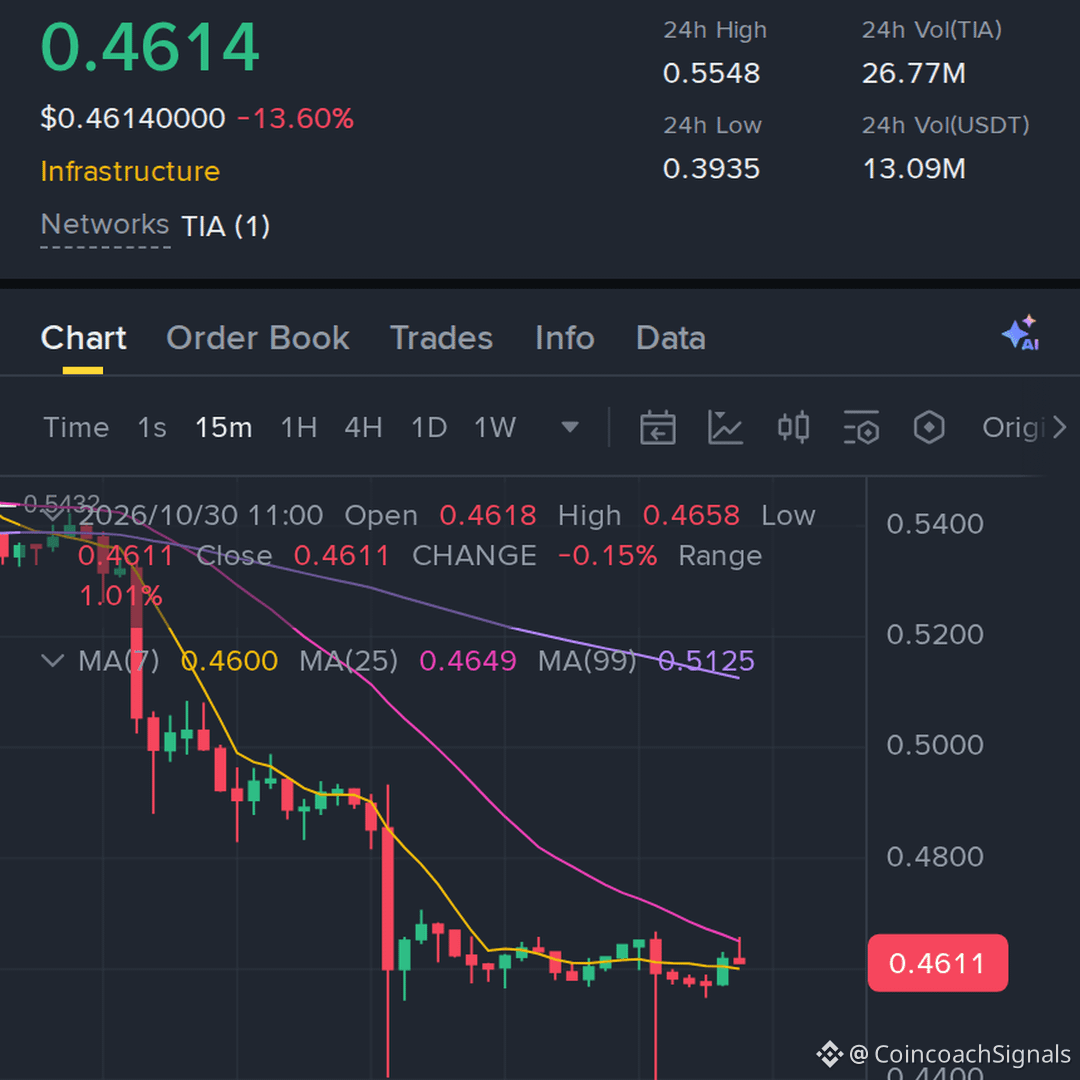
🚨 $TIA BEARS TAKE FULL CONTROL AS HEAVY REJECTION OPENS THE TRAPDOOR! 📉
Entry: 0.4550 - 0.4650 ⚡
Target: 0.4133 - 0.3000 🎯
Stop Loss: 0.5412 🛑
Sellers stepped in with sheer authority at the highs, rejecting the recent impulse and slamming $TIA down over 11% in a single session. 📊 The structural breakdown confirms that aggressive distribution is underway as bids get wiped clean.
🔍 With momentum flipping sharply negative, the path of least resistance tilts toward a deeper flush into untapped liquidity below. 💡 The risk profile favors the bears as long as price respects this supply block on retests.
🤔 Are you leaning into this short breakdown, or do you expect buyers to stage a relief bounce first? 👇
⚠️ Not financial advice. Always manage your risk. 🛡️
🏷️ #TIA #ShortSetup #Bearish #Altcoins #Trading
📉 🎯
23




·
--
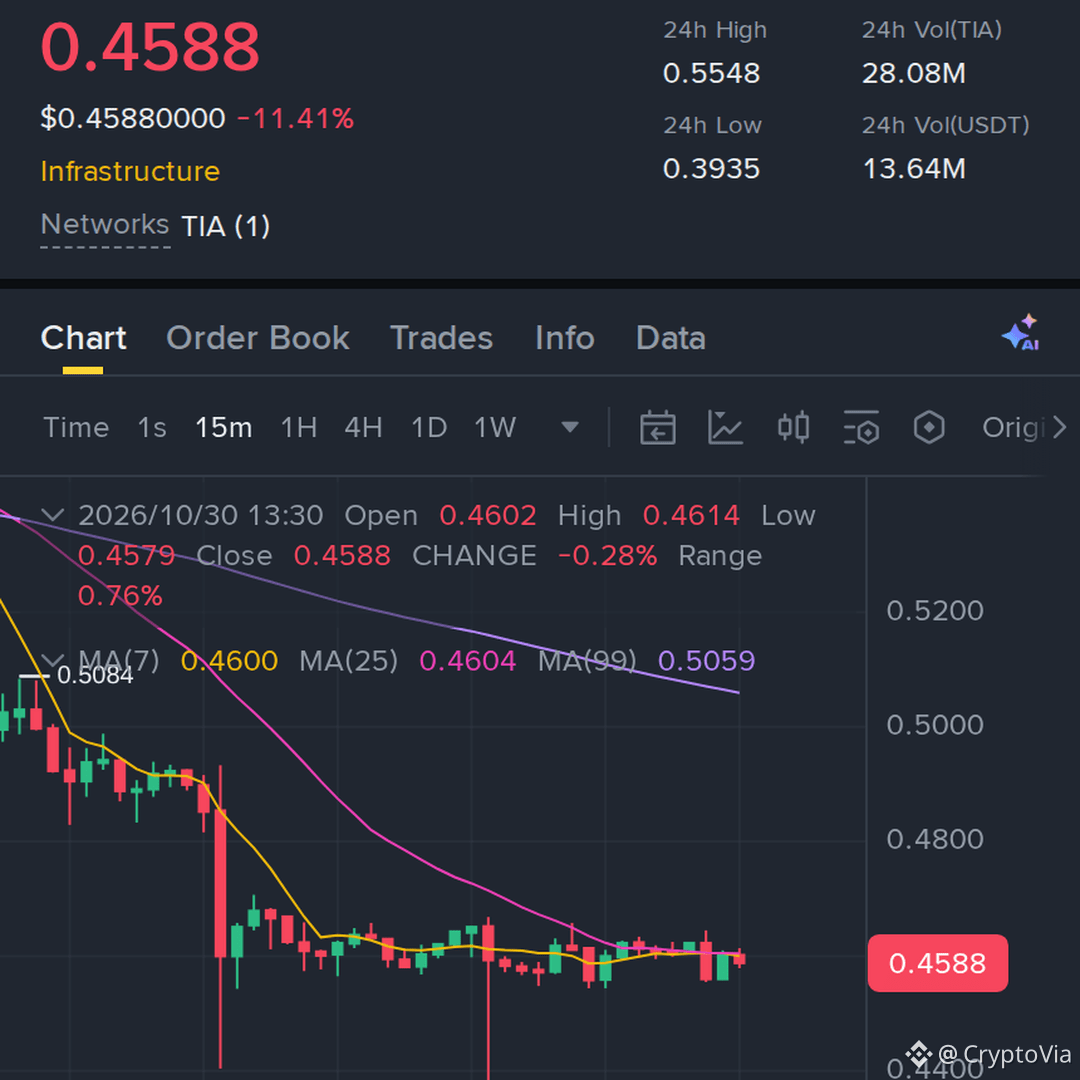
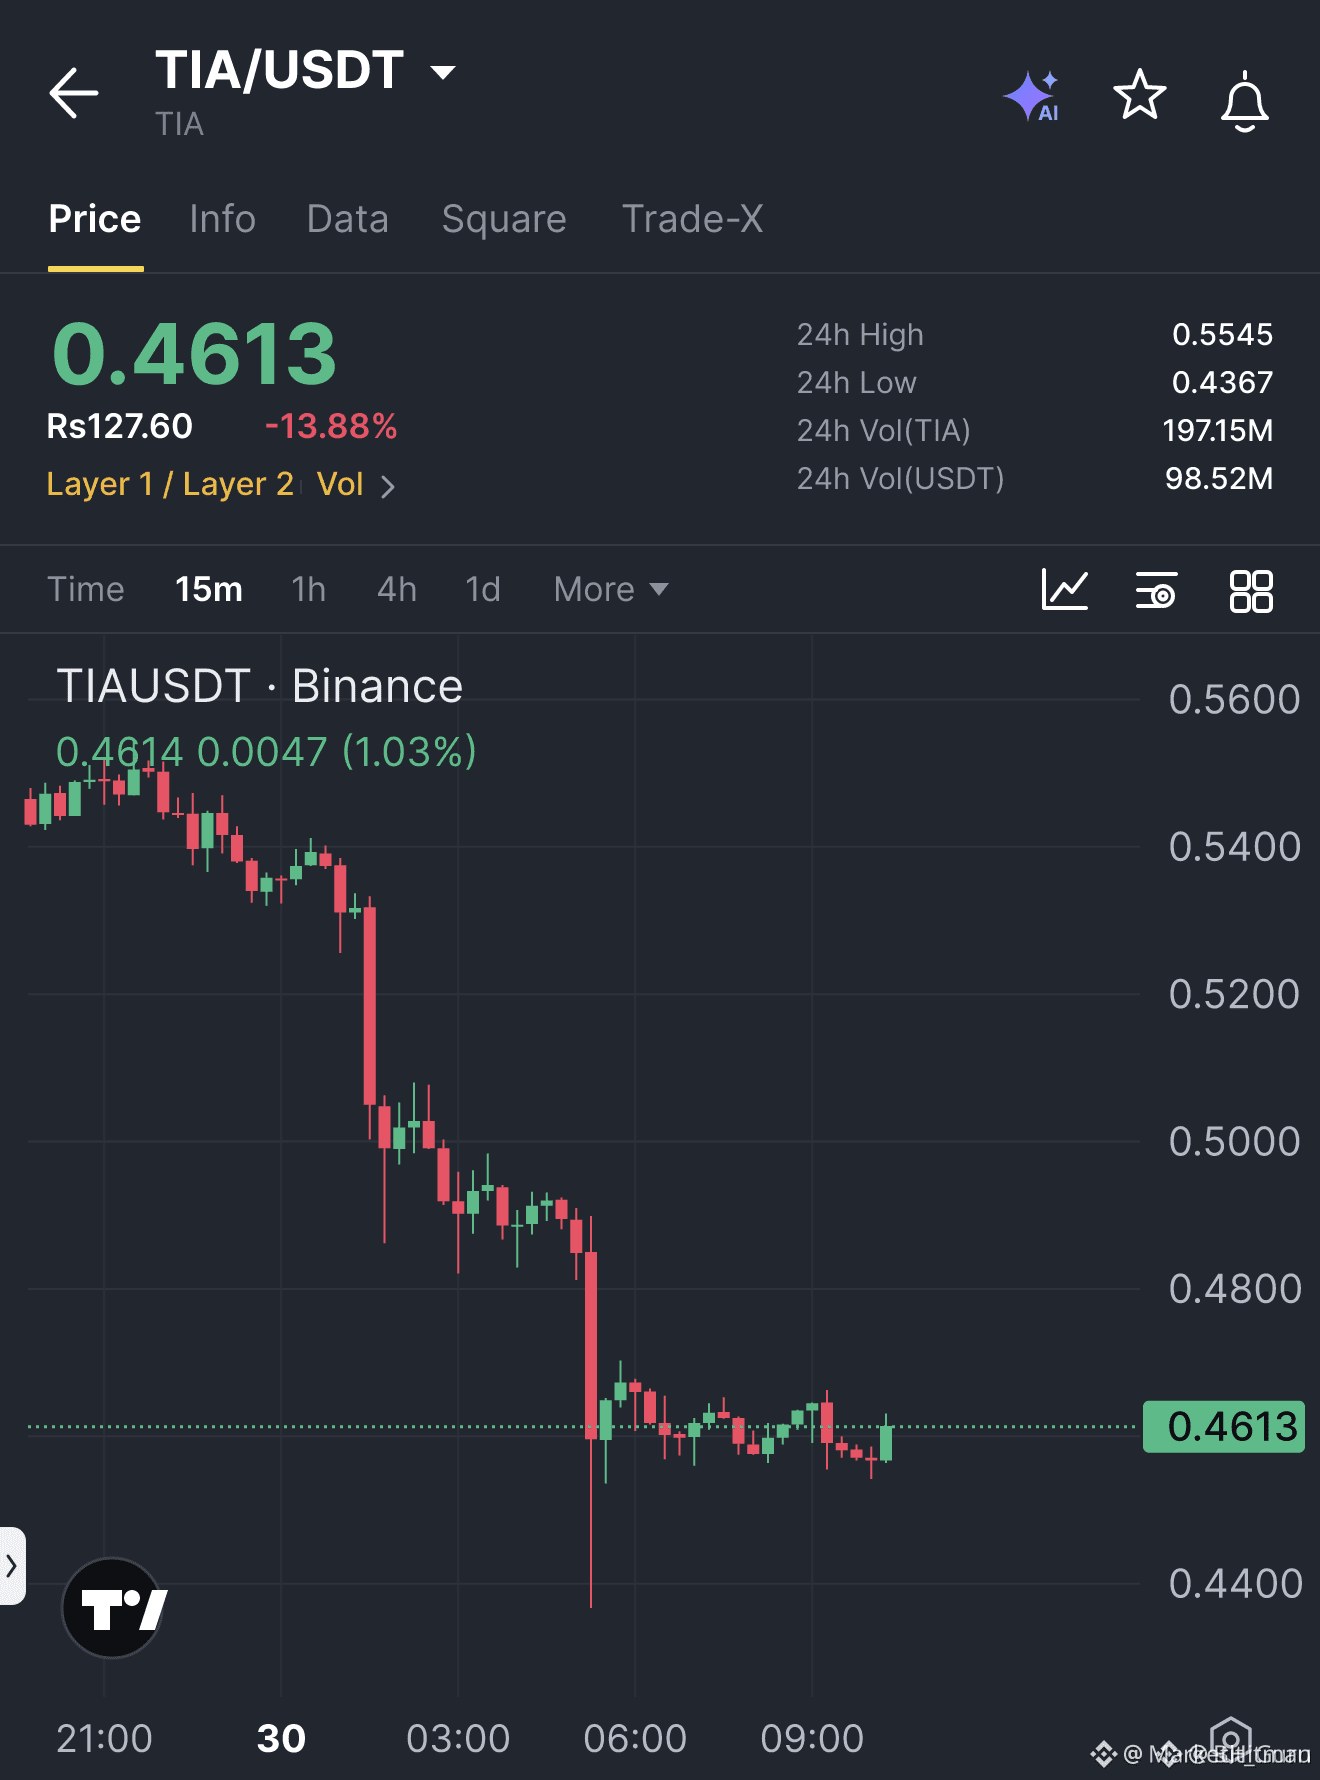
⚡ $TIA BUYERS STEP IN WITH AN AGGRESSIVE MOMENTUM FLIP OFF THE LOWS! 💥
Entry: 0.4615 ⚡
Target: 0.4732 / 0.481 / 0.4927 🎯
Stop Loss: 0.4537 ⚠️
📌 After absorbing heavy selling throughout the recent downtrend, the bid finally stepped up with authority as price took out the previous candle's high. 📊 That shift in market structure hands control right back to buyers, flipping local order flow firmly into expansion mode.
💡 The invalidation is razor-sharp below 0.4537, giving this recovery play high conviction with clear multi-tiered take-profit levels mapped out. 💬 Are you taking the long bid here or waiting for the first target to lock in gains? 👇
⚠️ Not financial advice. Always manage your risk. 🛡️
🏷️ #TIA #LongSetup #Breakout #Crypto
🎯 ⚡
15


$TIA: TIA Volume Spike: How Much Does the Close Matter?
The clue and its limits
The chart shows an hourly direction up while volume sits above baseline. That combination often feels like a green light, suggesting buying pressure is supporting the move. One useful metric is 2.31794, which quantifies how current trading compares to the recent average. If the relative volume is significantly high, it may confirm that the up move is driven by broader participation rather than a few large trades.
Competing readings of the same move
A different interpretation is that the volume surge reflects a short‑covering squeeze. Traders who were previously betting against the asset might be forced to buy back, inflating volume without indicating sustainable demand. In that scenario, the price could stall once the squeeze eases. Another view sees the volume as a temporary reaction to news on $TIA that may fade, leaving the price to revert to its prior range.
What would change the interpretation
A weakening clue would be a rapid drop in 2.31794 back to baseline while the price remains up; that would suggest the momentum is losing steam. Conversely, if the price closes above the hourly high and volume stays elevated, the uptrend gains credibility. Monitoring the close relative to the high and watching the volume trend provides a concrete way to reassess the signal. 📊
Probabilistic market research, not a recommendation or guaranteed return.
Which observation would make you change your reading?
#TIA #MarketAnalysis
$TIA : TIA Volume Spike: How Much Does the Close Matter?
The clue and its limits
The chart shows an hourly direction up while volume sits above baseline. That combination often feels like a green light, suggesting buying pressure is supporting the move. One useful metric is 2.31794, which quantifies how current trading compares to the recent average. If the relative volume is significantly high, it may confirm that the up move is driven by broader participation rather than a few large trades.
Competing readings of the same move
A different interpretation is that the volume surge reflects a short‑covering squeeze. Traders who were previously betting against the asset might be forced to buy back, inflating volume without indicating sustainable demand. In that scenario, the price could stall once the squeeze eases. Another view sees the volume as a temporary reaction to news on $TIA that may fade, leaving the price to revert to its prior range.
What would change the interpretation
A weakening clue would be a rapid drop in 2.31794 back to baseline while the price remains up; that would suggest the momentum is losing steam. Conversely, if the price closes above the hourly high and volume stays elevated, the uptrend gains credibility. Monitoring the close relative to the high and watching the volume trend provides a concrete way to reassess the signal. 📊
Probabilistic market research, not a recommendation or guaranteed return.
Which observation would make you change your reading?
#TIA #MarketAnalysis
363

·
--
TIA: THE NARRATIVE ISN'T ENOUGH TO STOP A WEAKENING STRUCTURE.
THE MARKET READ
0.4649 | 24H -12.33%
4H STRUCTURE: BEARISH
1H CONFIRMATION: BEARISH
RELATIVE VOLUME: 3.62x
THE NARRATIVE
Celestia: Celestia is a data availability network that allows developers to easily create a new blockchain.
MY VIEW — BEARISH
Bearish. The key issue is not one red candle, but whether lower highs and weakening participation continue to reinforce the 4H structure.
WHAT WOULD CONFIRM IT
1H confirms the bearish 4H structure; momentum and timeframe alignment support this read.
This is narrative analysis, not a trade signal. Verify current market data and project claims before acting.
#TIA #Crypto #MarketStructure
37
Log in to explore more content
Join global crypto users on Binance Square
⚡️ Get latest and useful information about crypto.
💬 Trusted by the world’s largest crypto exchange.
👍 Discover real insights from verified creators.
Email / Phone number
Trending Topics
1
#$1.5BInLeveragedCryptoBetsLiquidated
8,508 views
130 Discussing
2
#KOSPIFalls3.53%BackBelow6000
24,175 views
575 Discussing
3
#AmazonSharesFallAbout7%InPremarketTrading
6,281 views
204 Discussing
4
#USMidtermElections
156,633 views
1,829 Discussing
5
#StrategySTRCReaches$99.95ForFirstTimeIn165Days
3,608 views
81 Discussing
6
#BinanceWillListPredictPREDICT
48,425 views
950 Discussing
7
#SwitzerlandFirstSpotBitcoinETFExpectedToTradeInNovember
1,752 views
86 Discussing
8
#StrategyReports$21BQ3OperatingProfit
1,850 views
44 Discussing
9
#TwoAddressesHoldingAbout1.28BUSDTFrozen
30,081 views
581 Discussing
10
#FirstDigitalBlacklistsAttackerAddressHoldingAbout3.4MFDUSD
894 views
19 Discussing