
#tia
tia
115.1M views
234,912 Discussing
Hot
Latest

·
--
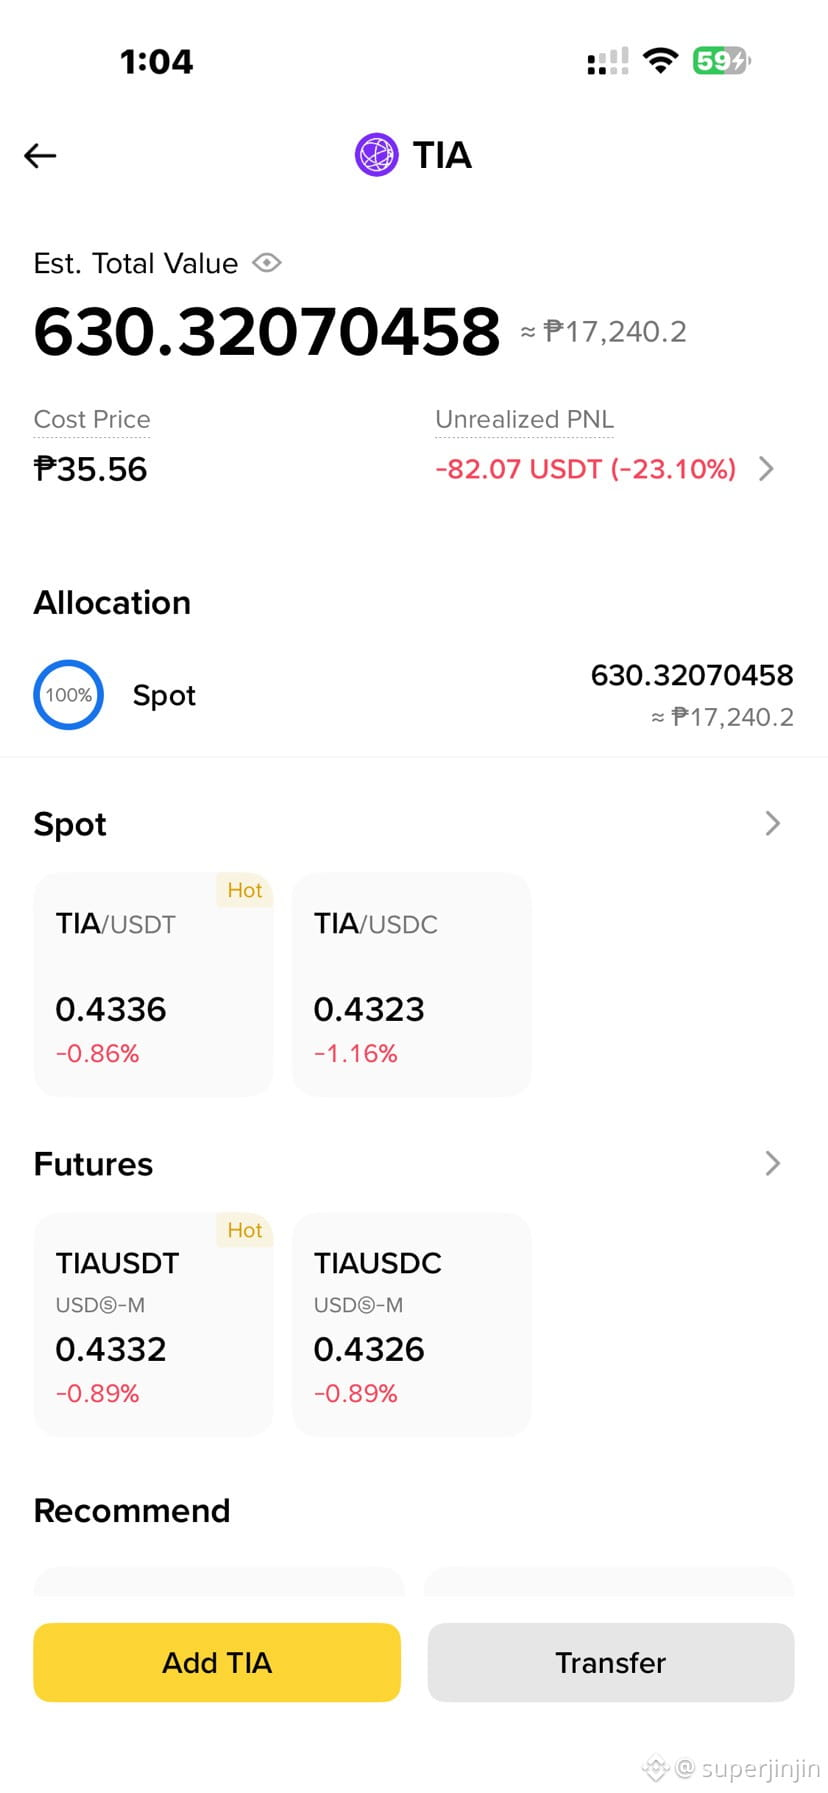
$TIA (Celestia), what a disappointment! 😤📉
Down 23.10%, with $82 in unrealized losses. Every time I expect a recovery, #TIA keeps testing my patience. 😩
I’m not asking for the moon anymore. Can we at least see some GREEN? 🟢😭
TIA holders, are we still holding or just collecting disappointments? 💔
$TIA (Celestia), what a disappointment! 😤📉
Down 23.10%, with $82 in unrealized losses. Every time I expect a recovery, #TIA keeps testing my patience. 😩
I’m not asking for the moon anymore. Can we at least see some GREEN? 🟢😭
TIA holders, are we still holding or just collecting disappointments? 💔
Down 23.10%, with $82 in unrealized losses. Every time I expect a recovery, #TIA keeps testing my patience. 😩
I’m not asking for the moon anymore. Can we at least see some GREEN? 🟢😭
TIA holders, are we still holding or just collecting disappointments? 💔
SLCrypto_HUB:
down ✅ 0.31$ -0.33 then buy for rallying... check the spot 🗾 Candle 🕯️ selling is not finish.
7
11
19.4k

·
--
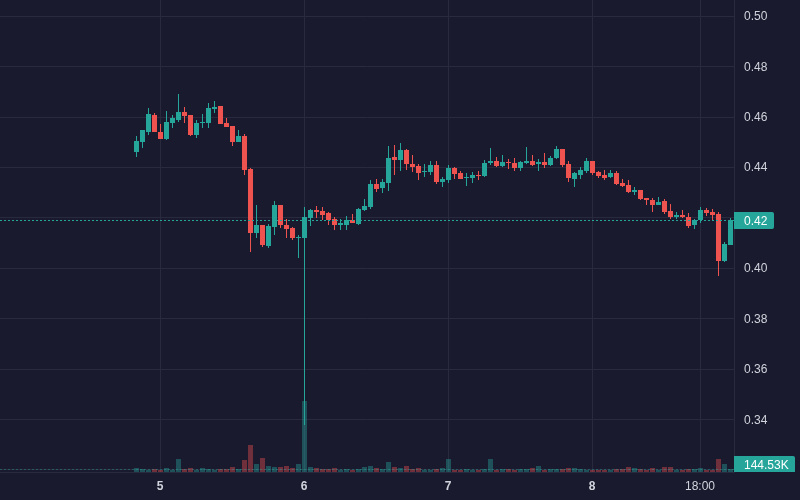
$TIA TIA is showing bearish movement: -5.18% (Crypto).
Volume: 2.18M | Last: $0.419000
Key signals: strong momentum, high volatility.
Bias Daily: BULLISH 🟢 | Weekly: BULLISH 🟢
TIA fell 7.5% in 24h to $0.409 amid Keplr security alerts and heavy spot net outflows.
**Security alert fallout (High)**: Keplr Wallet warnings over Web3Auth key vulnerabilities prompted user asset migrations → heightened precautionary selling across ecosystem assets
- **Sustained capital outflows (High)**: Consistent negative net inflow and large-tier outflows across trading sessions → aggressive spot distribution
- **Technical breakdown (Medium)**: Price sliced below EMA 25 ($0.424) and Bollinger lower band ($0.407) on a 1.24M USDT volume spike → bearish trend acceleration
#TIA #JobsReportRaisesHikeOdds #BinanceSquare #CPITestsDecemberRateOutlook #Crypto
$TIA TIA is showing bearish movement: -5.18% (Crypto).
Volume: 2.18M | Last: $0.419000
Key signals: strong momentum, high volatility.
Bias Daily: BULLISH 🟢 | Weekly: BULLISH 🟢
TIA fell 7.5% in 24h to $0.409 amid Keplr security alerts and heavy spot net outflows.
**Security alert fallout (High)**: Keplr Wallet warnings over Web3Auth key vulnerabilities prompted user asset migrations → heightened precautionary selling across ecosystem assets
- **Sustained capital outflows (High)**: Consistent negative net inflow and large-tier outflows across trading sessions → aggressive spot distribution
- **Technical breakdown (Medium)**: Price sliced below EMA 25 ($0.424) and Bollinger lower band ($0.407) on a 1.24M USDT volume spike → bearish trend acceleration
#TIA #JobsReportRaisesHikeOdds #BinanceSquare #CPITestsDecemberRateOutlook #Crypto
Volume: 2.18M | Last: $0.419000
Key signals: strong momentum, high volatility.
Bias Daily: BULLISH 🟢 | Weekly: BULLISH 🟢
TIA fell 7.5% in 24h to $0.409 amid Keplr security alerts and heavy spot net outflows.
**Security alert fallout (High)**: Keplr Wallet warnings over Web3Auth key vulnerabilities prompted user asset migrations → heightened precautionary selling across ecosystem assets
- **Sustained capital outflows (High)**: Consistent negative net inflow and large-tier outflows across trading sessions → aggressive spot distribution
- **Technical breakdown (Medium)**: Price sliced below EMA 25 ($0.424) and Bollinger lower band ($0.407) on a 1.24M USDT volume spike → bearish trend acceleration
#TIA #JobsReportRaisesHikeOdds #BinanceSquare #CPITestsDecemberRateOutlook #Crypto
12


$TIA: Checking if Direction Matches Effort
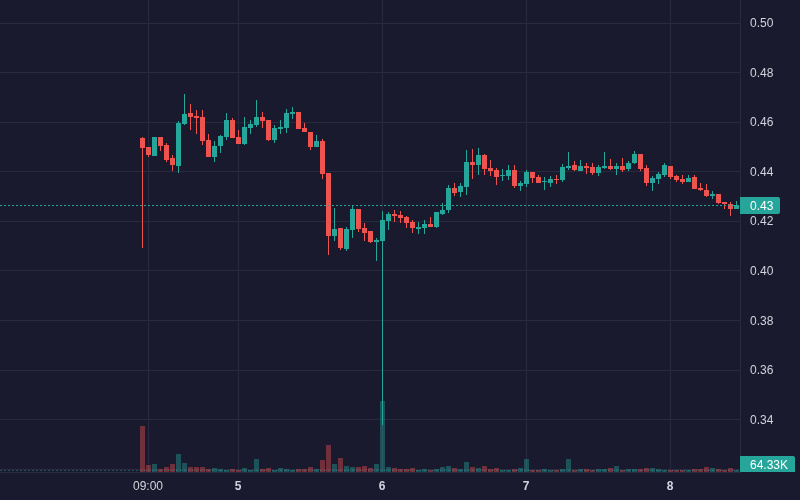
The core question for $TIA is whether the upward hourly direction reflects genuine participation. Current data shows price moving up, but volume remains not above baseline. This moderate activity suggests the rise may rely on thin liquidity rather than broad conviction.
Peer observations add context. $ETH and $GNS also show upward hourly direction with volume not above baseline. All three assets share this pattern on the same exchange. However, a shared direction is not proof of correlation. It does not indicate capital rotation between these pairs nor confirm they belong to a single economic sector.
This comparison cannot establish a common cause for the moves. Technical levels like 0.4159 and 0.4253 provide reference points, but they do not explain why buyers are active. The MACD reading of -0.00214622 versus -0.00218612 is largely descriptive here. If volume stays flat, the upward move lacks a clear engine.
To reassess this interpretation, watch for a volume spike that exceeds the typical baseline. Without that increase, the current upward drift is fragile. Do not assume that because three coins moved up together, they will remain linked. Each asset responds to its own order flow. The absence of confirmed drivers means the move can reverse quickly if buyers step back.
This observation focuses on momentum quality, not prediction. It highlights that direction alone is insufficient. Traders should verify if effort matches the move before treating it as a strong trend.
Probabilistic market research, not a recommendation or guaranteed return.
The comparison to keep in mind: $ETH has hourly direction up and volume not above its baseline; $GNS has hourly direction up and volume not above its baseline. This alone does not establish correlation.
Which matters more in this comparison: direction or how the move holds?
#TIA #ETH #GNS #CryptoWatchlist #CryptoLearning
Binance spot proof for $TIA: closed price 0.4191 USDT.
Source: binance. Closed candle: 2026-11-08T18:00:00+00:00.
$TIA : Checking if Direction Matches Effort
The core question for $TIA is whether the upward hourly direction reflects genuine participation. Current data shows price moving up, but volume remains not above baseline. This moderate activity suggests the rise may rely on thin liquidity rather than broad conviction.
Peer observations add context. $ETH and $GNS also show upward hourly direction with volume not above baseline. All three assets share this pattern on the same exchange. However, a shared direction is not proof of correlation. It does not indicate capital rotation between these pairs nor confirm they belong to a single economic sector.
This comparison cannot establish a common cause for the moves. Technical levels like 0.4159 and 0.4253 provide reference points, but they do not explain why buyers are active. The MACD reading of -0.00214622 versus -0.00218612 is largely descriptive here. If volume stays flat, the upward move lacks a clear engine.
To reassess this interpretation, watch for a volume spike that exceeds the typical baseline. Without that increase, the current upward drift is fragile. Do not assume that because three coins moved up together, they will remain linked. Each asset responds to its own order flow. The absence of confirmed drivers means the move can reverse quickly if buyers step back.
This observation focuses on momentum quality, not prediction. It highlights that direction alone is insufficient. Traders should verify if effort matches the move before treating it as a strong trend.
Probabilistic market research, not a recommendation or guaranteed return.
The comparison to keep in mind: $ETH has hourly direction up and volume not above its baseline; $GNS has hourly direction up and volume not above its baseline. This alone does not establish correlation.
Which matters more in this comparison: direction or how the move holds?
#TIA #ETH #GNS #CryptoWatchlist #CryptoLearning
Binance spot proof for $TIA : closed price 0.4191 USDT.
Source: binance. Closed candle: 2026-11-08T18:00:00+00:00.
The core question for $TIA is whether the upward hourly direction reflects genuine participation. Current data shows price moving up, but volume remains not above baseline. This moderate activity suggests the rise may rely on thin liquidity rather than broad conviction.
Peer observations add context. $ETH and $GNS also show upward hourly direction with volume not above baseline. All three assets share this pattern on the same exchange. However, a shared direction is not proof of correlation. It does not indicate capital rotation between these pairs nor confirm they belong to a single economic sector.
This comparison cannot establish a common cause for the moves. Technical levels like 0.4159 and 0.4253 provide reference points, but they do not explain why buyers are active. The MACD reading of -0.00214622 versus -0.00218612 is largely descriptive here. If volume stays flat, the upward move lacks a clear engine.
To reassess this interpretation, watch for a volume spike that exceeds the typical baseline. Without that increase, the current upward drift is fragile. Do not assume that because three coins moved up together, they will remain linked. Each asset responds to its own order flow. The absence of confirmed drivers means the move can reverse quickly if buyers step back.
This observation focuses on momentum quality, not prediction. It highlights that direction alone is insufficient. Traders should verify if effort matches the move before treating it as a strong trend.
Probabilistic market research, not a recommendation or guaranteed return.
The comparison to keep in mind: $ETH has hourly direction up and volume not above its baseline; $GNS has hourly direction up and volume not above its baseline. This alone does not establish correlation.
Which matters more in this comparison: direction or how the move holds?
#TIA #ETH #GNS #CryptoWatchlist #CryptoLearning
Binance spot proof for $TIA : closed price 0.4191 USDT.
Source: binance. Closed candle: 2026-11-08T18:00:00+00:00.
4
·
--
$TIA TIA is showing bearish movement: -3.35% (Crypto).
Volume: 1.78M | Last: $0.426400
Key signals: strong momentum.
Bias Daily: BULLISH 🟢 | Weekly: BULLISH 🟢
TIA declined 3.3% over 24 hours to $0.425 due to net capital outflows and technical trend deterioration.
**Bearish technical breakdown (High)**: Price slipped below EMA 7, EMA 25, and EMA 99 → MACD histogram flipped negative (-0.0015) while 6-period RSI dropped to 16.27 into oversold territory.
- **Sustained capital outflows (High)**: Persistent net outflows over recent hours culminated in -$99.3K net outflow and -$71.6K large order outflow, driving price from $0.447 to $0.425.
- **Ecosystem security overhang (Medium)**: Keplr Wallet's advisory regarding social login vulnerability exposure in Cosmos-linked networks added cautionary sentiment.
#TIA #JobsReportRaisesHikeOdds #WillAnthropicListOnTime #CPITestsDecemberRateOutlook #Crypto
$TIA TIA is showing bearish movement: -3.35% (Crypto).
Volume: 1.78M | Last: $0.426400
Key signals: strong momentum.
Bias Daily: BULLISH 🟢 | Weekly: BULLISH 🟢
TIA declined 3.3% over 24 hours to $0.425 due to net capital outflows and technical trend deterioration.
**Bearish technical breakdown (High)**: Price slipped below EMA 7, EMA 25, and EMA 99 → MACD histogram flipped negative (-0.0015) while 6-period RSI dropped to 16.27 into oversold territory.
- **Sustained capital outflows (High)**: Persistent net outflows over recent hours culminated in -$99.3K net outflow and -$71.6K large order outflow, driving price from $0.447 to $0.425.
- **Ecosystem security overhang (Medium)**: Keplr Wallet's advisory regarding social login vulnerability exposure in Cosmos-linked networks added cautionary sentiment.
#TIA #JobsReportRaisesHikeOdds #WillAnthropicListOnTime #CPITestsDecemberRateOutlook #Crypto
Volume: 1.78M | Last: $0.426400
Key signals: strong momentum.
Bias Daily: BULLISH 🟢 | Weekly: BULLISH 🟢
TIA declined 3.3% over 24 hours to $0.425 due to net capital outflows and technical trend deterioration.
**Bearish technical breakdown (High)**: Price slipped below EMA 7, EMA 25, and EMA 99 → MACD histogram flipped negative (-0.0015) while 6-period RSI dropped to 16.27 into oversold territory.
- **Sustained capital outflows (High)**: Persistent net outflows over recent hours culminated in -$99.3K net outflow and -$71.6K large order outflow, driving price from $0.447 to $0.425.
- **Ecosystem security overhang (Medium)**: Keplr Wallet's advisory regarding social login vulnerability exposure in Cosmos-linked networks added cautionary sentiment.
#TIA #JobsReportRaisesHikeOdds #WillAnthropicListOnTime #CPITestsDecemberRateOutlook #Crypto
61

·
--
Bearish
TIA longs were caught near $0.42234.
$9.8836K cleared on the downside — watch for follow-through.
$TIA
{future}(TIAUSDT)
$JCT
{future}(JCTUSDT)
$AIOT
{future}(AIOTUSDT)
🔴 LIQUIDITY ZONE HIT 🔴
Long liquidation spotted 🧨
Downside liquidity swept — watch reaction 👀
$9.8836K cleared at $0.42234
TP1: $0.42022830
TP2: $0.41811660
TP3: $0.41600490
#tia
TIA longs were caught near $0.42234.
$9.8836K cleared on the downside — watch for follow-through.
$TIA
$JCT
$AIOT
🔴 LIQUIDITY ZONE HIT 🔴
Long liquidation spotted 🧨
Downside liquidity swept — watch reaction 👀
$9.8836K cleared at $0.42234
TP1: $0.42022830
TP2: $0.41811660
TP3: $0.41600490
#tia
$9.8836K cleared on the downside — watch for follow-through.
$TIA
$JCT
$AIOT
🔴 LIQUIDITY ZONE HIT 🔴
Long liquidation spotted 🧨
Downside liquidity swept — watch reaction 👀
$9.8836K cleared at $0.42234
TP1: $0.42022830
TP2: $0.41811660
TP3: $0.41600490
#tia
25

·
--
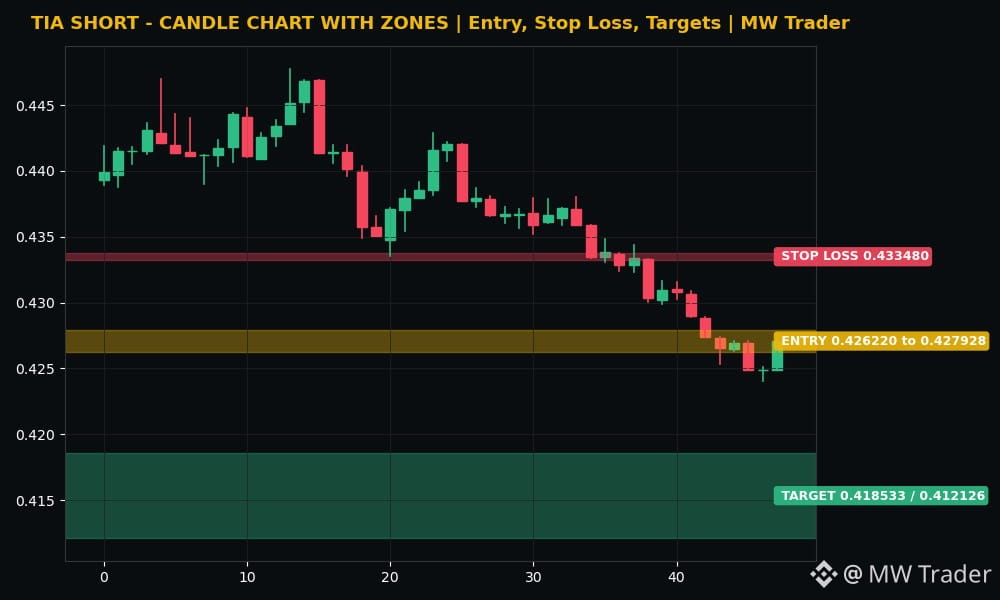
$TIA #TIA 📉
Direction: SHORT
Entry zone: 0.426220 to 0.427928
Stop loss: 0.433480
Target 1: 0.418533
Target 2: 0.412126
Celestia is trading near 0.427074 dollars, down 3.37 percent in 24 hours and down 11.40 percent over 7 days, inside a range of 0.424032 to 0.447731 dollars, and the recent closes show the price pinned flat near its low, 0.426578, then 0.426927, then 0.424871, then 0.424868, then 0.427074. 🔴 My reading is that TIA is stuck at the bottom of its range in a fear market, because it lost over 11 percent this week on only 21.0 million dollars of volume and nobody is stepping in to buy it. A short from the current zone, with a stop above 0.433480, targets 0.418533 first and then 0.412126 if sellers push through the range low. A rise above 0.433480 kills the idea without debate.
Futures trading is risky. Trade small, use a stop loss, and do your own research. This is my reading, not a guaranteed signal.
Does Celestia fall to 0.418533 first, or rise above 0.433480? 🤔
Follow for more trades.
#Celestia #Crypto #FuturesTrading #TradingSignals
$TIA #TIA 📉
Direction: SHORT
Entry zone: 0.426220 to 0.427928
Stop loss: 0.433480
Target 1: 0.418533
Target 2: 0.412126
Celestia is trading near 0.427074 dollars, down 3.37 percent in 24 hours and down 11.40 percent over 7 days, inside a range of 0.424032 to 0.447731 dollars, and the recent closes show the price pinned flat near its low, 0.426578, then 0.426927, then 0.424871, then 0.424868, then 0.427074. 🔴 My reading is that TIA is stuck at the bottom of its range in a fear market, because it lost over 11 percent this week on only 21.0 million dollars of volume and nobody is stepping in to buy it. A short from the current zone, with a stop above 0.433480, targets 0.418533 first and then 0.412126 if sellers push through the range low. A rise above 0.433480 kills the idea without debate.
Futures trading is risky. Trade small, use a stop loss, and do your own research. This is my reading, not a guaranteed signal.
Does Celestia fall to 0.418533 first, or rise above 0.433480? 🤔
Follow for more trades.
#Celestia #Crypto #FuturesTrading #TradingSignals
Direction: SHORT
Entry zone: 0.426220 to 0.427928
Stop loss: 0.433480
Target 1: 0.418533
Target 2: 0.412126
Celestia is trading near 0.427074 dollars, down 3.37 percent in 24 hours and down 11.40 percent over 7 days, inside a range of 0.424032 to 0.447731 dollars, and the recent closes show the price pinned flat near its low, 0.426578, then 0.426927, then 0.424871, then 0.424868, then 0.427074. 🔴 My reading is that TIA is stuck at the bottom of its range in a fear market, because it lost over 11 percent this week on only 21.0 million dollars of volume and nobody is stepping in to buy it. A short from the current zone, with a stop above 0.433480, targets 0.418533 first and then 0.412126 if sellers push through the range low. A rise above 0.433480 kills the idea without debate.
Futures trading is risky. Trade small, use a stop loss, and do your own research. This is my reading, not a guaranteed signal.
Does Celestia fall to 0.418533 first, or rise above 0.433480? 🤔
Follow for more trades.
#Celestia #Crypto #FuturesTrading #TradingSignals
18

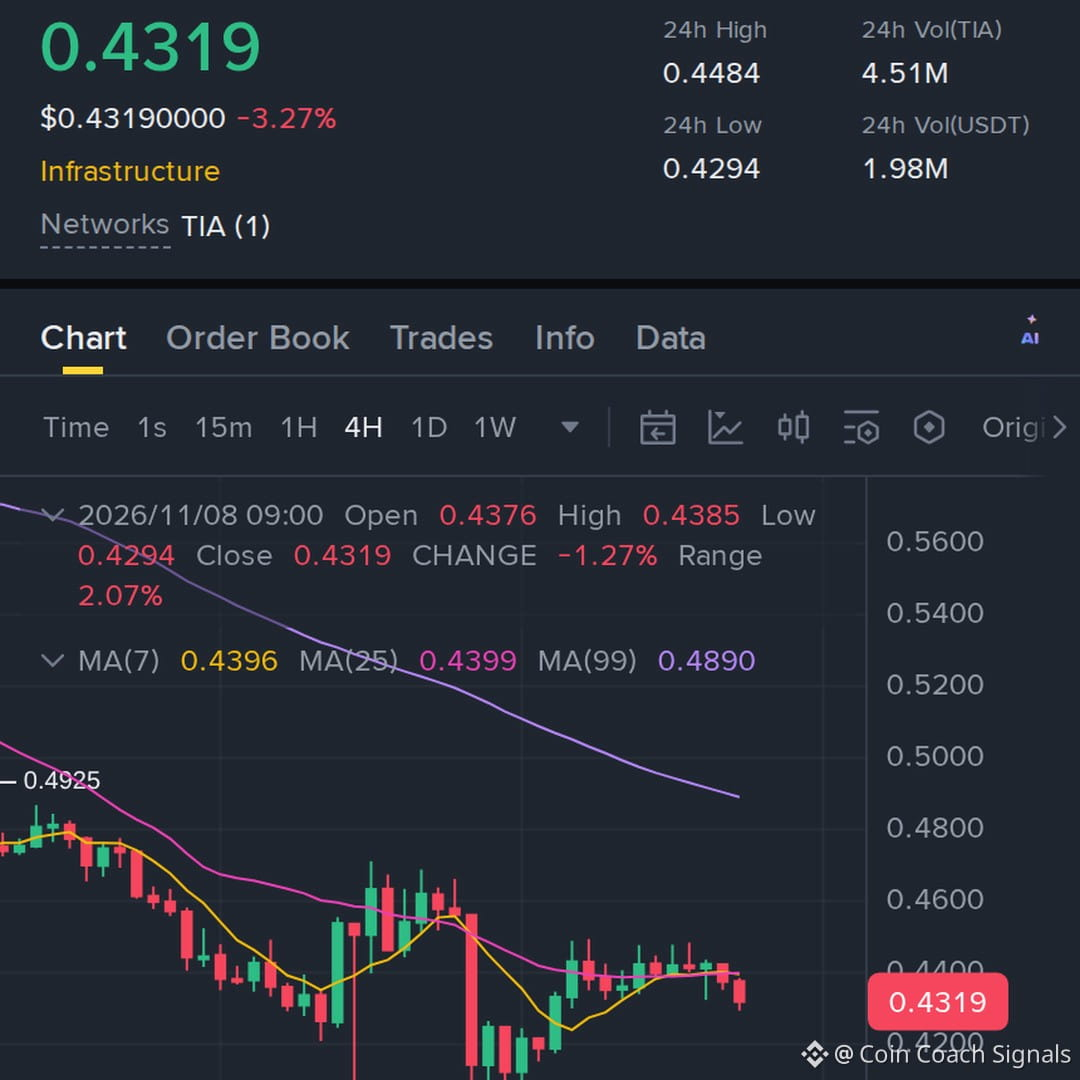
this one caught my eye, $TIA tried to recover but the bounce is losing energy again, keeping the setup around 28x
Entry: 0.4309–0.4343 | Stop Loss: 0.4518
TP1: 0.411 / TP2: 0.3915 / TP3: 0.3721
#TIA #Write2Earn #Crypto #binance
this one caught my eye, $TIA tried to recover but the bounce is losing energy again, keeping the setup around 28x
Entry: 0.4309–0.4343 | Stop Loss: 0.4518
TP1: 0.411 / TP2: 0.3915 / TP3: 0.3721
#TIA #Write2Earn #Crypto #binance
Entry: 0.4309–0.4343 | Stop Loss: 0.4518
TP1: 0.411 / TP2: 0.3915 / TP3: 0.3721
#TIA #Write2Earn #Crypto #binance
3
177

·
--
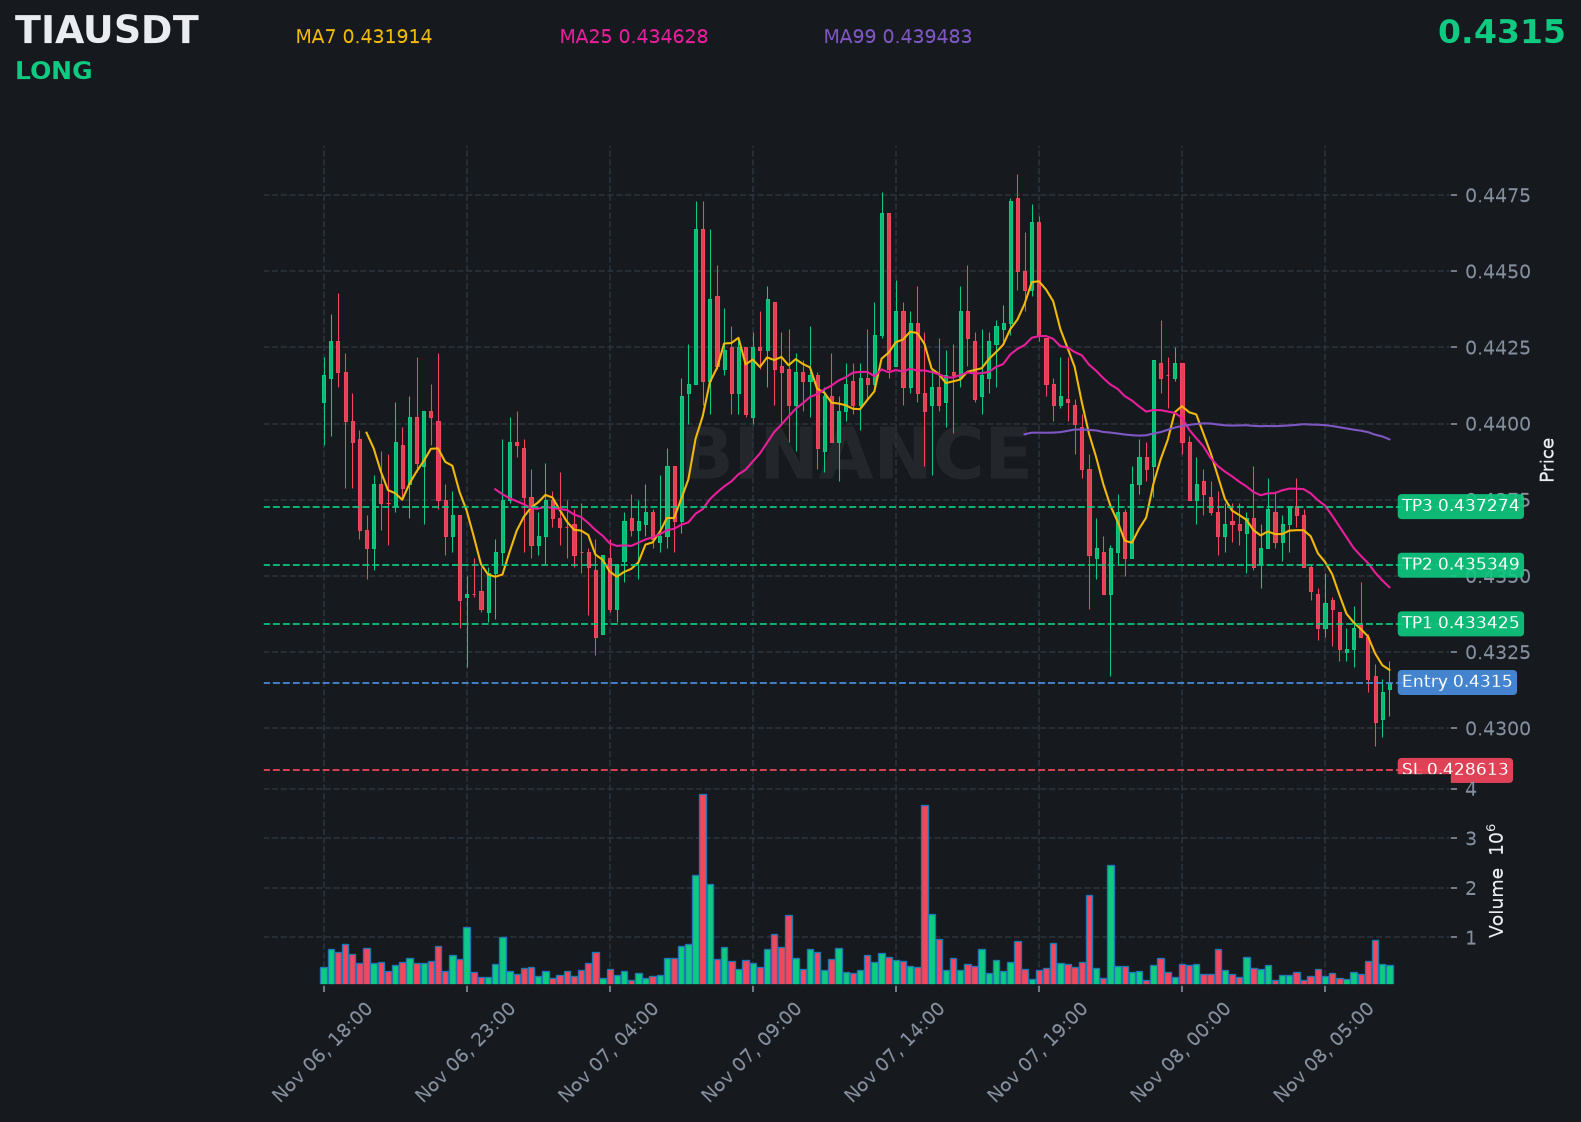
$TIA looks primed to keep climbing, with bulls firmly in control of the trend.
📍 @ 0.4315 | Volume: 0.19M USD
RSI 36 | EMA20: 0.433754 USD
📈 Trade Plan:
📈 Entry: 0.430923 – 0.432077
🛑 Stop Loss: 0.428613
🎯 TP1: 0.433425
🎯 TP2: 0.435349
🎯 TP3: 0.437274
Waiting for a retest, then riding the uptrend.
👉 $TIA 👈 Catch it
#TIA
$TIA looks primed to keep climbing, with bulls firmly in control of the trend.
📍 @ 0.4315 | Volume: 0.19M USD
RSI 36 | EMA20: 0.433754 USD
📈 Trade Plan:
📈 Entry: 0.430923 – 0.432077
🛑 Stop Loss: 0.428613
🎯 TP1: 0.433425
🎯 TP2: 0.435349
🎯 TP3: 0.437274
Waiting for a retest, then riding the uptrend.
👉 $TIA 👈 Catch it
#TIA
📍 @ 0.4315 | Volume: 0.19M USD
RSI 36 | EMA20: 0.433754 USD
📈 Trade Plan:
📈 Entry: 0.430923 – 0.432077
🛑 Stop Loss: 0.428613
🎯 TP1: 0.433425
🎯 TP2: 0.435349
🎯 TP3: 0.437274
Waiting for a retest, then riding the uptrend.
👉 $TIA 👈 Catch it
#TIA
1
120
·
--
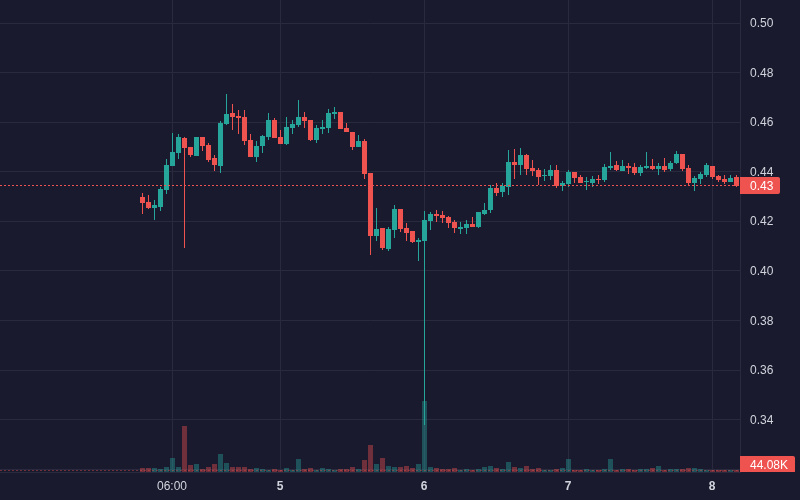
$TIA TIA is showing bearish movement: -0.62% (Crypto).
Volume: 1.92M | Last: $0.434500
Worth monitoring.
Bias Daily: BULLISH 🟢 | Weekly: BULLISH 🟢
TIA edged up 0.14% over 24h to $0.4375, retreating from $0.4470 highs despite positive Midnight integration news.
**Ecosystem expansion (High)**: Cardano privacy network Midnight announced Celestia integration for modular data availability → boosted project visibility and network utility.
- **Spike in spot buying (Medium)**: Hourly volume spiked over $1.58M alongside +$206K net inflows → pushed price to intraday high of $0.4470.
- **Trend exhaustion (Low)**: Failure to sustain above EMA-99 ($0.4414) → sharp retrace toward $0.4375 as short-term momentum faded.
#TIA #JobsReportRaisesHikeOdds #BinanceSquare #XRP #Crypto
$TIA TIA is showing bearish movement: -0.62% (Crypto).
Volume: 1.92M | Last: $0.434500
Worth monitoring.
Bias Daily: BULLISH 🟢 | Weekly: BULLISH 🟢
TIA edged up 0.14% over 24h to $0.4375, retreating from $0.4470 highs despite positive Midnight integration news.
**Ecosystem expansion (High)**: Cardano privacy network Midnight announced Celestia integration for modular data availability → boosted project visibility and network utility.
- **Spike in spot buying (Medium)**: Hourly volume spiked over $1.58M alongside +$206K net inflows → pushed price to intraday high of $0.4470.
- **Trend exhaustion (Low)**: Failure to sustain above EMA-99 ($0.4414) → sharp retrace toward $0.4375 as short-term momentum faded.
#TIA #JobsReportRaisesHikeOdds #BinanceSquare #XRP #Crypto
Volume: 1.92M | Last: $0.434500
Worth monitoring.
Bias Daily: BULLISH 🟢 | Weekly: BULLISH 🟢
TIA edged up 0.14% over 24h to $0.4375, retreating from $0.4470 highs despite positive Midnight integration news.
**Ecosystem expansion (High)**: Cardano privacy network Midnight announced Celestia integration for modular data availability → boosted project visibility and network utility.
- **Spike in spot buying (Medium)**: Hourly volume spiked over $1.58M alongside +$206K net inflows → pushed price to intraday high of $0.4470.
- **Trend exhaustion (Low)**: Failure to sustain above EMA-99 ($0.4414) → sharp retrace toward $0.4375 as short-term momentum faded.
#TIA #JobsReportRaisesHikeOdds #BinanceSquare #XRP #Crypto
20
·
--
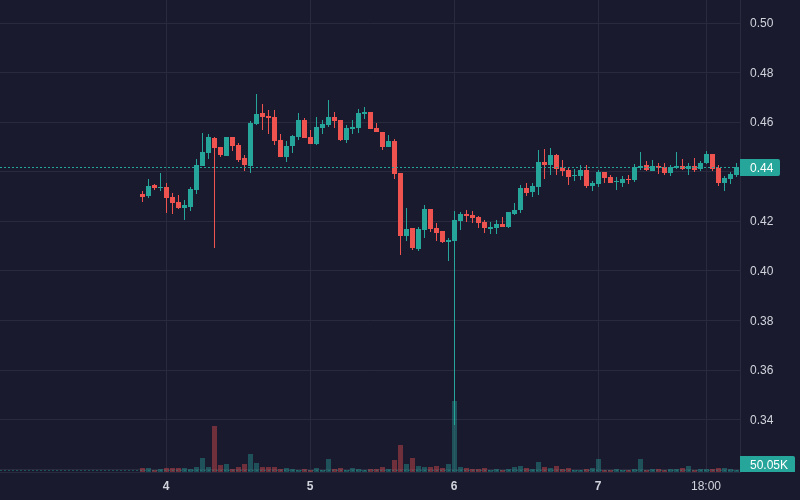
$TIA TIA is showing bullish movement: 1.40% (Crypto).
Volume: 2.38M | Last: $0.441500
Worth monitoring.
Bias Daily: BULLISH 🟢 | Weekly: BULLISH 🟢
TIA rose 0.85% over 24h to $0.4389 following modular integration news, though overhead EMA resistance limited further gains.
**Ecosystem integration expansion (High)**: Midnight's planned integration of Celestia for modular data availability alongside Filecoin → bolstered fundamental demand and sentiment
- **Technical breakout attempts (Medium)**: Price tested local highs of $0.4470 as RSI_6 hit overbought (77.2) before mean-reverting toward EMA_25 ($0.4395)
- **Intermittent large inflows (Low)**: Sporadic spikes in large order inflow (e.g., +$119K and +$79K) provided momentary price support above $0.4360
#TIA #JobsReportRaisesHikeOdds #XRP #BinanceSquare #Crypto
$TIA TIA is showing bullish movement: 1.40% (Crypto).
Volume: 2.38M | Last: $0.441500
Worth monitoring.
Bias Daily: BULLISH 🟢 | Weekly: BULLISH 🟢
TIA rose 0.85% over 24h to $0.4389 following modular integration news, though overhead EMA resistance limited further gains.
**Ecosystem integration expansion (High)**: Midnight's planned integration of Celestia for modular data availability alongside Filecoin → bolstered fundamental demand and sentiment
- **Technical breakout attempts (Medium)**: Price tested local highs of $0.4470 as RSI_6 hit overbought (77.2) before mean-reverting toward EMA_25 ($0.4395)
- **Intermittent large inflows (Low)**: Sporadic spikes in large order inflow (e.g., +$119K and +$79K) provided momentary price support above $0.4360
#TIA #JobsReportRaisesHikeOdds #XRP #BinanceSquare #Crypto
Volume: 2.38M | Last: $0.441500
Worth monitoring.
Bias Daily: BULLISH 🟢 | Weekly: BULLISH 🟢
TIA rose 0.85% over 24h to $0.4389 following modular integration news, though overhead EMA resistance limited further gains.
**Ecosystem integration expansion (High)**: Midnight's planned integration of Celestia for modular data availability alongside Filecoin → bolstered fundamental demand and sentiment
- **Technical breakout attempts (Medium)**: Price tested local highs of $0.4470 as RSI_6 hit overbought (77.2) before mean-reverting toward EMA_25 ($0.4395)
- **Intermittent large inflows (Low)**: Sporadic spikes in large order inflow (e.g., +$119K and +$79K) provided momentary price support above $0.4360
#TIA #JobsReportRaisesHikeOdds #XRP #BinanceSquare #Crypto
22
·
--
Bearish
The downside sweep has cleared TIA long positions.
Watch for a possible reaction from buyers.
$TIA
{future}(TIAUSDT)
$AKE
{future}(AKEUSDT)
$ONE
{future}(ONEUSDT)
🔴 LIQUIDITY ZONE HIT 🔴
Long liquidation spotted 🧨
$1.0976K cleared at $0.4401
Downside liquidity swept — watch reaction 👀
🎯 TP Targets:
$0.437900
$0.435699
$0.433499
#tia
The downside sweep has cleared TIA long positions.
Watch for a possible reaction from buyers.
$TIA
$AKE
$ONE
🔴 LIQUIDITY ZONE HIT 🔴
Long liquidation spotted 🧨
$1.0976K cleared at $0.4401
Downside liquidity swept — watch reaction 👀
🎯 TP Targets:
$0.437900
$0.435699
$0.433499
#tia
Watch for a possible reaction from buyers.
$TIA
$AKE
$ONE
🔴 LIQUIDITY ZONE HIT 🔴
Long liquidation spotted 🧨
$1.0976K cleared at $0.4401
Downside liquidity swept — watch reaction 👀
🎯 TP Targets:
$0.437900
$0.435699
$0.433499
#tia
60
·
--
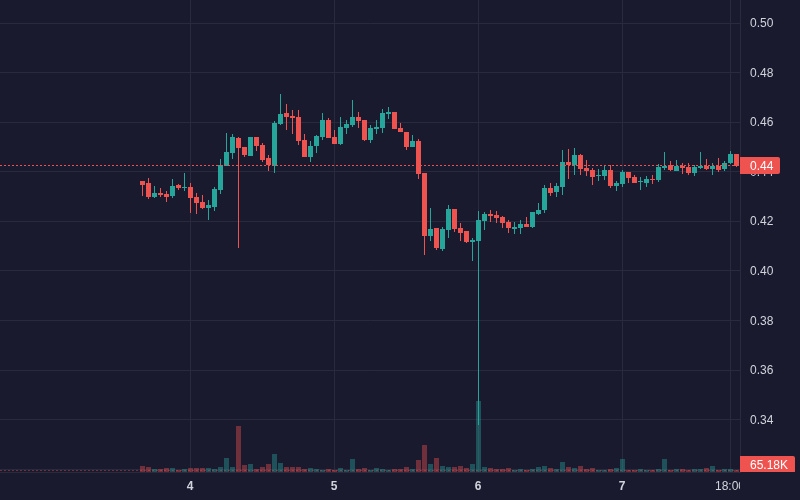
$TIA TIA is showing bullish movement: 0.73% (Crypto).
Volume: 2.38M | Last: $0.442800
Worth monitoring.
Bias Daily: BULLISH 🟢 | Weekly: BULLISH 🟢
TIA ticked up 0.68% in 24h to $0.4435, supported by integration catalysts despite lingering net outflows.
**Ecosystem integration & metrics (High)**: Sidechain Midnight revealed plans to integrate Celestia for DA alongside 3-year mainnet milestones showing 2.6x network usage growth → improved enterprise adoption sentiment
- **Technical breakout (Medium)**: Price crossed above **EMA-7** ($0.4418) and **EMA-99** ($0.4418) with RSI rising to 65.7 → bullish technical alignment
- **Periodic whale buying (Low)**: Intermittent large inflows (e.g. +$119K at 16:00 UTC) absorbed broader net negative outflows
#TIA #JobsReportRaisesHikeOdds #AKE #AKEUSDT #Crypto
$TIA TIA is showing bullish movement: 0.73% (Crypto).
Volume: 2.38M | Last: $0.442800
Worth monitoring.
Bias Daily: BULLISH 🟢 | Weekly: BULLISH 🟢
TIA ticked up 0.68% in 24h to $0.4435, supported by integration catalysts despite lingering net outflows.
**Ecosystem integration & metrics (High)**: Sidechain Midnight revealed plans to integrate Celestia for DA alongside 3-year mainnet milestones showing 2.6x network usage growth → improved enterprise adoption sentiment
- **Technical breakout (Medium)**: Price crossed above **EMA-7** ($0.4418) and **EMA-99** ($0.4418) with RSI rising to 65.7 → bullish technical alignment
- **Periodic whale buying (Low)**: Intermittent large inflows (e.g. +$119K at 16:00 UTC) absorbed broader net negative outflows
#TIA #JobsReportRaisesHikeOdds #AKE #AKEUSDT #Crypto
Volume: 2.38M | Last: $0.442800
Worth monitoring.
Bias Daily: BULLISH 🟢 | Weekly: BULLISH 🟢
TIA ticked up 0.68% in 24h to $0.4435, supported by integration catalysts despite lingering net outflows.
**Ecosystem integration & metrics (High)**: Sidechain Midnight revealed plans to integrate Celestia for DA alongside 3-year mainnet milestones showing 2.6x network usage growth → improved enterprise adoption sentiment
- **Technical breakout (Medium)**: Price crossed above **EMA-7** ($0.4418) and **EMA-99** ($0.4418) with RSI rising to 65.7 → bullish technical alignment
- **Periodic whale buying (Low)**: Intermittent large inflows (e.g. +$119K at 16:00 UTC) absorbed broader net negative outflows
#TIA #JobsReportRaisesHikeOdds #AKE #AKEUSDT #Crypto
28

·
--
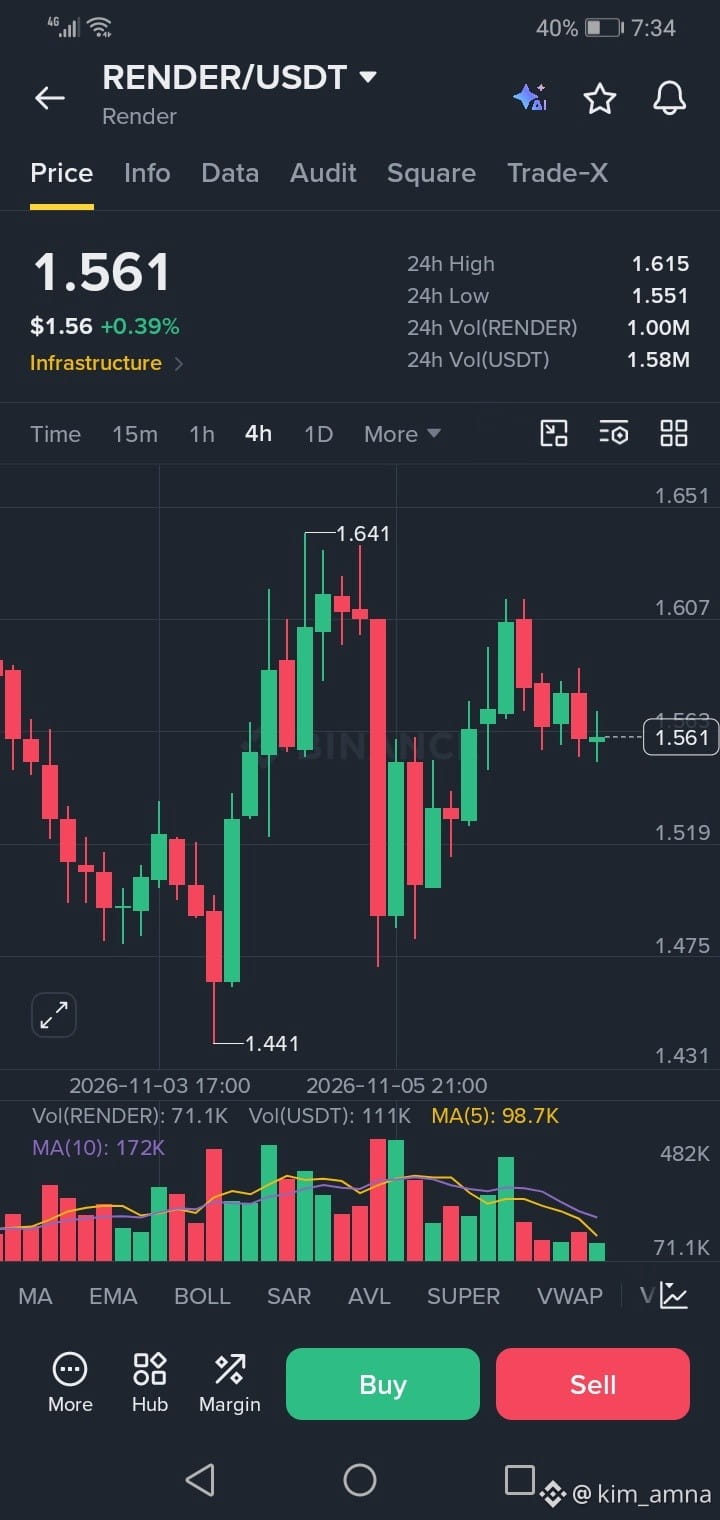
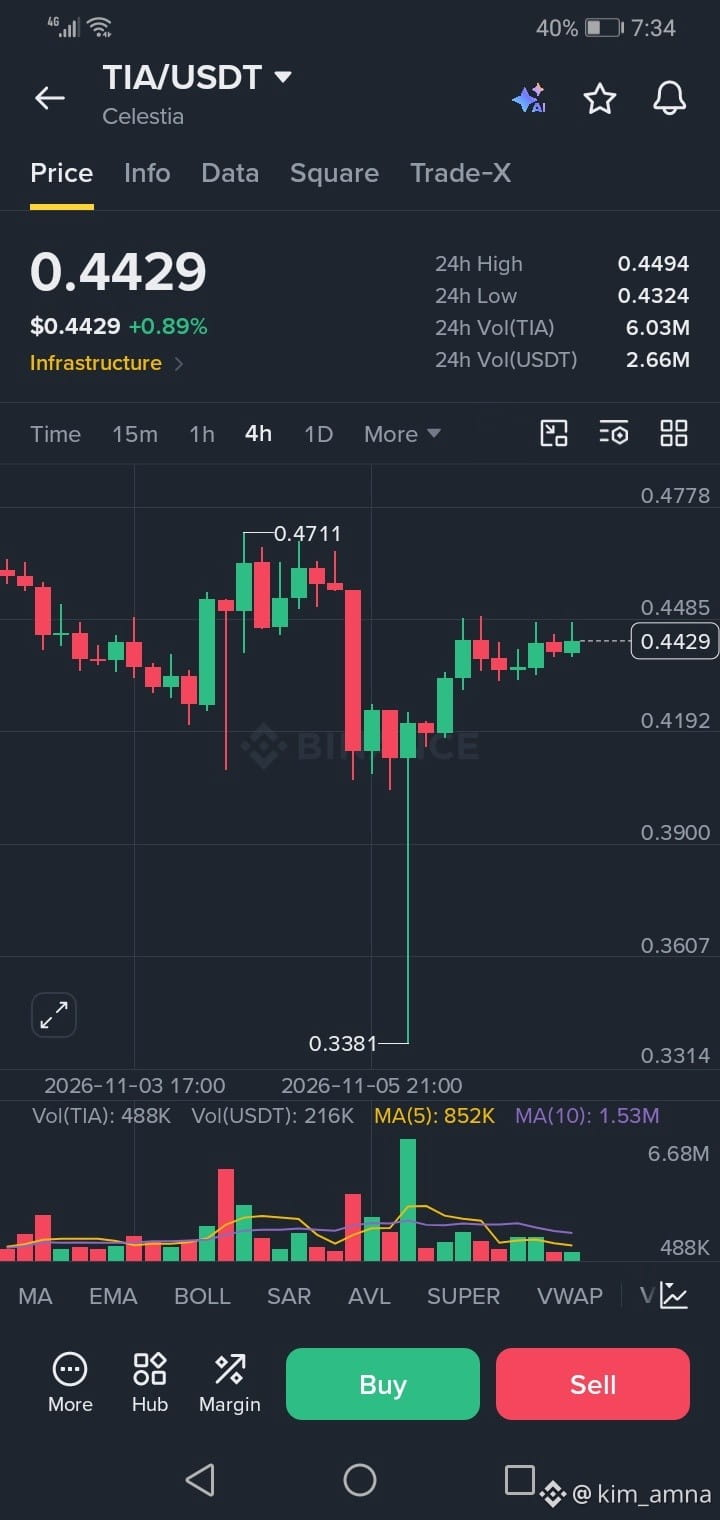
TIA & RENDER — TWO ALTCOINS TO WATCH!
The charts are showing two different setups! TIA is seeing short-term buying interest, while RENDER is still facing selling pressure near key resistance.
$TIA Current Price: ~$0.44
Support: $0.424
Resistance: $0.449
TP1: $0.480
TP2: $0.516
TIA is showing positive short-term momentum, but the daily trend remains cautious. A breakout above $0.449 could strengthen the bullish outlook.
$RENDER Current Price: ~$1.56
Support: $1.547
Resistance: $1.635
TP1: $1.70
TP2: $1.85
RENDER is trying to stabilize, but the daily chart remains bearish. A confirmed breakout above $1.635 could open the door for a stronger recovery.
What do you think? Can TIA regain bullish momentum, or will RENDER surprise the market with a recovery?
#tia #render #BinanceSquare #crypto #Write2Earn
{spot}(RENDERUSDT)
{future}(TIAUSDT)
TIA & RENDER — TWO ALTCOINS TO WATCH!
The charts are showing two different setups! TIA is seeing short-term buying interest, while RENDER is still facing selling pressure near key resistance.
$TIA Current Price: ~$0.44
Support: $0.424
Resistance: $0.449
TP1: $0.480
TP2: $0.516
TIA is showing positive short-term momentum, but the daily trend remains cautious. A breakout above $0.449 could strengthen the bullish outlook.
$RENDER Current Price: ~$1.56
Support: $1.547
Resistance: $1.635
TP1: $1.70
TP2: $1.85
RENDER is trying to stabilize, but the daily chart remains bearish. A confirmed breakout above $1.635 could open the door for a stronger recovery.
What do you think? Can TIA regain bullish momentum, or will RENDER surprise the market with a recovery?
#tia #render #BinanceSquare #crypto #Write2Earn
The charts are showing two different setups! TIA is seeing short-term buying interest, while RENDER is still facing selling pressure near key resistance.
$TIA Current Price: ~$0.44
Support: $0.424
Resistance: $0.449
TP1: $0.480
TP2: $0.516
TIA is showing positive short-term momentum, but the daily trend remains cautious. A breakout above $0.449 could strengthen the bullish outlook.
$RENDER Current Price: ~$1.56
Support: $1.547
Resistance: $1.635
TP1: $1.70
TP2: $1.85
RENDER is trying to stabilize, but the daily chart remains bearish. A confirmed breakout above $1.635 could open the door for a stronger recovery.
What do you think? Can TIA regain bullish momentum, or will RENDER surprise the market with a recovery?
#tia #render #BinanceSquare #crypto #Write2Earn
1
15

·
--
$TIA looks strong at 0.44240 today. The volume says wait
Volume is only 0.7x average right now so this move lacks real backing
Only 2.7M in twenty four hour volume means big orders push this book around and exits get messy
I need an hourly close and hold above 0.44940 to trust a long
Or a pullback that holds 0.43000 and bounces cleanly
It could keep running without you and a bad entry costs more than a missed move
Chasing $TIA here or waiting for 0.43000
#TIA #RiskManagement
$TIA looks strong at 0.44240 today. The volume says wait
Volume is only 0.7x average right now so this move lacks real backing
Only 2.7M in twenty four hour volume means big orders push this book around and exits get messy
I need an hourly close and hold above 0.44940 to trust a long
Or a pullback that holds 0.43000 and bounces cleanly
It could keep running without you and a bad entry costs more than a missed move
Chasing $TIA here or waiting for 0.43000
#TIA #RiskManagement
Volume is only 0.7x average right now so this move lacks real backing
Only 2.7M in twenty four hour volume means big orders push this book around and exits get messy
I need an hourly close and hold above 0.44940 to trust a long
Or a pullback that holds 0.43000 and bounces cleanly
It could keep running without you and a bad entry costs more than a missed move
Chasing $TIA here or waiting for 0.43000
#TIA #RiskManagement
12
·
--
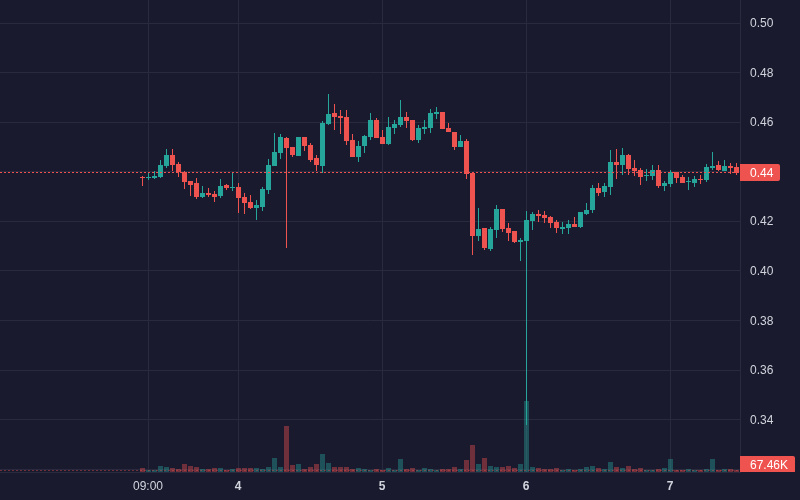
$TIA TIA is showing bullish movement: 2.02% (Crypto).
Volume: 2.90M | Last: $0.439700
Key signals: high trader activity.
Bias Daily: BULLISH 🟢 | Weekly: BULLISH 🟢
TIA rose 1.99% in 24h to $0.4418, supported by ecosystem anniversary milestones despite continuous net capital outflows.
**Ecosystem milestones (High)**: Mainnet anniversary reports highlighted a 2.6x surge in network usage and 115x throughput capacity growth alongside the Fibre protocol release → ignited buyer demand
- **Technical breakout (Medium)**: Price crossed above **EMA-7** ($0.4406) and **EMA-25** ($0.4374), accompanied by a bullish **MACD** crossover (histogram expanding to +0.00026) → spurred upward momentum
- **Spot volume spike (Medium)**: Trading volume surged to $1.58M on the breakout toward $0.442, absorbing local selling pressure
#TIA #JobsReportRaisesHikeOdds #xrp #TRUMP #Crypto
$TIA TIA is showing bullish movement: 2.02% (Crypto).
Volume: 2.90M | Last: $0.439700
Key signals: high trader activity.
Bias Daily: BULLISH 🟢 | Weekly: BULLISH 🟢
TIA rose 1.99% in 24h to $0.4418, supported by ecosystem anniversary milestones despite continuous net capital outflows.
**Ecosystem milestones (High)**: Mainnet anniversary reports highlighted a 2.6x surge in network usage and 115x throughput capacity growth alongside the Fibre protocol release → ignited buyer demand
- **Technical breakout (Medium)**: Price crossed above **EMA-7** ($0.4406) and **EMA-25** ($0.4374), accompanied by a bullish **MACD** crossover (histogram expanding to +0.00026) → spurred upward momentum
- **Spot volume spike (Medium)**: Trading volume surged to $1.58M on the breakout toward $0.442, absorbing local selling pressure
#TIA #JobsReportRaisesHikeOdds #xrp #TRUMP #Crypto
Volume: 2.90M | Last: $0.439700
Key signals: high trader activity.
Bias Daily: BULLISH 🟢 | Weekly: BULLISH 🟢
TIA rose 1.99% in 24h to $0.4418, supported by ecosystem anniversary milestones despite continuous net capital outflows.
**Ecosystem milestones (High)**: Mainnet anniversary reports highlighted a 2.6x surge in network usage and 115x throughput capacity growth alongside the Fibre protocol release → ignited buyer demand
- **Technical breakout (Medium)**: Price crossed above **EMA-7** ($0.4406) and **EMA-25** ($0.4374), accompanied by a bullish **MACD** crossover (histogram expanding to +0.00026) → spurred upward momentum
- **Spot volume spike (Medium)**: Trading volume surged to $1.58M on the breakout toward $0.442, absorbing local selling pressure
#TIA #JobsReportRaisesHikeOdds #xrp #TRUMP #Crypto
26

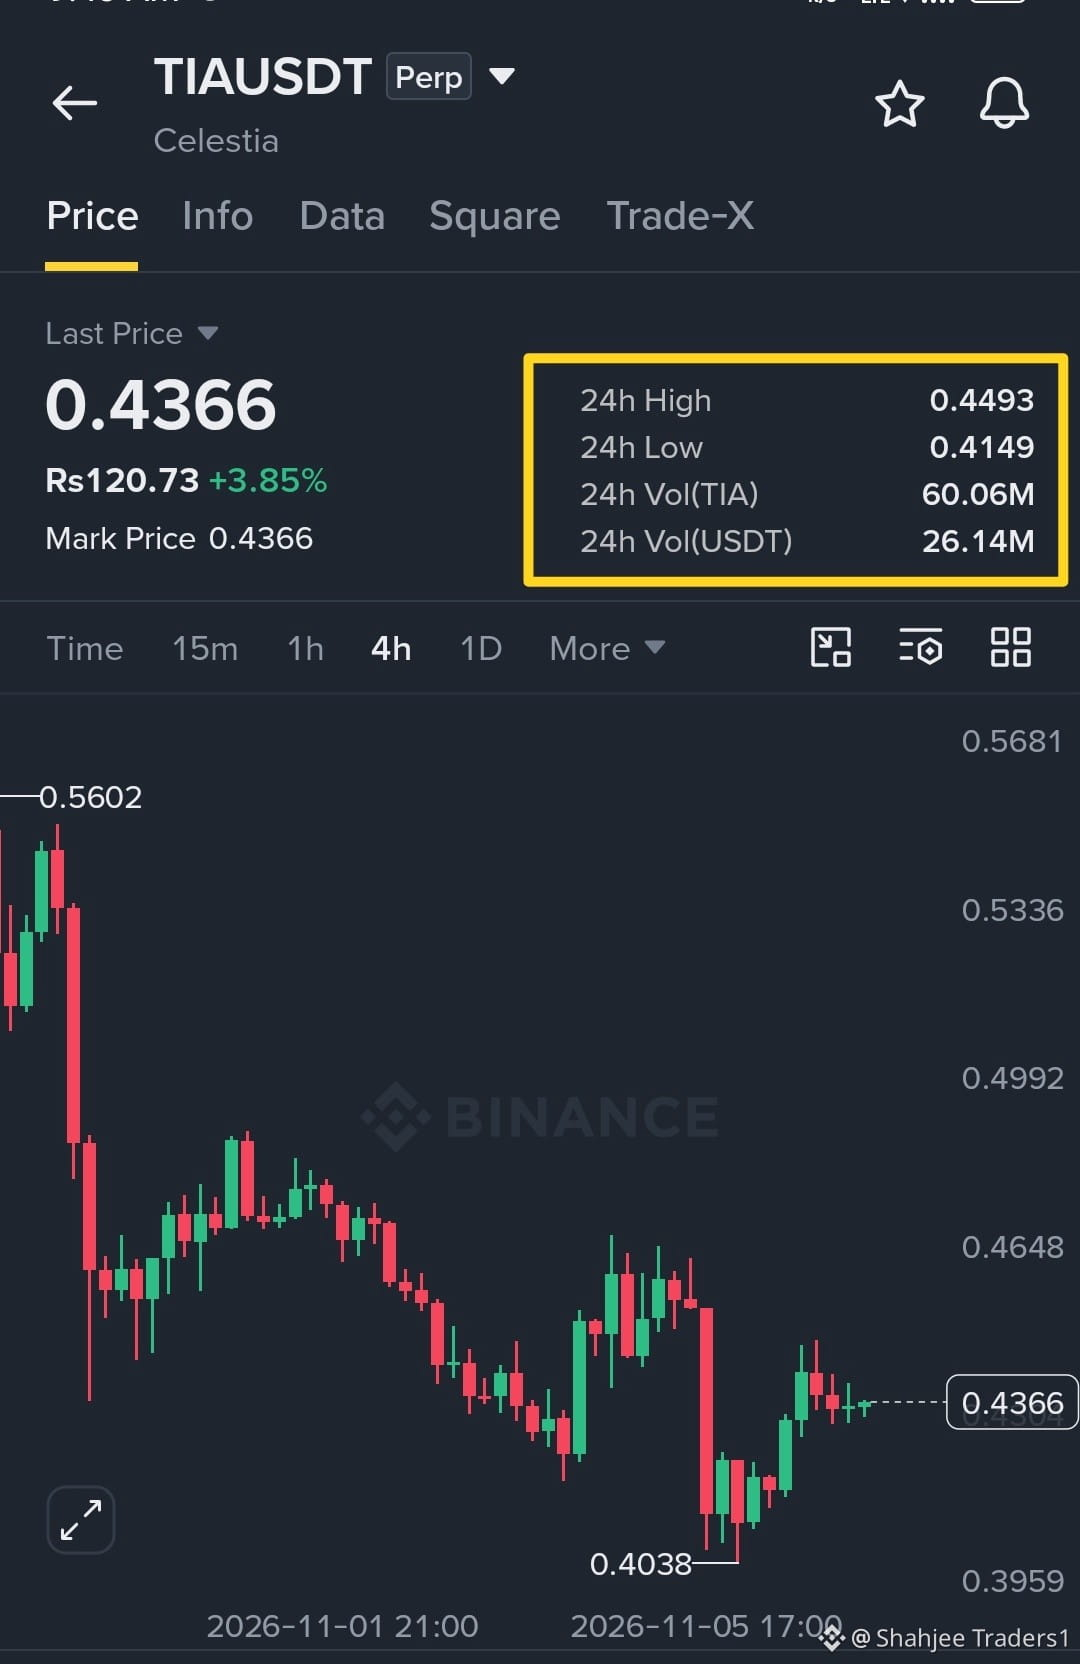
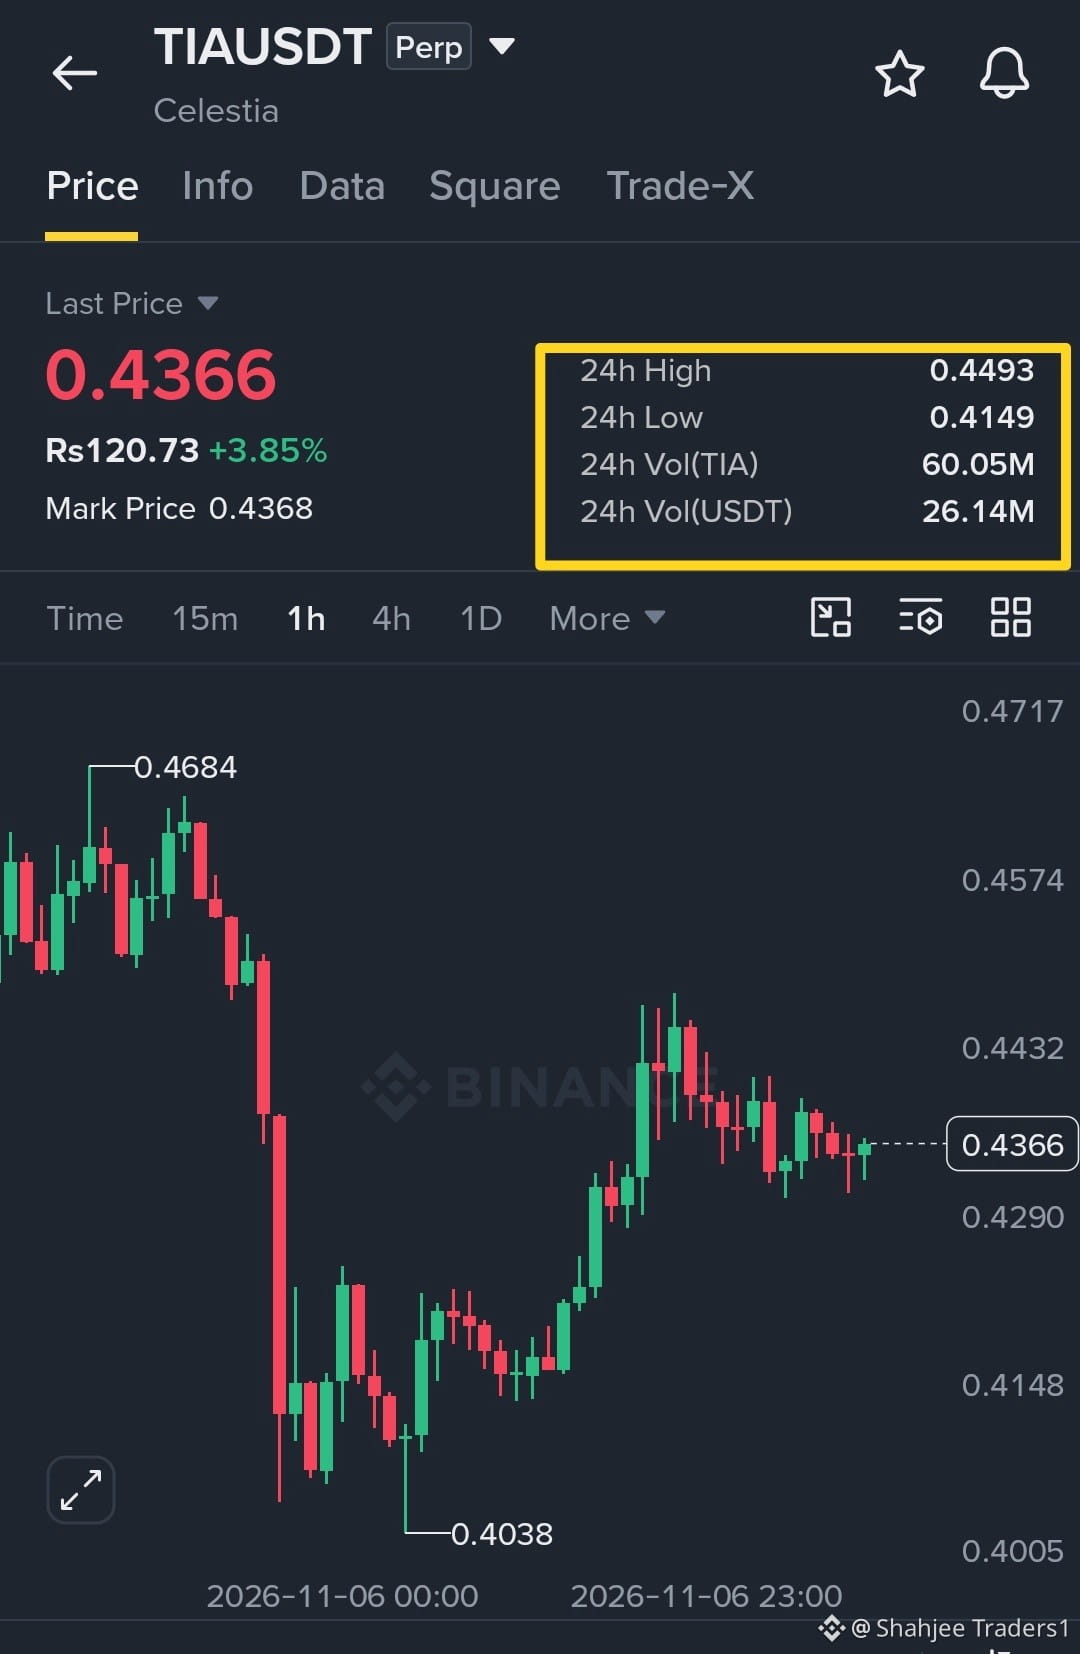
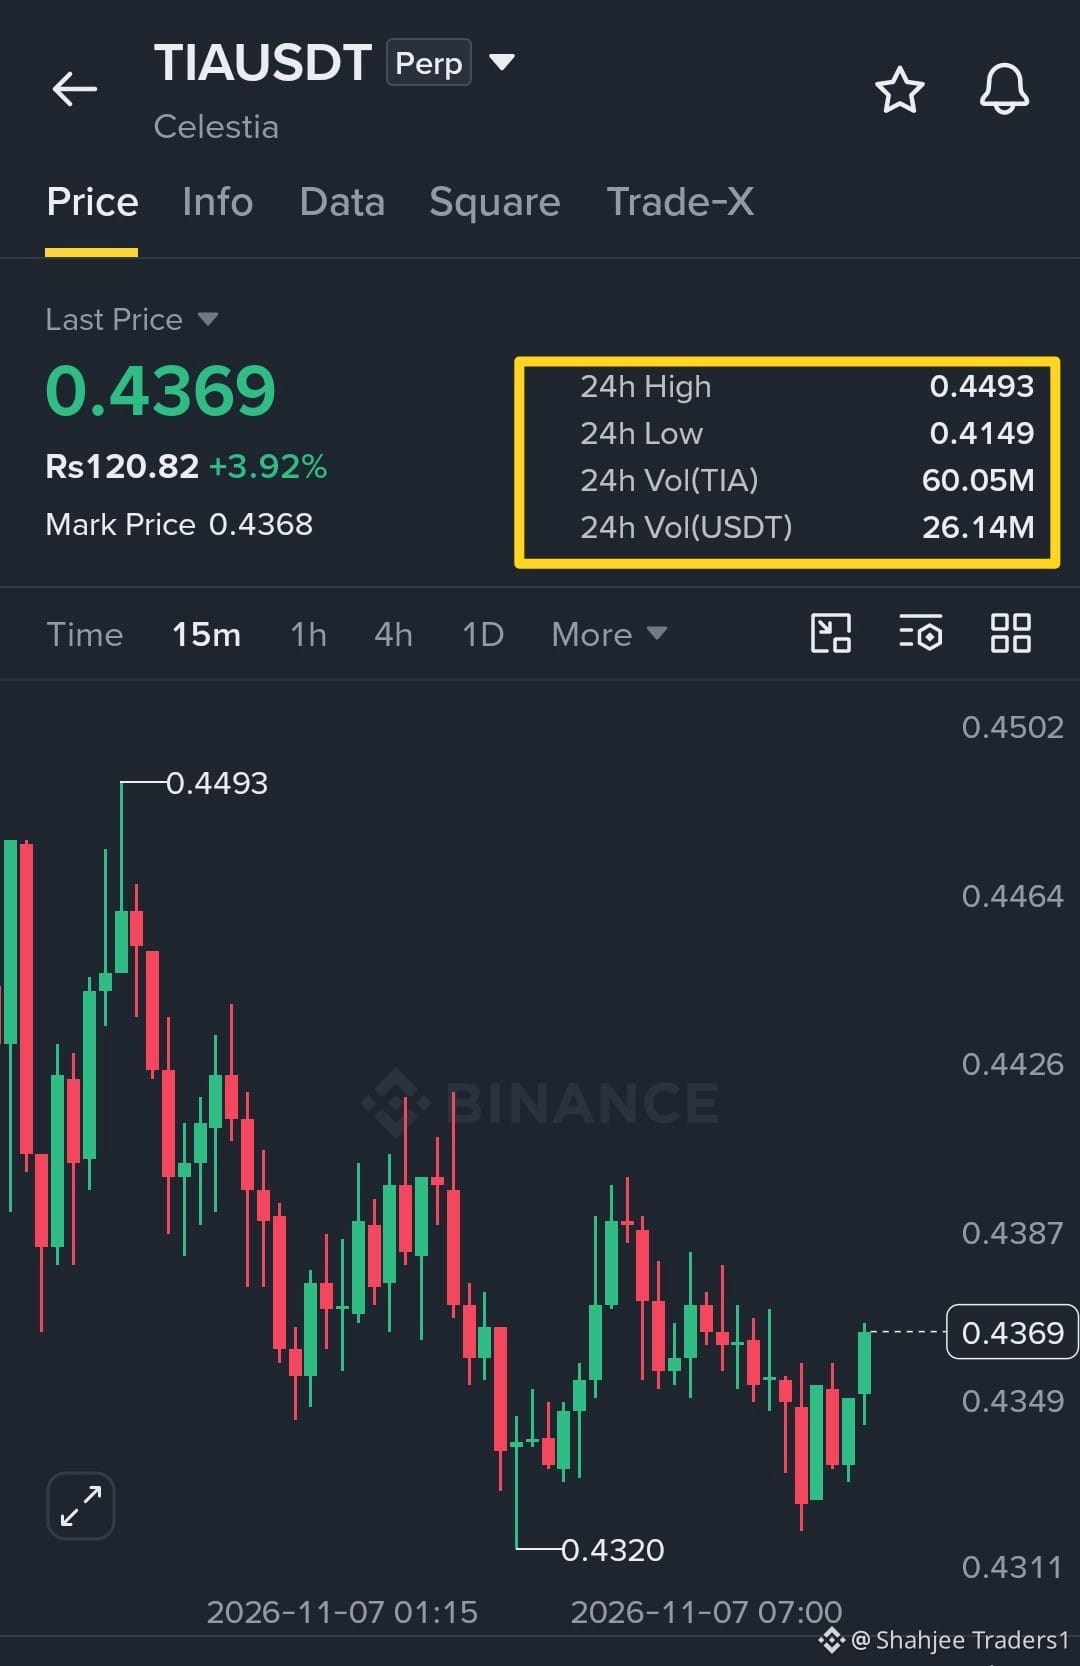
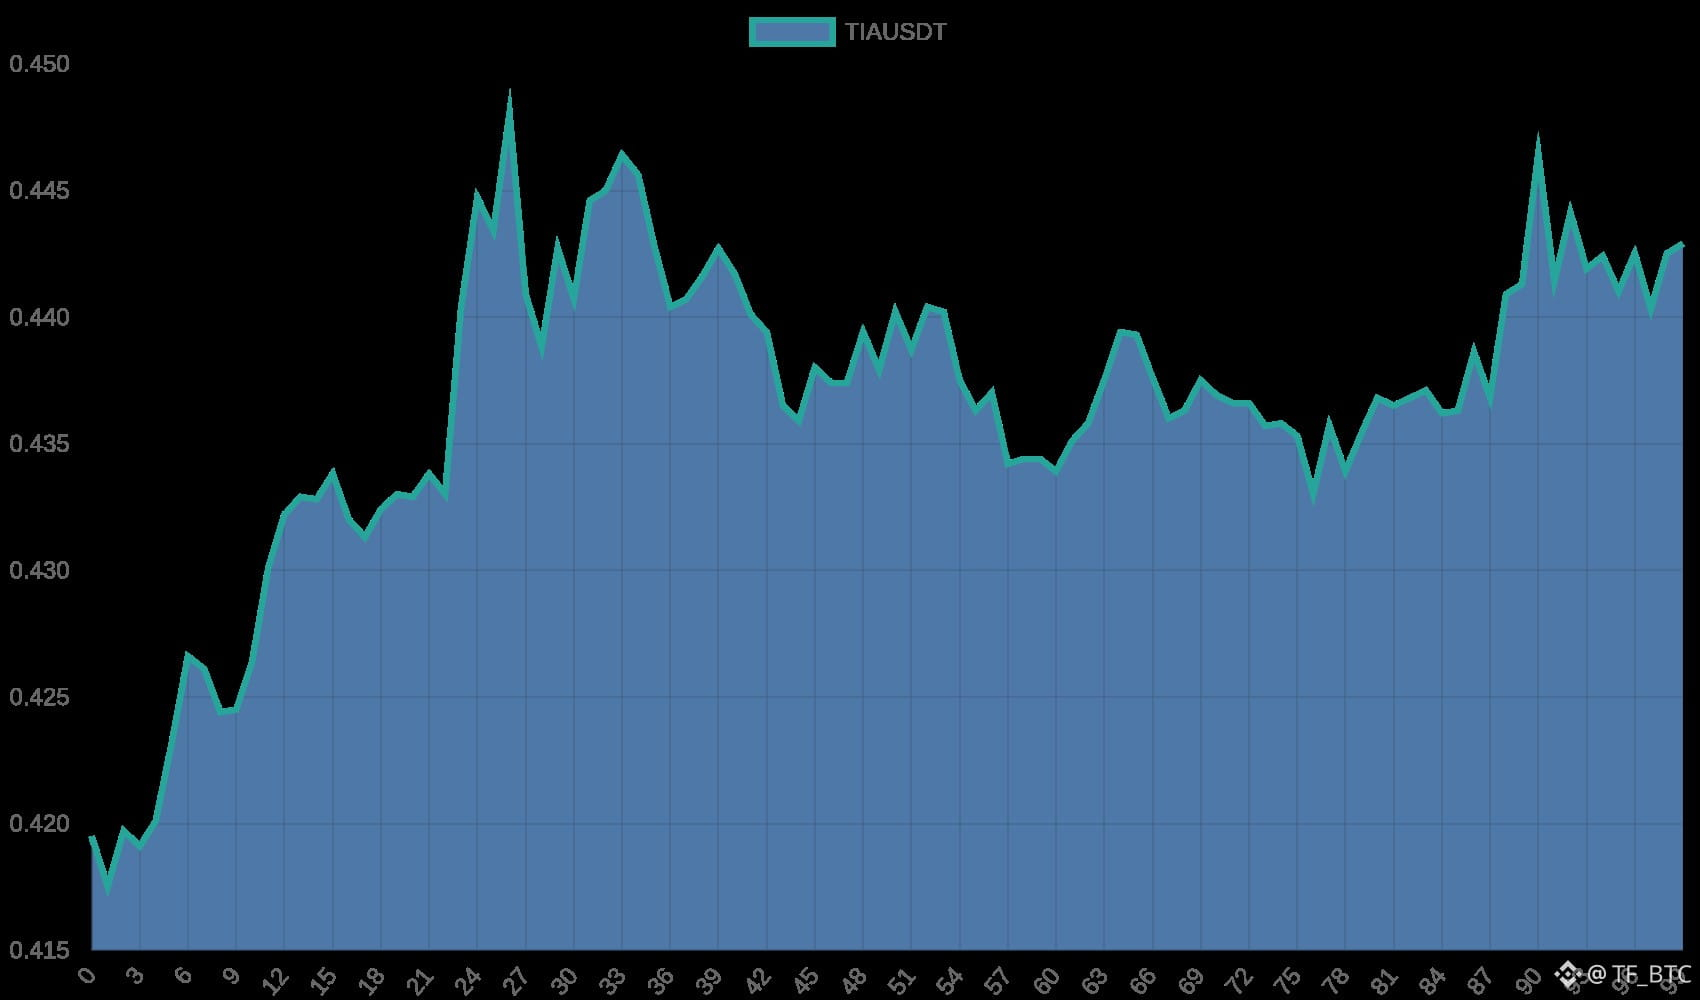
$TIA Is Getting Tighter… A Bigger Move Could Be Coming!
$TIA is stuck between two important levels, and neither side has taken control yet.
0.43240 is the support buyers need to defend, while 0.44040 remains the resistance standing in their way.
One thing to remember: the 4H chart is still below its major EMAs, so I’m not treating this as a confirmed bullish reversal.
A strong close outside this range could trigger the next move.
Will buyers finally break 0.44040, or will sellers push TIA back toward support?
#tia #crypto #Binance
{future}(TIAUSDT)
$TIA Is Getting Tighter… A Bigger Move Could Be Coming!
$TIA is stuck between two important levels, and neither side has taken control yet.
0.43240 is the support buyers need to defend, while 0.44040 remains the resistance standing in their way.
One thing to remember: the 4H chart is still below its major EMAs, so I’m not treating this as a confirmed bullish reversal.
A strong close outside this range could trigger the next move.
Will buyers finally break 0.44040, or will sellers push TIA back toward support?
#tia #crypto #Binance
$TIA is stuck between two important levels, and neither side has taken control yet.
0.43240 is the support buyers need to defend, while 0.44040 remains the resistance standing in their way.
One thing to remember: the 4H chart is still below its major EMAs, so I’m not treating this as a confirmed bullish reversal.
A strong close outside this range could trigger the next move.
Will buyers finally break 0.44040, or will sellers push TIA back toward support?
#tia #crypto #Binance
1
398


·
--
$TIA +3.67% | $STX +3.51% | $INTWB +3.50%
#TIA slipped to $0.4403, up +3.67% on $3.0 M volume. The Celestia‑based data availability network is seeing modest buying as developers keep an eye on its modular architecture.
#STX moved to $0.3448, gaining +3.51% with $1.1 M traded. Stacks continues to attract interest for its Bitcoin‑anchored smart contracts, nudging the token higher.
#INTWB climbed to $5.32, up +3.50% on $3.2 M volume. The rise hints at renewed optimism despite limited news flow.
👀 Keep an eye on volume discrepancies; the stronger flow for TIA versus STX could hint at where short‑term momentum may diverge.
#Write2Earn #Binance
$TIA +3.67% | $STX +3.51% | $INTWB +3.50%
#TIA slipped to $0.4403, up +3.67% on $3.0 M volume. The Celestia‑based data availability network is seeing modest buying as developers keep an eye on its modular architecture.
#STX moved to $0.3448, gaining +3.51% with $1.1 M traded. Stacks continues to attract interest for its Bitcoin‑anchored smart contracts, nudging the token higher.
#INTWB climbed to $5.32, up +3.50% on $3.2 M volume. The rise hints at renewed optimism despite limited news flow.
👀 Keep an eye on volume discrepancies; the stronger flow for TIA versus STX could hint at where short‑term momentum may diverge.
#Write2Earn #Binance
#TIA slipped to $0.4403, up +3.67% on $3.0 M volume. The Celestia‑based data availability network is seeing modest buying as developers keep an eye on its modular architecture.
#STX moved to $0.3448, gaining +3.51% with $1.1 M traded. Stacks continues to attract interest for its Bitcoin‑anchored smart contracts, nudging the token higher.
#INTWB climbed to $5.32, up +3.50% on $3.2 M volume. The rise hints at renewed optimism despite limited news flow.
👀 Keep an eye on volume discrepancies; the stronger flow for TIA versus STX could hint at where short‑term momentum may diverge.
#Write2Earn #Binance
15

·
--
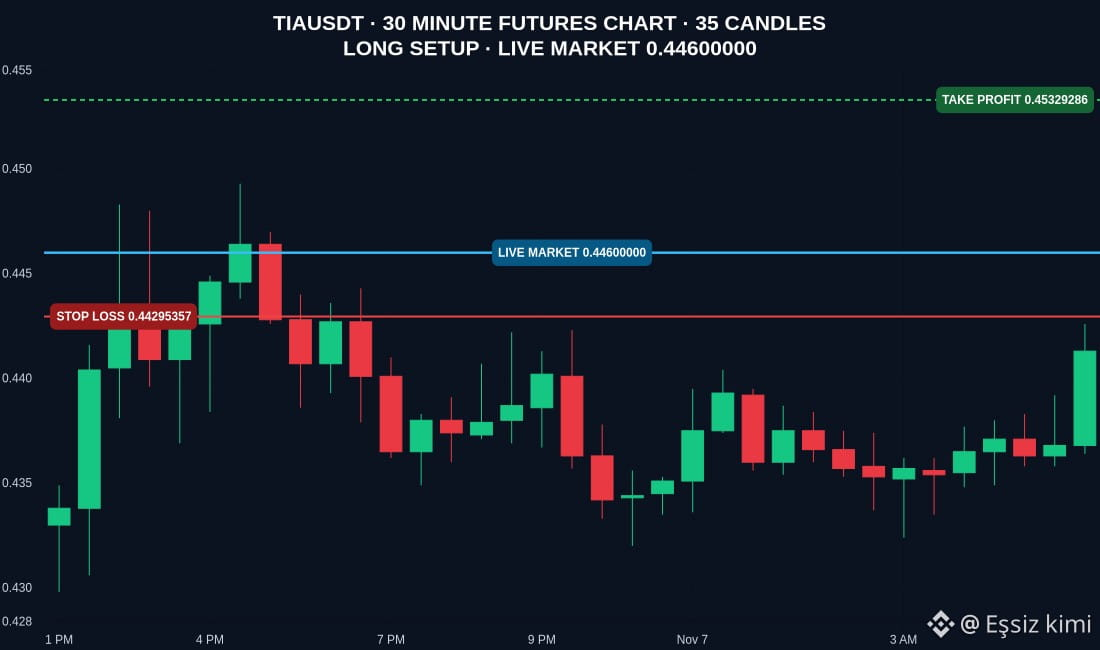
$TIA setup big long now, thank me later
Stoploss : $0.44295357
Take profit : $0.45329286
Long $TIA now
#SwingTrade #BinanceFutures #TIA
$TIA setup big long now, thank me later
Stoploss : $0.44295357
Take profit : $0.45329286
Long $TIA now
#SwingTrade #BinanceFutures #TIA
Stoploss : $0.44295357
Take profit : $0.45329286
Long $TIA now
#SwingTrade #BinanceFutures #TIA
1
620

·
--
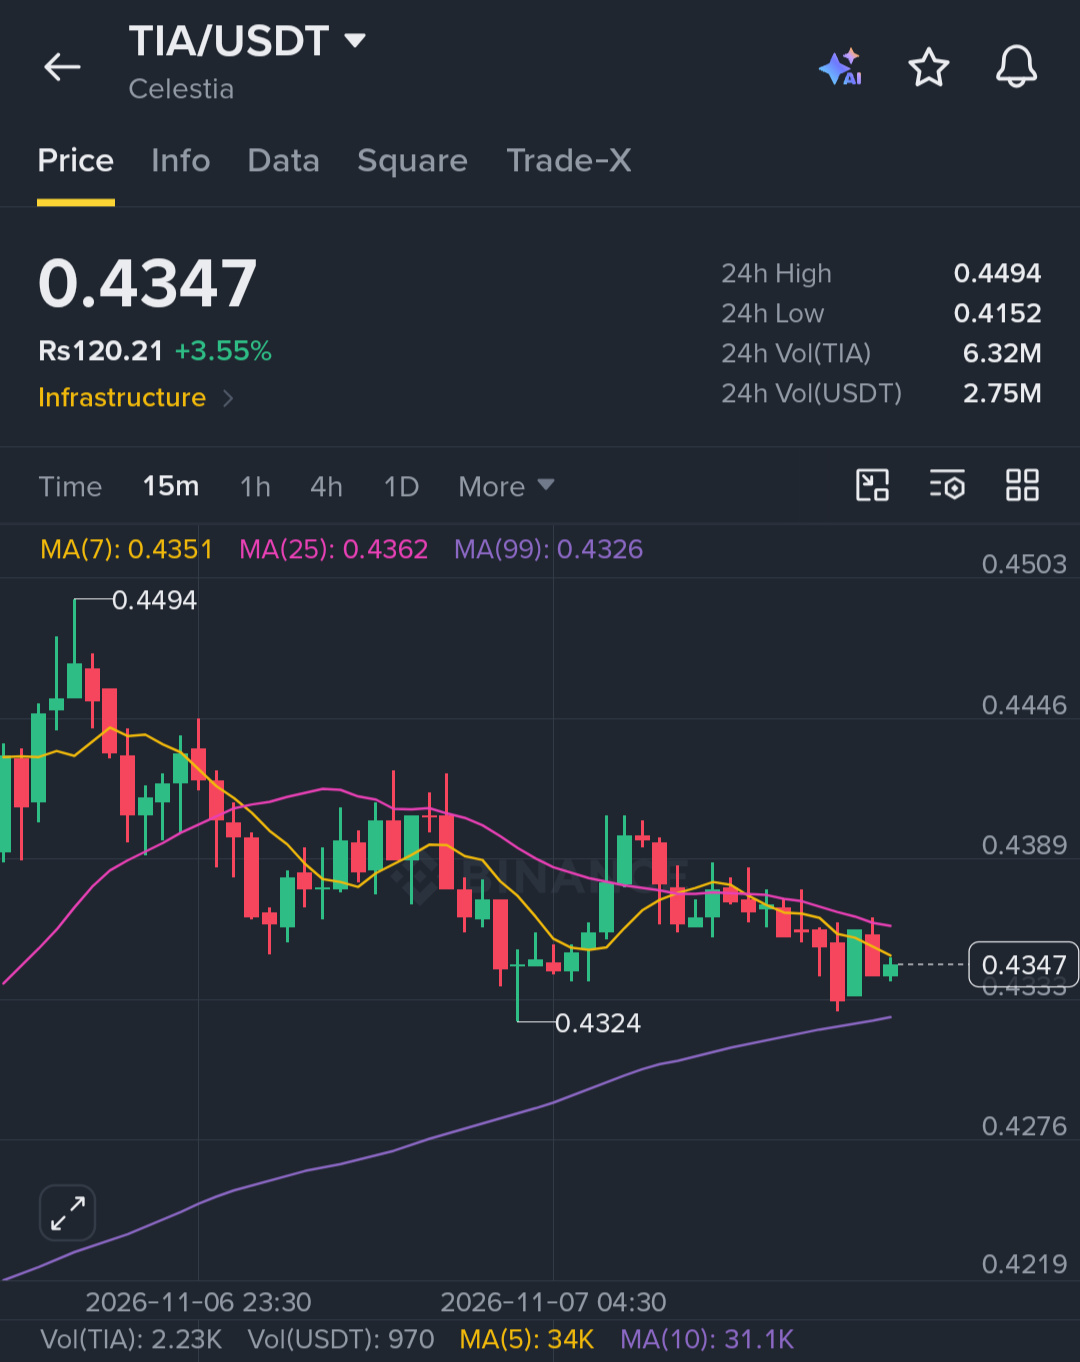
$TIA is facing selling pressure near resistance, and the structure is leaning toward a move lower.
Key Level:
🔴 Bearish below: 0.427
Trade Setup (Short):
🔴 Entry Zone: 0.431 – 0.440
🎯 Targets: 0.421 / 0.408 / 0.399
⛔ Stop Loss: 0.473
Sellers are stepping in here. Look to enter on small bounces and manage your risk carefully.
Click here to short now 👉 $TIA
{future}(TIAUSDT)
#TIA #USNovemberMichiganExpectationsIndexPrelimAt50.9
$TIA is facing selling pressure near resistance, and the structure is leaning toward a move lower.
Key Level:
🔴 Bearish below: 0.427
Trade Setup (Short):
🔴 Entry Zone: 0.431 – 0.440
🎯 Targets: 0.421 / 0.408 / 0.399
⛔ Stop Loss: 0.473
Sellers are stepping in here. Look to enter on small bounces and manage your risk carefully.
Click here to short now 👉 $TIA
#TIA #USNovemberMichiganExpectationsIndexPrelimAt50.9
Key Level:
🔴 Bearish below: 0.427
Trade Setup (Short):
🔴 Entry Zone: 0.431 – 0.440
🎯 Targets: 0.421 / 0.408 / 0.399
⛔ Stop Loss: 0.473
Sellers are stepping in here. Look to enter on small bounces and manage your risk carefully.
Click here to short now 👉 $TIA
#TIA #USNovemberMichiganExpectationsIndexPrelimAt50.9
41
Log in to explore more content
Join global crypto users on Binance Square
⚡️ Get latest and useful information about crypto.
💬 Trusted by the world’s largest crypto exchange.
👍 Discover real insights from verified creators.
Email / Phone number
Trending Topics
1
#BinanceReopensWithdrawalsForMoreAssets
1.7M views
6,833 Discussing
2
#BitcoinFiveWeeklyLosses
21,568 views
524 Discussing
3
#AIChipSlumpNasdaq
11,349 views
305 Discussing
4
#NvidiaInvestigatesAfterHuang’sAffairApology
9,122 views
160 Discussing
5
#EthereumSpotETFsPost$365MWeeklyOutflow
172 views
14 Discussing
6
#TradFiForBeginners
246,619 views
2,211 Discussing
7
#SouthKoreaDraftLawTargets15To20%ShareholderCap
173,910 views
909 Discussing
8
#KeplrAdvisesSocialLoginUsersToTransferAssets
81,578 views
632 Discussing
9
#TetherPlans€28.8MForJuventusCapitalIncrease
58,201 views
465 Discussing
10
#JobsReportRaisesHikeOdds
1M views
4,637 Discussing