
#nasdaqendssessionup2%
nasdaqendssessionup2%
50,292 views
393 Discussing
Hot
Latest

·
--
Bullish
Verified
#nasdaqendssessionup2%
🚨 RISK-ON IS BACK 🚨
Nasdaq just slammed the door on bear-case talk, closing the week up nearly 2% as tech and cyclicals dragged the broader market higher. Treasury yields dipped, the Fed's hawkish tone got brushed off, and traders rotated straight back into growth. This is the kind of tape that crypto traders live for.
History doesn't repeat, but it rhymes — when Nasdaq rips, BTC and majors tend to catch the same bid within 24-48h as risk appetite spills over. Watch for ETF flows to flip positive again if this momentum holds into next week.
Are we about to see a correlated breakout, or is this a dead-cat bounce before the next leg down? 👀
Drop your take below. Bulls vs bears, let's hear it. 🔥📈
#crypto #bitcoin #NASDAQ #RiskOn
$NVDAB
$BTC $ETH
#nasdaqendssessionup2%
🚨 RISK-ON IS BACK 🚨
Nasdaq just slammed the door on bear-case talk, closing the week up nearly 2% as tech and cyclicals dragged the broader market higher. Treasury yields dipped, the Fed's hawkish tone got brushed off, and traders rotated straight back into growth. This is the kind of tape that crypto traders live for.
History doesn't repeat, but it rhymes — when Nasdaq rips, BTC and majors tend to catch the same bid within 24-48h as risk appetite spills over. Watch for ETF flows to flip positive again if this momentum holds into next week.
Are we about to see a correlated breakout, or is this a dead-cat bounce before the next leg down? 👀
Drop your take below. Bulls vs bears, let's hear it. 🔥📈
#crypto #bitcoin #NASDAQ #RiskOn
$NVDAB
$BTC $ETH
🚨 RISK-ON IS BACK 🚨
Nasdaq just slammed the door on bear-case talk, closing the week up nearly 2% as tech and cyclicals dragged the broader market higher. Treasury yields dipped, the Fed's hawkish tone got brushed off, and traders rotated straight back into growth. This is the kind of tape that crypto traders live for.
History doesn't repeat, but it rhymes — when Nasdaq rips, BTC and majors tend to catch the same bid within 24-48h as risk appetite spills over. Watch for ETF flows to flip positive again if this momentum holds into next week.
Are we about to see a correlated breakout, or is this a dead-cat bounce before the next leg down? 👀
Drop your take below. Bulls vs bears, let's hear it. 🔥📈
#crypto #bitcoin #NASDAQ #RiskOn
$NVDAB
$BTC $ETH
2.5k

·
--
Bullish
Verified
#nasdaqendssessionup2%
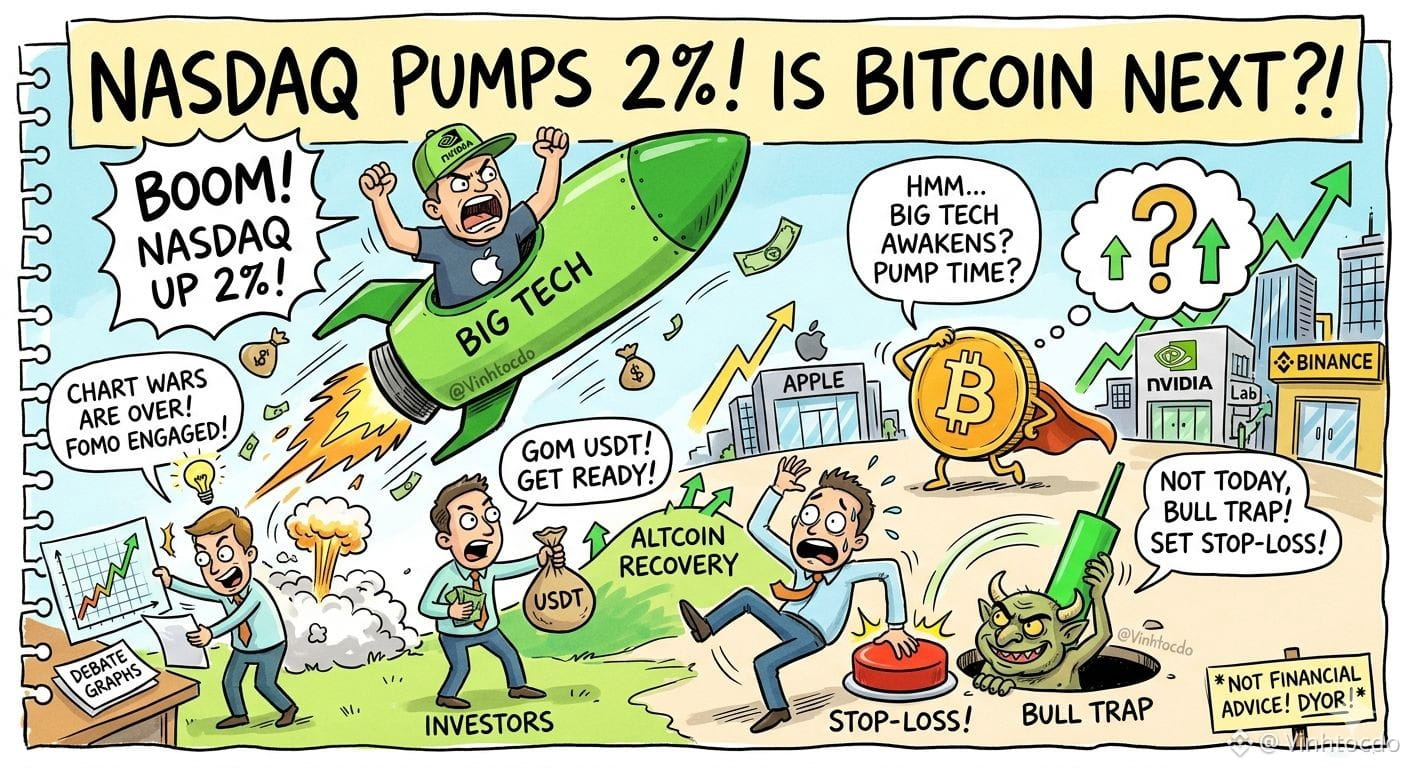
🚀 US stocks are "green as ever", Nasdaq skyrocketed by 2%!
When the big players like Nvidia and Apple are roaring, crypto wallets start feeling unusually warm. Is this divine correlation about to trigger a "pump" for Bitcoin?
🤔 What should investors do right now?
1️⃣ Stop arguing with the charts, switch to a controlled "fomo" mode.
2️⃣ Scoop up USDT and get ready to place orders to ride the wave from top Altcoins.
3️⃣ Don’t get too carried away, remember to set your stop-loss to avoid getting caught in a price trap!
⚠️ This is not financial advice! Sign up for Binance, enter code VINHTOCDO to accelerate towards the shore together, folks! 🚀
#NASDAQ #USstock #NVIDIA #VINHTOCDO $NVDAB $SPCXB $MUB
{spot}(MUBUSDT)
{spot}(SPCXBUSDT)
{spot}(NVDABUSDT)
#nasdaqendssessionup2%
🚀 US stocks are "green as ever", Nasdaq skyrocketed by 2%!
When the big players like Nvidia and Apple are roaring, crypto wallets start feeling unusually warm. Is this divine correlation about to trigger a "pump" for Bitcoin?
🤔 What should investors do right now?
1️⃣ Stop arguing with the charts, switch to a controlled "fomo" mode.
2️⃣ Scoop up USDT and get ready to place orders to ride the wave from top Altcoins.
3️⃣ Don’t get too carried away, remember to set your stop-loss to avoid getting caught in a price trap!
⚠️ This is not financial advice! Sign up for Binance, enter code VINHTOCDO to accelerate towards the shore together, folks! 🚀
#NASDAQ #USstock #NVIDIA #VINHTOCDO $NVDAB $SPCXB $MUB
🚀 US stocks are "green as ever", Nasdaq skyrocketed by 2%!
When the big players like Nvidia and Apple are roaring, crypto wallets start feeling unusually warm. Is this divine correlation about to trigger a "pump" for Bitcoin?
🤔 What should investors do right now?
1️⃣ Stop arguing with the charts, switch to a controlled "fomo" mode.
2️⃣ Scoop up USDT and get ready to place orders to ride the wave from top Altcoins.
3️⃣ Don’t get too carried away, remember to set your stop-loss to avoid getting caught in a price trap!
⚠️ This is not financial advice! Sign up for Binance, enter code VINHTOCDO to accelerate towards the shore together, folks! 🚀
#NASDAQ #USstock #NVIDIA #VINHTOCDO $NVDAB $SPCXB $MUB
4
8
5.7k

·
--
📈 #NasdaqEndsSessionUp2%
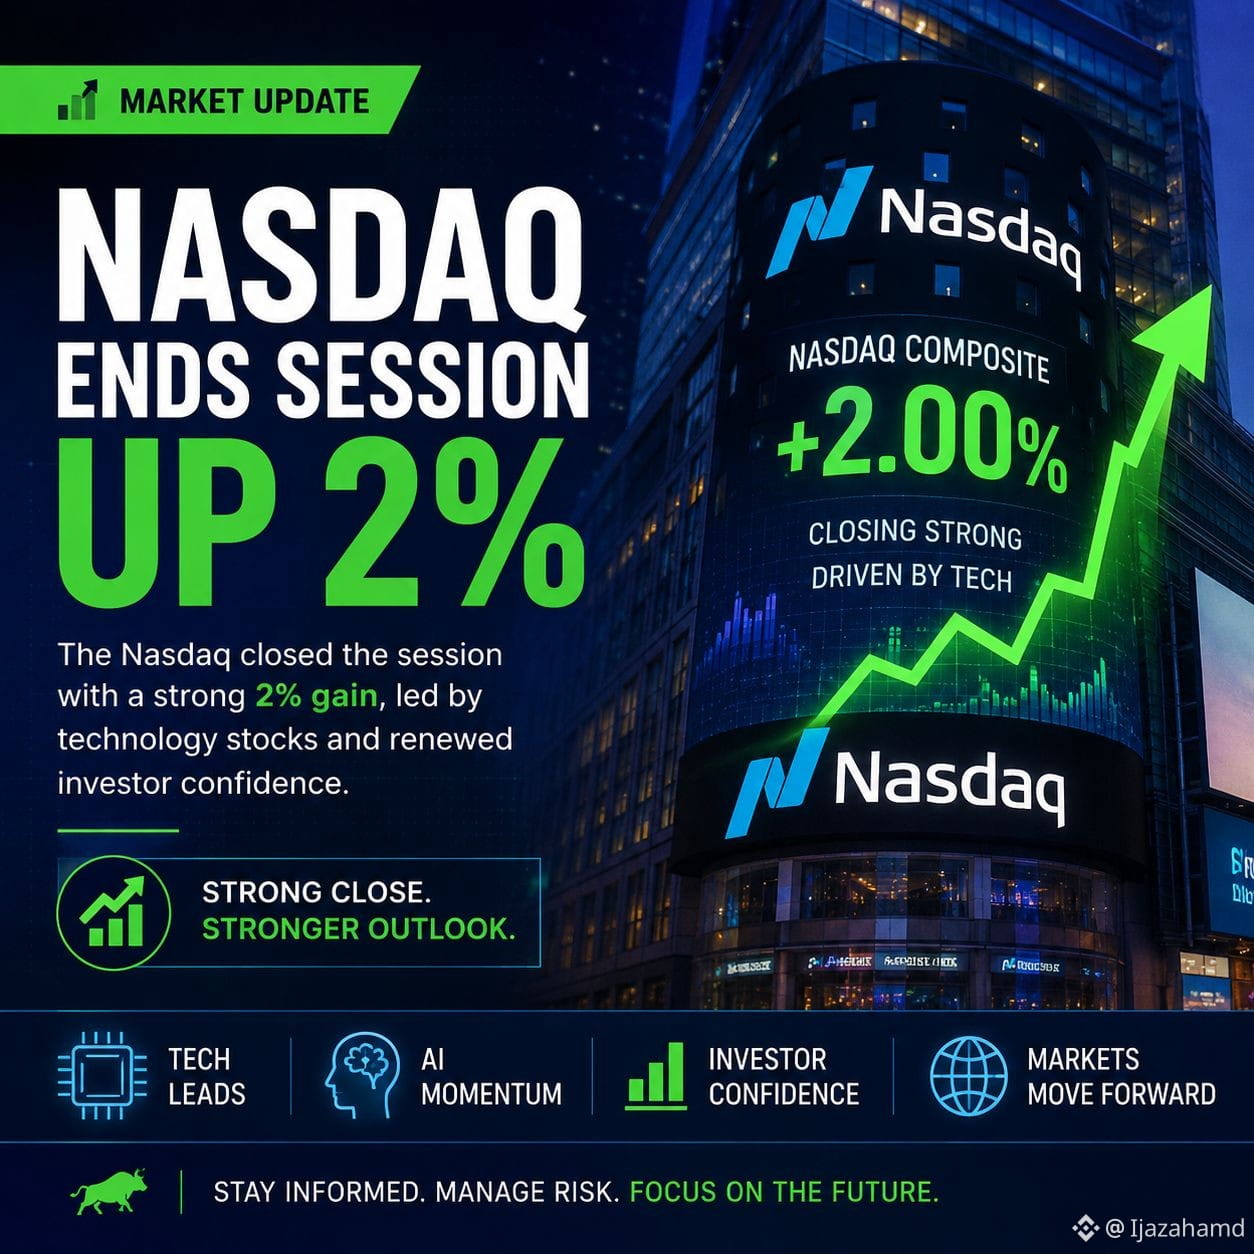
The Nasdaq closed the session up 2%, signaling strong bullish momentum in the tech sector. Growth stocks and AI-related companies led the rally as investors reacted positively to market sentiment and easing rate concerns.
🔹 Nasdaq: +2.0%
🔹 Tech stocks outperformed
🔹 AI and semiconductor sectors showed strength
🔹 Risk appetite returned to the market
Market Take: If momentum continues, Bitcoin and major altcoins could benefit from improved investor confidence across risk assets.
#Nasdaq #StockMarket #TechStocks #Aİ #Bitcoin #CryptoMarket #Investing #BinanceSquare 🚀📊
{spot}(BTCUSDT)
📈 #NasdaqEndsSessionUp2%
The Nasdaq closed the session up 2%, signaling strong bullish momentum in the tech sector. Growth stocks and AI-related companies led the rally as investors reacted positively to market sentiment and easing rate concerns.
🔹 Nasdaq: +2.0%
🔹 Tech stocks outperformed
🔹 AI and semiconductor sectors showed strength
🔹 Risk appetite returned to the market
Market Take: If momentum continues, Bitcoin and major altcoins could benefit from improved investor confidence across risk assets.
#Nasdaq #StockMarket #TechStocks #Aİ #Bitcoin #CryptoMarket #Investing #BinanceSquare 🚀📊
The Nasdaq closed the session up 2%, signaling strong bullish momentum in the tech sector. Growth stocks and AI-related companies led the rally as investors reacted positively to market sentiment and easing rate concerns.
🔹 Nasdaq: +2.0%
🔹 Tech stocks outperformed
🔹 AI and semiconductor sectors showed strength
🔹 Risk appetite returned to the market
Market Take: If momentum continues, Bitcoin and major altcoins could benefit from improved investor confidence across risk assets.
#Nasdaq #StockMarket #TechStocks #Aİ #Bitcoin #CryptoMarket #Investing #BinanceSquare 🚀📊
81

#NasdaqEndsSessionUp2% #NasdaqEndsSessionUp2%
The Nasdaq ended the session up around 2%, reflecting a broad risk-on move in US equities, with growth and tech stocks leading the rebound.
Key Drivers Behind the Rally
• Rate expectations easing: Markets continued to price in a more flexible Federal Reserve outlook, supporting long-duration tech valuations.
• Big Tech strength: Mega-cap names (AI, cloud, semiconductors) drove most of the index gains, with renewed momentum in high-growth sectors.
• Improved risk sentiment: Cooling geopolitical concerns and stabilizing bond yields encouraged equity inflows.
• Short-covering bounce: After recent volatility, traders repositioned into oversold tech names.
Sector Behavior
• AI / semiconductor stocks: Outperformed, extending recent momentum trends
• Software & cloud: Strong bid as growth sentiment returned
• Defensive sectors: Lagged slightly as capital rotated into risk assets
Market Context
The move fits into a broader pattern where the Nasdaq Composite has become highly sensitive to interest-rate expectations and liquidity conditions. Even small shifts in yields or Fed commentary tend to produce amplified index moves due to heavy tech weighting.
Short Take
A 2% Nasdaq gain signals a strong risk-on session driven mainly by tech leadership, easing rate pressure, and short-term positioning shifts rather than a single fundamental catalyst.
#NasdaqEndsSessionUp2% #NasdaqEndsSessionUp2%
The Nasdaq ended the session up around 2%, reflecting a broad risk-on move in US equities, with growth and tech stocks leading the rebound.
Key Drivers Behind the Rally
• Rate expectations easing: Markets continued to price in a more flexible Federal Reserve outlook, supporting long-duration tech valuations.
• Big Tech strength: Mega-cap names (AI, cloud, semiconductors) drove most of the index gains, with renewed momentum in high-growth sectors.
• Improved risk sentiment: Cooling geopolitical concerns and stabilizing bond yields encouraged equity inflows.
• Short-covering bounce: After recent volatility, traders repositioned into oversold tech names.
Sector Behavior
• AI / semiconductor stocks: Outperformed, extending recent momentum trends
• Software & cloud: Strong bid as growth sentiment returned
• Defensive sectors: Lagged slightly as capital rotated into risk assets
Market Context
The move fits into a broader pattern where the Nasdaq Composite has become highly sensitive to interest-rate expectations and liquidity conditions. Even small shifts in yields or Fed commentary tend to produce amplified index moves due to heavy tech weighting.
Short Take
A 2% Nasdaq gain signals a strong risk-on session driven mainly by tech leadership, easing rate pressure, and short-term positioning shifts rather than a single fundamental catalyst.
The Nasdaq ended the session up around 2%, reflecting a broad risk-on move in US equities, with growth and tech stocks leading the rebound.
Key Drivers Behind the Rally
• Rate expectations easing: Markets continued to price in a more flexible Federal Reserve outlook, supporting long-duration tech valuations.
• Big Tech strength: Mega-cap names (AI, cloud, semiconductors) drove most of the index gains, with renewed momentum in high-growth sectors.
• Improved risk sentiment: Cooling geopolitical concerns and stabilizing bond yields encouraged equity inflows.
• Short-covering bounce: After recent volatility, traders repositioned into oversold tech names.
Sector Behavior
• AI / semiconductor stocks: Outperformed, extending recent momentum trends
• Software & cloud: Strong bid as growth sentiment returned
• Defensive sectors: Lagged slightly as capital rotated into risk assets
Market Context
The move fits into a broader pattern where the Nasdaq Composite has become highly sensitive to interest-rate expectations and liquidity conditions. Even small shifts in yields or Fed commentary tend to produce amplified index moves due to heavy tech weighting.
Short Take
A 2% Nasdaq gain signals a strong risk-on session driven mainly by tech leadership, easing rate pressure, and short-term positioning shifts rather than a single fundamental catalyst.
57

#NasdaqEndsSessionUp2% NasdaqEndsSessionUp2% reads like a market-news hashtag meaning the Nasdaq finished the trading day up 2%. In plain English: the Nasdaq index closed higher, gaining about 2% by the end of that session. (nasdaq.com)
If you want, I can also help with any of these:
explain which Nasdaq index people usually mean
break down why a 2% move matters
turn it into a simple news headline
relate it to BTC/crypto market sentiment$BTC
{spot}(BTCUSDT)
$BNB
{spot}(BNBUSDT)
$NVDAB
{spot}(NVDABUSDT)
@Binance_News @Binance_Announcement @Binance_Square_Official
#NasdaqEndsSessionUp2% NasdaqEndsSessionUp2% reads like a market-news hashtag meaning the Nasdaq finished the trading day up 2%. In plain English: the Nasdaq index closed higher, gaining about 2% by the end of that session. (nasdaq.com)
If you want, I can also help with any of these:
explain which Nasdaq index people usually mean
break down why a 2% move matters
turn it into a simple news headline
relate it to BTC/crypto market sentiment$BTC
$BNB
$NVDAB
@Binance News @Binance Announcement @Binance_Square_Official
If you want, I can also help with any of these:
explain which Nasdaq index people usually mean
break down why a 2% move matters
turn it into a simple news headline
relate it to BTC/crypto market sentiment$BTC
$BNB
$NVDAB
@Binance News @Binance Announcement @Binance_Square_Official
1
113

·
--
#NasdaqEndsSessionUp2%
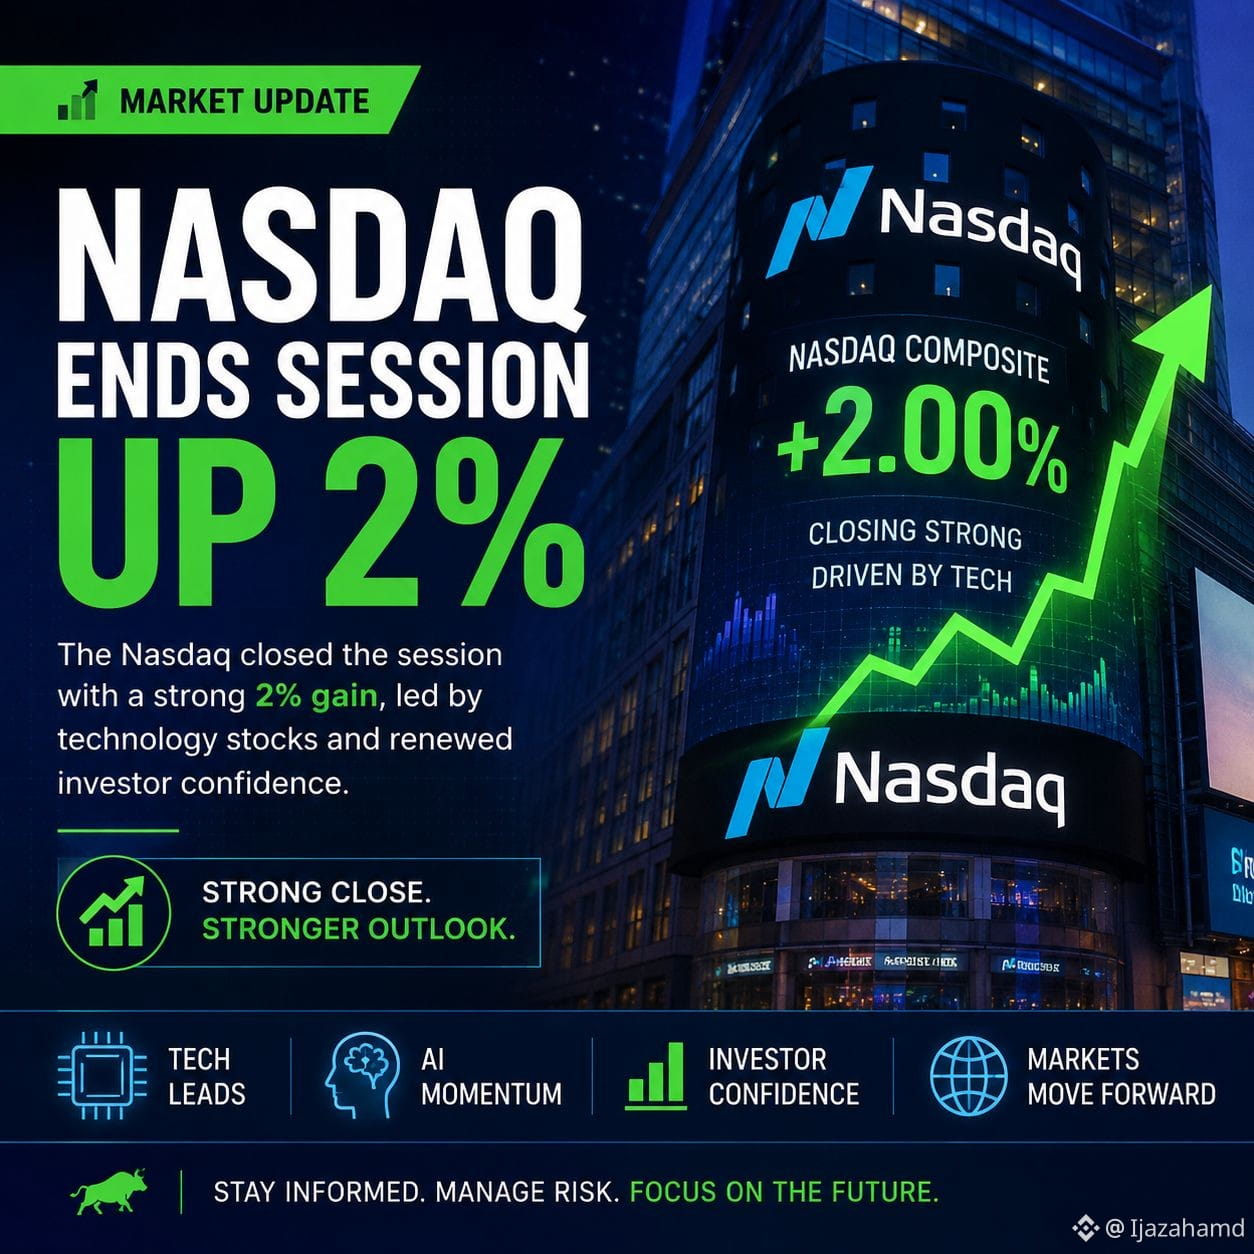
The market shows renewed strength as the Nasdaq closes the session with a solid 2% gain. Investors are watching closely as technology stocks drive momentum and confidence returns to the market.
A strong session highlights the importance of innovation, AI, and growth-focused companies in shaping the future of global markets. 🚀
Stay informed, manage risk, and keep an eye on the next market moves.
#StockMarket #Nasdaq #Investing #Technology #AI #CryptoMarket
#NasdaqEndsSessionUp2%
The market shows renewed strength as the Nasdaq closes the session with a solid 2% gain. Investors are watching closely as technology stocks drive momentum and confidence returns to the market.
A strong session highlights the importance of innovation, AI, and growth-focused companies in shaping the future of global markets. 🚀
Stay informed, manage risk, and keep an eye on the next market moves.
#StockMarket #Nasdaq #Investing #Technology #AI #CryptoMarket
The market shows renewed strength as the Nasdaq closes the session with a solid 2% gain. Investors are watching closely as technology stocks drive momentum and confidence returns to the market.
A strong session highlights the importance of innovation, AI, and growth-focused companies in shaping the future of global markets. 🚀
Stay informed, manage risk, and keep an eye on the next market moves.
#StockMarket #Nasdaq #Investing #Technology #AI #CryptoMarket
119

·
--
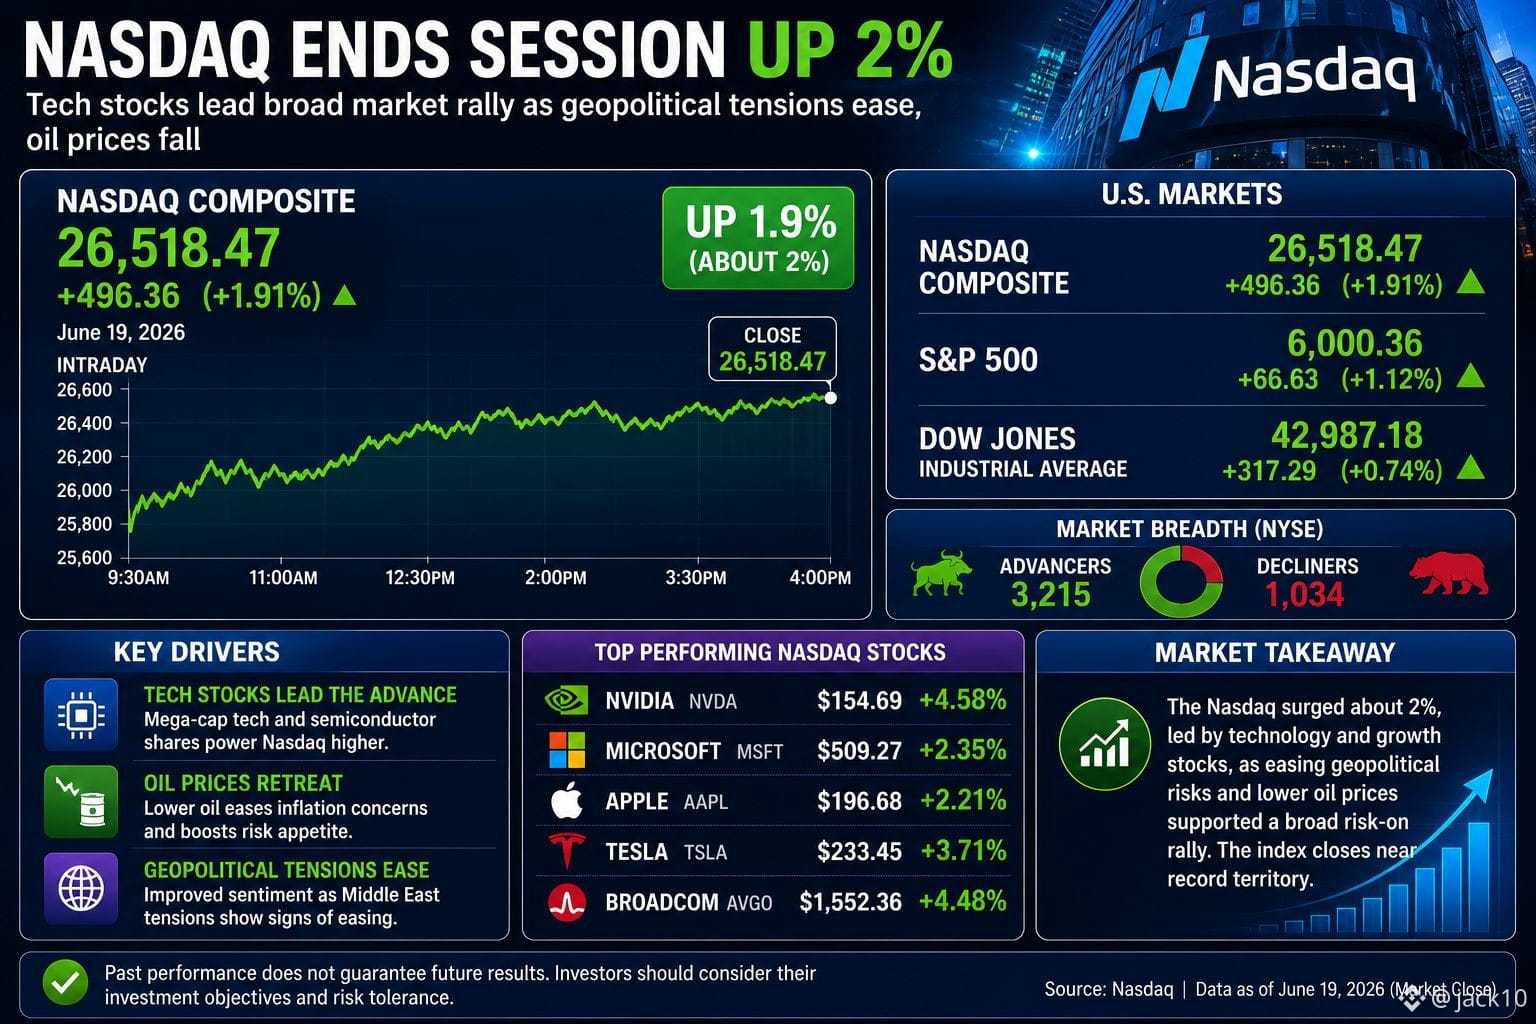
U.S. stock markets rose strongly on Thursday, led by technology and semiconductor stocks. The Nasdaq gained nearly 2%, while the S&P 500 also moved higher and the Dow had a small gain. Chip stocks were the biggest winners, especially Intel, which jumped sharply after news of a deal involving Apple and U.S.-based chip production. This helped boost confidence in the tech sector and lifted overall market sentiment.
A major reason for the market recovery was easing inflation concerns after the U.S. and Iran signed a peace agreement. Oil prices fell as the conflict risks reduced, which helped calm fears about rising inflation. Lower energy costs are important because they can reduce pressure on prices across the economy. At the same time, shipping routes like the Strait of Hormuz started reopening, improving global trade flow. However, investors still expect the Federal Reserve could raise interest rates later this year.
The Federal Reserve remains a key focus for markets. Even though inflation fears have eased, traders still believe rate hikes are possible. Market pricing suggests about a 50% chance of a small rate increase later this year. The Fed has also signaled a stronger focus on controlling inflation, which makes investors cautious. This mixed outlook is creating both optimism and uncertainty at the same time.
Not all stocks performed well. Some companies in software and services dropped after weak earnings updates, including Accenture and other tech-related firms. Retail and consumer stocks were mixed, while travel-related companies gained due to lower fuel prices. Even with strong gains in tech, some sectors struggled, showing a divided market. Trading volume was also high because of options and futures expiration, which added extra volatility.
The market is reacting to two big forces: improving global conditions from lower oil prices and ongoing uncertainty about interest rates. Tech and chip stocks are leading gains. #NasdaqEndsSessionUp2% #NASDAQ
U.S. stock markets rose strongly on Thursday, led by technology and semiconductor stocks. The Nasdaq gained nearly 2%, while the S&P 500 also moved higher and the Dow had a small gain. Chip stocks were the biggest winners, especially Intel, which jumped sharply after news of a deal involving Apple and U.S.-based chip production. This helped boost confidence in the tech sector and lifted overall market sentiment.
A major reason for the market recovery was easing inflation concerns after the U.S. and Iran signed a peace agreement. Oil prices fell as the conflict risks reduced, which helped calm fears about rising inflation. Lower energy costs are important because they can reduce pressure on prices across the economy. At the same time, shipping routes like the Strait of Hormuz started reopening, improving global trade flow. However, investors still expect the Federal Reserve could raise interest rates later this year.
The Federal Reserve remains a key focus for markets. Even though inflation fears have eased, traders still believe rate hikes are possible. Market pricing suggests about a 50% chance of a small rate increase later this year. The Fed has also signaled a stronger focus on controlling inflation, which makes investors cautious. This mixed outlook is creating both optimism and uncertainty at the same time.
Not all stocks performed well. Some companies in software and services dropped after weak earnings updates, including Accenture and other tech-related firms. Retail and consumer stocks were mixed, while travel-related companies gained due to lower fuel prices. Even with strong gains in tech, some sectors struggled, showing a divided market. Trading volume was also high because of options and futures expiration, which added extra volatility.
The market is reacting to two big forces: improving global conditions from lower oil prices and ongoing uncertainty about interest rates. Tech and chip stocks are leading gains. #NasdaqEndsSessionUp2% #NASDAQ
A major reason for the market recovery was easing inflation concerns after the U.S. and Iran signed a peace agreement. Oil prices fell as the conflict risks reduced, which helped calm fears about rising inflation. Lower energy costs are important because they can reduce pressure on prices across the economy. At the same time, shipping routes like the Strait of Hormuz started reopening, improving global trade flow. However, investors still expect the Federal Reserve could raise interest rates later this year.
The Federal Reserve remains a key focus for markets. Even though inflation fears have eased, traders still believe rate hikes are possible. Market pricing suggests about a 50% chance of a small rate increase later this year. The Fed has also signaled a stronger focus on controlling inflation, which makes investors cautious. This mixed outlook is creating both optimism and uncertainty at the same time.
Not all stocks performed well. Some companies in software and services dropped after weak earnings updates, including Accenture and other tech-related firms. Retail and consumer stocks were mixed, while travel-related companies gained due to lower fuel prices. Even with strong gains in tech, some sectors struggled, showing a divided market. Trading volume was also high because of options and futures expiration, which added extra volatility.
The market is reacting to two big forces: improving global conditions from lower oil prices and ongoing uncertainty about interest rates. Tech and chip stocks are leading gains. #NasdaqEndsSessionUp2% #NASDAQ
1
151
·
--
#nasdaqendssessionup2% 📈 Nasdaq Ends Session Up 2%
The Nasdaq Composite closed the trading session up 2%, driven by strong gains in technology and growth stocks as investor sentiment improved across global markets.
📊 Key Highlights
🚀 Nasdaq rises 2% at close
💻 Tech stocks lead the rally
💰 Strong risk-on sentiment returns
🏦 Investors react to macro and rate expectations
📈 Broad participation across mega-cap names
❗ Why It Matters
The Nasdaq is heavily weighted toward technology and growth companies, making it highly sensitive to interest rate expectations and liquidity conditions. A strong 2% gain suggests:
Improved investor confidence
Rising appetite for risk assets
Expectations of stable or easing financial conditions
📈 Market Impact
💵 Growth stocks outperform value stocks
🚀 AI and semiconductor sectors likely lead gains
📊 Volatility may remain elevated
🌍 Global markets often follow U.S. tech momentum
🚨 Social Media Post
🚨 Nasdaq Ends Session Up 2%!
The Nasdaq Composite closed 2% higher, powered by strong gains in technology stocks and renewed risk appetite.
📈 Nasdaq +2%
💻 Tech leads rally
💰 Strong investor sentiment
🚀 Growth stocks outperform
The move highlights renewed confidence in the tech sector and broader equity markets.
#Nasdaq #Stocks #TechStocks #WallStreet #Markets #Investing #Finance #Trading 📈💻🚀💰
#nasdaqendssessionup2% 📈 Nasdaq Ends Session Up 2%
The Nasdaq Composite closed the trading session up 2%, driven by strong gains in technology and growth stocks as investor sentiment improved across global markets.
📊 Key Highlights
🚀 Nasdaq rises 2% at close
💻 Tech stocks lead the rally
💰 Strong risk-on sentiment returns
🏦 Investors react to macro and rate expectations
📈 Broad participation across mega-cap names
❗ Why It Matters
The Nasdaq is heavily weighted toward technology and growth companies, making it highly sensitive to interest rate expectations and liquidity conditions. A strong 2% gain suggests:
Improved investor confidence
Rising appetite for risk assets
Expectations of stable or easing financial conditions
📈 Market Impact
💵 Growth stocks outperform value stocks
🚀 AI and semiconductor sectors likely lead gains
📊 Volatility may remain elevated
🌍 Global markets often follow U.S. tech momentum
🚨 Social Media Post
🚨 Nasdaq Ends Session Up 2%!
The Nasdaq Composite closed 2% higher, powered by strong gains in technology stocks and renewed risk appetite.
📈 Nasdaq +2%
💻 Tech leads rally
💰 Strong investor sentiment
🚀 Growth stocks outperform
The move highlights renewed confidence in the tech sector and broader equity markets.
#Nasdaq #Stocks #TechStocks #WallStreet #Markets #Investing #Finance #Trading 📈💻🚀💰
The Nasdaq Composite closed the trading session up 2%, driven by strong gains in technology and growth stocks as investor sentiment improved across global markets.
📊 Key Highlights
🚀 Nasdaq rises 2% at close
💻 Tech stocks lead the rally
💰 Strong risk-on sentiment returns
🏦 Investors react to macro and rate expectations
📈 Broad participation across mega-cap names
❗ Why It Matters
The Nasdaq is heavily weighted toward technology and growth companies, making it highly sensitive to interest rate expectations and liquidity conditions. A strong 2% gain suggests:
Improved investor confidence
Rising appetite for risk assets
Expectations of stable or easing financial conditions
📈 Market Impact
💵 Growth stocks outperform value stocks
🚀 AI and semiconductor sectors likely lead gains
📊 Volatility may remain elevated
🌍 Global markets often follow U.S. tech momentum
🚨 Social Media Post
🚨 Nasdaq Ends Session Up 2%!
The Nasdaq Composite closed 2% higher, powered by strong gains in technology stocks and renewed risk appetite.
📈 Nasdaq +2%
💻 Tech leads rally
💰 Strong investor sentiment
🚀 Growth stocks outperform
The move highlights renewed confidence in the tech sector and broader equity markets.
#Nasdaq #Stocks #TechStocks #WallStreet #Markets #Investing #Finance #Trading 📈💻🚀💰
8
96

·
--
#nasdaqendssessionup2% #BTC
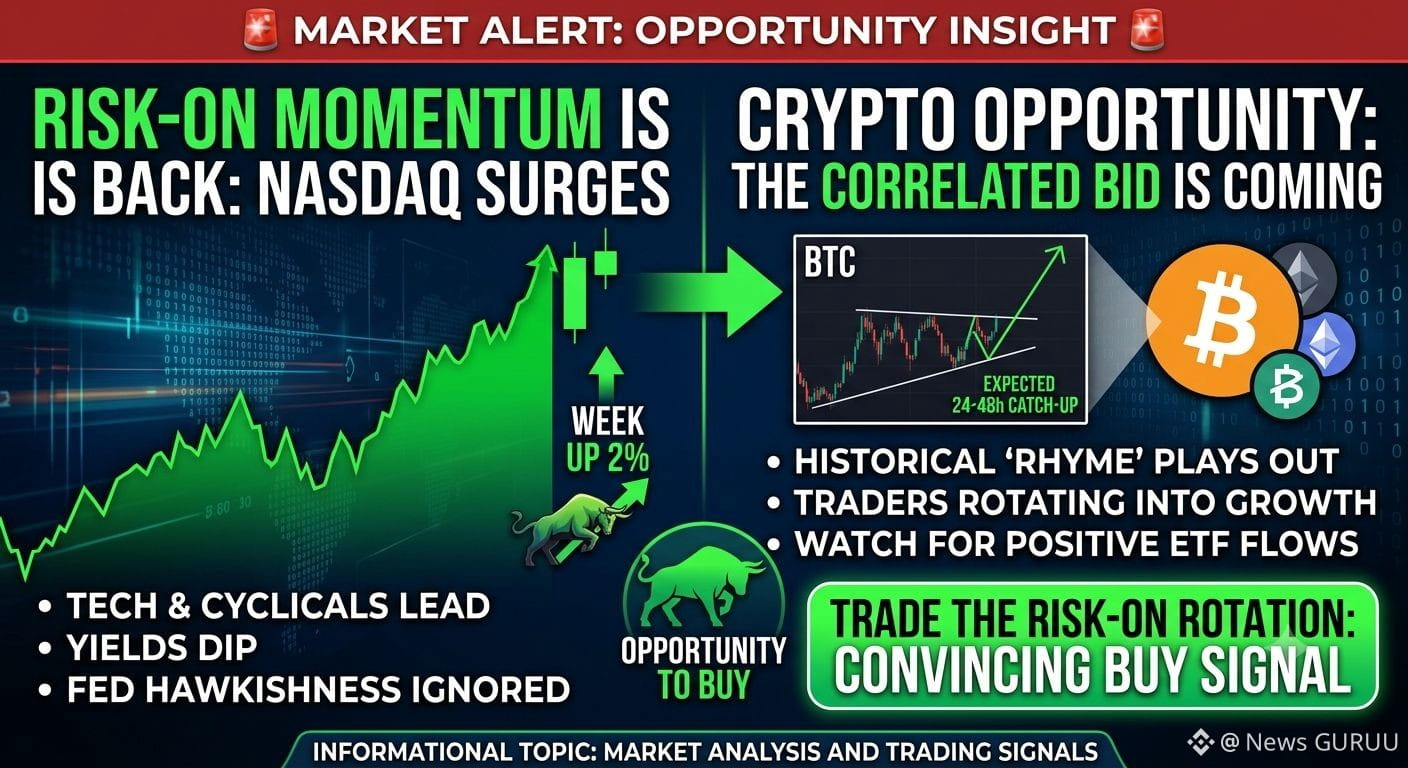
🚀 RISK-ON MOMENTUM IS BUILDING
✅ Nasdaq closed the week up nearly 2%
✅ Tech stocks leading the rally
✅ Treasury yields cooling down
✅ Markets ignoring hawkish Fed signals
If momentum continues, BTC and major altcoins could benefit as capital rotates back into risk assets.
📈 Trading View: BUY strength on confirmed breakouts or accumulate on dips while bullish sentiment remains intact.
📊 Watch ETF flows and crypto volume closely — they could be the next catalyst for a larger move." CLICK ON THE BELOW YELLOW COIN TAG TO GO TO DESIRED TRADING PAGE TO GET BENEFIT TRADE OK." $BTC $ETH $NVDAB
{spot}(NVDABUSDT)
{spot}(ETHUSDT)
{spot}(BTCUSDT)
#nasdaqendssessionup2% #BTC
🚀 RISK-ON MOMENTUM IS BUILDING
✅ Nasdaq closed the week up nearly 2%
✅ Tech stocks leading the rally
✅ Treasury yields cooling down
✅ Markets ignoring hawkish Fed signals
If momentum continues, BTC and major altcoins could benefit as capital rotates back into risk assets.
📈 Trading View: BUY strength on confirmed breakouts or accumulate on dips while bullish sentiment remains intact.
📊 Watch ETF flows and crypto volume closely — they could be the next catalyst for a larger move." CLICK ON THE BELOW YELLOW COIN TAG TO GO TO DESIRED TRADING PAGE TO GET BENEFIT TRADE OK." $BTC $ETH $NVDAB
🚀 RISK-ON MOMENTUM IS BUILDING
✅ Nasdaq closed the week up nearly 2%
✅ Tech stocks leading the rally
✅ Treasury yields cooling down
✅ Markets ignoring hawkish Fed signals
If momentum continues, BTC and major altcoins could benefit as capital rotates back into risk assets.
📈 Trading View: BUY strength on confirmed breakouts or accumulate on dips while bullish sentiment remains intact.
📊 Watch ETF flows and crypto volume closely — they could be the next catalyst for a larger move." CLICK ON THE BELOW YELLOW COIN TAG TO GO TO DESIRED TRADING PAGE TO GET BENEFIT TRADE OK." $BTC $ETH $NVDAB
1
69

·
--
#nasdaqendssessionup2%
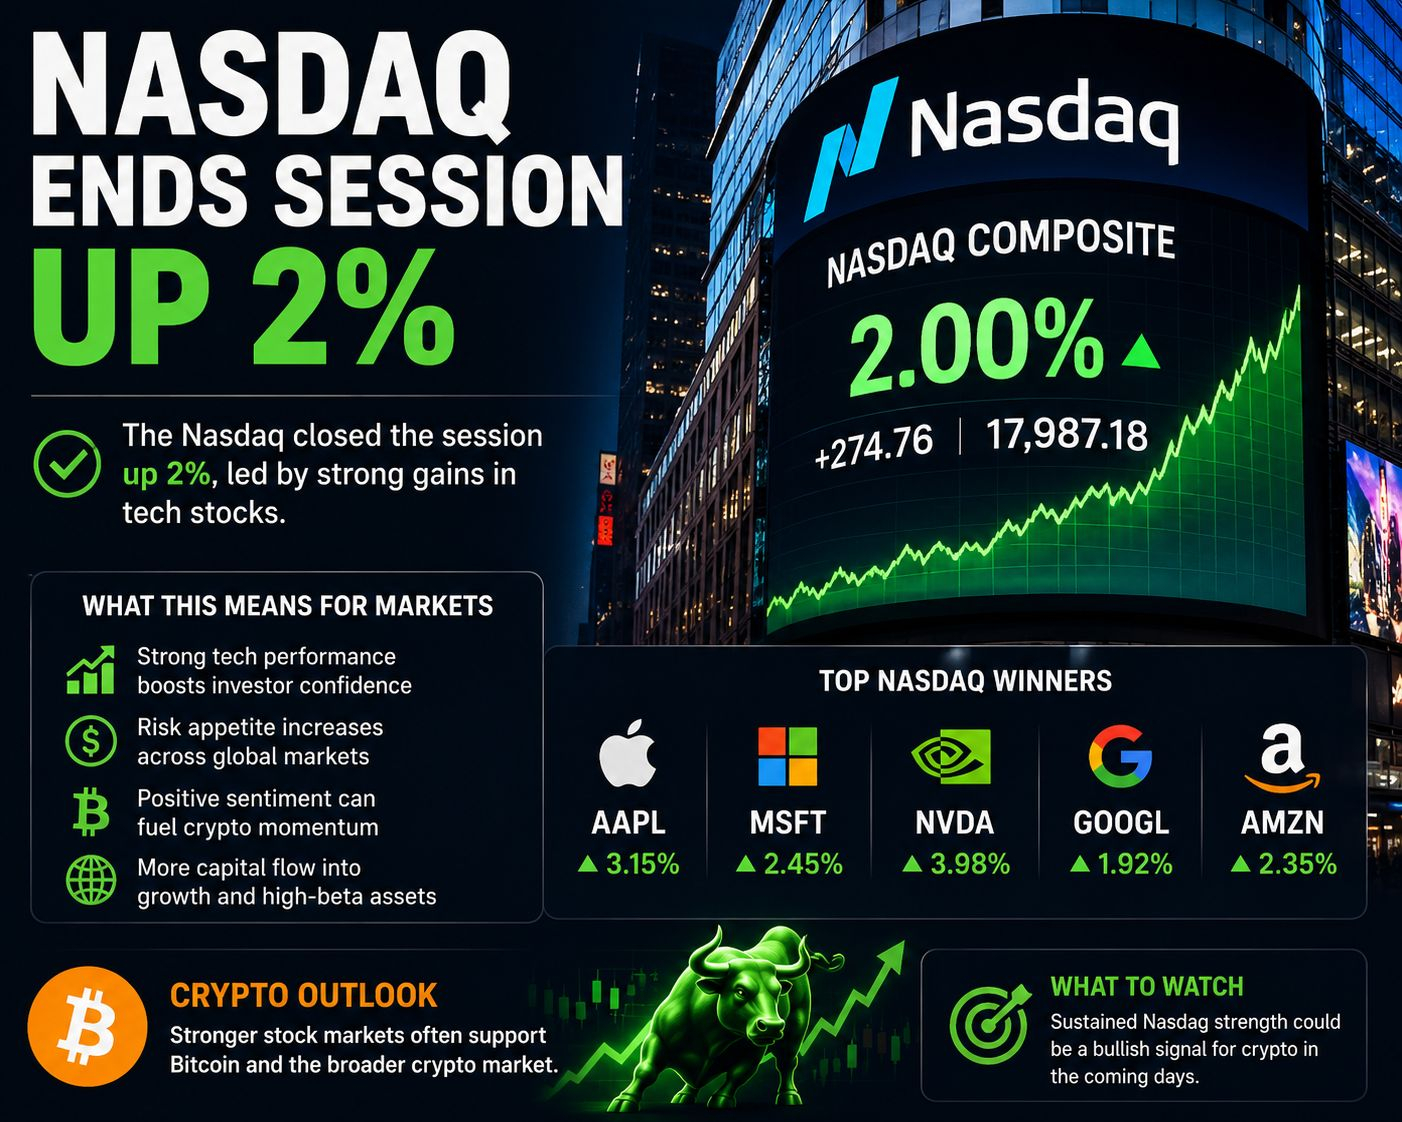
📈 NASDAQ Composite jumps 2%… Is risk appetite returning to the markets? 👀🚀
The tech-heavy Nasdaq closed the session strongly in the green, signaling renewed confidence from investors after recent market uncertainty.
Why does this matter for crypto? 👇
🔹 Tech stocks and crypto often move with similar risk sentiment
🔹 Strong equity markets can push fresh capital into digital assets
🔹 Investor confidence usually boosts momentum across altcoins
🔹 Positive macro sentiment often benefits Bitcoin and the broader crypto market 📊
When traditional markets recover, crypto traders pay attention.
Historically, a strong Nasdaq rally has often acted as an early signal that risk-on assets are attracting buyers again. 🔥
If momentum continues…
Could this be the setup for the next crypto breakout? 🤔
Watch closely. Markets may be shifting fast. ⚡
#NASDAQ #BTC #Altcoins
{alpha}(560x1b379a79c91a540b2bcd612b4d713f31de1b80cc)
{future}(NATGASUSDT)
{alpha}(CT_7840xa99b8952d4f7d947ea77fe0ecdcc9e5fc0bcab2841d6e2a5aa00c3044e5544b5::navx::NAVX)
#nasdaqendssessionup2%
📈 NASDAQ Composite jumps 2%… Is risk appetite returning to the markets? 👀🚀
The tech-heavy Nasdaq closed the session strongly in the green, signaling renewed confidence from investors after recent market uncertainty.
Why does this matter for crypto? 👇
🔹 Tech stocks and crypto often move with similar risk sentiment
🔹 Strong equity markets can push fresh capital into digital assets
🔹 Investor confidence usually boosts momentum across altcoins
🔹 Positive macro sentiment often benefits Bitcoin and the broader crypto market 📊
When traditional markets recover, crypto traders pay attention.
Historically, a strong Nasdaq rally has often acted as an early signal that risk-on assets are attracting buyers again. 🔥
If momentum continues…
Could this be the setup for the next crypto breakout? 🤔
Watch closely. Markets may be shifting fast. ⚡
#NASDAQ #BTC #Altcoins
📈 NASDAQ Composite jumps 2%… Is risk appetite returning to the markets? 👀🚀
The tech-heavy Nasdaq closed the session strongly in the green, signaling renewed confidence from investors after recent market uncertainty.
Why does this matter for crypto? 👇
🔹 Tech stocks and crypto often move with similar risk sentiment
🔹 Strong equity markets can push fresh capital into digital assets
🔹 Investor confidence usually boosts momentum across altcoins
🔹 Positive macro sentiment often benefits Bitcoin and the broader crypto market 📊
When traditional markets recover, crypto traders pay attention.
Historically, a strong Nasdaq rally has often acted as an early signal that risk-on assets are attracting buyers again. 🔥
If momentum continues…
Could this be the setup for the next crypto breakout? 🤔
Watch closely. Markets may be shifting fast. ⚡
#NASDAQ #BTC #Altcoins
109

The Nasdaq ended the day up nearly 2%, with tech and chip stocks leading the rally. Improving market sentiment, lower oil prices, and easing geopolitical concerns helped boost investor confidence. 📈🚀
#NasdaqEndsSessionUp2%
The Nasdaq ended the day up nearly 2%, with tech and chip stocks leading the rally. Improving market sentiment, lower oil prices, and easing geopolitical concerns helped boost investor confidence. 📈🚀
#NasdaqEndsSessionUp2%
#NasdaqEndsSessionUp2%
167

·
--
#nasdaqendssessionup2%
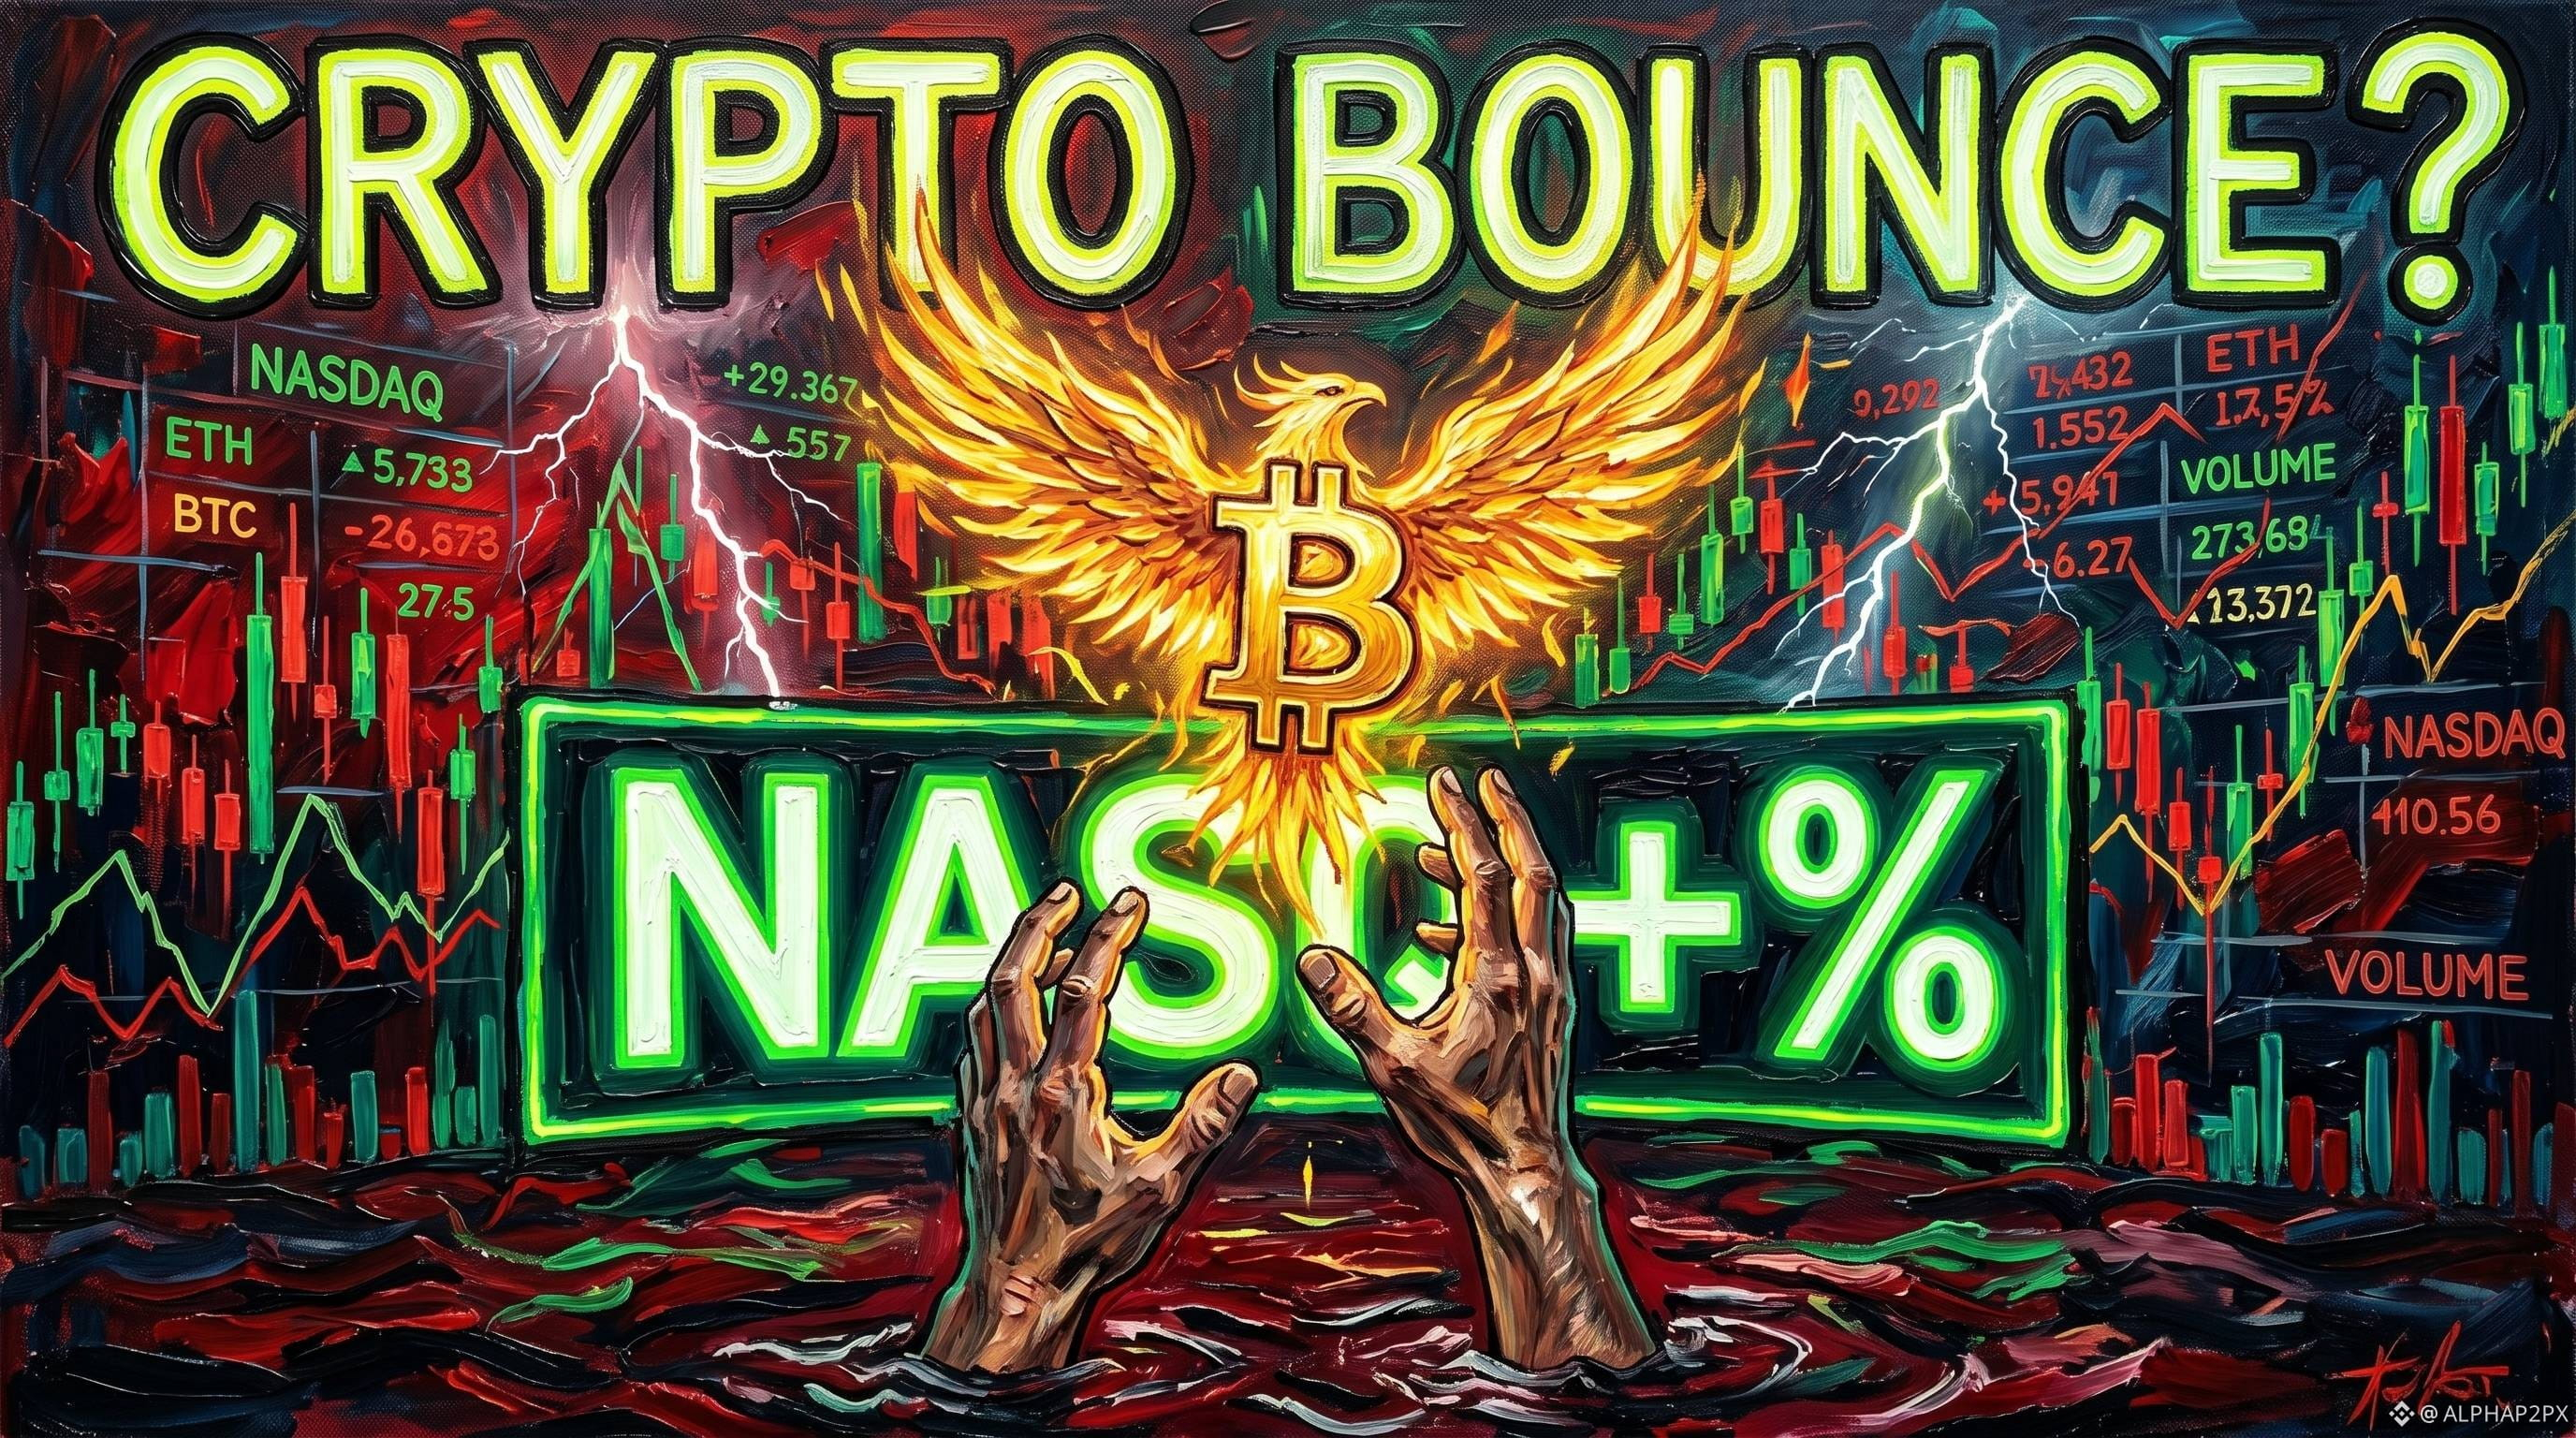
🚨 Market Alert: NASDAQ Closes +2% — Crypto Bounce Next?
US Tech markets just locked in a massive 2% pump to end the session! Historically, when TradFi macro markets show this kind of strength, liquidity starts flowing back into risk-on assets like crypto.
What to watch:
Risk-On Sentiment: The green equities market is boosting investor confidence globally.
BTC Correlation: If NASDAQ holds this momentum, expect Bitcoin and high-beta altcoins to trigger a solid bounce.
💡 Quick Tip: Bullish sentiment is back, but avoid blind entries. Wait for BTC to confirm key support levels first.
Do you think crypto will follow this NASDAQ rally, or is this a weekend fakeout? Share your setups below! 👇
#nasdaqendssessionup2% #Bitcoin #CryptoTrading #MarketAnalysis
{spot}(BTCUSDT)
#nasdaqendssessionup2%
🚨 Market Alert: NASDAQ Closes +2% — Crypto Bounce Next?
US Tech markets just locked in a massive 2% pump to end the session! Historically, when TradFi macro markets show this kind of strength, liquidity starts flowing back into risk-on assets like crypto.
What to watch:
Risk-On Sentiment: The green equities market is boosting investor confidence globally.
BTC Correlation: If NASDAQ holds this momentum, expect Bitcoin and high-beta altcoins to trigger a solid bounce.
💡 Quick Tip: Bullish sentiment is back, but avoid blind entries. Wait for BTC to confirm key support levels first.
Do you think crypto will follow this NASDAQ rally, or is this a weekend fakeout? Share your setups below! 👇
#nasdaqendssessionup2% #Bitcoin #CryptoTrading #MarketAnalysis
🚨 Market Alert: NASDAQ Closes +2% — Crypto Bounce Next?
US Tech markets just locked in a massive 2% pump to end the session! Historically, when TradFi macro markets show this kind of strength, liquidity starts flowing back into risk-on assets like crypto.
What to watch:
Risk-On Sentiment: The green equities market is boosting investor confidence globally.
BTC Correlation: If NASDAQ holds this momentum, expect Bitcoin and high-beta altcoins to trigger a solid bounce.
💡 Quick Tip: Bullish sentiment is back, but avoid blind entries. Wait for BTC to confirm key support levels first.
Do you think crypto will follow this NASDAQ rally, or is this a weekend fakeout? Share your setups below! 👇
#nasdaqendssessionup2% #Bitcoin #CryptoTrading #MarketAnalysis
166

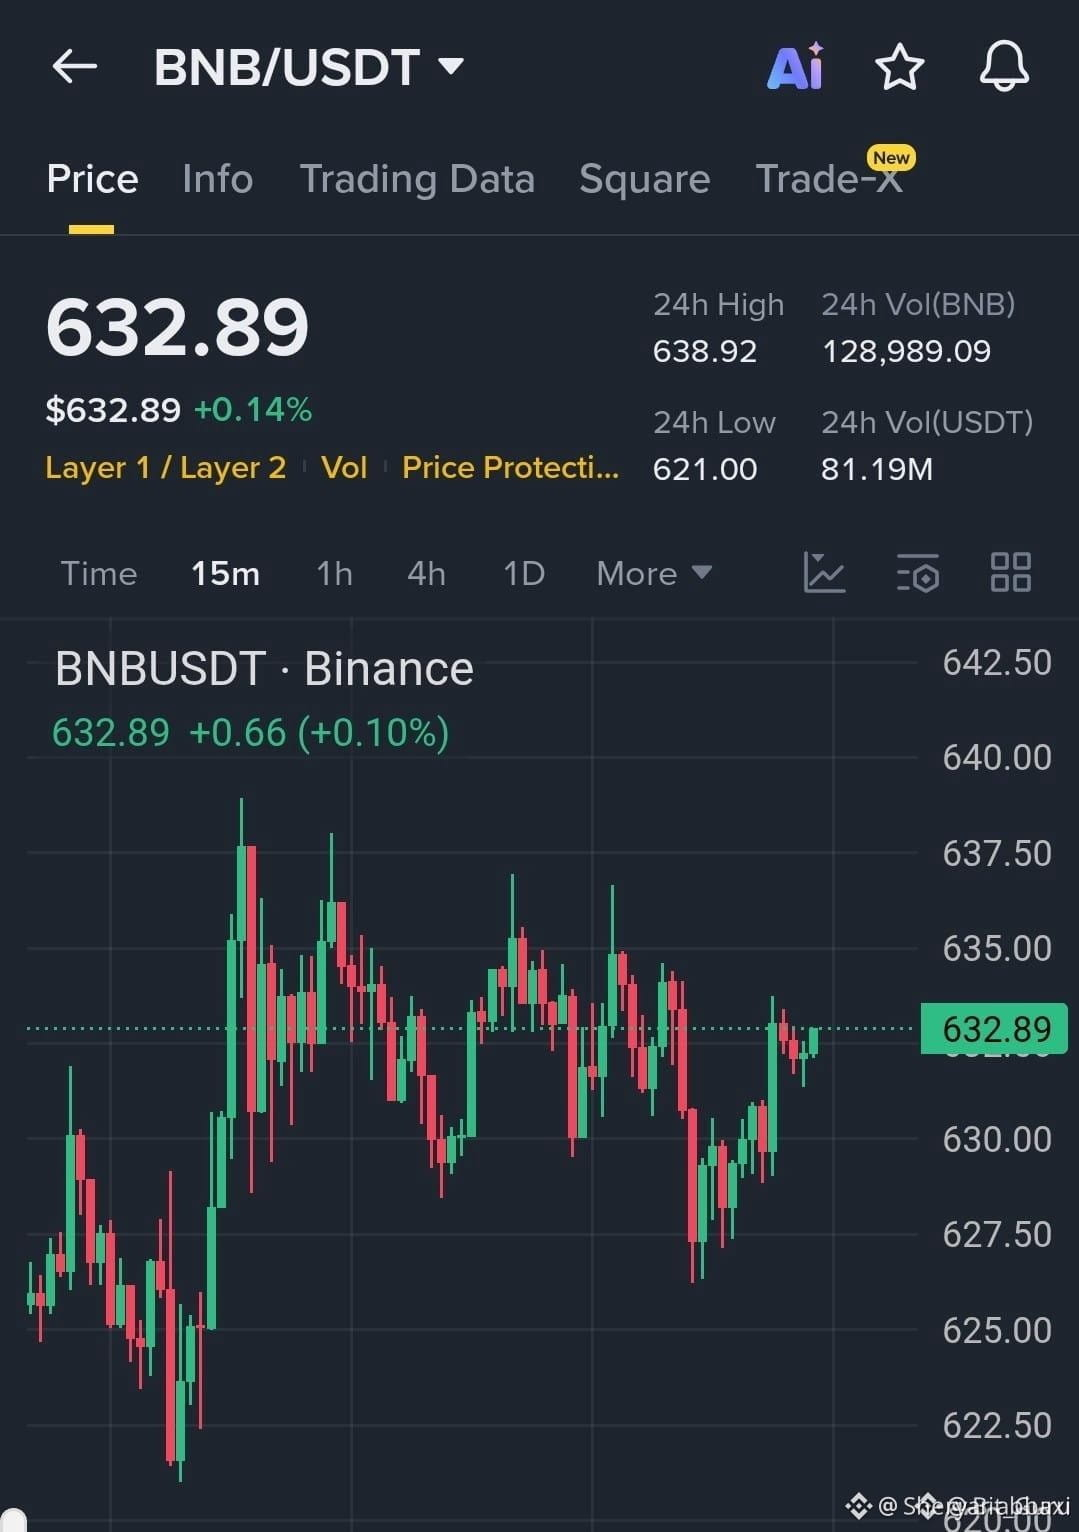
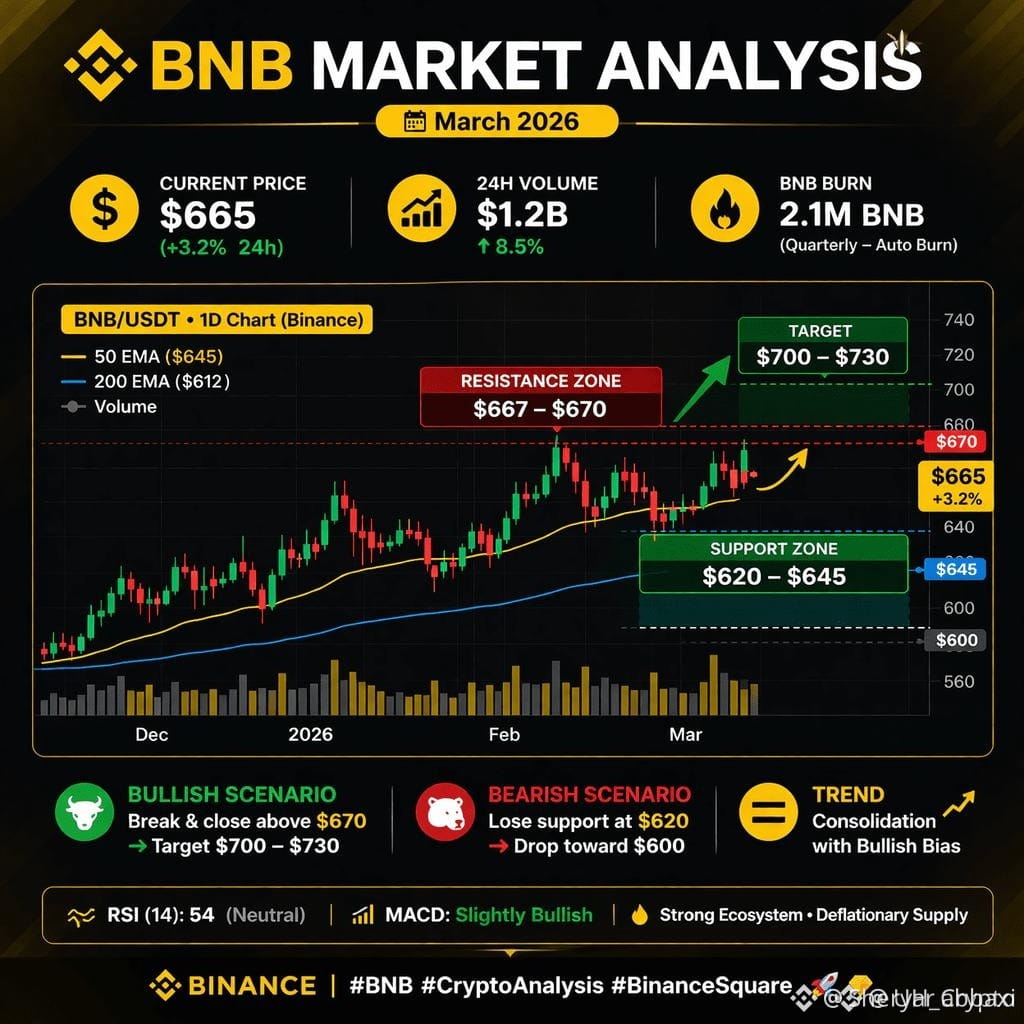
$BNB is showing resilience despite overall crypto market fear. After a recent market-wide correction, BNB has been holding key support zones while traders watch for a breakout toward the $780–$820 resistance area. Growing interest in potential BNB ETF products and Binance's expanding financial services could support long-term demand. However, regulatory uncertainty in some regions remains a key risk factor.#ADNOCResumesOilLoadingInsideHormuz #NasdaqEndsSessionUp2%
$BNB is showing resilience despite overall crypto market fear. After a recent market-wide correction, BNB has been holding key support zones while traders watch for a breakout toward the $780–$820 resistance area. Growing interest in potential BNB ETF products and Binance's expanding financial services could support long-term demand. However, regulatory uncertainty in some regions remains a key risk factor.#ADNOCResumesOilLoadingInsideHormuz #NasdaqEndsSessionUp2%
35

·
--
Can $BNB is again to cross the 600 USDT so I think YES but a very low chances or maybe this happen in 1 month.
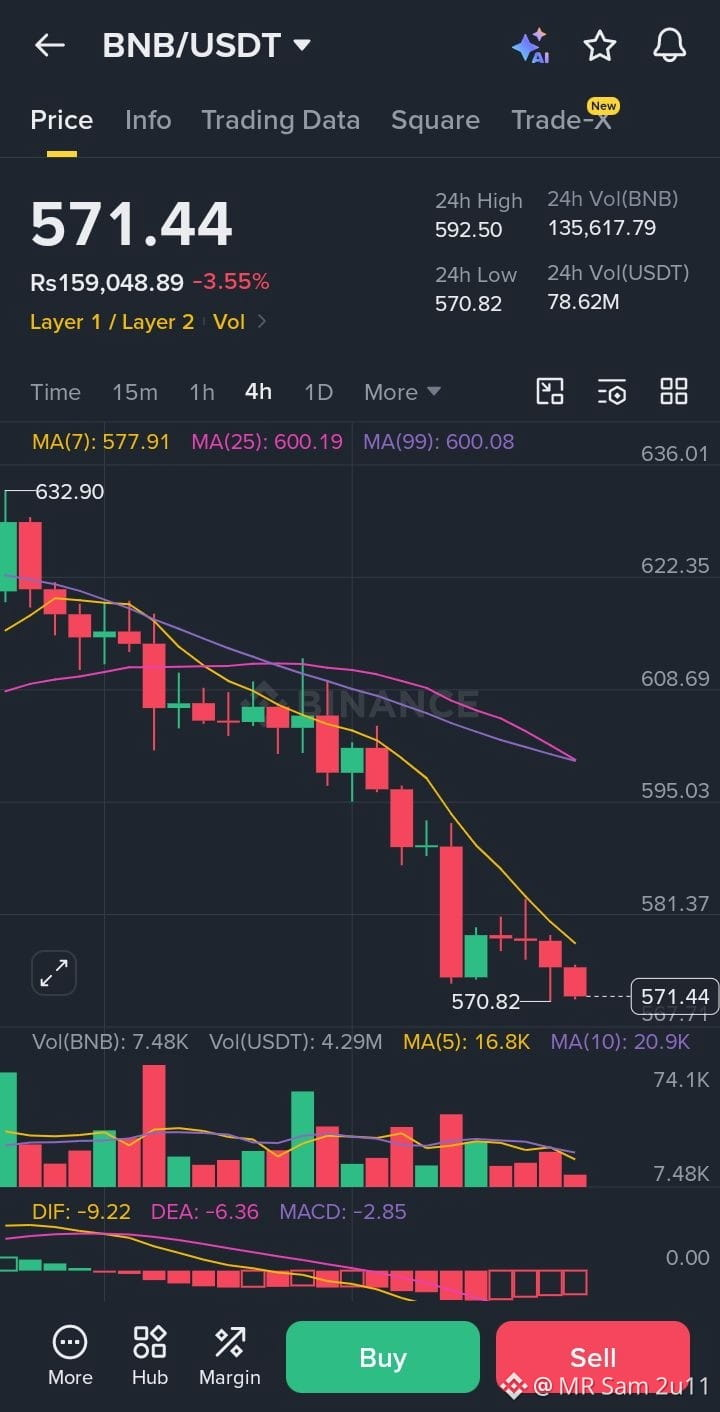
BNB is trading at $571.77 right now, down about 3.3% over the last 24 hours.
Today’s range so far: $570.82 low to $592.50 high.
Short analysis:
Bias: mildly bearish short term
Price is sitting very close to the daily low, which usually shows sellers still have control.
The drop from the 24h open ($591.38) to current price ($571.77) suggests weak momentum in the current session.
Key resistance: around $592.50
Key support: around $570.80
If BNB holds above support, it could attempt a bounce.
If support breaks cleanly, downside pressure may continue.
If you want, I can also give you:
a scalp setup,
a swing trade view, or
support/resistance levels with entry ideas.
#YenNears40YearLow #NasdaqEndsSessionUp2% #BOJGovernorUedaDischarged
$BNB
{spot}(BNBUSDT)
$BNB
Can $BNB is again to cross the 600 USDT so I think YES but a very low chances or maybe this happen in 1 month.
BNB is trading at $571.77 right now, down about 3.3% over the last 24 hours.
Today’s range so far: $570.82 low to $592.50 high.
Short analysis:
Bias: mildly bearish short term
Price is sitting very close to the daily low, which usually shows sellers still have control.
The drop from the 24h open ($591.38) to current price ($571.77) suggests weak momentum in the current session.
Key resistance: around $592.50
Key support: around $570.80
If BNB holds above support, it could attempt a bounce.
If support breaks cleanly, downside pressure may continue.
If you want, I can also give you:
a scalp setup,
a swing trade view, or
support/resistance levels with entry ideas.
#YenNears40YearLow #NasdaqEndsSessionUp2% #BOJGovernorUedaDischarged
$BNB
$BNB
BNB is trading at $571.77 right now, down about 3.3% over the last 24 hours.
Today’s range so far: $570.82 low to $592.50 high.
Short analysis:
Bias: mildly bearish short term
Price is sitting very close to the daily low, which usually shows sellers still have control.
The drop from the 24h open ($591.38) to current price ($571.77) suggests weak momentum in the current session.
Key resistance: around $592.50
Key support: around $570.80
If BNB holds above support, it could attempt a bounce.
If support breaks cleanly, downside pressure may continue.
If you want, I can also give you:
a scalp setup,
a swing trade view, or
support/resistance levels with entry ideas.
#YenNears40YearLow #NasdaqEndsSessionUp2% #BOJGovernorUedaDischarged
$BNB
$BNB
76

·
--
Bearish
$ENJ delivered another positive session with a +5.70% advance, signaling that market confidence is gradually returning. The move comes as buyers continue absorbing supply and defending higher price levels.
Current price behavior suggests accumulation rather than distribution, which is often a favorable sign for trend development. Traders should monitor whether momentum can remain consistent over the coming sessions.
The technical outlook remains positive while price holds above nearby support zones. Continued strength in the broader market could provide the catalyst needed for further upside expansion.
TG1 stands at 0.0398, offering the first key target for active traders. A decisive breakout above this level may pave the way toward TG2 at 0.0435.
If bullish momentum persists and buying volume continues to improve, TG3 at 0.0470 becomes the next major objective.
At present, ENJ is showing steady recovery characteristics and remains positioned as a potential continuation candidate in the current market environment.
#NasdaqEndsSessionUp2% #AsianStocksHitRecord #TeslaLagsSpaceXInIPOWeek
{spot}(ENJUSDT)
$ENJ delivered another positive session with a +5.70% advance, signaling that market confidence is gradually returning. The move comes as buyers continue absorbing supply and defending higher price levels.
Current price behavior suggests accumulation rather than distribution, which is often a favorable sign for trend development. Traders should monitor whether momentum can remain consistent over the coming sessions.
The technical outlook remains positive while price holds above nearby support zones. Continued strength in the broader market could provide the catalyst needed for further upside expansion.
TG1 stands at 0.0398, offering the first key target for active traders. A decisive breakout above this level may pave the way toward TG2 at 0.0435.
If bullish momentum persists and buying volume continues to improve, TG3 at 0.0470 becomes the next major objective.
At present, ENJ is showing steady recovery characteristics and remains positioned as a potential continuation candidate in the current market environment.
#NasdaqEndsSessionUp2% #AsianStocksHitRecord #TeslaLagsSpaceXInIPOWeek
Current price behavior suggests accumulation rather than distribution, which is often a favorable sign for trend development. Traders should monitor whether momentum can remain consistent over the coming sessions.
The technical outlook remains positive while price holds above nearby support zones. Continued strength in the broader market could provide the catalyst needed for further upside expansion.
TG1 stands at 0.0398, offering the first key target for active traders. A decisive breakout above this level may pave the way toward TG2 at 0.0435.
If bullish momentum persists and buying volume continues to improve, TG3 at 0.0470 becomes the next major objective.
At present, ENJ is showing steady recovery characteristics and remains positioned as a potential continuation candidate in the current market environment.
#NasdaqEndsSessionUp2% #AsianStocksHitRecord #TeslaLagsSpaceXInIPOWeek
98

·
--
Bearish
$BTC
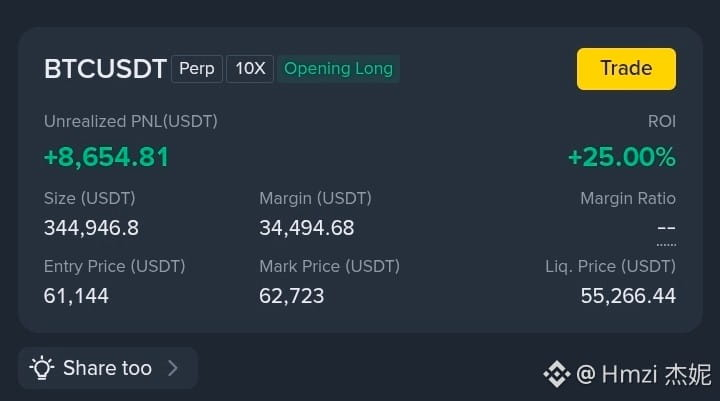
I don't know about the bottom but it was excellent entry at that time.
#YenNears40YearLow #ADNOCResumesOilLoadingInsideHormuz #NasdaqEndsSessionUp2% #AsianStocksHitRecord #BTCBelowMinerProductionCost5Months
{future}(BTCUSDT)
$BTC
I don't know about the bottom but it was excellent entry at that time.
#YenNears40YearLow #ADNOCResumesOilLoadingInsideHormuz #NasdaqEndsSessionUp2% #AsianStocksHitRecord #BTCBelowMinerProductionCost5Months
I don't know about the bottom but it was excellent entry at that time.
#YenNears40YearLow #ADNOCResumesOilLoadingInsideHormuz #NasdaqEndsSessionUp2% #AsianStocksHitRecord #BTCBelowMinerProductionCost5Months
63

·
--
Bullish
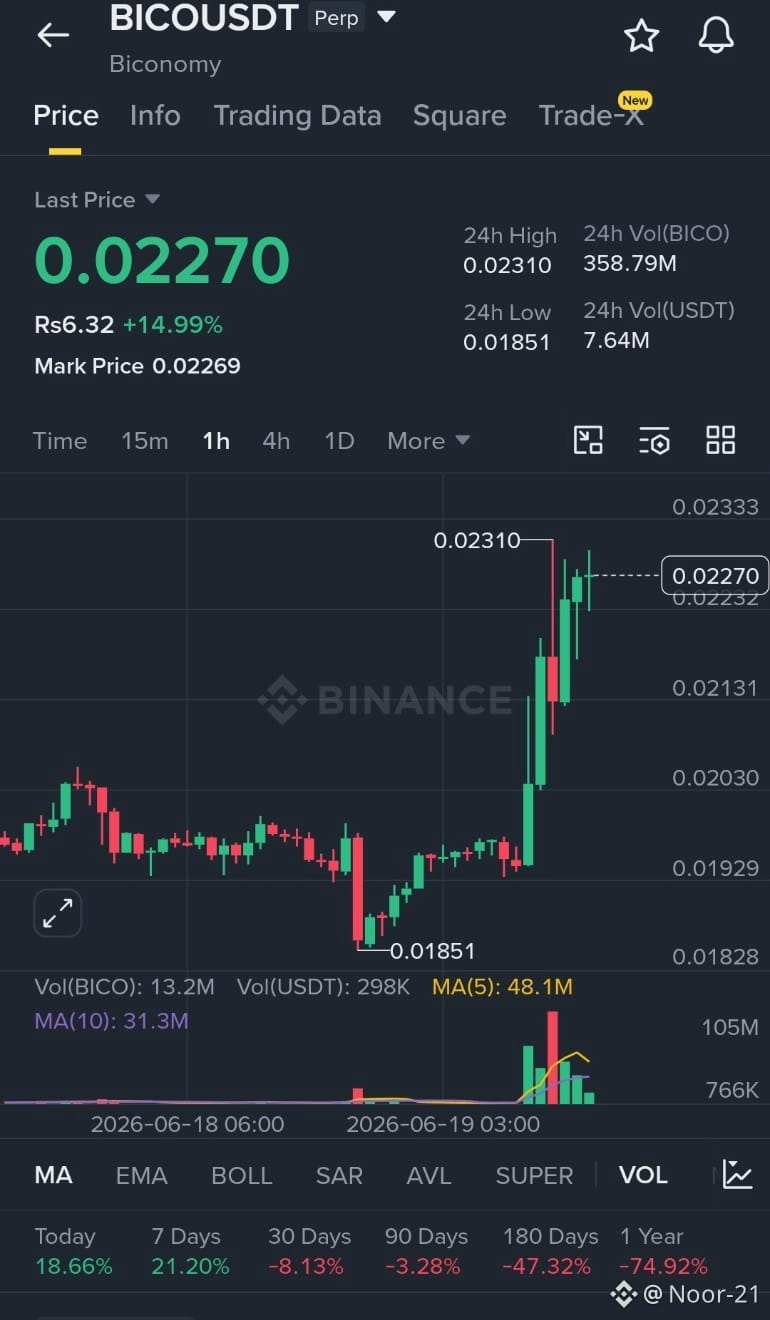
$BICO
LONG SIGNAL | VIP CONVICTION
Breakout retest confirming. Price holding above 0.0225 after rejecting 24H low — volume expanding on recovery. MA(10) flipping support.
EP: 0.0227
TP1: 0.0245
TP2: 0.0265
TP3: 0.0285
SL: 0.0212
7-day +21% momentum intact. Stop below structure.
Risk 2% per trade.
$BICO
#NasdaqEndsSessionUp2% #ADNOCResumesOilLoadingInsideHormuz
{future}(BICOUSDT)
$BICO
LONG SIGNAL | VIP CONVICTION
Breakout retest confirming. Price holding above 0.0225 after rejecting 24H low — volume expanding on recovery. MA(10) flipping support.
EP: 0.0227
TP1: 0.0245
TP2: 0.0265
TP3: 0.0285
SL: 0.0212
7-day +21% momentum intact. Stop below structure.
Risk 2% per trade.
$BICO
#NasdaqEndsSessionUp2% #ADNOCResumesOilLoadingInsideHormuz
LONG SIGNAL | VIP CONVICTION
Breakout retest confirming. Price holding above 0.0225 after rejecting 24H low — volume expanding on recovery. MA(10) flipping support.
EP: 0.0227
TP1: 0.0245
TP2: 0.0265
TP3: 0.0285
SL: 0.0212
7-day +21% momentum intact. Stop below structure.
Risk 2% per trade.
$BICO
#NasdaqEndsSessionUp2% #ADNOCResumesOilLoadingInsideHormuz
14

·
--
Bullish
Consistency isn’t about intensity; it’s about showing up when you don’t feel like it.#NasdaqEndsSessionUp2% #ADNOCResumesOilLoadingInsideHormuz #YenNears40YearLow #ECBWunschCallsForJulyHikeIfDataWeakens #US301ProbeOnGermanyDrugPricing $NVDAB
Consistency isn’t about intensity; it’s about showing up when you don’t feel like it.#NasdaqEndsSessionUp2% #ADNOCResumesOilLoadingInsideHormuz #YenNears40YearLow #ECBWunschCallsForJulyHikeIfDataWeakens #US301ProbeOnGermanyDrugPricing $NVDAB

80

·
--
Bullish
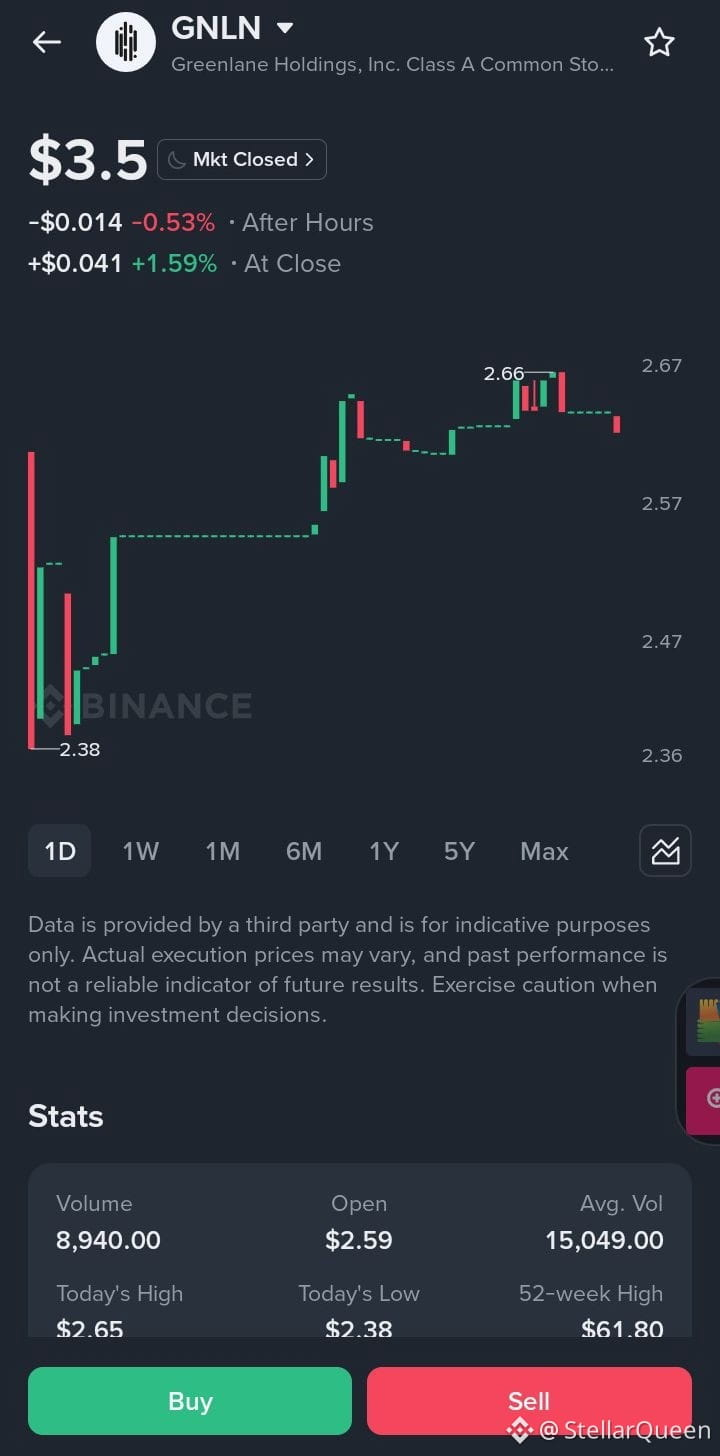
This screenshot is of GNLN (Greenlane Holdings Inc.) stock. It shows some important things:
1. Current Price
At the top of the screen, it shows $3.50.
In after-hours trading, it's down -0.53% (a bit lower).
At regular market close, it had a gain of +1.59%.
2. Today's Trading Range
Open: $2.59
Low: $2.38
High: $2.65
So the stock traded between $2.38 and $2.65 today.
3. Candlestick Chart
Green candles = buyers are strong (price went up).
Red candles = sellers are strong (price went down).
From the chart, it looks like:
The price bounced off $2.38.
Then it gradually rallied to $2.66.
At the end, there was some profit booking.
4. Volume
Today's Volume: 8,940 shares
Average Volume: 15,049 shares
Today's volume was below average, so this move doesn’t carry much conviction.
5. Most Important Point
52-week High: $61.80
Current price: ~$3.50
This stock is trading about 94% or more below its 52-week high.
What Does It Mean?
There are two possibilities:
The company has serious problems and the stock has crashed.
The market might be undervaluing the company and there’s a chance for recovery.
Just looking at the 52-week high to buy is risky. Many stocks continue to drop even after falling 90%.
Technical Levels
Support: ~$2.38
Resistance: ~$2.66–$2.70
If there’s a breakout above $2.70 with volume, the next upside could come.
If $2.38 breaks, downside risk could increase.
If you're looking at GNLN for investment, is this a value opportunity or a penny-stock trap?
#YenNears40YearLow
#ADNOCResumesOilLoadingInsideHormuz
#NasdaqEndsSessionUp2%
#AsianStocksHitRecord
#BTCBelowMinerProductionCost5Months
$NVDAB
$SPCXB
$MUB
This screenshot is of GNLN (Greenlane Holdings Inc.) stock. It shows some important things:
1. Current Price
At the top of the screen, it shows $3.50.
In after-hours trading, it's down -0.53% (a bit lower).
At regular market close, it had a gain of +1.59%.
2. Today's Trading Range
Open: $2.59
Low: $2.38
High: $2.65
So the stock traded between $2.38 and $2.65 today.
3. Candlestick Chart
Green candles = buyers are strong (price went up).
Red candles = sellers are strong (price went down).
From the chart, it looks like:
The price bounced off $2.38.
Then it gradually rallied to $2.66.
At the end, there was some profit booking.
4. Volume
Today's Volume: 8,940 shares
Average Volume: 15,049 shares
Today's volume was below average, so this move doesn’t carry much conviction.
5. Most Important Point
52-week High: $61.80
Current price: ~$3.50
This stock is trading about 94% or more below its 52-week high.
What Does It Mean?
There are two possibilities:
The company has serious problems and the stock has crashed.
The market might be undervaluing the company and there’s a chance for recovery.
Just looking at the 52-week high to buy is risky. Many stocks continue to drop even after falling 90%.
Technical Levels
Support: ~$2.38
Resistance: ~$2.66–$2.70
If there’s a breakout above $2.70 with volume, the next upside could come.
If $2.38 breaks, downside risk could increase.
If you're looking at GNLN for investment, is this a value opportunity or a penny-stock trap?
#YenNears40YearLow
#ADNOCResumesOilLoadingInsideHormuz
#NasdaqEndsSessionUp2%
#AsianStocksHitRecord
#BTCBelowMinerProductionCost5Months
$NVDAB
$SPCXB
$MUB
1. Current Price
At the top of the screen, it shows $3.50.
In after-hours trading, it's down -0.53% (a bit lower).
At regular market close, it had a gain of +1.59%.
2. Today's Trading Range
Open: $2.59
Low: $2.38
High: $2.65
So the stock traded between $2.38 and $2.65 today.
3. Candlestick Chart
Green candles = buyers are strong (price went up).
Red candles = sellers are strong (price went down).
From the chart, it looks like:
The price bounced off $2.38.
Then it gradually rallied to $2.66.
At the end, there was some profit booking.
4. Volume
Today's Volume: 8,940 shares
Average Volume: 15,049 shares
Today's volume was below average, so this move doesn’t carry much conviction.
5. Most Important Point
52-week High: $61.80
Current price: ~$3.50
This stock is trading about 94% or more below its 52-week high.
What Does It Mean?
There are two possibilities:
The company has serious problems and the stock has crashed.
The market might be undervaluing the company and there’s a chance for recovery.
Just looking at the 52-week high to buy is risky. Many stocks continue to drop even after falling 90%.
Technical Levels
Support: ~$2.38
Resistance: ~$2.66–$2.70
If there’s a breakout above $2.70 with volume, the next upside could come.
If $2.38 breaks, downside risk could increase.
If you're looking at GNLN for investment, is this a value opportunity or a penny-stock trap?
#YenNears40YearLow
#ADNOCResumesOilLoadingInsideHormuz
#NasdaqEndsSessionUp2%
#AsianStocksHitRecord
#BTCBelowMinerProductionCost5Months
$NVDAB
$SPCXB
$MUB
2
20
·
--
Bullish
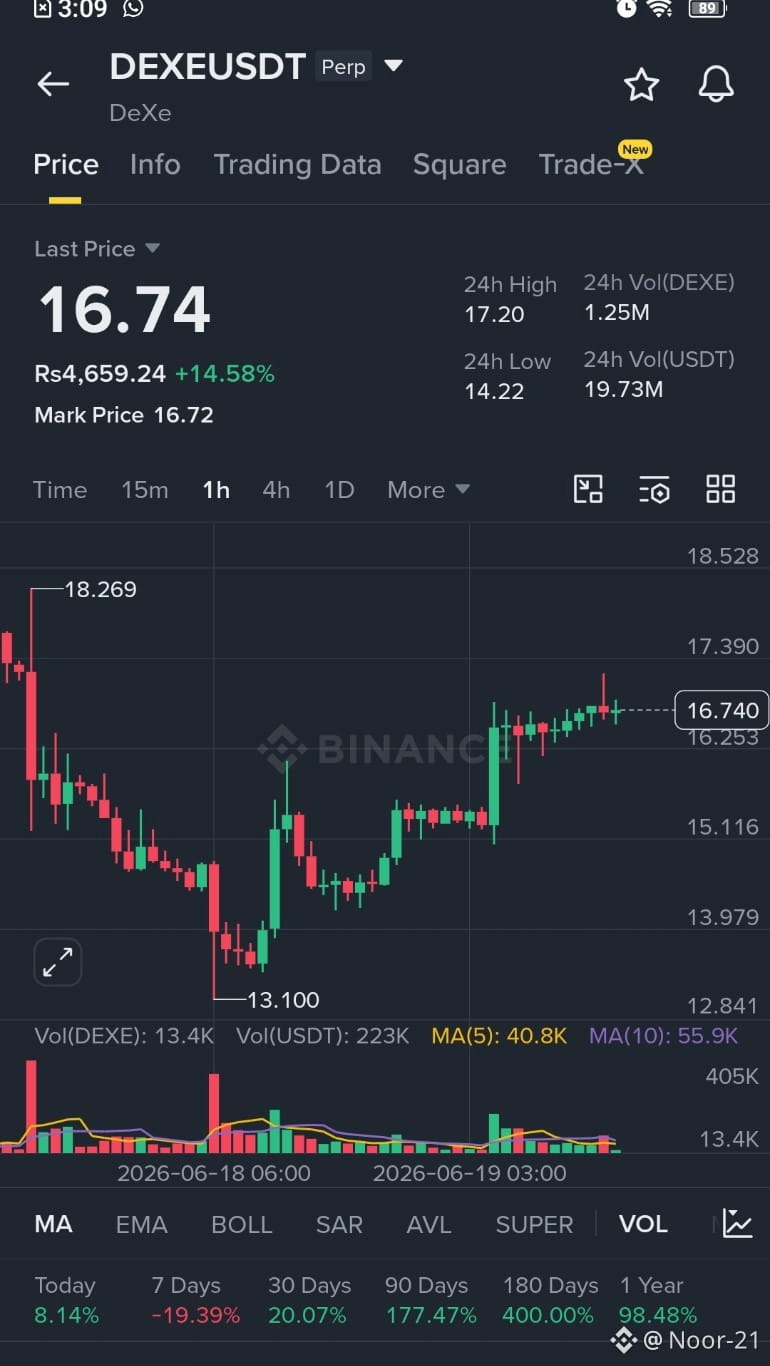
$DEXE
LONG SIGNAL | VIP CONVICTION
Breakout continuation after shallow pullback. Price holding above 16.50 with 180-day +400% trend intact — MA(10) supporting structure.
EP: 16.74
TP1: 18.00
TP2: 19.50
TP3: 21.00
SL: 15.80
Volume confirms accumulation. Break below 15.80 invalidates.
Risk 1.5% per trade.
$DEXE
#NasdaqEndsSessionUp2% #ADNOCResumesOilLoadingInsideHormuz
{future}(DEXEUSDT)
$DEXE
LONG SIGNAL | VIP CONVICTION
Breakout continuation after shallow pullback. Price holding above 16.50 with 180-day +400% trend intact — MA(10) supporting structure.
EP: 16.74
TP1: 18.00
TP2: 19.50
TP3: 21.00
SL: 15.80
Volume confirms accumulation. Break below 15.80 invalidates.
Risk 1.5% per trade.
$DEXE
#NasdaqEndsSessionUp2% #ADNOCResumesOilLoadingInsideHormuz
LONG SIGNAL | VIP CONVICTION
Breakout continuation after shallow pullback. Price holding above 16.50 with 180-day +400% trend intact — MA(10) supporting structure.
EP: 16.74
TP1: 18.00
TP2: 19.50
TP3: 21.00
SL: 15.80
Volume confirms accumulation. Break below 15.80 invalidates.
Risk 1.5% per trade.
$DEXE
#NasdaqEndsSessionUp2% #ADNOCResumesOilLoadingInsideHormuz
3
Log in to explore more content
Join global crypto users on Binance Square
⚡️ Get latest and useful information about crypto.
💬 Trusted by the world’s largest crypto exchange.
👍 Discover real insights from verified creators.
Email / Phone number
Trending Topics
1
#BOJRaisesRatesTo31YearHigh
38,864 views
844 Discussing
2
#BuffettStepsDownAsBerkshireChairman
14,369 views
364 Discussing
3
#XRPExchangeReservesHitSevenYearLow
18,481 views
372 Discussing
4
#HKCompletesFirstHKDStablecoinUseCase
50,458 views
877 Discussing
5
#VietnamPlansFirstCryptoLicensesIn2026
35,763 views
608 Discussing
6
#BTCBreaks80K
312,964 views
4,238 Discussing
7
#BitcoinMarketCapTopsTesla
54,828 views
923 Discussing
8
#SOLJumpsAbout10%
65,781 views
922 Discussing
9
#EthereumReclaims$2600
5,921 views
106 Discussing
10
#LineraShutsDownAfterFundraisingFallsShort
18,116 views
254 Discussing