

#ethup70%inq3butliquidityfalls
ethup70%inq3butliquidityfalls
Hot
Latest

🚨 Ethereum Update ETH gained 70% in Q3, but liquidity is falling. The price strength looks impressive, but declining liquidity could increase volatility and make the next move more important. 📊 Price up. Liquidity down. What do you think comes next for ETH? #ETH #Ethereum #Crypto #CryptoNews #DeFi #Blockchain #ETHUSD
#ETHUp70%InQ3ButLiquidityFalls
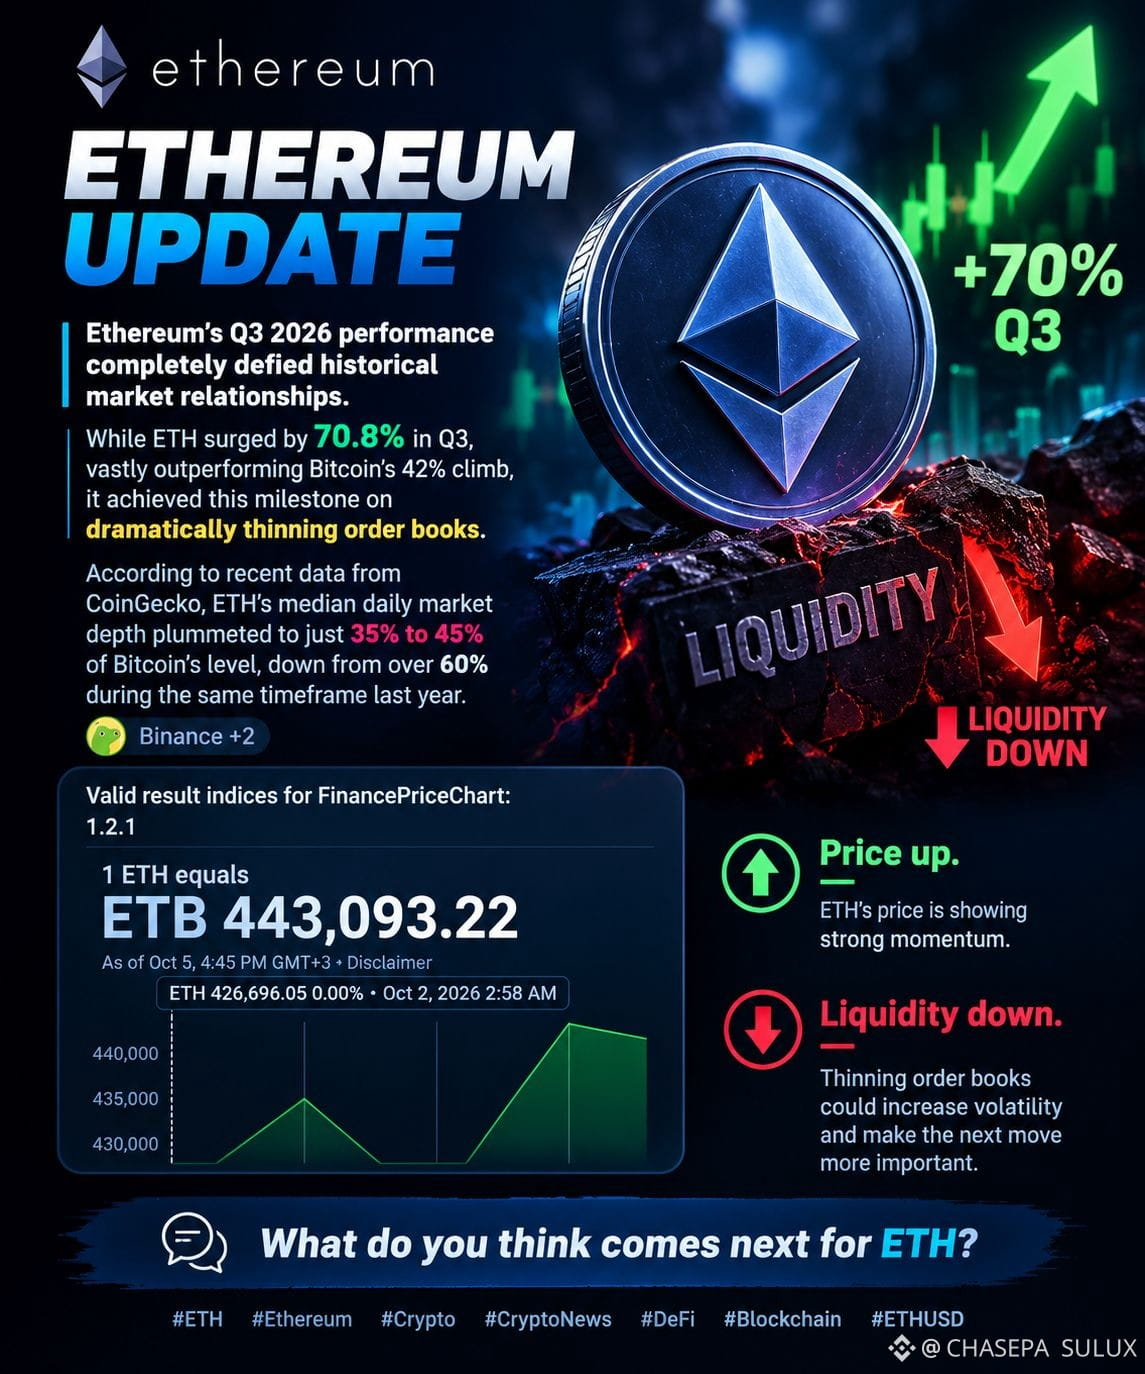
Ethereum’s Q3 2026 performance completely defied historical market relationships. While ETH surged by 70.8% in Q3, vastly outperforming Bitcoin's 42% climb, it achieved this milestone on dramatically thinning order books. According to recent data from CoinGecko, ETH’s median daily market depth plummeted to just 35% to 45% of Bitcoin’s level, down from over 60% during the same timeframe last year. [1, 2, 3]
Valid result indices for FinancePriceChart:
(BNBUSD) (SOLONA)
{spot}(BNTUSDT)
{etf_us}(XRPM.ETF)
🚨 Ethereum Update ETH gained 70% in Q3, but liquidity is falling. The price strength looks impressive, but declining liquidity could increase volatility and make the next move more important. 📊 Price up. Liquidity down. What do you think comes next for ETH? #ETH #Ethereum #Crypto #CryptoNews #DeFi #Blockchain #ETHUSD
#ETHUp70%InQ3ButLiquidityFalls
Ethereum’s Q3 2026 performance completely defied historical market relationships. While ETH surged by 70.8% in Q3, vastly outperforming Bitcoin's 42% climb, it achieved this milestone on dramatically thinning order books. According to recent data from CoinGecko, ETH’s median daily market depth plummeted to just 35% to 45% of Bitcoin’s level, down from over 60% during the same timeframe last year. [1, 2, 3]
Valid result indices for FinancePriceChart:
(BNBUSD) (SOLONA)
#ETHUp70%InQ3ButLiquidityFalls
Ethereum’s Q3 2026 performance completely defied historical market relationships. While ETH surged by 70.8% in Q3, vastly outperforming Bitcoin's 42% climb, it achieved this milestone on dramatically thinning order books. According to recent data from CoinGecko, ETH’s median daily market depth plummeted to just 35% to 45% of Bitcoin’s level, down from over 60% during the same timeframe last year. [1, 2, 3]
Valid result indices for FinancePriceChart:
(BNBUSD) (SOLONA)
2
192

·
--
🚨 ETH +70% IN Q3… BUT HERE’S THE CATCH! ⚠️
🔥 Ethereum just delivered a MASSIVE ~70% Q3 rally — outperforming BTC.
But something unusual is happening underneath the chart… 👀
💧 ETH order-book liquidity has THINNED significantly. 📉 ETH’s near-price depth is now only around 35–45% of BTC’s comparable depth.
That means the next ETH move could be MUCH MORE explosive. ⚡️
🚀 Fresh liquidity + strong demand = breakout potential
⚠️ Heavy selling + thin books = sharper downside
The big question for Q4:
🔥 Is ETH preparing for ANOTHER breakout…
or is thin liquidity hiding a major volatility warning?
Watch ETH closely. 👀📈
#ETHUp70%InQ3ButLiquidityFalls
$NVDAB
{spot}(ETHUSDT)
🚨 ETH +70% IN Q3… BUT HERE’S THE CATCH! ⚠️
🔥 Ethereum just delivered a MASSIVE ~70% Q3 rally — outperforming BTC.
But something unusual is happening underneath the chart… 👀
💧 ETH order-book liquidity has THINNED significantly. 📉 ETH’s near-price depth is now only around 35–45% of BTC’s comparable depth.
That means the next ETH move could be MUCH MORE explosive. ⚡️
🚀 Fresh liquidity + strong demand = breakout potential
⚠️ Heavy selling + thin books = sharper downside
The big question for Q4:
🔥 Is ETH preparing for ANOTHER breakout…
or is thin liquidity hiding a major volatility warning?
Watch ETH closely. 👀📈
#ETHUp70%InQ3ButLiquidityFalls
$NVDAB
🔥 Ethereum just delivered a MASSIVE ~70% Q3 rally — outperforming BTC.
But something unusual is happening underneath the chart… 👀
💧 ETH order-book liquidity has THINNED significantly. 📉 ETH’s near-price depth is now only around 35–45% of BTC’s comparable depth.
That means the next ETH move could be MUCH MORE explosive. ⚡️
🚀 Fresh liquidity + strong demand = breakout potential
⚠️ Heavy selling + thin books = sharper downside
The big question for Q4:
🔥 Is ETH preparing for ANOTHER breakout…
or is thin liquidity hiding a major volatility warning?
Watch ETH closely. 👀📈
#ETHUp70%InQ3ButLiquidityFalls
$NVDAB
69

#ethup70%inq3butliquidityfalls
$ETH UP 70%… BUT SOMETHING ISN’T ADDING UP 👀
Ethereum crushed Bitcoin in Q3:
$ETH: +70%
$BTC: +42%
But while $ETH was flying, its market liquidity actually got thinner.
ETH's median market depth fell to just 35%–45% of Bitcoin's, compared with at least 60% during the same period last year.
That means bigger orders could potentially move $ETH more than before.
70% UP… AND LIQUIDITY DOWN?
OH MY WOW 🤯
#ETH #Ethereum #BTC #crypto
#ethup70%inq3butliquidityfalls
$ETH UP 70%… BUT SOMETHING ISN’T ADDING UP 👀
Ethereum crushed Bitcoin in Q3:
$ETH : +70%
$BTC: +42%
But while $ETH was flying, its market liquidity actually got thinner.
ETH's median market depth fell to just 35%–45% of Bitcoin's, compared with at least 60% during the same period last year.
That means bigger orders could potentially move $ETH more than before.
70% UP… AND LIQUIDITY DOWN?
OH MY WOW 🤯
#ETH #Ethereum #BTC #crypto
$ETH UP 70%… BUT SOMETHING ISN’T ADDING UP 👀
Ethereum crushed Bitcoin in Q3:
$ETH : +70%
$BTC: +42%
But while $ETH was flying, its market liquidity actually got thinner.
ETH's median market depth fell to just 35%–45% of Bitcoin's, compared with at least 60% during the same period last year.
That means bigger orders could potentially move $ETH more than before.
70% UP… AND LIQUIDITY DOWN?
OH MY WOW 🤯
#ETH #Ethereum #BTC #crypto

9
18.7k

·
--
Bullish
#ETHUp70%InQ3ButLiquidityFalls
ETH’s Q3 story isn’t simply “+70%.” The more interesting signal is that price momentum strengthened while market depth weakened. ETH gained roughly 70%, yet its median liquidity near the market price fell to only 35–45% of Bitcoin’s, versus at least 60% during the comparable period last year.
My take:
This creates a high-momentum, low-depth market. That can work both ways: fewer orders near the price mean buying pressure can push ETH higher faster—but sudden selling can also create sharper moves and more slippage.
So the real Q4 question is:
Can ETH turn its Q3 price strength into deeper liquidity—or was the 70% rally partly amplified by thinner order books?
If liquidity starts recovering while ETH holds its gains, that would make the rally look structurally healthier. If price keeps rising while liquidity continues shrinking, volatility risk deserves much more attention.
🔥 Bottom line: Strong price ≠ strong liquidity. Q4 needs both.
#ETHUp70%InQ3ButLiquidityFalls
ETH’s Q3 story isn’t simply “+70%.” The more interesting signal is that price momentum strengthened while market depth weakened. ETH gained roughly 70%, yet its median liquidity near the market price fell to only 35–45% of Bitcoin’s, versus at least 60% during the comparable period last year.
My take:
This creates a high-momentum, low-depth market. That can work both ways: fewer orders near the price mean buying pressure can push ETH higher faster—but sudden selling can also create sharper moves and more slippage.
So the real Q4 question is:
Can ETH turn its Q3 price strength into deeper liquidity—or was the 70% rally partly amplified by thinner order books?
If liquidity starts recovering while ETH holds its gains, that would make the rally look structurally healthier. If price keeps rising while liquidity continues shrinking, volatility risk deserves much more attention.
🔥 Bottom line: Strong price ≠ strong liquidity. Q4 needs both.
ETH’s Q3 story isn’t simply “+70%.” The more interesting signal is that price momentum strengthened while market depth weakened. ETH gained roughly 70%, yet its median liquidity near the market price fell to only 35–45% of Bitcoin’s, versus at least 60% during the comparable period last year.
My take:
This creates a high-momentum, low-depth market. That can work both ways: fewer orders near the price mean buying pressure can push ETH higher faster—but sudden selling can also create sharper moves and more slippage.
So the real Q4 question is:
Can ETH turn its Q3 price strength into deeper liquidity—or was the 70% rally partly amplified by thinner order books?
If liquidity starts recovering while ETH holds its gains, that would make the rally look structurally healthier. If price keeps rising while liquidity continues shrinking, volatility risk deserves much more attention.
🔥 Bottom line: Strong price ≠ strong liquidity. Q4 needs both.
84

#ethup70%inq3butliquidityfalls
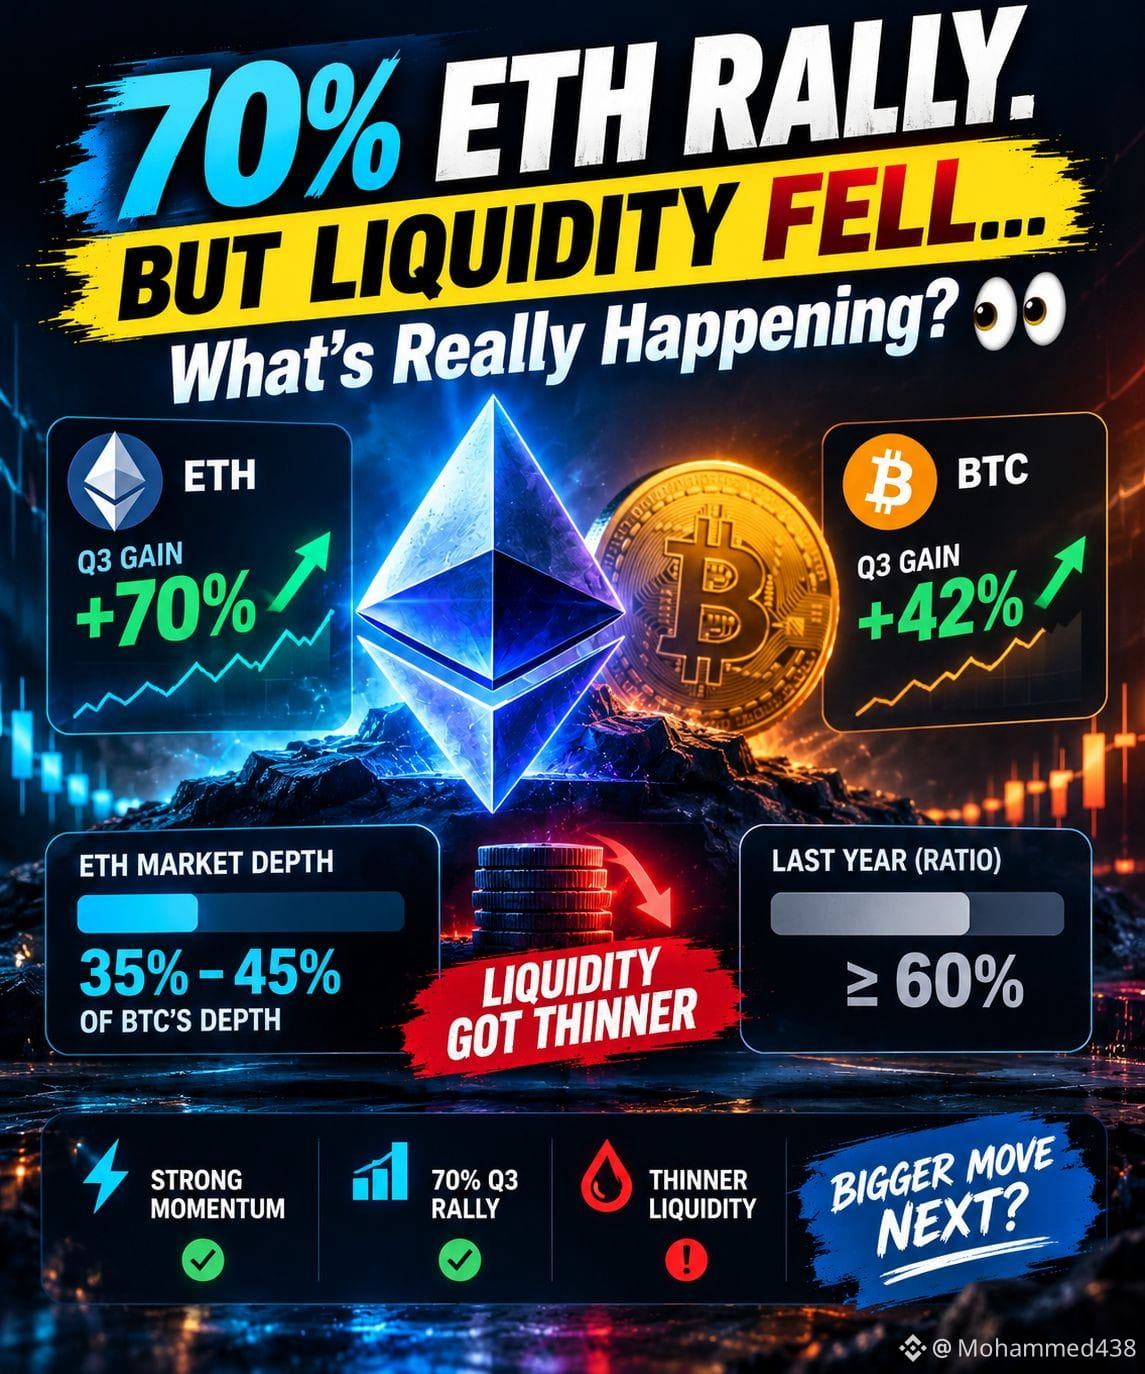
💥 70% ETH RALLY. BUT LIQUIDITY FELL… What’s Really Happening?
Ethereum just delivered a massive Q3 performance.
ETH surged roughly 70%, crushing Bitcoin’s 42% gain over the same period.
But here’s the part traders may be overlooking…
The liquidity underneath that rally actually got thinner.
CoinGecko data shows ETH’s median daily market depth was only around 35%–45% of Bitcoin’s between July 6 and September 30.
A year earlier, that ratio was at least 60%.
So Ethereum went up harder… while the order books became relatively thinner.
And that matters.
Thinner liquidity = bigger potential price reactions.
It doesn’t automatically mean ETH is bearish.
But when fewer orders are sitting near the current price, large buying or selling activity can move the market faster — in either direction.
🔥 That creates an interesting setup for $ETH
{spot}(ETHUSDT)
Strong momentum
70% Q3 rally
But weaker relative liquidity
The real question
Was ETH’s 70% rally just the beginning… or is the thinner liquidity setting the stage for a much bigger move next? 👀
Watch $ETH + market depth + trading volume closely.
#ETH #BTC #DeFi #CryptoNews
$BTC
{spot}(BTCUSDT)
#ethup70%inq3butliquidityfalls
💥 70% ETH RALLY. BUT LIQUIDITY FELL… What’s Really Happening?
Ethereum just delivered a massive Q3 performance.
ETH surged roughly 70%, crushing Bitcoin’s 42% gain over the same period.
But here’s the part traders may be overlooking…
The liquidity underneath that rally actually got thinner.
CoinGecko data shows ETH’s median daily market depth was only around 35%–45% of Bitcoin’s between July 6 and September 30.
A year earlier, that ratio was at least 60%.
So Ethereum went up harder… while the order books became relatively thinner.
And that matters.
Thinner liquidity = bigger potential price reactions.
It doesn’t automatically mean ETH is bearish.
But when fewer orders are sitting near the current price, large buying or selling activity can move the market faster — in either direction.
🔥 That creates an interesting setup for $ETH
Strong momentum
70% Q3 rally
But weaker relative liquidity
The real question
Was ETH’s 70% rally just the beginning… or is the thinner liquidity setting the stage for a much bigger move next? 👀
Watch $ETH + market depth + trading volume closely.
#ETH #BTC #DeFi #CryptoNews
$BTC
💥 70% ETH RALLY. BUT LIQUIDITY FELL… What’s Really Happening?
Ethereum just delivered a massive Q3 performance.
ETH surged roughly 70%, crushing Bitcoin’s 42% gain over the same period.
But here’s the part traders may be overlooking…
The liquidity underneath that rally actually got thinner.
CoinGecko data shows ETH’s median daily market depth was only around 35%–45% of Bitcoin’s between July 6 and September 30.
A year earlier, that ratio was at least 60%.
So Ethereum went up harder… while the order books became relatively thinner.
And that matters.
Thinner liquidity = bigger potential price reactions.
It doesn’t automatically mean ETH is bearish.
But when fewer orders are sitting near the current price, large buying or selling activity can move the market faster — in either direction.
🔥 That creates an interesting setup for $ETH
Strong momentum
70% Q3 rally
But weaker relative liquidity
The real question
Was ETH’s 70% rally just the beginning… or is the thinner liquidity setting the stage for a much bigger move next? 👀
Watch $ETH + market depth + trading volume closely.
#ETH #BTC #DeFi #CryptoNews
$BTC
2
5
5.6k
#ETHUp70%InQ3ButLiquidityFalls
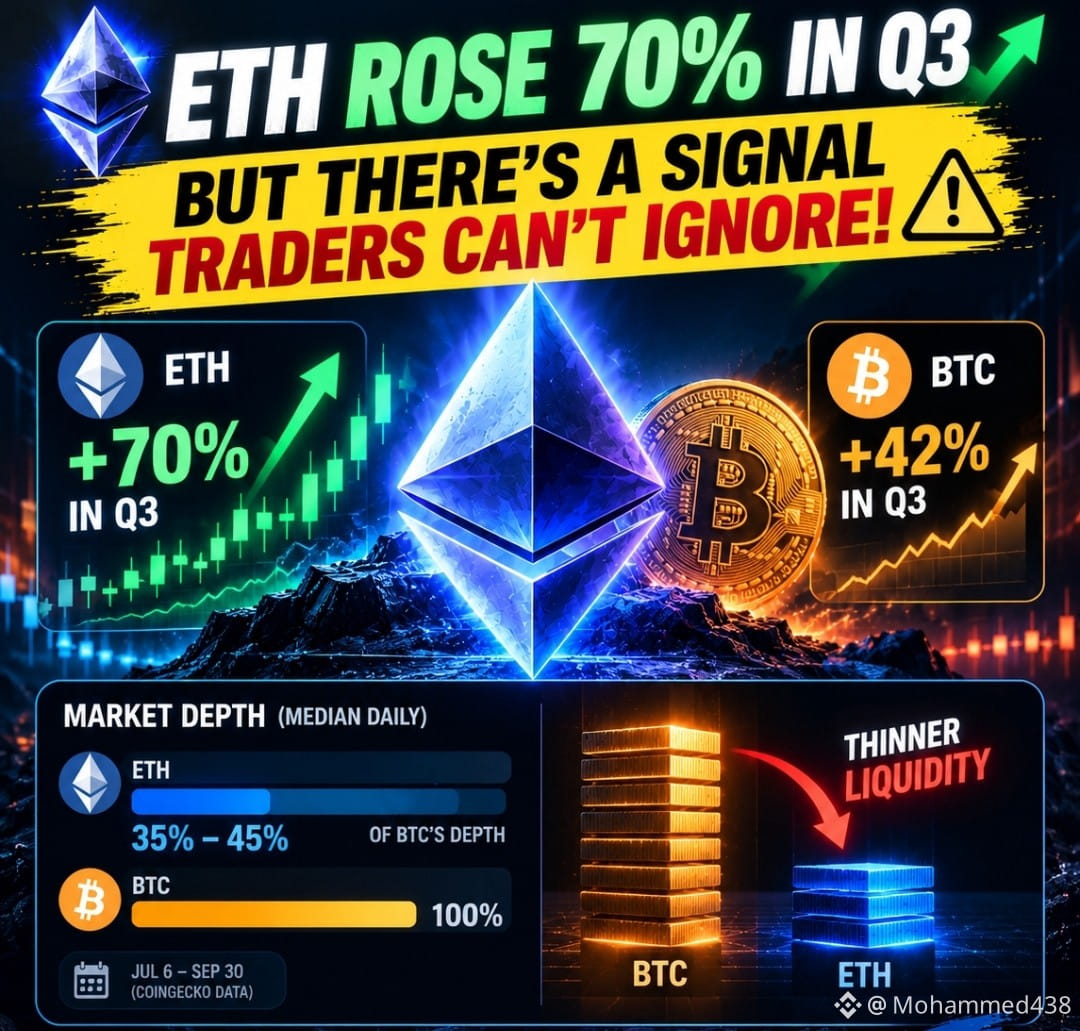
🚨 ETH ROSE 70% IN Q3 — BUT THERE’S A SIGNAL TRADERS CAN’T IGNORE!
Ethereum just delivered a massive quarter.
ETH surged roughly 70% in Q3, significantly outperforming Bitcoin’s roughly 42% gain during the same period. 🔥
But here’s the part that deserves attention…
ETH’s liquidity got thinner.
CoinGecko data showed Ethereum’s median daily market depth was only around 35%–45% of Bitcoin’s between July 6 and September 30.
A year earlier, that ratio was at least 60%.
So we have an interesting setup:
ETH price ↑ 70%
Relative market depth ↓
And that matters.
Thinner liquidity means large orders can potentially move ETH faster in either direction.
This does NOT automatically mean ETH is bearish.
In fact, strong momentum combined with thinner liquidity could amplify the next major move — whether buyers or sellers take control.
🔥 That’s the real question now:
Was Ethereum’s 70% Q3 rally the beginning of a bigger breakout…
or is weaker liquidity setting the stage for a much more volatile move?
Watch $ETH + market depth + trading volume closely.
#Ethereum #ETH #Crypto
{spot}(ETHUSDT)
$BTC
{spot}(BTCUSDT)
#ETHUp70%InQ3ButLiquidityFalls
🚨 ETH ROSE 70% IN Q3 — BUT THERE’S A SIGNAL TRADERS CAN’T IGNORE!
Ethereum just delivered a massive quarter.
ETH surged roughly 70% in Q3, significantly outperforming Bitcoin’s roughly 42% gain during the same period. 🔥
But here’s the part that deserves attention…
ETH’s liquidity got thinner.
CoinGecko data showed Ethereum’s median daily market depth was only around 35%–45% of Bitcoin’s between July 6 and September 30.
A year earlier, that ratio was at least 60%.
So we have an interesting setup:
ETH price ↑ 70%
Relative market depth ↓
And that matters.
Thinner liquidity means large orders can potentially move ETH faster in either direction.
This does NOT automatically mean ETH is bearish.
In fact, strong momentum combined with thinner liquidity could amplify the next major move — whether buyers or sellers take control.
🔥 That’s the real question now:
Was Ethereum’s 70% Q3 rally the beginning of a bigger breakout…
or is weaker liquidity setting the stage for a much more volatile move?
Watch $ETH + market depth + trading volume closely.
#Ethereum #ETH #Crypto
$BTC
🚨 ETH ROSE 70% IN Q3 — BUT THERE’S A SIGNAL TRADERS CAN’T IGNORE!
Ethereum just delivered a massive quarter.
ETH surged roughly 70% in Q3, significantly outperforming Bitcoin’s roughly 42% gain during the same period. 🔥
But here’s the part that deserves attention…
ETH’s liquidity got thinner.
CoinGecko data showed Ethereum’s median daily market depth was only around 35%–45% of Bitcoin’s between July 6 and September 30.
A year earlier, that ratio was at least 60%.
So we have an interesting setup:
ETH price ↑ 70%
Relative market depth ↓
And that matters.
Thinner liquidity means large orders can potentially move ETH faster in either direction.
This does NOT automatically mean ETH is bearish.
In fact, strong momentum combined with thinner liquidity could amplify the next major move — whether buyers or sellers take control.
🔥 That’s the real question now:
Was Ethereum’s 70% Q3 rally the beginning of a bigger breakout…
or is weaker liquidity setting the stage for a much more volatile move?
Watch $ETH + market depth + trading volume closely.
#Ethereum #ETH #Crypto
$BTC
2
184

·
--

Article
Ethereum Rallies 70% in Q3 as Liquidity Falls: What Thinner Market Depth Means for ETH#ethup70%inq3butliquidityfalls
Ethereum delivered a major Q3 performance, with ETH surging roughly 70% and outperforming Bitcoin’s 42% gain over the same period.
But beneath that rally, Ethereum’s relative market liquidity became thinner.
According to CoinGecko data, Ethereum’s median daily market depth was only around 35%–45% of Bitcoin’s between July 6 and September 30. A year earlier, that ratio was at least 60%.
That means ETH moved higher while its order books became relatively thinner.
Why Does Liquidity Matter?
Market depth measures how much buying and selling activity is available around the current price. When liquidity is thinner, larger orders can have a greater impact on price.
For Ethereum, that creates an important dynamic: strong momentum can coexist with weaker relative liquidity.
This does not automatically make ETH bearish. Instead, thinner liquidity means price reactions could potentially become larger in either direction when significant buying or selling activity enters the market.
What Should ETH Traders Watch?
The combination of a 70% Q3 rally and weaker relative market depth makes liquidity an important metric to monitor alongside trading activity.
The key question is whether Ethereum can maintain its momentum while market depth remains relatively thin, or whether changing liquidity conditions lead to larger price swings.
For traders, $ETH market depth and trading volume remain important metrics to watch as the market moves forward.
$ETH $BTC
#ETH #BTC #DeFi #CryptoNews
Ethereum Rallies 70% in Q3 as Liquidity Falls: What Thinner Market Depth Means for ETH
#ethup70%inq3butliquidityfalls
Ethereum delivered a major Q3 performance, with ETH surging roughly 70% and outperforming Bitcoin’s 42% gain over the same period.
But beneath that rally, Ethereum’s relative market liquidity became thinner.
According to CoinGecko data, Ethereum’s median daily market depth was only around 35%–45% of Bitcoin’s between July 6 and September 30. A year earlier, that ratio was at least 60%.
That means ETH moved higher while its order books became relatively thinner.
Why Does Liquidity Matter?
Market depth measures how much buying and selling activity is available around the current price. When liquidity is thinner, larger orders can have a greater impact on price.
For Ethereum, that creates an important dynamic: strong momentum can coexist with weaker relative liquidity.
This does not automatically make ETH bearish. Instead, thinner liquidity means price reactions could potentially become larger in either direction when significant buying or selling activity enters the market.
What Should ETH Traders Watch?
The combination of a 70% Q3 rally and weaker relative market depth makes liquidity an important metric to monitor alongside trading activity.
The key question is whether Ethereum can maintain its momentum while market depth remains relatively thin, or whether changing liquidity conditions lead to larger price swings.
For traders, $ETH market depth and trading volume remain important metrics to watch as the market moves forward.
$ETH $BTC
#ETH #BTC #DeFi #CryptoNews
Ethereum delivered a major Q3 performance, with ETH surging roughly 70% and outperforming Bitcoin’s 42% gain over the same period.
But beneath that rally, Ethereum’s relative market liquidity became thinner.
According to CoinGecko data, Ethereum’s median daily market depth was only around 35%–45% of Bitcoin’s between July 6 and September 30. A year earlier, that ratio was at least 60%.
That means ETH moved higher while its order books became relatively thinner.
Why Does Liquidity Matter?
Market depth measures how much buying and selling activity is available around the current price. When liquidity is thinner, larger orders can have a greater impact on price.
For Ethereum, that creates an important dynamic: strong momentum can coexist with weaker relative liquidity.
This does not automatically make ETH bearish. Instead, thinner liquidity means price reactions could potentially become larger in either direction when significant buying or selling activity enters the market.
What Should ETH Traders Watch?
The combination of a 70% Q3 rally and weaker relative market depth makes liquidity an important metric to monitor alongside trading activity.
The key question is whether Ethereum can maintain its momentum while market depth remains relatively thin, or whether changing liquidity conditions lead to larger price swings.
For traders, $ETH market depth and trading volume remain important metrics to watch as the market moves forward.
$ETH $BTC
#ETH #BTC #DeFi #CryptoNews
1
8

·
--
#ethup70%inq3butliquidityfalls $ETH gained almost 70% in Q3
, beating Bitcoin's roughly 42% gain
But
there is one problem
Liquidity in ETH
order books has become thinner as price climbed
That means bigger moves can happen with less
liquidity
#ETH #Ethereum #crypto #trading $FOGO $OPN
#ethup70%inq3butliquidityfalls $ETH gained almost 70% in Q3
, beating Bitcoin's roughly 42% gain
But
there is one problem
Liquidity in ETH
order books has become thinner as price climbed
That means bigger moves can happen with less
liquidity
#ETH #Ethereum #crypto #trading $FOGO $OPN
, beating Bitcoin's roughly 42% gain
But
there is one problem
Liquidity in ETH
order books has become thinner as price climbed
That means bigger moves can happen with less
liquidity
#ETH #Ethereum #crypto #trading $FOGO $OPN
1
·
--
#ethup70%inq3butliquidityfalls Everyone is looking at
ETH beating BTC and screaming ETH
season
Fair enough, +
70
% vs +42% is a pretty hard number to ignore
But I’m also looking at the liquidity
because that part can get ugly real quick
ETH
now has only around 35–45% of BTC’s order book depth near the current price
Which basically means there’s less sitting in the way of a big market order
Could be exactly what ETH needs for another insane move or could be exactly what makes the next dump absolutely disgusting$ETH $TST $ADA
#ethup70%inq3butliquidityfalls Everyone is looking at
ETH beating BTC and screaming ETH
season
Fair enough, +
70
% vs +42% is a pretty hard number to ignore
But I’m also looking at the liquidity
because that part can get ugly real quick
ETH
now has only around 35–45% of BTC’s order book depth near the current price
Which basically means there’s less sitting in the way of a big market order
Could be exactly what ETH needs for another insane move or could be exactly what makes the next dump absolutely disgusting$ETH $TST $ADA
ETH beating BTC and screaming ETH
season
Fair enough, +
70
% vs +42% is a pretty hard number to ignore
But I’m also looking at the liquidity
because that part can get ugly real quick
ETH
now has only around 35–45% of BTC’s order book depth near the current price
Which basically means there’s less sitting in the way of a big market order
Could be exactly what ETH needs for another insane move or could be exactly what makes the next dump absolutely disgusting$ETH $TST $ADA
7
·
--
#ethup70%inq3butliquidityfalls #BREAKING
🚨
BOOOOM
💥💥
ETH ROCKETED 70% IN Q3, CRUSHING BITCOIN'S 42%! BUT
WAIT, THE ORDER BOOKS ARE GETTING THINNER. CURRENT DEPTH IS JUST 35% TO 45% OF BITCOIN'S, DOWN FROM 60% LAST YEAR. THIS IS A SIGNIFICANT SHIFT!
This divergence is wild. While
ETH
is riding a bullish wave, its thinning order book signals possible vulnerabilities. Liquidity matters in this game. A thinner order book can lead to more volatility and sudden price swings, which could shake out weak hands. If ETH’s momentum falters, the lack of depth might amplify the downturn.
WE ARE IN FOR A RIDE!$ETH $SPORTFUN $DKNG
#ethup70%inq3butliquidityfalls #BREAKING
🚨
BOOOOM
💥💥
ETH ROCKETED 70% IN Q3, CRUSHING BITCOIN'S 42%! BUT
WAIT, THE ORDER BOOKS ARE GETTING THINNER. CURRENT DEPTH IS JUST 35% TO 45% OF BITCOIN'S, DOWN FROM 60% LAST YEAR. THIS IS A SIGNIFICANT SHIFT!
This divergence is wild. While
ETH
is riding a bullish wave, its thinning order book signals possible vulnerabilities. Liquidity matters in this game. A thinner order book can lead to more volatility and sudden price swings, which could shake out weak hands. If ETH’s momentum falters, the lack of depth might amplify the downturn.
WE ARE IN FOR A RIDE!$ETH $SPORTFUN $DKNG
🚨
BOOOOM
💥💥
ETH ROCKETED 70% IN Q3, CRUSHING BITCOIN'S 42%! BUT
WAIT, THE ORDER BOOKS ARE GETTING THINNER. CURRENT DEPTH IS JUST 35% TO 45% OF BITCOIN'S, DOWN FROM 60% LAST YEAR. THIS IS A SIGNIFICANT SHIFT!
This divergence is wild. While
ETH
is riding a bullish wave, its thinning order book signals possible vulnerabilities. Liquidity matters in this game. A thinner order book can lead to more volatility and sudden price swings, which could shake out weak hands. If ETH’s momentum falters, the lack of depth might amplify the downturn.
WE ARE IN FOR A RIDE!$ETH $SPORTFUN $DKNG
·
--
#ethup70%inq3butliquidityfalls
💥 $ETH rallied roughly 70% in Q3 — but its liquidity got thinner.
Ethereum crushed Bitcoin’s 42% Q3 gain, yet the liquidity underneath the move tells a different story.
According to CoinGecko data, ETH’s median daily market depth was only around 35%–45% of Bitcoin’s between July 6 and September 30.
A year earlier, that ratio was at least 60%.
Why does that matter?
Thinner order books can mean larger price reactions when significant buying or selling hits the market.
That doesn’t automatically make ETH bearish. But with strong momentum and weaker relative liquidity, moves can become sharper in either direction.
👀 Watch $ETH market depth + trading volume closely.
{spot}(ETHUSDT)
| $BTC
{spot}(BTCUSDT)
#ETH #BTC #defi #CryptoNews
#ethup70%inq3butliquidityfalls
💥 $ETH rallied roughly 70% in Q3 — but its liquidity got thinner.
Ethereum crushed Bitcoin’s 42% Q3 gain, yet the liquidity underneath the move tells a different story.
According to CoinGecko data, ETH’s median daily market depth was only around 35%–45% of Bitcoin’s between July 6 and September 30.
A year earlier, that ratio was at least 60%.
Why does that matter?
Thinner order books can mean larger price reactions when significant buying or selling hits the market.
That doesn’t automatically make ETH bearish. But with strong momentum and weaker relative liquidity, moves can become sharper in either direction.
👀 Watch $ETH market depth + trading volume closely.
| $BTC
#ETH #BTC #defi #CryptoNews
💥 $ETH rallied roughly 70% in Q3 — but its liquidity got thinner.
Ethereum crushed Bitcoin’s 42% Q3 gain, yet the liquidity underneath the move tells a different story.
According to CoinGecko data, ETH’s median daily market depth was only around 35%–45% of Bitcoin’s between July 6 and September 30.
A year earlier, that ratio was at least 60%.
Why does that matter?
Thinner order books can mean larger price reactions when significant buying or selling hits the market.
That doesn’t automatically make ETH bearish. But with strong momentum and weaker relative liquidity, moves can become sharper in either direction.
👀 Watch $ETH market depth + trading volume closely.
| $BTC
#ETH #BTC #defi #CryptoNews

·
--
#ethup70%inq3butliquidityfalls One thing about ETH's Q3
performance caught my attention?
The price got stronger.
but the liquidity
underneath it didn't
ETH gained ~70
% vs ~42% for BTC. while its median market depth was only 35-45% of Bitcoin's
A market can go
up while becoming easier to move$EDU $SAGA $ETH
#ethup70%inq3butliquidityfalls One thing about ETH's Q3
performance caught my attention?
The price got stronger.
but the liquidity
underneath it didn't
ETH gained ~70
% vs ~42% for BTC. while its median market depth was only 35-45% of Bitcoin's
A market can go
up while becoming easier to move$EDU $SAGA $ETH
performance caught my attention?
The price got stronger.
but the liquidity
underneath it didn't
ETH gained ~70
% vs ~42% for BTC. while its median market depth was only 35-45% of Bitcoin's
A market can go
up while becoming easier to move$EDU $SAGA $ETH
·
--
#ethup70%inq3butliquidityfalls EVERYONE IS CHEERING ETHEREUM OUTPERFORMING BITCOIN IN Q3 BUT
NO ONE IS LOOKING AT THE ORDER BOOKS
$ETH pumped 70% in Q3 while BTC only managed 42%. on the surface it looks like a massive rotation into eth but if you look at the actual liquidity
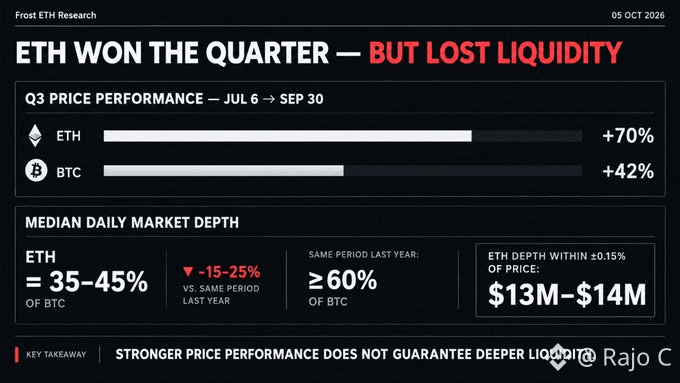
plumbing its a totally different story. from early july to late september the daily median market depth for eth collapsed to just 35-45% of btc. last year we were sitting comfortably at 60% or higher. right now within 0.15% of the current market price the bid and ask depth for eth is hovering around a measly $13M to $14M. its a phantom rally built on air. sure its still tradeable and most exchanges have over $1M on either side but the reality is market makers have quietly pulled their capital off the books.
when you synthesize this micro onchain reality with the broader macro environment it makes perfect sense. central bank liquidity might be shifting but institutional capital efficiency is ruthless right now. market makers arent going to leave massive limit orders sitting on exchange ledgers when capital costs are this tight. this shallow depth means the market is highly fragile to sudden structural shocks. and its not isolated to ethereum. look at SOL. its 2% depth just bled from $28M last year down to $20M. meanwhile XRP is sitting on about $30M in total depth despite having a market cap 40% higher than sol purely because sol handles about 25% more daily trading volume. the big players are pricing in risk by stepping away from the order books leaving retail to push up spot prices on thin liquidity.
$EWZ $LIT
#ethup70%inq3butliquidityfalls EVERYONE IS CHEERING ETHEREUM OUTPERFORMING BITCOIN IN Q3 BUT
NO ONE IS LOOKING AT THE ORDER BOOKS
$ETH pumped 70% in Q3 while BTC only managed 42%. on the surface it looks like a massive rotation into eth but if you look at the actual liquidity
plumbing its a totally different story. from early july to late september the daily median market depth for eth collapsed to just 35-45% of btc. last year we were sitting comfortably at 60% or higher. right now within 0.15% of the current market price the bid and ask depth for eth is hovering around a measly $13M to $14M. its a phantom rally built on air. sure its still tradeable and most exchanges have over $1M on either side but the reality is market makers have quietly pulled their capital off the books.
when you synthesize this micro onchain reality with the broader macro environment it makes perfect sense. central bank liquidity might be shifting but institutional capital efficiency is ruthless right now. market makers arent going to leave massive limit orders sitting on exchange ledgers when capital costs are this tight. this shallow depth means the market is highly fragile to sudden structural shocks. and its not isolated to ethereum. look at SOL. its 2% depth just bled from $28M last year down to $20M. meanwhile XRP is sitting on about $30M in total depth despite having a market cap 40% higher than sol purely because sol handles about 25% more daily trading volume. the big players are pricing in risk by stepping away from the order books leaving retail to push up spot prices on thin liquidity.
$EWZ $LIT
NO ONE IS LOOKING AT THE ORDER BOOKS
$ETH pumped 70% in Q3 while BTC only managed 42%. on the surface it looks like a massive rotation into eth but if you look at the actual liquidity
plumbing its a totally different story. from early july to late september the daily median market depth for eth collapsed to just 35-45% of btc. last year we were sitting comfortably at 60% or higher. right now within 0.15% of the current market price the bid and ask depth for eth is hovering around a measly $13M to $14M. its a phantom rally built on air. sure its still tradeable and most exchanges have over $1M on either side but the reality is market makers have quietly pulled their capital off the books.
when you synthesize this micro onchain reality with the broader macro environment it makes perfect sense. central bank liquidity might be shifting but institutional capital efficiency is ruthless right now. market makers arent going to leave massive limit orders sitting on exchange ledgers when capital costs are this tight. this shallow depth means the market is highly fragile to sudden structural shocks. and its not isolated to ethereum. look at SOL. its 2% depth just bled from $28M last year down to $20M. meanwhile XRP is sitting on about $30M in total depth despite having a market cap 40% higher than sol purely because sol handles about 25% more daily trading volume. the big players are pricing in risk by stepping away from the order books leaving retail to push up spot prices on thin liquidity.
$EWZ $LIT

35
·
--
#ethup70%inq3butliquidityfalls Ether surged 70% in Q3 but liquidity
thinned to 35–45% of bitcoin's
Ether's median daily market depth from July 6 to Sept. 30 fell sharply relative to bitcoin, down from at least 60% a year prior, according to CoinGecko. Ether held $13–14 million
in
depth within 0.15% of its market price — enough to absorb everyday trades but less resilient to large orders.
• Solana (SOL) liquidity also contracted: depth within 2% of price fell from $28 million to $20 million per side year-over-year.
• XRP held $30 million total depth but skewed bullish, with $18 million in bids against $14 million in asks.$ETH $NIL $PARTI
#ethup70%inq3butliquidityfalls Ether surged 70% in Q3 but liquidity
thinned to 35–45% of bitcoin's
Ether's median daily market depth from July 6 to Sept. 30 fell sharply relative to bitcoin, down from at least 60% a year prior, according to CoinGecko. Ether held $13–14 million
in
depth within 0.15% of its market price — enough to absorb everyday trades but less resilient to large orders.
• Solana (SOL) liquidity also contracted: depth within 2% of price fell from $28 million to $20 million per side year-over-year.
• XRP held $30 million total depth but skewed bullish, with $18 million in bids against $14 million in asks.$ETH $NIL $PARTI
thinned to 35–45% of bitcoin's
Ether's median daily market depth from July 6 to Sept. 30 fell sharply relative to bitcoin, down from at least 60% a year prior, according to CoinGecko. Ether held $13–14 million
in
depth within 0.15% of its market price — enough to absorb everyday trades but less resilient to large orders.
• Solana (SOL) liquidity also contracted: depth within 2% of price fell from $28 million to $20 million per side year-over-year.
• XRP held $30 million total depth but skewed bullish, with $18 million in bids against $14 million in asks.$ETH $NIL $PARTI
22
·
--
#ethup70%inq3butliquidityfalls $ETH is outperforming BTC
and becoming easier to move.
Q3
performance:
ETH +70
%
BTC +42%
Order book depth:
ETH
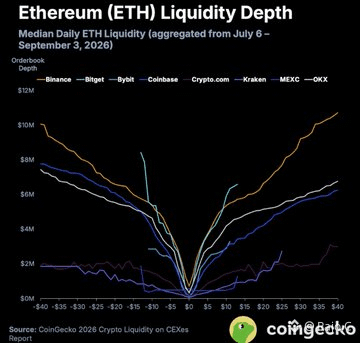
only 35–45% of BTC.
So when big money hits
ETH, there’s less liquidity
absorbing the order.
Could fuel the next leg higher or turn a dip into a liquidation festival.$MOVR $SCR
#ethup70%inq3butliquidityfalls $ETH is outperforming BTC
and becoming easier to move.
Q3
performance:
ETH +70
%
BTC +42%
Order book depth:
ETH
only 35–45% of BTC.
So when big money hits
ETH, there’s less liquidity
absorbing the order.
Could fuel the next leg higher or turn a dip into a liquidation festival.$MOVR $SCR
and becoming easier to move.
Q3
performance:
ETH +70
%
BTC +42%
Order book depth:
ETH
only 35–45% of BTC.
So when big money hits
ETH, there’s less liquidity
absorbing the order.
Could fuel the next leg higher or turn a dip into a liquidation festival.$MOVR $SCR
22
·
--
#ethup70%inq3butliquidityfalls Ethereum Outpaced Bitcoin, But its Liquidity
Took a Hit
Ether gained
70% in
the third quarter, beating Bitcoin’s 42% rise, according to CoinGecko.
Yet ethereum:native’s median daily market depth fell sharply compared with the same period last year. Ether held only 35% to 45% of Bitcoin’s market depth between July and September.
ETH had roughly $13 million to $14 million in orders within 0.15% of its market price.
CoinGecko said ETH remains liquid, with most exchanges holding over $1 million per side.$ETH $GTC $RLC
#ethup70%inq3butliquidityfalls Ethereum Outpaced Bitcoin, But its Liquidity
Took a Hit
Ether gained
70% in
the third quarter, beating Bitcoin’s 42% rise, according to CoinGecko.
Yet ethereum:native’s median daily market depth fell sharply compared with the same period last year. Ether held only 35% to 45% of Bitcoin’s market depth between July and September.
ETH had roughly $13 million to $14 million in orders within 0.15% of its market price.
CoinGecko said ETH remains liquid, with most exchanges holding over $1 million per side.$ETH $GTC $RLC
Took a Hit
Ether gained
70% in
the third quarter, beating Bitcoin’s 42% rise, according to CoinGecko.
Yet ethereum:native’s median daily market depth fell sharply compared with the same period last year. Ether held only 35% to 45% of Bitcoin’s market depth between July and September.
ETH had roughly $13 million to $14 million in orders within 0.15% of its market price.
CoinGecko said ETH remains liquid, with most exchanges holding over $1 million per side.$ETH $GTC $RLC

3

$ETH Up 70% in Q3 ~ But the Market Below It Got Thinner, Not Deeper. 🤔
Here's the part most headlines skip:
ETH beat BTC's 42% gain with a 70% run, yet its order book depth fell to just 35-45% of Bitcoin's, down from 60%+ a year ago. Usually rising prices pull in more liquidity. ETH broke that pattern.
What it means for traders:
Bigger orders can swing price more than the chart alone suggests. Still tradeable (most exchanges hold $1M+ depth), just less cushioned than the rally makes it look.
💬 Does thinner liquidity worry you, or is the price action all that matters? 👇
{future}(ETHUSDT)
⚠️ Not financial advice. DYOR.
#ETH #Ethereum #BinanceSquare
#ETHUp70%InQ3ButLiquidityFalls
$ETH Up 70% in Q3 ~ But the Market Below It Got Thinner, Not Deeper. 🤔
Here's the part most headlines skip:
ETH beat BTC's 42% gain with a 70% run, yet its order book depth fell to just 35-45% of Bitcoin's, down from 60%+ a year ago. Usually rising prices pull in more liquidity. ETH broke that pattern.
What it means for traders:
Bigger orders can swing price more than the chart alone suggests. Still tradeable (most exchanges hold $1M+ depth), just less cushioned than the rally makes it look.
💬 Does thinner liquidity worry you, or is the price action all that matters? 👇
⚠️ Not financial advice. DYOR.
#ETH #Ethereum #BinanceSquare
#ETHUp70%InQ3ButLiquidityFalls
Here's the part most headlines skip:
ETH beat BTC's 42% gain with a 70% run, yet its order book depth fell to just 35-45% of Bitcoin's, down from 60%+ a year ago. Usually rising prices pull in more liquidity. ETH broke that pattern.
What it means for traders:
Bigger orders can swing price more than the chart alone suggests. Still tradeable (most exchanges hold $1M+ depth), just less cushioned than the rally makes it look.
💬 Does thinner liquidity worry you, or is the price action all that matters? 👇
⚠️ Not financial advice. DYOR.
#ETH #Ethereum #BinanceSquare
#ETHUp70%InQ3ButLiquidityFalls
10

·
--
#ETHUp70%InQ3ButLiquidityFalls
Ethereum (ETH) gained around 70% during the third quarter (Q3), showing strong price momentum and increased investor interest. However, despite this impressive growth, market liquidity declined.
This means ETH’s price performed strongly, but there was less liquidity available in the market. Lower liquidity can lead to higher price volatility and may make large trades more difficult to execute without affecting the price.
In simple words: ETH had a strong 70% rally in Q3, but the market became less liquid, which could increase volatility going forward.$GOOGL.US $NVDAB $NVDA.US
#ETHUp70%InQ3ButLiquidityFalls
Ethereum (ETH) gained around 70% during the third quarter (Q3), showing strong price momentum and increased investor interest. However, despite this impressive growth, market liquidity declined.
This means ETH’s price performed strongly, but there was less liquidity available in the market. Lower liquidity can lead to higher price volatility and may make large trades more difficult to execute without affecting the price.
In simple words: ETH had a strong 70% rally in Q3, but the market became less liquid, which could increase volatility going forward.$GOOGL.US $NVDAB $NVDA.US
Ethereum (ETH) gained around 70% during the third quarter (Q3), showing strong price momentum and increased investor interest. However, despite this impressive growth, market liquidity declined.
This means ETH’s price performed strongly, but there was less liquidity available in the market. Lower liquidity can lead to higher price volatility and may make large trades more difficult to execute without affecting the price.
In simple words: ETH had a strong 70% rally in Q3, but the market became less liquid, which could increase volatility going forward.$GOOGL.US $NVDAB $NVDA.US
1
393

·
--
Bullish
$ETH
🚀 ETH had a big +70% gain in Q3.
⚠️ But liquidity is lower, so big price swings are possible.
📈 Above $2,800 = bullish.
{spot}(ETHUSDT)
📉 Below $2,600 = caution.
Overall: ETH is still bullish, but volatility is high.#ETH🔥🔥🔥🔥🔥🔥 #ETHUp70%InQ3ButLiquidityFalls
$ETH
🚀 ETH had a big +70% gain in Q3.
⚠️ But liquidity is lower, so big price swings are possible.
📈 Above $2,800 = bullish.
📉 Below $2,600 = caution.
Overall: ETH is still bullish, but volatility is high.#ETH🔥🔥🔥🔥🔥🔥 #ETHUp70%InQ3ButLiquidityFalls
🚀 ETH had a big +70% gain in Q3.
⚠️ But liquidity is lower, so big price swings are possible.
📈 Above $2,800 = bullish.
📉 Below $2,600 = caution.
Overall: ETH is still bullish, but volatility is high.#ETH🔥🔥🔥🔥🔥🔥 #ETHUp70%InQ3ButLiquidityFalls
11

·
--
#ETHUp70%InQ3ButLiquidityFalls
ETH Not a bad quarterly close. Price is holding that key expansion level.
As long as price continues to hold above major support, I think the macro trend looks fine despite the liquidity contraction.
It’s not a major structural reversal zone. It’s important mainly because when you see a massive 70% rally alongside declining decentralized exchange liquidity, you want to see the market respect that higher valuation and provide continuation.
So far, the market is defending it.
Lower timeframe:
$3,350 is the important lower timeframe zone. If bulls manage to hold above it, we can expect continuation higher into Q4.
Even better if price doesn’t revisit that zone again.
Highlighted Tradeable Coins to Watch (Smart Contract & Layer-1 Sectors):
$ETH (Ethereum): The primary asset in focus; tracking whether price can sustain its strong Q3 performance of up 70% while navigating shifting DEX liquidity dynamics.
$BTC (Bitcoin): The macro market leader; observing overall liquidity flow and whether benchmark stability supports smart contract momentum.
$SOL (Solana): High-beta layer-1 competitor; monitoring relative strength, ecosystem volume, and cross-chain capital rotation.
How are you positioning your portfolio around Ethereum's Q3 performance and the broader liquidity shift? Are you managing risk or scaling into positions? Let's discuss your strategy in the comments below! 👇
{spot}(ETHUSDT)
{spot}(BTCUSDT)
{spot}(SOLUSDT)
#Ethereum #CryptoTrading #priceaction #MarketUpdate
#ETHUp70%InQ3ButLiquidityFalls
ETH Not a bad quarterly close. Price is holding that key expansion level.
As long as price continues to hold above major support, I think the macro trend looks fine despite the liquidity contraction.
It’s not a major structural reversal zone. It’s important mainly because when you see a massive 70% rally alongside declining decentralized exchange liquidity, you want to see the market respect that higher valuation and provide continuation.
So far, the market is defending it.
Lower timeframe:
$3,350 is the important lower timeframe zone. If bulls manage to hold above it, we can expect continuation higher into Q4.
Even better if price doesn’t revisit that zone again.
Highlighted Tradeable Coins to Watch (Smart Contract & Layer-1 Sectors):
$ETH (Ethereum): The primary asset in focus; tracking whether price can sustain its strong Q3 performance of up 70% while navigating shifting DEX liquidity dynamics.
$BTC (Bitcoin): The macro market leader; observing overall liquidity flow and whether benchmark stability supports smart contract momentum.
$SOL (Solana): High-beta layer-1 competitor; monitoring relative strength, ecosystem volume, and cross-chain capital rotation.
How are you positioning your portfolio around Ethereum's Q3 performance and the broader liquidity shift? Are you managing risk or scaling into positions? Let's discuss your strategy in the comments below! 👇
#Ethereum #CryptoTrading #priceaction #MarketUpdate
ETH Not a bad quarterly close. Price is holding that key expansion level.
As long as price continues to hold above major support, I think the macro trend looks fine despite the liquidity contraction.
It’s not a major structural reversal zone. It’s important mainly because when you see a massive 70% rally alongside declining decentralized exchange liquidity, you want to see the market respect that higher valuation and provide continuation.
So far, the market is defending it.
Lower timeframe:
$3,350 is the important lower timeframe zone. If bulls manage to hold above it, we can expect continuation higher into Q4.
Even better if price doesn’t revisit that zone again.
Highlighted Tradeable Coins to Watch (Smart Contract & Layer-1 Sectors):
$ETH (Ethereum): The primary asset in focus; tracking whether price can sustain its strong Q3 performance of up 70% while navigating shifting DEX liquidity dynamics.
$BTC (Bitcoin): The macro market leader; observing overall liquidity flow and whether benchmark stability supports smart contract momentum.
$SOL (Solana): High-beta layer-1 competitor; monitoring relative strength, ecosystem volume, and cross-chain capital rotation.
How are you positioning your portfolio around Ethereum's Q3 performance and the broader liquidity shift? Are you managing risk or scaling into positions? Let's discuss your strategy in the comments below! 👇
#Ethereum #CryptoTrading #priceaction #MarketUpdate

61
Log in to explore more content
Join global crypto users on Binance Square
⚡️ Get latest and useful information about crypto.
💬 Trusted by the world’s largest crypto exchange.
👍 Discover real insights from verified creators.
Email / Phone number
Trending Topics
1
#ADAGains10%Above$0.27
1,426 views
69 Discussing
2
#ETHUp70%InQ3ButLiquidityFalls
20,233 views
336 Discussing
3
#EthStakingExitQueueHits2026High
7,075 views
316 Discussing
4
#FedOctoberHoldOdds82.3%
9,913 views
300 Discussing
5
#Nikkei225Jumps2.5%ToThreeMonthHigh
44,245 views
712 Discussing
6
#CircleMints$2.75BUSDCOnSolanaIn7Days
431 views
20 Discussing
7
#DriftHackVictimsBeginClaims
123,852 views
1,377 Discussing
8
#SolanaTokenizedStockVolumeTops$4.4BInSeptember
10,743 views
123 Discussing
9
#BitcoinSpotETFsDraw$6.34BInflowsInQ3
39,806 views
241 Discussing
10
#EthereumValidatorExitQueueJumps392%
256,233 views
2,285 Discussing