

#btcfallsbelow
btcfallsbelow
4,710 views
174 Discussing
Hot
Latest

·
--
🚨 $BTC Breaks Below $81K: Liquidations Hit $1B+
Bitcoin dipped below $81,000 on October 8, hitting an intraday low near $80,800. The move triggered over $1 billion in liquidations in 24 hours, with about $9.3 billion of that coming from long positions. Once the price broke through the $81,000 to $81,250 zone, leveraged longs were forced out, which accelerated the drop.
📉 Levels to watch:
$85,500: the support BTC needs to reclaim to stabilize $81,000: the level that just broke and may now act as resistance $75,000: the next downside zone if buyers don’t step in
The Fed remaining on hold is also weighing on sentiment. Without a clear catalyst, the market is relying on spot volume and ETF flows to find a floor.
Leverage amplifies moves in both directions, so manage your position size and set stop-losses before you trade. Watch for a volume-backed reclaim of $85K before assuming the trend has turned.
#BTCFallsBelow$81K #BTCFALLSBELOW #BTC
$BTC
{spot}(BTCUSDT)
🚨 $BTC Breaks Below $81K: Liquidations Hit $1B+
Bitcoin dipped below $81,000 on October 8, hitting an intraday low near $80,800. The move triggered over $1 billion in liquidations in 24 hours, with about $9.3 billion of that coming from long positions. Once the price broke through the $81,000 to $81,250 zone, leveraged longs were forced out, which accelerated the drop.
📉 Levels to watch:
$85,500: the support BTC needs to reclaim to stabilize $81,000: the level that just broke and may now act as resistance $75,000: the next downside zone if buyers don’t step in
The Fed remaining on hold is also weighing on sentiment. Without a clear catalyst, the market is relying on spot volume and ETF flows to find a floor.
Leverage amplifies moves in both directions, so manage your position size and set stop-losses before you trade. Watch for a volume-backed reclaim of $85K before assuming the trend has turned.
#BTCFallsBelow$81K #BTCFALLSBELOW #BTC
$BTC
Bitcoin dipped below $81,000 on October 8, hitting an intraday low near $80,800. The move triggered over $1 billion in liquidations in 24 hours, with about $9.3 billion of that coming from long positions. Once the price broke through the $81,000 to $81,250 zone, leveraged longs were forced out, which accelerated the drop.
📉 Levels to watch:
$85,500: the support BTC needs to reclaim to stabilize $81,000: the level that just broke and may now act as resistance $75,000: the next downside zone if buyers don’t step in
The Fed remaining on hold is also weighing on sentiment. Without a clear catalyst, the market is relying on spot volume and ETF flows to find a floor.
Leverage amplifies moves in both directions, so manage your position size and set stop-losses before you trade. Watch for a volume-backed reclaim of $85K before assuming the trend has turned.
#BTCFallsBelow$81K #BTCFALLSBELOW #BTC
$BTC
111

·
--
Bitcoin has recently experienced a significant price drop, falling below the $81,000 mark. This sharp decline has sparked concern and speculation across the crypto community. While the exact catalysts for this move are still being analyzed, it's crucial to understand the potential implications for traders and investors. Such a drop can signal shifts in market sentiment, increased selling pressure, or broader macroeconomic influences affecting risk assets. Observing the on-chain data and trading volumes will be key to gauging the strength of this downward trend and identifying potential support levels. The market is now closely watching to see if $BTC can reclaim this crucial psychological level or if further consolidation is on the horizon.
This price action underscores the inherent volatility of the cryptocurrency market and the importance of risk management. Investors should remain vigilant and conduct thorough research before making any decisions.
This information is for educational purposes only and does not constitute financial advice.
#BTCFallsBelow$81K
Bitcoin has recently experienced a significant price drop, falling below the $81,000 mark. This sharp decline has sparked concern and speculation across the crypto community. While the exact catalysts for this move are still being analyzed, it's crucial to understand the potential implications for traders and investors. Such a drop can signal shifts in market sentiment, increased selling pressure, or broader macroeconomic influences affecting risk assets. Observing the on-chain data and trading volumes will be key to gauging the strength of this downward trend and identifying potential support levels. The market is now closely watching to see if $BTC can reclaim this crucial psychological level or if further consolidation is on the horizon.
This price action underscores the inherent volatility of the cryptocurrency market and the importance of risk management. Investors should remain vigilant and conduct thorough research before making any decisions.
This information is for educational purposes only and does not constitute financial advice.
#BTCFallsBelow$81K
This price action underscores the inherent volatility of the cryptocurrency market and the importance of risk management. Investors should remain vigilant and conduct thorough research before making any decisions.
This information is for educational purposes only and does not constitute financial advice.
#BTCFallsBelow$81K
14

#BTCFallsBelow$81K
$BTC 80,893 - my bot watches the dip as risk-off sentiment hits.
BTC price is 80,893 USDT on the exchange.
The news mood is risk-off (-0.27) with no systemic shock.
Equity sits at 192.89 USDT, down 36.17% since start.
With a daily bias still “up” and a 4h uptrend, the bot stays on the sidelines because the risk-off mood blocks new long entries.
No open positions are held; all stops are already on the exchange.
If today’s news stayed risk-off, the bot would simply wait for a clearer signal before adding any alt longs.
Levels I'm watching on BTC: 80,893 USDT, 0.43 USDT
Follow to watch a real bot account (started with 100 USDT) survive in public, one rule at a time.
#BTCFallsBelow$81K #TheSurvivorBot
#BTCFallsBelow$81K
$BTC 80,893 - my bot watches the dip as risk-off sentiment hits.
BTC price is 80,893 USDT on the exchange.
The news mood is risk-off (-0.27) with no systemic shock.
Equity sits at 192.89 USDT, down 36.17% since start.
With a daily bias still “up” and a 4h uptrend, the bot stays on the sidelines because the risk-off mood blocks new long entries.
No open positions are held; all stops are already on the exchange.
If today’s news stayed risk-off, the bot would simply wait for a clearer signal before adding any alt longs.
Levels I'm watching on BTC: 80,893 USDT, 0.43 USDT
Follow to watch a real bot account (started with 100 USDT) survive in public, one rule at a time.
#BTCFallsBelow$81K #TheSurvivorBot
$BTC 80,893 - my bot watches the dip as risk-off sentiment hits.
BTC price is 80,893 USDT on the exchange.
The news mood is risk-off (-0.27) with no systemic shock.
Equity sits at 192.89 USDT, down 36.17% since start.
With a daily bias still “up” and a 4h uptrend, the bot stays on the sidelines because the risk-off mood blocks new long entries.
No open positions are held; all stops are already on the exchange.
If today’s news stayed risk-off, the bot would simply wait for a clearer signal before adding any alt longs.
Levels I'm watching on BTC: 80,893 USDT, 0.43 USDT
Follow to watch a real bot account (started with 100 USDT) survive in public, one rule at a time.
#BTCFallsBelow$81K #TheSurvivorBot
49
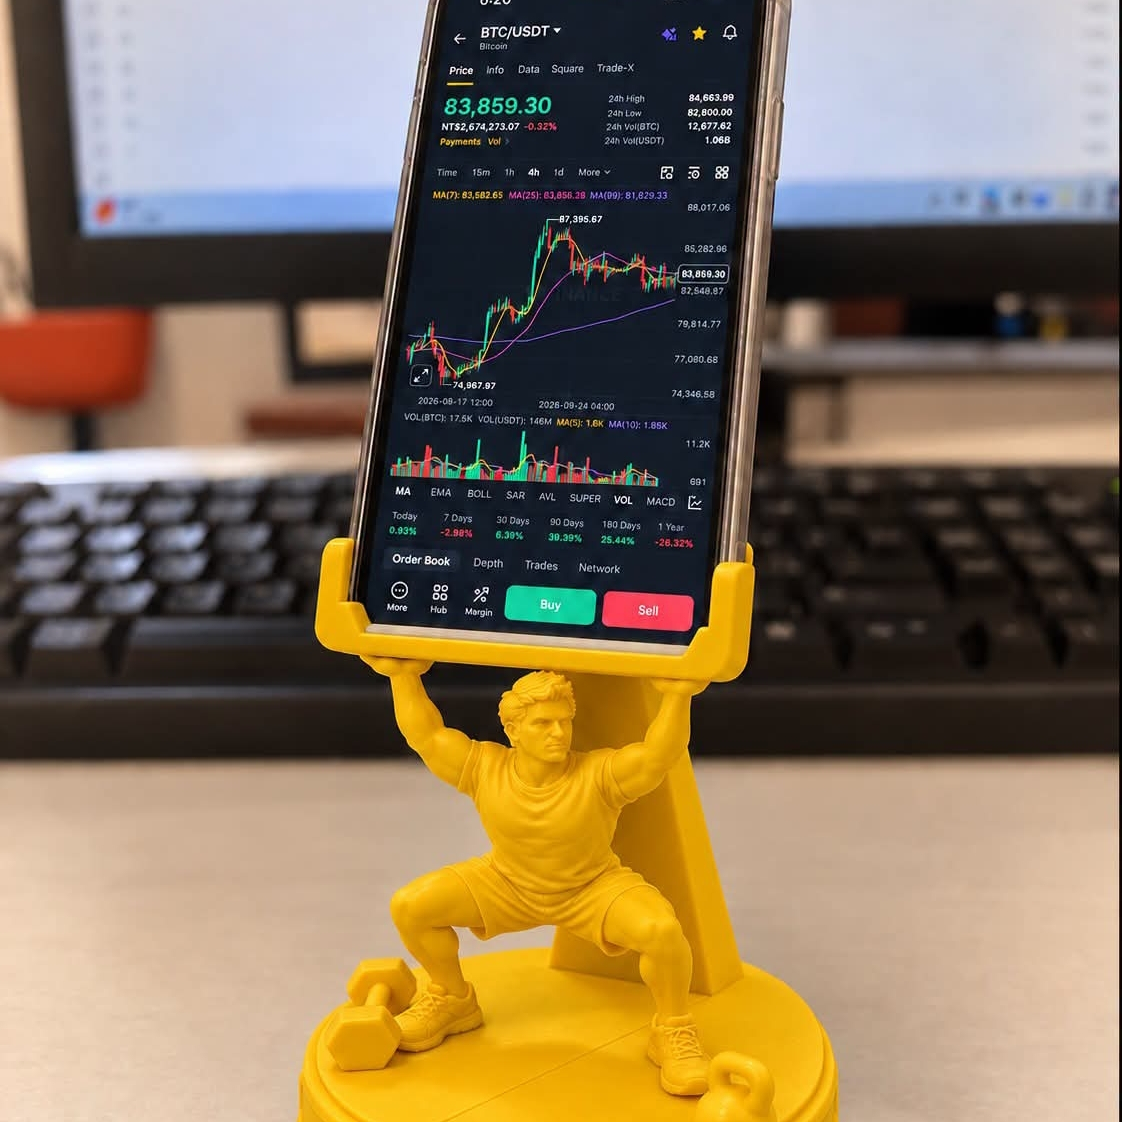
#BTCFallsBelow $BTC
BTCFallsBelow$81K
Bitcoin -3% to $80,983 early Oct 15!
Broke $83K-$84K tight range 📉
Market cap $1.68T
WHY DUMP?
🇺🇸 CPI 3.7% vs 3.4% est - HOT!
📈 10Y Yield 5.31%
💸 ETF outflow $150.5M (Oct 14)
Fed Oct hike odds 50% -> 26%
LIQUIDATIONS:
$485M to $1B wiped - Mostly longs!
Support broke $82.5K - Next $80K?
#BTCFallsBelow81K $BTC #Bitcoin #BTC #BreakingNews
#BTCFallsBelow $BTC
BTCFallsBelow$81K
Bitcoin -3% to $80,983 early Oct 15!
Broke $83K-$84K tight range 📉
Market cap $1.68T
WHY DUMP?
🇺🇸 CPI 3.7% vs 3.4% est - HOT!
📈 10Y Yield 5.31%
💸 ETF outflow $150.5M (Oct 14)
Fed Oct hike odds 50% -> 26%
LIQUIDATIONS:
$485M to $1B wiped - Mostly longs!
Support broke $82.5K - Next $80K?
#BTCFallsBelow81K $BTC #Bitcoin #BTC #BreakingNews
BTCFallsBelow$81K
Bitcoin -3% to $80,983 early Oct 15!
Broke $83K-$84K tight range 📉
Market cap $1.68T
WHY DUMP?
🇺🇸 CPI 3.7% vs 3.4% est - HOT!
📈 10Y Yield 5.31%
💸 ETF outflow $150.5M (Oct 14)
Fed Oct hike odds 50% -> 26%
LIQUIDATIONS:
$485M to $1B wiped - Mostly longs!
Support broke $82.5K - Next $80K?
#BTCFallsBelow81K $BTC #Bitcoin #BTC #BreakingNews
1
66

Verified
$BTC fell below $81,000 shortly after September CPI came in hotter than expected, at 3.7%
U.S. inflation data released last night came in above market expectations. $BTC plunged from around $83,500 to below $81,000 in just a few hours and is now trading around $80,900, down more than 3% in 24 hours.
Multiple sources confirmed the 3.7% CPI reading, and traders on Square are calling it the hottest CPI session in recent memory.
Interest rate futures markets are betting that the Fed will have to raise rates a few more times before year-end, but no one knows for sure what the Fed will decide at its next meeting.
Anyone holding a short-term long position without a stop-loss must have felt the full force of last night’s move.
What to watch today: can $BTC hold above $80,000, or will it fall further?
Personal observation, not investment advice
#USSeptemberCPIRisesTo3.7% #BTCFallsBelow$81K #CPIWatch
$BTC fell below $81,000 shortly after September CPI came in hotter than expected, at 3.7%
U.S. inflation data released last night came in above market expectations. $BTC plunged from around $83,500 to below $81,000 in just a few hours and is now trading around $80,900, down more than 3% in 24 hours.
Multiple sources confirmed the 3.7% CPI reading, and traders on Square are calling it the hottest CPI session in recent memory.
Interest rate futures markets are betting that the Fed will have to raise rates a few more times before year-end, but no one knows for sure what the Fed will decide at its next meeting.
Anyone holding a short-term long position without a stop-loss must have felt the full force of last night’s move.
What to watch today: can $BTC hold above $80,000, or will it fall further?
Personal observation, not investment advice
#USSeptemberCPIRisesTo3.7% #BTCFallsBelow$81K #CPIWatch
U.S. inflation data released last night came in above market expectations. $BTC plunged from around $83,500 to below $81,000 in just a few hours and is now trading around $80,900, down more than 3% in 24 hours.
Multiple sources confirmed the 3.7% CPI reading, and traders on Square are calling it the hottest CPI session in recent memory.
Interest rate futures markets are betting that the Fed will have to raise rates a few more times before year-end, but no one knows for sure what the Fed will decide at its next meeting.
Anyone holding a short-term long position without a stop-loss must have felt the full force of last night’s move.
What to watch today: can $BTC hold above $80,000, or will it fall further?
Personal observation, not investment advice
#USSeptemberCPIRisesTo3.7% #BTCFallsBelow$81K #CPIWatch
2.3k

·
--
Bitcoin’s $80,000 line of defense almost gave way this morning.
In the early hours of October 15 in Asia, $BTC briefly fell to around $80,226, just a step away from the psychologically important $80,000 mark. Buyers quickly pushed the price back above $81,000, but it was still down more than 3% over 24 hours. This wasn’t an ordinary pullback—it was the market pricing in fears of a Fed rate hike after inflation data came in hotter than expected.
The trigger was clear. On the evening of October 14 Beijing time, U.S. September CPI came in above expectations across the board: 3.7% year over year (vs. 3.6% expected), core CPI up 0.3% month over month (vs. 0.2% expected), and core CPI up 2.6% year over year (vs. 2.5% expected). Gasoline prices surged 9.1% in a single month, accounting for more than half of the monthly increase. After the data came out, the probability of a 25-basis-point rate hike on October 28 shown by CME FedWatch briefly jumped from 22% to 47%–53.7%, before falling back to around 26%. The market may have been saying a rate hold was “highly likely,” but price action told the truth: it sold off hard.
Two other factors helped fuel the sell-off. First, Asian stock markets plunged across the board: South Korea’s KOSPI plunged 8%, triggering a circuit breaker, while the Nikkei 225 fell 5.2%. The resulting wave of risk aversion spilled over into crypto. Second, leveraged positions were liquidated in a cascade: nearly $1 billion in liquidations across the market over 24 hours. $ETH was hit even harder—a 6.5% drop took it back to around $2,353, with $286 million in liquidations, exceeding Bitcoin’s $197 million. As prices fell, leveraged long positions added to the pressure.
Institutional investors are voting with their feet, too. On October 14, U.S. spot Bitcoin ETFs saw net outflows of $150.5 million, wiping out almost all of the previous day’s $175.7 million in net inflows. On top of that, the 10-year Treasury yield climbed to 5.329%, approaching a 24-year high. “Higher rates for longer” is systematically weighing on all risk assets.
For now, $80,000 is the final line of defense in this correction. Over the past few weeks, buyers have stepped in every time Bitcoin retreated to the $80,000–$81,000 range. If that level is decisively breached, the only meaningful support below is near the September 15 low of $75,000. But the bulls still have a few cards to play: Treasury yields have pulled back from their highs, the dollar index has caught its breath after reaching an 18-month high, and rate-hike odds have been cut in half from their peak. The most intense phase of macro pressure may be passing.
Two key levels to watch in the short term: if $80,000 holds, bulls can still look toward the $83,000–$84,500 resistance zone; if it fails, Bitcoin will have to face a test of $75,000. The next catalysts are clear: tonight’s PPI, retail sales, and initial jobless claims data, along with every comment from Fed officials ahead of the October 28 FOMC meeting.
After a triple blow from inflation, rate-hike expectations, and the stock market, Bitcoin is standing on the edge of an $80,000 cliff. If it can’t hold this line, October will most likely close in the red.
This is not investment advice. DYOR; trading involves risk.
#BTCFallsBelow$81K
#BTC #CPI
Bitcoin’s $80,000 line of defense almost gave way this morning.
In the early hours of October 15 in Asia, $BTC briefly fell to around $80,226, just a step away from the psychologically important $80,000 mark. Buyers quickly pushed the price back above $81,000, but it was still down more than 3% over 24 hours. This wasn’t an ordinary pullback—it was the market pricing in fears of a Fed rate hike after inflation data came in hotter than expected.
The trigger was clear. On the evening of October 14 Beijing time, U.S. September CPI came in above expectations across the board: 3.7% year over year (vs. 3.6% expected), core CPI up 0.3% month over month (vs. 0.2% expected), and core CPI up 2.6% year over year (vs. 2.5% expected). Gasoline prices surged 9.1% in a single month, accounting for more than half of the monthly increase. After the data came out, the probability of a 25-basis-point rate hike on October 28 shown by CME FedWatch briefly jumped from 22% to 47%–53.7%, before falling back to around 26%. The market may have been saying a rate hold was “highly likely,” but price action told the truth: it sold off hard.
Two other factors helped fuel the sell-off. First, Asian stock markets plunged across the board: South Korea’s KOSPI plunged 8%, triggering a circuit breaker, while the Nikkei 225 fell 5.2%. The resulting wave of risk aversion spilled over into crypto. Second, leveraged positions were liquidated in a cascade: nearly $1 billion in liquidations across the market over 24 hours. $ETH was hit even harder—a 6.5% drop took it back to around $2,353, with $286 million in liquidations, exceeding Bitcoin’s $197 million. As prices fell, leveraged long positions added to the pressure.
Institutional investors are voting with their feet, too. On October 14, U.S. spot Bitcoin ETFs saw net outflows of $150.5 million, wiping out almost all of the previous day’s $175.7 million in net inflows. On top of that, the 10-year Treasury yield climbed to 5.329%, approaching a 24-year high. “Higher rates for longer” is systematically weighing on all risk assets.
For now, $80,000 is the final line of defense in this correction. Over the past few weeks, buyers have stepped in every time Bitcoin retreated to the $80,000–$81,000 range. If that level is decisively breached, the only meaningful support below is near the September 15 low of $75,000. But the bulls still have a few cards to play: Treasury yields have pulled back from their highs, the dollar index has caught its breath after reaching an 18-month high, and rate-hike odds have been cut in half from their peak. The most intense phase of macro pressure may be passing.
Two key levels to watch in the short term: if $80,000 holds, bulls can still look toward the $83,000–$84,500 resistance zone; if it fails, Bitcoin will have to face a test of $75,000. The next catalysts are clear: tonight’s PPI, retail sales, and initial jobless claims data, along with every comment from Fed officials ahead of the October 28 FOMC meeting.
After a triple blow from inflation, rate-hike expectations, and the stock market, Bitcoin is standing on the edge of an $80,000 cliff. If it can’t hold this line, October will most likely close in the red.
This is not investment advice. DYOR; trading involves risk.
#BTCFallsBelow$81K
#BTC #CPI
In the early hours of October 15 in Asia, $BTC briefly fell to around $80,226, just a step away from the psychologically important $80,000 mark. Buyers quickly pushed the price back above $81,000, but it was still down more than 3% over 24 hours. This wasn’t an ordinary pullback—it was the market pricing in fears of a Fed rate hike after inflation data came in hotter than expected.
The trigger was clear. On the evening of October 14 Beijing time, U.S. September CPI came in above expectations across the board: 3.7% year over year (vs. 3.6% expected), core CPI up 0.3% month over month (vs. 0.2% expected), and core CPI up 2.6% year over year (vs. 2.5% expected). Gasoline prices surged 9.1% in a single month, accounting for more than half of the monthly increase. After the data came out, the probability of a 25-basis-point rate hike on October 28 shown by CME FedWatch briefly jumped from 22% to 47%–53.7%, before falling back to around 26%. The market may have been saying a rate hold was “highly likely,” but price action told the truth: it sold off hard.
Two other factors helped fuel the sell-off. First, Asian stock markets plunged across the board: South Korea’s KOSPI plunged 8%, triggering a circuit breaker, while the Nikkei 225 fell 5.2%. The resulting wave of risk aversion spilled over into crypto. Second, leveraged positions were liquidated in a cascade: nearly $1 billion in liquidations across the market over 24 hours. $ETH was hit even harder—a 6.5% drop took it back to around $2,353, with $286 million in liquidations, exceeding Bitcoin’s $197 million. As prices fell, leveraged long positions added to the pressure.
Institutional investors are voting with their feet, too. On October 14, U.S. spot Bitcoin ETFs saw net outflows of $150.5 million, wiping out almost all of the previous day’s $175.7 million in net inflows. On top of that, the 10-year Treasury yield climbed to 5.329%, approaching a 24-year high. “Higher rates for longer” is systematically weighing on all risk assets.
For now, $80,000 is the final line of defense in this correction. Over the past few weeks, buyers have stepped in every time Bitcoin retreated to the $80,000–$81,000 range. If that level is decisively breached, the only meaningful support below is near the September 15 low of $75,000. But the bulls still have a few cards to play: Treasury yields have pulled back from their highs, the dollar index has caught its breath after reaching an 18-month high, and rate-hike odds have been cut in half from their peak. The most intense phase of macro pressure may be passing.
Two key levels to watch in the short term: if $80,000 holds, bulls can still look toward the $83,000–$84,500 resistance zone; if it fails, Bitcoin will have to face a test of $75,000. The next catalysts are clear: tonight’s PPI, retail sales, and initial jobless claims data, along with every comment from Fed officials ahead of the October 28 FOMC meeting.
After a triple blow from inflation, rate-hike expectations, and the stock market, Bitcoin is standing on the edge of an $80,000 cliff. If it can’t hold this line, October will most likely close in the red.
This is not investment advice. DYOR; trading involves risk.
#BTCFallsBelow$81K
#BTC #CPI
1
U.S. September CPI Surges to 3.7%, Dealing a Double Blow to Crypto Markets and Tokenized U.S. Stocks
I. Inflation Exceeds Expectations, Spreading Fear Across Markets
The latest September Consumer Price Index data released by the U.S. Department of Labor showed that headline CPI rose 3.7% year over year, above market expectations of 3.6%. Core CPI rose 2.6% year over year, also exceeding the forecast of 2.5%. Both figures reached their highest levels in several months, immediately triggering a sell-off in global risk assets. Bitcoin quickly fell from around $83,400 to below the $82,000 mark, while Ethereum dropped more than 5% in a single day. Total liquidations across the crypto market exceeded $400 million. More importantly, the implied probability of a rate hike at the late-October FOMC meeting, as priced by federal funds futures, surged from less than 30% to 43%. This suggests that markets are repricing the Federal Reserve’s monetary policy outlook.
II. Institutional Views Diverge, Bitcoin ETF Flows Split
Amid macroeconomic pressure, institutional investors have taken noticeably different approaches. According to Farside Investors, spot Bitcoin ETFs recorded net inflows of $175 million on October 13, ending several consecutive days of net outflows. On a weekly basis, however, ETFs still saw cumulative net outflows of $618 million over the past seven days, indicating exceptionally intense short-term capital flows. Glassnode noted that the $80,000–$88,000 range is a key battleground for the market, while the ETF cost basis of around $81,500 provides an important structural support level. Meanwhile, asset manager Strive made a major purchase against the trend, spending $235 million to acquire 2,822 Bitcoin between October 12 and 13. This brought its total holdings to 35,595 BTC, marking its largest weekly purchase since January 2026. This move coincided with Standard Chartered’s launch of direct Bitcoin and Ethereum trading services for clients in the UAE, suggesting that some institutions are still actively positioning themselves during the pullback.
III. Volatility Rises in Tokenized U.S. Stocks, with Some Assets Rallying Against the Trend
While the broader crypto market has been under pressure, the tokenized U.S. stock market has shown signs of divergence. Data shows that some tokenized U.S. stocks have risen sharply in recent days. The ZEREBRO token gained as much as 49.4% in a single day, reaching $0.0412, with trading volume exceeding $217 million. The BSP token rose 40% to $53.09, with trading volume reaching $87.15 million. The ARC token also climbed 32.7%. These figures show that, at the intersection of traditional U.S. equities and crypto markets, capital is seeking new arbitrage opportunities and sources of value. As a bridge between traditional finance and on-chain finance, tokenized U.S. stocks are seeing increased trading activity, reflecting investors’ strong demand for diversified asset allocation.
IV. Binance Square Community Sentiment Leans Cautious, with CPI Dominating Discussion
According to community data from Binance Square, SOL ranked first in popularity over the past 24 hours with 24,427 mentions, followed by BTC with 21,319 and BNB with 17,216. Notably, bullish and bearish sentiment on BTC was relatively evenly split, with 825 bullish votes and 523 bearish votes, indicating considerable disagreement within the community about the market outlook. Among trending hashtags, CPIWatch ranked well ahead of the others, with more than 510,000 posts and 89.31 million views. The BTCFallsBelow81K topic also quickly drew attention, reflecting how inflation data and Bitcoin’s price movements are the two main subjects of discussion in the community.
V. Market Outlook and Risk Warning
Overall, the market impact of the higher-than-expected CPI data may continue to unfold. In the short term, close attention should be paid to the outcome of the October 27–28 FOMC meeting and to subsequent comments from Fed officials. If expectations of rate hikes rise further, risk assets could face greater downward pressure. From a medium- to long-term perspective, however, institutional buying against the trend, support from ETF cost bases, and the ongoing development of innovative products such as tokenized U.S. stocks provide the market with some underlying resilience. In the current environment, investors should remain cautious, manage position sizes appropriately, and monitor how changes in macroeconomic data feed through to asset prices.
#CPIWatch #BTCFallsBelow$81K #TokenizedUSStocks
U.S. September CPI Surges to 3.7%, Dealing a Double Blow to Crypto Markets and Tokenized U.S. Stocks
I. Inflation Exceeds Expectations, Spreading Fear Across Markets
The latest September Consumer Price Index data released by the U.S. Department of Labor showed that headline CPI rose 3.7% year over year, above market expectations of 3.6%. Core CPI rose 2.6% year over year, also exceeding the forecast of 2.5%. Both figures reached their highest levels in several months, immediately triggering a sell-off in global risk assets. Bitcoin quickly fell from around $83,400 to below the $82,000 mark, while Ethereum dropped more than 5% in a single day. Total liquidations across the crypto market exceeded $400 million. More importantly, the implied probability of a rate hike at the late-October FOMC meeting, as priced by federal funds futures, surged from less than 30% to 43%. This suggests that markets are repricing the Federal Reserve’s monetary policy outlook.
II. Institutional Views Diverge, Bitcoin ETF Flows Split
Amid macroeconomic pressure, institutional investors have taken noticeably different approaches. According to Farside Investors, spot Bitcoin ETFs recorded net inflows of $175 million on October 13, ending several consecutive days of net outflows. On a weekly basis, however, ETFs still saw cumulative net outflows of $618 million over the past seven days, indicating exceptionally intense short-term capital flows. Glassnode noted that the $80,000–$88,000 range is a key battleground for the market, while the ETF cost basis of around $81,500 provides an important structural support level. Meanwhile, asset manager Strive made a major purchase against the trend, spending $235 million to acquire 2,822 Bitcoin between October 12 and 13. This brought its total holdings to 35,595 BTC, marking its largest weekly purchase since January 2026. This move coincided with Standard Chartered’s launch of direct Bitcoin and Ethereum trading services for clients in the UAE, suggesting that some institutions are still actively positioning themselves during the pullback.
III. Volatility Rises in Tokenized U.S. Stocks, with Some Assets Rallying Against the Trend
While the broader crypto market has been under pressure, the tokenized U.S. stock market has shown signs of divergence. Data shows that some tokenized U.S. stocks have risen sharply in recent days. The ZEREBRO token gained as much as 49.4% in a single day, reaching $0.0412, with trading volume exceeding $217 million. The BSP token rose 40% to $53.09, with trading volume reaching $87.15 million. The ARC token also climbed 32.7%. These figures show that, at the intersection of traditional U.S. equities and crypto markets, capital is seeking new arbitrage opportunities and sources of value. As a bridge between traditional finance and on-chain finance, tokenized U.S. stocks are seeing increased trading activity, reflecting investors’ strong demand for diversified asset allocation.
IV. Binance Square Community Sentiment Leans Cautious, with CPI Dominating Discussion
According to community data from Binance Square, SOL ranked first in popularity over the past 24 hours with 24,427 mentions, followed by BTC with 21,319 and BNB with 17,216. Notably, bullish and bearish sentiment on BTC was relatively evenly split, with 825 bullish votes and 523 bearish votes, indicating considerable disagreement within the community about the market outlook. Among trending hashtags, CPIWatch ranked well ahead of the others, with more than 510,000 posts and 89.31 million views. The BTCFallsBelow81K topic also quickly drew attention, reflecting how inflation data and Bitcoin’s price movements are the two main subjects of discussion in the community.
V. Market Outlook and Risk Warning
Overall, the market impact of the higher-than-expected CPI data may continue to unfold. In the short term, close attention should be paid to the outcome of the October 27–28 FOMC meeting and to subsequent comments from Fed officials. If expectations of rate hikes rise further, risk assets could face greater downward pressure. From a medium- to long-term perspective, however, institutional buying against the trend, support from ETF cost bases, and the ongoing development of innovative products such as tokenized U.S. stocks provide the market with some underlying resilience. In the current environment, investors should remain cautious, manage position sizes appropriately, and monitor how changes in macroeconomic data feed through to asset prices.
#CPIWatch #BTCFallsBelow$81K #TokenizedUSStocks
I. Inflation Exceeds Expectations, Spreading Fear Across Markets
The latest September Consumer Price Index data released by the U.S. Department of Labor showed that headline CPI rose 3.7% year over year, above market expectations of 3.6%. Core CPI rose 2.6% year over year, also exceeding the forecast of 2.5%. Both figures reached their highest levels in several months, immediately triggering a sell-off in global risk assets. Bitcoin quickly fell from around $83,400 to below the $82,000 mark, while Ethereum dropped more than 5% in a single day. Total liquidations across the crypto market exceeded $400 million. More importantly, the implied probability of a rate hike at the late-October FOMC meeting, as priced by federal funds futures, surged from less than 30% to 43%. This suggests that markets are repricing the Federal Reserve’s monetary policy outlook.
II. Institutional Views Diverge, Bitcoin ETF Flows Split
Amid macroeconomic pressure, institutional investors have taken noticeably different approaches. According to Farside Investors, spot Bitcoin ETFs recorded net inflows of $175 million on October 13, ending several consecutive days of net outflows. On a weekly basis, however, ETFs still saw cumulative net outflows of $618 million over the past seven days, indicating exceptionally intense short-term capital flows. Glassnode noted that the $80,000–$88,000 range is a key battleground for the market, while the ETF cost basis of around $81,500 provides an important structural support level. Meanwhile, asset manager Strive made a major purchase against the trend, spending $235 million to acquire 2,822 Bitcoin between October 12 and 13. This brought its total holdings to 35,595 BTC, marking its largest weekly purchase since January 2026. This move coincided with Standard Chartered’s launch of direct Bitcoin and Ethereum trading services for clients in the UAE, suggesting that some institutions are still actively positioning themselves during the pullback.
III. Volatility Rises in Tokenized U.S. Stocks, with Some Assets Rallying Against the Trend
While the broader crypto market has been under pressure, the tokenized U.S. stock market has shown signs of divergence. Data shows that some tokenized U.S. stocks have risen sharply in recent days. The ZEREBRO token gained as much as 49.4% in a single day, reaching $0.0412, with trading volume exceeding $217 million. The BSP token rose 40% to $53.09, with trading volume reaching $87.15 million. The ARC token also climbed 32.7%. These figures show that, at the intersection of traditional U.S. equities and crypto markets, capital is seeking new arbitrage opportunities and sources of value. As a bridge between traditional finance and on-chain finance, tokenized U.S. stocks are seeing increased trading activity, reflecting investors’ strong demand for diversified asset allocation.
IV. Binance Square Community Sentiment Leans Cautious, with CPI Dominating Discussion
According to community data from Binance Square, SOL ranked first in popularity over the past 24 hours with 24,427 mentions, followed by BTC with 21,319 and BNB with 17,216. Notably, bullish and bearish sentiment on BTC was relatively evenly split, with 825 bullish votes and 523 bearish votes, indicating considerable disagreement within the community about the market outlook. Among trending hashtags, CPIWatch ranked well ahead of the others, with more than 510,000 posts and 89.31 million views. The BTCFallsBelow81K topic also quickly drew attention, reflecting how inflation data and Bitcoin’s price movements are the two main subjects of discussion in the community.
V. Market Outlook and Risk Warning
Overall, the market impact of the higher-than-expected CPI data may continue to unfold. In the short term, close attention should be paid to the outcome of the October 27–28 FOMC meeting and to subsequent comments from Fed officials. If expectations of rate hikes rise further, risk assets could face greater downward pressure. From a medium- to long-term perspective, however, institutional buying against the trend, support from ETF cost bases, and the ongoing development of innovative products such as tokenized U.S. stocks provide the market with some underlying resilience. In the current environment, investors should remain cautious, manage position sizes appropriately, and monitor how changes in macroeconomic data feed through to asset prices.
#CPIWatch #BTCFallsBelow$81K #TokenizedUSStocks
·
--
$BTC has fallen back below $81,000. Last night’s rebound ultimately failed to hold through the Asian session.
It’s simple: the aftershocks of the hot CPI report are still being felt. U.S. September CPI rose 3.7% year over year (vs. 3.6% expected), while core CPI came in at 2.6% (vs. 2.5% expected). Energy prices, up 5.2% month over month, and gasoline, up 9.1%, were the biggest drivers. Inflation isn’t cooling, so rate-hike bets aren’t fading—in October, the probability of a hike briefly surged to nearly 50%. It now stands at about 26% on CME FedWatch and around 30% on Polymarket. The macro squeeze will remain in place until the Fed’s October 27–28 meeting.
More damaging still: the “floor” is gone. U.S. spot Bitcoin ETFs saw net outflows of $150.5 million on October 14, after taking in $175.7 million the day before—institutional money changed direction in just 24 hours. The previous week (October 5–9) had already seen $681 million in net outflows. With institutional buying bleeding out day after day, there’s nothing left to prop up the price.
As a result, $BTC fell below $81,000 again in the early Asian session, down more than 2% in 24 hours. After nearing the $80,000 mark on Wednesday, it rebounded to $81,500—but those gains have now been completely erased. ETH, SOL, and XRP fell in tandem by 3.5%–4%, with ETH still struggling below $2,500. Among the top 100 coins, only PYTH was still up, gaining 7%. McGlone of Bloomberg Intelligence warned that the $BTC 50-week moving average has turned downward, “looking very much like 2022.”
The $81,000 level has become a psychological battleground between bulls and bears. To the downside, if $81,603 is decisively breached, the next support levels are $80,365 and $78,003. To the upside, it needs to reclaim $83,000 to show that the market has fully absorbed the hot CPI report.
Tonight at 20:30 Beijing time, PPI, retail sales, and initial jobless claims all come out at once. The next CPI report is due November 10. Tonight’s data will be the next test in determining whether October will see a break below $80,000.
#BTCFallsBelow$81K
#BTC #CPI
$BTC $ETH $SOL
The above is not investment advice. DYOR; trading involves risk.
$BTC has fallen back below $81,000. Last night’s rebound ultimately failed to hold through the Asian session.
It’s simple: the aftershocks of the hot CPI report are still being felt. U.S. September CPI rose 3.7% year over year (vs. 3.6% expected), while core CPI came in at 2.6% (vs. 2.5% expected). Energy prices, up 5.2% month over month, and gasoline, up 9.1%, were the biggest drivers. Inflation isn’t cooling, so rate-hike bets aren’t fading—in October, the probability of a hike briefly surged to nearly 50%. It now stands at about 26% on CME FedWatch and around 30% on Polymarket. The macro squeeze will remain in place until the Fed’s October 27–28 meeting.
More damaging still: the “floor” is gone. U.S. spot Bitcoin ETFs saw net outflows of $150.5 million on October 14, after taking in $175.7 million the day before—institutional money changed direction in just 24 hours. The previous week (October 5–9) had already seen $681 million in net outflows. With institutional buying bleeding out day after day, there’s nothing left to prop up the price.
As a result, $BTC fell below $81,000 again in the early Asian session, down more than 2% in 24 hours. After nearing the $80,000 mark on Wednesday, it rebounded to $81,500—but those gains have now been completely erased. ETH, SOL, and XRP fell in tandem by 3.5%–4%, with ETH still struggling below $2,500. Among the top 100 coins, only PYTH was still up, gaining 7%. McGlone of Bloomberg Intelligence warned that the $BTC 50-week moving average has turned downward, “looking very much like 2022.”
The $81,000 level has become a psychological battleground between bulls and bears. To the downside, if $81,603 is decisively breached, the next support levels are $80,365 and $78,003. To the upside, it needs to reclaim $83,000 to show that the market has fully absorbed the hot CPI report.
Tonight at 20:30 Beijing time, PPI, retail sales, and initial jobless claims all come out at once. The next CPI report is due November 10. Tonight’s data will be the next test in determining whether October will see a break below $80,000.
#BTCFallsBelow$81K
#BTC #CPI
$BTC $ETH $SOL
The above is not investment advice. DYOR; trading involves risk.
It’s simple: the aftershocks of the hot CPI report are still being felt. U.S. September CPI rose 3.7% year over year (vs. 3.6% expected), while core CPI came in at 2.6% (vs. 2.5% expected). Energy prices, up 5.2% month over month, and gasoline, up 9.1%, were the biggest drivers. Inflation isn’t cooling, so rate-hike bets aren’t fading—in October, the probability of a hike briefly surged to nearly 50%. It now stands at about 26% on CME FedWatch and around 30% on Polymarket. The macro squeeze will remain in place until the Fed’s October 27–28 meeting.
More damaging still: the “floor” is gone. U.S. spot Bitcoin ETFs saw net outflows of $150.5 million on October 14, after taking in $175.7 million the day before—institutional money changed direction in just 24 hours. The previous week (October 5–9) had already seen $681 million in net outflows. With institutional buying bleeding out day after day, there’s nothing left to prop up the price.
As a result, $BTC fell below $81,000 again in the early Asian session, down more than 2% in 24 hours. After nearing the $80,000 mark on Wednesday, it rebounded to $81,500—but those gains have now been completely erased. ETH, SOL, and XRP fell in tandem by 3.5%–4%, with ETH still struggling below $2,500. Among the top 100 coins, only PYTH was still up, gaining 7%. McGlone of Bloomberg Intelligence warned that the $BTC 50-week moving average has turned downward, “looking very much like 2022.”
The $81,000 level has become a psychological battleground between bulls and bears. To the downside, if $81,603 is decisively breached, the next support levels are $80,365 and $78,003. To the upside, it needs to reclaim $83,000 to show that the market has fully absorbed the hot CPI report.
Tonight at 20:30 Beijing time, PPI, retail sales, and initial jobless claims all come out at once. The next CPI report is due November 10. Tonight’s data will be the next test in determining whether October will see a break below $80,000.
#BTCFallsBelow$81K
#BTC #CPI
$BTC $ETH $SOL
The above is not investment advice. DYOR; trading involves risk.
3

·
--
BTC rebounds after falling below $81K | Inflation pressures persist | Wait for stability before considering entry
My stance is to prioritize defense. I’m not treating a rebound after a breakdown as a trend reversal. The current trending topic on Binance Square is #BTCFallsBelow$81K, which does reflect the price action right now rather than just recirculating old news. At the time of writing, BTC/USD on Kraken was around $80,835, with an intraday low of $80,150. It has rebounded from the low, but remains below the day’s open of about $81,577. CoinGecko likewise showed a price of around $80,855, down about 3.5% over 24 hours. So it’s accurate to say that BTC “fell below $81K and is now rebounding,” but not that it has “stabilized back above $81K”—and it would be an exaggeration to describe a touch of $80,150 as a break below $80,000.
The news backdrop is worth considering too, but the causal links should be kept separate. The U.S. Bureau of Labor Statistics reported yesterday that September CPI was up 3.7% year over year and 0.6% month over month, with gasoline up 9.1% month over month. The Fed’s Beige Book, published the same day, said oil-price pressures were widespread across districts, while overall employment changed little in most districts. The former is statistical data; the latter is a summary of business interviews through October 5. Neither means the Fed has announced another rate hike. The potential transmission mechanism for BTC is that persistent inflation could raise expectations that rates will stay higher for longer, increasing the opportunity cost of holding cash and bonds and potentially making risk assets more sensitive to deleveraging. But based on this information alone, it’s impossible to prove that every dollar of today’s decline was caused by CPI.
Institutional flows also shouldn’t be reduced to a single bearish headline. In Farside’s October 14 U.S. spot BTC fund table, FBTC showed about $152.7 million in outflows and BITB about $2.2 million in inflows, for an automatically calculated preliminary net outflow of about $150.5 million. IBIT was still blank, so this preliminary figure is not the final net total for the entire market. If we use only partial fund data to claim that institutions are exiting across the board after the price fell below $81K, we’d be treating unreported figures as zero. What I’ll be watching next is whether BTC can reclaim and hold $81K, whether the $80,000 round-number level attracts genuine buying, and whether the direction changes once the remaining ETF data comes in.
If I were trading this myself, I wouldn’t chase the rebound or use high leverage. I’d consider a long position only if BTC gets back above $81,300, holds above $81,000 on a retest, and volume picks up—with a position size of no more than 3% of my total capital. I’d first look to the intraday high near $81,800 and cut the position in half if it reaches that level; I’d then look toward $83,000 with the remainder and move my stop loss higher. I’d place my initial stop below $80,100. If, after entering, BTC falls back below $81,000 and repeatedly fails to reclaim it, I’d close the position proactively rather than wait for a slogan to save it. If it first loses $80,000 and the rebound is weak, I’d cancel the long plan and stay in cash. Conversely, I’d reconsider my current defensive stance only if BTC sustainably reclaims $81,800 and the complete ETF data does not show further deterioration.
#BTCFallsBelow$81K #BTC
The above is solely my personal market observation and does not constitute investment advice.
BTC rebounds after falling below $81K | Inflation pressures persist | Wait for stability before considering entry
My stance is to prioritize defense. I’m not treating a rebound after a breakdown as a trend reversal. The current trending topic on Binance Square is #BTCFallsBelow$81K, which does reflect the price action right now rather than just recirculating old news. At the time of writing, BTC/USD on Kraken was around $80,835, with an intraday low of $80,150. It has rebounded from the low, but remains below the day’s open of about $81,577. CoinGecko likewise showed a price of around $80,855, down about 3.5% over 24 hours. So it’s accurate to say that BTC “fell below $81K and is now rebounding,” but not that it has “stabilized back above $81K”—and it would be an exaggeration to describe a touch of $80,150 as a break below $80,000.
The news backdrop is worth considering too, but the causal links should be kept separate. The U.S. Bureau of Labor Statistics reported yesterday that September CPI was up 3.7% year over year and 0.6% month over month, with gasoline up 9.1% month over month. The Fed’s Beige Book, published the same day, said oil-price pressures were widespread across districts, while overall employment changed little in most districts. The former is statistical data; the latter is a summary of business interviews through October 5. Neither means the Fed has announced another rate hike. The potential transmission mechanism for BTC is that persistent inflation could raise expectations that rates will stay higher for longer, increasing the opportunity cost of holding cash and bonds and potentially making risk assets more sensitive to deleveraging. But based on this information alone, it’s impossible to prove that every dollar of today’s decline was caused by CPI.
Institutional flows also shouldn’t be reduced to a single bearish headline. In Farside’s October 14 U.S. spot BTC fund table, FBTC showed about $152.7 million in outflows and BITB about $2.2 million in inflows, for an automatically calculated preliminary net outflow of about $150.5 million. IBIT was still blank, so this preliminary figure is not the final net total for the entire market. If we use only partial fund data to claim that institutions are exiting across the board after the price fell below $81K, we’d be treating unreported figures as zero. What I’ll be watching next is whether BTC can reclaim and hold $81K, whether the $80,000 round-number level attracts genuine buying, and whether the direction changes once the remaining ETF data comes in.
If I were trading this myself, I wouldn’t chase the rebound or use high leverage. I’d consider a long position only if BTC gets back above $81,300, holds above $81,000 on a retest, and volume picks up—with a position size of no more than 3% of my total capital. I’d first look to the intraday high near $81,800 and cut the position in half if it reaches that level; I’d then look toward $83,000 with the remainder and move my stop loss higher. I’d place my initial stop below $80,100. If, after entering, BTC falls back below $81,000 and repeatedly fails to reclaim it, I’d close the position proactively rather than wait for a slogan to save it. If it first loses $80,000 and the rebound is weak, I’d cancel the long plan and stay in cash. Conversely, I’d reconsider my current defensive stance only if BTC sustainably reclaims $81,800 and the complete ETF data does not show further deterioration.
#BTCFallsBelow$81K #BTC
The above is solely my personal market observation and does not constitute investment advice.
My stance is to prioritize defense. I’m not treating a rebound after a breakdown as a trend reversal. The current trending topic on Binance Square is #BTCFallsBelow$81K, which does reflect the price action right now rather than just recirculating old news. At the time of writing, BTC/USD on Kraken was around $80,835, with an intraday low of $80,150. It has rebounded from the low, but remains below the day’s open of about $81,577. CoinGecko likewise showed a price of around $80,855, down about 3.5% over 24 hours. So it’s accurate to say that BTC “fell below $81K and is now rebounding,” but not that it has “stabilized back above $81K”—and it would be an exaggeration to describe a touch of $80,150 as a break below $80,000.
The news backdrop is worth considering too, but the causal links should be kept separate. The U.S. Bureau of Labor Statistics reported yesterday that September CPI was up 3.7% year over year and 0.6% month over month, with gasoline up 9.1% month over month. The Fed’s Beige Book, published the same day, said oil-price pressures were widespread across districts, while overall employment changed little in most districts. The former is statistical data; the latter is a summary of business interviews through October 5. Neither means the Fed has announced another rate hike. The potential transmission mechanism for BTC is that persistent inflation could raise expectations that rates will stay higher for longer, increasing the opportunity cost of holding cash and bonds and potentially making risk assets more sensitive to deleveraging. But based on this information alone, it’s impossible to prove that every dollar of today’s decline was caused by CPI.
Institutional flows also shouldn’t be reduced to a single bearish headline. In Farside’s October 14 U.S. spot BTC fund table, FBTC showed about $152.7 million in outflows and BITB about $2.2 million in inflows, for an automatically calculated preliminary net outflow of about $150.5 million. IBIT was still blank, so this preliminary figure is not the final net total for the entire market. If we use only partial fund data to claim that institutions are exiting across the board after the price fell below $81K, we’d be treating unreported figures as zero. What I’ll be watching next is whether BTC can reclaim and hold $81K, whether the $80,000 round-number level attracts genuine buying, and whether the direction changes once the remaining ETF data comes in.
If I were trading this myself, I wouldn’t chase the rebound or use high leverage. I’d consider a long position only if BTC gets back above $81,300, holds above $81,000 on a retest, and volume picks up—with a position size of no more than 3% of my total capital. I’d first look to the intraday high near $81,800 and cut the position in half if it reaches that level; I’d then look toward $83,000 with the remainder and move my stop loss higher. I’d place my initial stop below $80,100. If, after entering, BTC falls back below $81,000 and repeatedly fails to reclaim it, I’d close the position proactively rather than wait for a slogan to save it. If it first loses $80,000 and the rebound is weak, I’d cancel the long plan and stay in cash. Conversely, I’d reconsider my current defensive stance only if BTC sustainably reclaims $81,800 and the complete ETF data does not show further deterioration.
#BTCFallsBelow$81K #BTC
The above is solely my personal market observation and does not constitute investment advice.
5
U.S. September CPI Surges to 3.7%, Shaking Global Markets; Cryptocurrencies and Traditional Financial Markets Under Pressure
I. Inflation Exceeds Expectations, Casting a Shadow of Further Rate Hikes
The latest data released by the U.S. Department of Labor showed that the Consumer Price Index rose 3.7% year over year in September, above market expectations of 3.6% and up sharply from 3.4% in August, reaching its highest level since May 2026. Energy prices were the main driver of the inflation rebound: the energy component surged 5.2% year over year, making it the key factor pushing up overall CPI.
After the data was released, market expectations for Federal Reserve policy quickly turned hawkish. Federal funds futures showed that traders had raised the implied probability of a rate hike in October to 43%, while some institutions had even begun betting on a possible 50-basis-point hike in December. This shift in expectations directly pressured risk assets, with U.S. stock futures and cryptocurrency markets weakening in tandem.
II. Bitcoin Falls Below $82,000 as More Than $400 Million in Long Positions Are Liquidated
In response to the CPI data, Bitcoin quickly retreated from around $83,700, briefly falling below the $82,000 threshold, a decline of approximately 2.86%. On-chain liquidation data showed that more than $400 million in positions were liquidated across the market over the past 24 hours, with long positions accounting for the vast majority. Ethereum and other major altcoins also came under pressure, as overall risk appetite fell significantly.
Notably, institutional buying did not retreat alongside prices. Nasdaq-listed company Strive purchased more than 6,100 bitcoins in two transactions this week, spending approximately $470 million in total. This raised its total holdings to 35,595 bitcoins, setting the company’s largest single-week increase since its merger in January 2026. This countertrend accumulation suggests that some institutional investors still view the current pullback as an opportunity to build positions over the medium to long term.
III. Traditional Finance Accelerates Its Embrace of Crypto Assets; Standard Chartered Launches Direct Trading in the UAE
Despite short-term market pressure, traditional financial institutions continue to accelerate their expansion into crypto. Standard Chartered recently launched direct Bitcoin and Ethereum trading services in the UAE for high-net-worth clients. Custody, settlement, and pricing are all handled within the banking system, with no need for third-party wallets. The move marks a new phase for institutional-grade crypto services in the Middle East and further strengthens the UAE’s position as a global digital asset hub.
Meanwhile, there was positive news for the XRP ecosystem. Ripple announced that it would integrate wallet infrastructure from Privy, a Stripe company, into the XRP Ledger, enabling developers to embed wallet features and AI agent payment capabilities. More than 13 million AI agent transactions have already been recorded on the ledger. Ripple also partnered with South Korea’s Meritz Securities to explore institutional-grade custody and asset tokenization, advancing the integration of blockchain into South Korea’s capital markets.
IV. Tokenized U.S. Stocks and On-Chain Infrastructure Continue to Expand
The range of U.S. stocks available for on-chain trading continues to grow in the tokenized stock market, including shares of well-known public companies such as Moderna and Linde. Investors can trade these U.S. stock assets directly through the BSC and Ethereum networks, lowering the barriers associated with traditional brokerage channels. This trend complements traditional finance’s growing involvement in crypto and is helping drive the broader movement of assets onto blockchains.
Security concerns also warrant attention. Hardware wallet manufacturer Ledger ordered distributors in Indonesia, Singapore, Thailand, the Philippines, Vietnam, Malaysia, Hong Kong, China, and other locations to suspend sales after malicious hardware implants were discovered in devices in several Asian countries. Estimated losses could reach $102 million. Analysts noted that the incident could accelerate the movement of institutional funds toward licensed custodians, while consumer-grade self-custody solutions face a serious supply-chain security test.
V. Market Outlook
Overall, the higher-than-expected CPI reading has overturned market optimism about steadily declining inflation, significantly increasing uncertainty around the Federal Reserve’s policy path in the short term. In the crypto market, institutional buying against the trend contrasts sharply with panic selling by retail investors, widening the divide among market participants. Investors should closely monitor upcoming employment data and statements from Fed officials, manage their positions prudently, and guard against volatility. Until macroeconomic uncertainty subsides, a combination of cautious observation and selective positioning may be the more prudent strategy.
#CPIWatch #BTCFallsBelow$81K #TokenizedUSStocks
U.S. September CPI Surges to 3.7%, Shaking Global Markets; Cryptocurrencies and Traditional Financial Markets Under Pressure
I. Inflation Exceeds Expectations, Casting a Shadow of Further Rate Hikes
The latest data released by the U.S. Department of Labor showed that the Consumer Price Index rose 3.7% year over year in September, above market expectations of 3.6% and up sharply from 3.4% in August, reaching its highest level since May 2026. Energy prices were the main driver of the inflation rebound: the energy component surged 5.2% year over year, making it the key factor pushing up overall CPI.
After the data was released, market expectations for Federal Reserve policy quickly turned hawkish. Federal funds futures showed that traders had raised the implied probability of a rate hike in October to 43%, while some institutions had even begun betting on a possible 50-basis-point hike in December. This shift in expectations directly pressured risk assets, with U.S. stock futures and cryptocurrency markets weakening in tandem.
II. Bitcoin Falls Below $82,000 as More Than $400 Million in Long Positions Are Liquidated
In response to the CPI data, Bitcoin quickly retreated from around $83,700, briefly falling below the $82,000 threshold, a decline of approximately 2.86%. On-chain liquidation data showed that more than $400 million in positions were liquidated across the market over the past 24 hours, with long positions accounting for the vast majority. Ethereum and other major altcoins also came under pressure, as overall risk appetite fell significantly.
Notably, institutional buying did not retreat alongside prices. Nasdaq-listed company Strive purchased more than 6,100 bitcoins in two transactions this week, spending approximately $470 million in total. This raised its total holdings to 35,595 bitcoins, setting the company’s largest single-week increase since its merger in January 2026. This countertrend accumulation suggests that some institutional investors still view the current pullback as an opportunity to build positions over the medium to long term.
III. Traditional Finance Accelerates Its Embrace of Crypto Assets; Standard Chartered Launches Direct Trading in the UAE
Despite short-term market pressure, traditional financial institutions continue to accelerate their expansion into crypto. Standard Chartered recently launched direct Bitcoin and Ethereum trading services in the UAE for high-net-worth clients. Custody, settlement, and pricing are all handled within the banking system, with no need for third-party wallets. The move marks a new phase for institutional-grade crypto services in the Middle East and further strengthens the UAE’s position as a global digital asset hub.
Meanwhile, there was positive news for the XRP ecosystem. Ripple announced that it would integrate wallet infrastructure from Privy, a Stripe company, into the XRP Ledger, enabling developers to embed wallet features and AI agent payment capabilities. More than 13 million AI agent transactions have already been recorded on the ledger. Ripple also partnered with South Korea’s Meritz Securities to explore institutional-grade custody and asset tokenization, advancing the integration of blockchain into South Korea’s capital markets.
IV. Tokenized U.S. Stocks and On-Chain Infrastructure Continue to Expand
The range of U.S. stocks available for on-chain trading continues to grow in the tokenized stock market, including shares of well-known public companies such as Moderna and Linde. Investors can trade these U.S. stock assets directly through the BSC and Ethereum networks, lowering the barriers associated with traditional brokerage channels. This trend complements traditional finance’s growing involvement in crypto and is helping drive the broader movement of assets onto blockchains.
Security concerns also warrant attention. Hardware wallet manufacturer Ledger ordered distributors in Indonesia, Singapore, Thailand, the Philippines, Vietnam, Malaysia, Hong Kong, China, and other locations to suspend sales after malicious hardware implants were discovered in devices in several Asian countries. Estimated losses could reach $102 million. Analysts noted that the incident could accelerate the movement of institutional funds toward licensed custodians, while consumer-grade self-custody solutions face a serious supply-chain security test.
V. Market Outlook
Overall, the higher-than-expected CPI reading has overturned market optimism about steadily declining inflation, significantly increasing uncertainty around the Federal Reserve’s policy path in the short term. In the crypto market, institutional buying against the trend contrasts sharply with panic selling by retail investors, widening the divide among market participants. Investors should closely monitor upcoming employment data and statements from Fed officials, manage their positions prudently, and guard against volatility. Until macroeconomic uncertainty subsides, a combination of cautious observation and selective positioning may be the more prudent strategy.
#CPIWatch #BTCFallsBelow$81K #TokenizedUSStocks
I. Inflation Exceeds Expectations, Casting a Shadow of Further Rate Hikes
The latest data released by the U.S. Department of Labor showed that the Consumer Price Index rose 3.7% year over year in September, above market expectations of 3.6% and up sharply from 3.4% in August, reaching its highest level since May 2026. Energy prices were the main driver of the inflation rebound: the energy component surged 5.2% year over year, making it the key factor pushing up overall CPI.
After the data was released, market expectations for Federal Reserve policy quickly turned hawkish. Federal funds futures showed that traders had raised the implied probability of a rate hike in October to 43%, while some institutions had even begun betting on a possible 50-basis-point hike in December. This shift in expectations directly pressured risk assets, with U.S. stock futures and cryptocurrency markets weakening in tandem.
II. Bitcoin Falls Below $82,000 as More Than $400 Million in Long Positions Are Liquidated
In response to the CPI data, Bitcoin quickly retreated from around $83,700, briefly falling below the $82,000 threshold, a decline of approximately 2.86%. On-chain liquidation data showed that more than $400 million in positions were liquidated across the market over the past 24 hours, with long positions accounting for the vast majority. Ethereum and other major altcoins also came under pressure, as overall risk appetite fell significantly.
Notably, institutional buying did not retreat alongside prices. Nasdaq-listed company Strive purchased more than 6,100 bitcoins in two transactions this week, spending approximately $470 million in total. This raised its total holdings to 35,595 bitcoins, setting the company’s largest single-week increase since its merger in January 2026. This countertrend accumulation suggests that some institutional investors still view the current pullback as an opportunity to build positions over the medium to long term.
III. Traditional Finance Accelerates Its Embrace of Crypto Assets; Standard Chartered Launches Direct Trading in the UAE
Despite short-term market pressure, traditional financial institutions continue to accelerate their expansion into crypto. Standard Chartered recently launched direct Bitcoin and Ethereum trading services in the UAE for high-net-worth clients. Custody, settlement, and pricing are all handled within the banking system, with no need for third-party wallets. The move marks a new phase for institutional-grade crypto services in the Middle East and further strengthens the UAE’s position as a global digital asset hub.
Meanwhile, there was positive news for the XRP ecosystem. Ripple announced that it would integrate wallet infrastructure from Privy, a Stripe company, into the XRP Ledger, enabling developers to embed wallet features and AI agent payment capabilities. More than 13 million AI agent transactions have already been recorded on the ledger. Ripple also partnered with South Korea’s Meritz Securities to explore institutional-grade custody and asset tokenization, advancing the integration of blockchain into South Korea’s capital markets.
IV. Tokenized U.S. Stocks and On-Chain Infrastructure Continue to Expand
The range of U.S. stocks available for on-chain trading continues to grow in the tokenized stock market, including shares of well-known public companies such as Moderna and Linde. Investors can trade these U.S. stock assets directly through the BSC and Ethereum networks, lowering the barriers associated with traditional brokerage channels. This trend complements traditional finance’s growing involvement in crypto and is helping drive the broader movement of assets onto blockchains.
Security concerns also warrant attention. Hardware wallet manufacturer Ledger ordered distributors in Indonesia, Singapore, Thailand, the Philippines, Vietnam, Malaysia, Hong Kong, China, and other locations to suspend sales after malicious hardware implants were discovered in devices in several Asian countries. Estimated losses could reach $102 million. Analysts noted that the incident could accelerate the movement of institutional funds toward licensed custodians, while consumer-grade self-custody solutions face a serious supply-chain security test.
V. Market Outlook
Overall, the higher-than-expected CPI reading has overturned market optimism about steadily declining inflation, significantly increasing uncertainty around the Federal Reserve’s policy path in the short term. In the crypto market, institutional buying against the trend contrasts sharply with panic selling by retail investors, widening the divide among market participants. Investors should closely monitor upcoming employment data and statements from Fed officials, manage their positions prudently, and guard against volatility. Until macroeconomic uncertainty subsides, a combination of cautious observation and selective positioning may be the more prudent strategy.
#CPIWatch #BTCFallsBelow$81K #TokenizedUSStocks
7

·
--
I just saw that Bitcoin has fallen below $81,000, hitting a recent low. The market is concerned about macroeconomic impacts, along with rising regulatory uncertainty. I think the short-term decline is a technical correction, but institutional inflows are worth watching in the long term. #BTCFallsBelow$81K
#BTC $BTC
I just saw that Bitcoin has fallen below $81,000, hitting a recent low. The market is concerned about macroeconomic impacts, along with rising regulatory uncertainty. I think the short-term decline is a technical correction, but institutional inflows are worth watching in the long term. #BTCFallsBelow$81K
#BTC $BTC
#BTC $BTC
179

·
--
🚨 BITCOIN SLIPS UNDER $84K AS 110K+ TRADERS GET REKT 🩸
Red day on every board. $BTC dumped over 3% to around $82.5K this evening, $ETH fell nearly 5%, and even spot gold lost the $4,100 level (-2.26%) with silver down 3.5%. When metals and crypto bleed together, this is not a crypto problem, it is a liquidity problem.
Coinglass data shows 110,000+ traders were liquidated in 24 hours. But here is the odd part: the Fear & Greed index still reads 64 (Greed), up from 59 yesterday. That mismatch is worth watching. If sentiment refuses to cool while leverage keeps getting wiped, the washout probably is not finished.
Key zone ahead: $80,700–$81,000, where buyers stepped in last time. Lose it, and $75K opens up.
Are you buying this dip or waiting for the real flush? 👇
Not financial advice. DYOR.
#crypto #altcoins #BTCFallsBelow$84K
🚨 BITCOIN SLIPS UNDER $84K AS 110K+ TRADERS GET REKT 🩸
Red day on every board. $BTC dumped over 3% to around $82.5K this evening, $ETH fell nearly 5%, and even spot gold lost the $4,100 level (-2.26%) with silver down 3.5%. When metals and crypto bleed together, this is not a crypto problem, it is a liquidity problem.
Coinglass data shows 110,000+ traders were liquidated in 24 hours. But here is the odd part: the Fear & Greed index still reads 64 (Greed), up from 59 yesterday. That mismatch is worth watching. If sentiment refuses to cool while leverage keeps getting wiped, the washout probably is not finished.
Key zone ahead: $80,700–$81,000, where buyers stepped in last time. Lose it, and $75K opens up.
Are you buying this dip or waiting for the real flush? 👇
Not financial advice. DYOR.
#crypto #altcoins #BTCFallsBelow$84K
Red day on every board. $BTC dumped over 3% to around $82.5K this evening, $ETH fell nearly 5%, and even spot gold lost the $4,100 level (-2.26%) with silver down 3.5%. When metals and crypto bleed together, this is not a crypto problem, it is a liquidity problem.
Coinglass data shows 110,000+ traders were liquidated in 24 hours. But here is the odd part: the Fear & Greed index still reads 64 (Greed), up from 59 yesterday. That mismatch is worth watching. If sentiment refuses to cool while leverage keeps getting wiped, the washout probably is not finished.
Key zone ahead: $80,700–$81,000, where buyers stepped in last time. Lose it, and $75K opens up.
Are you buying this dip or waiting for the real flush? 👇
Not financial advice. DYOR.
#crypto #altcoins #BTCFallsBelow$84K
100

Picture this: funding rates were flashing green across every major desk, retail leverage was quietly stacking to multi-month highs, and then liquidity simply evaporated in minutes.
Most traders get trapped because they treat key psychological breakdowns as instant discount buying opportunities rather than structural shift warnings. When the floor drops, catching falling knives while margin liquidations cascade is the fastest way to turn a manageable drawdown into total capital impairment.
When $BTC broke beneath local support, the initial reaction was the usual rush to buy the dip with sidelined $USDT. What went unnoticed was the distribution happening at the exact moment open interest peaked. Smart money was quietly offloading risk into aggressive bids, leaving late buyers holding exposure right into thin order books.
The collateral damage did not stay isolated to majors. High-beta plays like $SUI saw immediate unwind pressure as cross-margin accounts were forced into automatic rebalancing to cover spot drawdowns. The lesson from this breakdown is simple: when momentum fails at critical levels during elevated greed, the downside is rarely a smooth correction. It is an aggressive liquidity sweep designed to punish overconfident positioning.
Where do you think this goes from here?
#BTCFallsBelow #FedMinutesFocusOnOctoberPause
Picture this: funding rates were flashing green across every major desk, retail leverage was quietly stacking to multi-month highs, and then liquidity simply evaporated in minutes.
Most traders get trapped because they treat key psychological breakdowns as instant discount buying opportunities rather than structural shift warnings. When the floor drops, catching falling knives while margin liquidations cascade is the fastest way to turn a manageable drawdown into total capital impairment.
When $BTC broke beneath local support, the initial reaction was the usual rush to buy the dip with sidelined $USDT. What went unnoticed was the distribution happening at the exact moment open interest peaked. Smart money was quietly offloading risk into aggressive bids, leaving late buyers holding exposure right into thin order books.
The collateral damage did not stay isolated to majors. High-beta plays like $SUI saw immediate unwind pressure as cross-margin accounts were forced into automatic rebalancing to cover spot drawdowns. The lesson from this breakdown is simple: when momentum fails at critical levels during elevated greed, the downside is rarely a smooth correction. It is an aggressive liquidity sweep designed to punish overconfident positioning.
Where do you think this goes from here?
#BTCFallsBelow #FedMinutesFocusOnOctoberPause
Most traders get trapped because they treat key psychological breakdowns as instant discount buying opportunities rather than structural shift warnings. When the floor drops, catching falling knives while margin liquidations cascade is the fastest way to turn a manageable drawdown into total capital impairment.
When $BTC broke beneath local support, the initial reaction was the usual rush to buy the dip with sidelined $USDT. What went unnoticed was the distribution happening at the exact moment open interest peaked. Smart money was quietly offloading risk into aggressive bids, leaving late buyers holding exposure right into thin order books.
The collateral damage did not stay isolated to majors. High-beta plays like $SUI saw immediate unwind pressure as cross-margin accounts were forced into automatic rebalancing to cover spot drawdowns. The lesson from this breakdown is simple: when momentum fails at critical levels during elevated greed, the downside is rarely a smooth correction. It is an aggressive liquidity sweep designed to punish overconfident positioning.
Where do you think this goes from here?
#BTCFallsBelow #FedMinutesFocusOnOctoberPause
54

·
--
Have you noticed that $BTC keeps slipping below key levels while the rest of the market still feels greedy?
Too many people are dumping their bags in a panic and locking in unnecessary losses instead of having a simple plan for these corrections.
The story everyone is repeating is that this drop signals the end of the rally. I see it differently. Fear and Greed is at 61, which is still greed, and equities just printed fresh highs. This looks like a shakeout, not a reversal. Liquidity is sitting on the sidelines in $USDT waiting for clearer signals.
My approach is straightforward. Stay patient, keep dry powder in stables, and wait for the next Fed minutes to show whether an October pause is really on the table. If $BTC finds support and holds, I start adding back, often looking at laggards like $SUI that usually catch up once Bitcoin stabilizes. The goal is not to time the exact bottom but to avoid getting flushed out of a thesis that still makes sense.
Where do you think this goes from here?
#BTCFallsBelow #FedMinutesFocusOnOctoberPause #SP500AndNasdaqHitRecordHighs
Have you noticed that $BTC keeps slipping below key levels while the rest of the market still feels greedy?
Too many people are dumping their bags in a panic and locking in unnecessary losses instead of having a simple plan for these corrections.
The story everyone is repeating is that this drop signals the end of the rally. I see it differently. Fear and Greed is at 61, which is still greed, and equities just printed fresh highs. This looks like a shakeout, not a reversal. Liquidity is sitting on the sidelines in $USDT waiting for clearer signals.
My approach is straightforward. Stay patient, keep dry powder in stables, and wait for the next Fed minutes to show whether an October pause is really on the table. If $BTC finds support and holds, I start adding back, often looking at laggards like $SUI that usually catch up once Bitcoin stabilizes. The goal is not to time the exact bottom but to avoid getting flushed out of a thesis that still makes sense.
Where do you think this goes from here?
#BTCFallsBelow #FedMinutesFocusOnOctoberPause #SP500AndNasdaqHitRecordHighs
Too many people are dumping their bags in a panic and locking in unnecessary losses instead of having a simple plan for these corrections.
The story everyone is repeating is that this drop signals the end of the rally. I see it differently. Fear and Greed is at 61, which is still greed, and equities just printed fresh highs. This looks like a shakeout, not a reversal. Liquidity is sitting on the sidelines in $USDT waiting for clearer signals.
My approach is straightforward. Stay patient, keep dry powder in stables, and wait for the next Fed minutes to show whether an October pause is really on the table. If $BTC finds support and holds, I start adding back, often looking at laggards like $SUI that usually catch up once Bitcoin stabilizes. The goal is not to time the exact bottom but to avoid getting flushed out of a thesis that still makes sense.
Where do you think this goes from here?
#BTCFallsBelow #FedMinutesFocusOnOctoberPause #SP500AndNasdaqHitRecordHighs
90
Have you noticed that every time $BTC slips below a round number, the same crowd that was calling for new highs last month suddenly acts like the asset is finished?
Most people lose money in these moments because they buy strength and sell weakness. They never decide when to exit until they are already underwater, then they dump into $USDT and miss the bounce that usually follows.
The Fear and Greed index is still sitting at 63, which is greed, not capitulation. The screaming you hear is unprepared traders narrating a move they did not plan for, not a real regime change. When Bitcoin drops, liquidity leaves alts first, so names like $FIL get hit harder than the leader. That is a rotation, not a funeral, and your job is not to predict the exact wick but to have levels written down before the red candles show up.
The practical move is to scale into weakness across two or three zones instead of hunting the exact bottom, and to keep dry powder in $USDT so you can actually buy instead of watching. If you are already in, set your invalidation now and honor it. The people who survive these dips are the ones who already knew what they would do.
Anyone else treating this dip as a setup instead of a signal to run?
#BTCFallsBelow #SECApproves3XBitcoinETF #StrategyEstimates
Have you noticed that every time $BTC slips below a round number, the same crowd that was calling for new highs last month suddenly acts like the asset is finished?
Most people lose money in these moments because they buy strength and sell weakness. They never decide when to exit until they are already underwater, then they dump into $USDT and miss the bounce that usually follows.
The Fear and Greed index is still sitting at 63, which is greed, not capitulation. The screaming you hear is unprepared traders narrating a move they did not plan for, not a real regime change. When Bitcoin drops, liquidity leaves alts first, so names like $FIL get hit harder than the leader. That is a rotation, not a funeral, and your job is not to predict the exact wick but to have levels written down before the red candles show up.
The practical move is to scale into weakness across two or three zones instead of hunting the exact bottom, and to keep dry powder in $USDT so you can actually buy instead of watching. If you are already in, set your invalidation now and honor it. The people who survive these dips are the ones who already knew what they would do.
Anyone else treating this dip as a setup instead of a signal to run?
#BTCFallsBelow #SECApproves3XBitcoinETF #StrategyEstimates
Most people lose money in these moments because they buy strength and sell weakness. They never decide when to exit until they are already underwater, then they dump into $USDT and miss the bounce that usually follows.
The Fear and Greed index is still sitting at 63, which is greed, not capitulation. The screaming you hear is unprepared traders narrating a move they did not plan for, not a real regime change. When Bitcoin drops, liquidity leaves alts first, so names like $FIL get hit harder than the leader. That is a rotation, not a funeral, and your job is not to predict the exact wick but to have levels written down before the red candles show up.
The practical move is to scale into weakness across two or three zones instead of hunting the exact bottom, and to keep dry powder in $USDT so you can actually buy instead of watching. If you are already in, set your invalidation now and honor it. The people who survive these dips are the ones who already knew what they would do.
Anyone else treating this dip as a setup instead of a signal to run?
#BTCFallsBelow #SECApproves3XBitcoinETF #StrategyEstimates
1
1
39


Bitcoin has recently seen a significant price drop, falling below the $84,000 mark. This move has sparked concern and speculation among traders and investors about the immediate future of the leading cryptocurrency. While the exact catalysts for this decline are varied, including potential profit-taking and broader market sentiment shifts, it's crucial to analyze the implications.
This price action could signal a short-term correction or the beginning of a more substantial trend adjustment. Traders will be closely watching key support levels to gauge the market's reaction and potential for a rebound. The resilience of $BTC in holding above critical psychological barriers will be a key indicator of underlying strength. Market participants should remain vigilant and consider the broader macroeconomic factors that might be influencing this volatility.
Traders are now assessing whether this dip presents a buying opportunity or indicates further downside risk. The coming days will be critical in determining the short-term trajectory of Bitcoin.
#BTCFallsBelow$84K $BTC
Bitcoin has recently seen a significant price drop, falling below the $84,000 mark. This move has sparked concern and speculation among traders and investors about the immediate future of the leading cryptocurrency. While the exact catalysts for this decline are varied, including potential profit-taking and broader market sentiment shifts, it's crucial to analyze the implications.
This price action could signal a short-term correction or the beginning of a more substantial trend adjustment. Traders will be closely watching key support levels to gauge the market's reaction and potential for a rebound. The resilience of $BTC in holding above critical psychological barriers will be a key indicator of underlying strength. Market participants should remain vigilant and consider the broader macroeconomic factors that might be influencing this volatility.
Traders are now assessing whether this dip presents a buying opportunity or indicates further downside risk. The coming days will be critical in determining the short-term trajectory of Bitcoin.
#BTCFallsBelow$84K $BTC
This price action could signal a short-term correction or the beginning of a more substantial trend adjustment. Traders will be closely watching key support levels to gauge the market's reaction and potential for a rebound. The resilience of $BTC in holding above critical psychological barriers will be a key indicator of underlying strength. Market participants should remain vigilant and consider the broader macroeconomic factors that might be influencing this volatility.
Traders are now assessing whether this dip presents a buying opportunity or indicates further downside risk. The coming days will be critical in determining the short-term trajectory of Bitcoin.
#BTCFallsBelow$84K $BTC
82
·
--
Government-linked wallet transfers BTC|Transfer to custody does not mean a sale|Manage risk first after losing $84K
My stance is cautious: I would not translate an on-chain address movement directly into “the U.S. government is dumping.” Binance Official News cited Arkham tracking data saying that on October 6, a U.S. government-linked wallet transferred about 833.6 BTC, and the transaction path later reached an address labeled as a Coinbase Prime deposit address. Another approximately 40,285 BNB moved between related addresses. At least three layers of fact need to be kept separate here: on-chain transfers can be verified; address ownership depends on labels assigned by tracking firms; and an actual sale requires evidence of trade execution or an official disclosure of disposition. The report explicitly did not confirm a sale. The U.S. government has previously transferred assets to Coinbase Prime for custody, so the mere fact that funds “entered an exchange” is not enough to conclude that spot selling pressure has already materialized.
The legal framework matters more. The White House’s 2025 executive order on the Strategic Bitcoin Reserve states that qualifying BTC that is ultimately forfeited and added to the reserve generally cannot be sold, while preserving exceptions for dispositions required by law, such as returning assets to victims or complying with court orders. Arkham’s “government-linked wallet” label covers addresses associated with different agencies and different legal statuses, so not every on-chain coin can automatically be counted as already included in the reserve. For the coins in question, the publicly visible on-chain path can tell us that the funds have moved, but it cannot replace official documents establishing case attribution, ownership, or the purpose of the disposition. I’ll continue to watch for announcements from judicial or Treasury departments and track where the addresses move next, rather than draw conclusions on their behalf based on rumors.
The market impact here comes from expectations, not confirmed supply: a large transfer to a custody address can prompt short-term traders to cancel orders preemptively, and thinner order-book depth can amplify price swings. If later evidence confirms that the transfer was only for safekeeping or returning assets, the initial panic could reverse. At the time of writing, BTC/USDT on Binance was around 83,558, down about 3.1% over 24 hours, with an intraday low of 83,442 and a high of 86,699. It was already below $84,000. However, interest-rate news and volatility in risk assets also affected the market that day, so the entire decline cannot be attributed to this transfer. For now, 83,400–83,500 is the zone to watch near the lows, 84,000 is the rebound threshold, and 85,000 is the next confirmation level. If the price breaks below 83,400 and fails to recover it, the weak outlook remains in place. If it quickly reclaims 85,000 and no new evidence of selling emerges, the claim that “the transfer will directly crush the price” would not hold up.
If I were trading this myself, I would neither chase a short nor try to catch a falling knife. I would only consider a small spot long: wait for at least two 15-minute candles to close back above 84,000, followed by a retest that holds, with trading activity on the order book recovering. Then I’d risk 0.3% of my total capital on a test position. The first target would be 85,000, where I’d take half off, with the remainder aimed at 85,800. I’d set a stop below 83,600 and cap the maximum loss on the trade at 0.1% of the account. If the price fails to hold 84,000 for two hours after entry, or officials confirm these coins will be sold, I’d close the position immediately. If 83,400 breaks first, I’d cancel the plan and wait for fresh confirmation. This is a conditional plan, not a trade that has already been executed or a presentation of returns.
#BTCFallsBelow$84K #BTC
The above is solely my personal market observation and does not constitute investment advice.
Government-linked wallet transfers BTC|Transfer to custody does not mean a sale|Manage risk first after losing $84K
My stance is cautious: I would not translate an on-chain address movement directly into “the U.S. government is dumping.” Binance Official News cited Arkham tracking data saying that on October 6, a U.S. government-linked wallet transferred about 833.6 BTC, and the transaction path later reached an address labeled as a Coinbase Prime deposit address. Another approximately 40,285 BNB moved between related addresses. At least three layers of fact need to be kept separate here: on-chain transfers can be verified; address ownership depends on labels assigned by tracking firms; and an actual sale requires evidence of trade execution or an official disclosure of disposition. The report explicitly did not confirm a sale. The U.S. government has previously transferred assets to Coinbase Prime for custody, so the mere fact that funds “entered an exchange” is not enough to conclude that spot selling pressure has already materialized.
The legal framework matters more. The White House’s 2025 executive order on the Strategic Bitcoin Reserve states that qualifying BTC that is ultimately forfeited and added to the reserve generally cannot be sold, while preserving exceptions for dispositions required by law, such as returning assets to victims or complying with court orders. Arkham’s “government-linked wallet” label covers addresses associated with different agencies and different legal statuses, so not every on-chain coin can automatically be counted as already included in the reserve. For the coins in question, the publicly visible on-chain path can tell us that the funds have moved, but it cannot replace official documents establishing case attribution, ownership, or the purpose of the disposition. I’ll continue to watch for announcements from judicial or Treasury departments and track where the addresses move next, rather than draw conclusions on their behalf based on rumors.
The market impact here comes from expectations, not confirmed supply: a large transfer to a custody address can prompt short-term traders to cancel orders preemptively, and thinner order-book depth can amplify price swings. If later evidence confirms that the transfer was only for safekeeping or returning assets, the initial panic could reverse. At the time of writing, BTC/USDT on Binance was around 83,558, down about 3.1% over 24 hours, with an intraday low of 83,442 and a high of 86,699. It was already below $84,000. However, interest-rate news and volatility in risk assets also affected the market that day, so the entire decline cannot be attributed to this transfer. For now, 83,400–83,500 is the zone to watch near the lows, 84,000 is the rebound threshold, and 85,000 is the next confirmation level. If the price breaks below 83,400 and fails to recover it, the weak outlook remains in place. If it quickly reclaims 85,000 and no new evidence of selling emerges, the claim that “the transfer will directly crush the price” would not hold up.
If I were trading this myself, I would neither chase a short nor try to catch a falling knife. I would only consider a small spot long: wait for at least two 15-minute candles to close back above 84,000, followed by a retest that holds, with trading activity on the order book recovering. Then I’d risk 0.3% of my total capital on a test position. The first target would be 85,000, where I’d take half off, with the remainder aimed at 85,800. I’d set a stop below 83,600 and cap the maximum loss on the trade at 0.1% of the account. If the price fails to hold 84,000 for two hours after entry, or officials confirm these coins will be sold, I’d close the position immediately. If 83,400 breaks first, I’d cancel the plan and wait for fresh confirmation. This is a conditional plan, not a trade that has already been executed or a presentation of returns.
#BTCFallsBelow$84K #BTC
The above is solely my personal market observation and does not constitute investment advice.
My stance is cautious: I would not translate an on-chain address movement directly into “the U.S. government is dumping.” Binance Official News cited Arkham tracking data saying that on October 6, a U.S. government-linked wallet transferred about 833.6 BTC, and the transaction path later reached an address labeled as a Coinbase Prime deposit address. Another approximately 40,285 BNB moved between related addresses. At least three layers of fact need to be kept separate here: on-chain transfers can be verified; address ownership depends on labels assigned by tracking firms; and an actual sale requires evidence of trade execution or an official disclosure of disposition. The report explicitly did not confirm a sale. The U.S. government has previously transferred assets to Coinbase Prime for custody, so the mere fact that funds “entered an exchange” is not enough to conclude that spot selling pressure has already materialized.
The legal framework matters more. The White House’s 2025 executive order on the Strategic Bitcoin Reserve states that qualifying BTC that is ultimately forfeited and added to the reserve generally cannot be sold, while preserving exceptions for dispositions required by law, such as returning assets to victims or complying with court orders. Arkham’s “government-linked wallet” label covers addresses associated with different agencies and different legal statuses, so not every on-chain coin can automatically be counted as already included in the reserve. For the coins in question, the publicly visible on-chain path can tell us that the funds have moved, but it cannot replace official documents establishing case attribution, ownership, or the purpose of the disposition. I’ll continue to watch for announcements from judicial or Treasury departments and track where the addresses move next, rather than draw conclusions on their behalf based on rumors.
The market impact here comes from expectations, not confirmed supply: a large transfer to a custody address can prompt short-term traders to cancel orders preemptively, and thinner order-book depth can amplify price swings. If later evidence confirms that the transfer was only for safekeeping or returning assets, the initial panic could reverse. At the time of writing, BTC/USDT on Binance was around 83,558, down about 3.1% over 24 hours, with an intraday low of 83,442 and a high of 86,699. It was already below $84,000. However, interest-rate news and volatility in risk assets also affected the market that day, so the entire decline cannot be attributed to this transfer. For now, 83,400–83,500 is the zone to watch near the lows, 84,000 is the rebound threshold, and 85,000 is the next confirmation level. If the price breaks below 83,400 and fails to recover it, the weak outlook remains in place. If it quickly reclaims 85,000 and no new evidence of selling emerges, the claim that “the transfer will directly crush the price” would not hold up.
If I were trading this myself, I would neither chase a short nor try to catch a falling knife. I would only consider a small spot long: wait for at least two 15-minute candles to close back above 84,000, followed by a retest that holds, with trading activity on the order book recovering. Then I’d risk 0.3% of my total capital on a test position. The first target would be 85,000, where I’d take half off, with the remainder aimed at 85,800. I’d set a stop below 83,600 and cap the maximum loss on the trade at 0.1% of the account. If the price fails to hold 84,000 for two hours after entry, or officials confirm these coins will be sold, I’d close the position immediately. If 83,400 breaks first, I’d cancel the plan and wait for fresh confirmation. This is a conditional plan, not a trade that has already been executed or a presentation of returns.
#BTCFallsBelow$84K #BTC
The above is solely my personal market observation and does not constitute investment advice.
105
Bitcoin Flash Crash Triggers $500 Million in Liquidations as U.S. Treasury Yields Hit a 20-Year High: What’s Next for the Crypto Market?
I. Sudden Flash Crash: $500 Million in Bitcoin Long Positions Wiped Out Within Minutes
In the early hours of October 7, Beijing time, Bitcoin suffered a sharp flash crash. Its price plunged from around $86,600 to below $84,000, triggering the liquidation of more than $550 million in leveraged long positions within minutes. It was one of the largest single-hour liquidation events in recent times.
The sell-off was fueled by a combination of pressures. First, the yield on 10-year U.S. Treasuries surged above 5.3%, its highest level since 2002. Such high yields make risk-free returns highly attractive, prompting substantial capital to leave risk assets for the bond market. Second, a U.S. government wallet transferred around $100 million worth of Bitcoin and Binance Coin, further intensifying selling sentiment. In a knock-on effect, spot Bitcoin ETFs also saw significant net outflows.
However, analysts noted that Bitcoin is still holding above the key support level at its 21-day moving average. Tom Lee, head of research at Fundstrat, believes this could be a temporary bottom in the current bull market and that there is no need for excessive panic.
II. Macroeconomic Storm: Surging Treasury Yields Reshape Global Asset Pricing
The 10-year U.S. Treasury yield breaking above 5.3% carries profound implications for global financial markets. Bond yields have not reached this level since 2002, and even investors who have long been bearish on bonds are turning bullish on sovereign debt for the first time.
The immediate consequence of surging yields is mounting pressure on risk assets. Although the S&P 500 and Nasdaq have recently hit record highs, Bitcoin has decoupled from U.S. stocks, with investors clearly rotating funds out of crypto and into bonds. This “flight back to safety” suggests that in a high-interest-rate environment, crypto’s status as a risk asset is being repriced.
Markets are closely watching for the release of the minutes from the Federal Reserve’s September FOMC meeting to assess whether the Fed might resume its rate-hiking cycle. If the minutes send a clear signal of tighter policy, the crypto market could face even greater downward pressure.
III. Industry Highlights: Binance’s AI Upgrade and Continued Expansion of the BNB Chain Ecosystem
Despite market volatility, industry fundamentals remain positive. Binance co-founder He Yi revealed during an AMA on smart products that the Binance homepage is now fully customizable. AI-powered personalized recommendations will give every user a unique interface. More notably, Binance plans to let users delegate complex on-chain operations to AI agents, marking an important step forward for agentic finance.
Meanwhile, the number of real-world asset holders on BNB Chain has surpassed two million, far exceeding that of other major blockchains. This milestone reflects the accelerating adoption of tokenized real-world assets on BNB Chain by institutional and individual investors, consolidating its leading position in the tokenization sector. BNB also topped the Square’s popularity rankings, with more than 26,000 mentions, reflecting broadly bullish market sentiment.
IV. Accelerating Institutional Adoption: Solana Partners with JPMorgan to Launch a DvP Settlement System
The Solana Foundation has officially launched Solana DvP, an open-source delivery-versus-payment escrow program that enables atomic settlement of tokenized assets in a single transaction, with finality in seconds. Notably, JPMorgan contributed to the system’s design, signaling significant Wall Street recognition of Solana infrastructure’s potential in institutional finance.
In addition, the Winklevoss brothers have filed an S-1 application with the U.S. Securities and Exchange Commission for a spot Zcash ETF, planning to list it on Nasdaq with an annual fee of 0.25%. This has renewed interest in privacy coins. On Ethereum, the Glamsterdam upgrade has been successfully activated on the Sepolia testnet. It includes key improvements such as native proposer-builder separation and block-level access lists, paving the way for deployment on mainnet.
V. Market Outlook: Short-Term Pressure, but the Long-Term Thesis Remains Intact
Overall, the market is caught between macroeconomic interest-rate pressures and improving industry fundamentals. Elevated Treasury yields and the unwinding of leveraged positions may continue to weigh on prices in the short term. But on-chain data, the pace of institutional adoption, and the integration of AI technology suggest that the crypto market’s long-term growth thesis remains unchanged. For investors, managing leverage, watching key support levels, and patiently waiting for greater clarity on macroeconomic policy are prudent choices in the current environment.
#BTCFallsBelow$84K #BinanceLaunchesBinanceIntelligence #BNBChainRWA
Bitcoin Flash Crash Triggers $500 Million in Liquidations as U.S. Treasury Yields Hit a 20-Year High: What’s Next for the Crypto Market?
I. Sudden Flash Crash: $500 Million in Bitcoin Long Positions Wiped Out Within Minutes
In the early hours of October 7, Beijing time, Bitcoin suffered a sharp flash crash. Its price plunged from around $86,600 to below $84,000, triggering the liquidation of more than $550 million in leveraged long positions within minutes. It was one of the largest single-hour liquidation events in recent times.
The sell-off was fueled by a combination of pressures. First, the yield on 10-year U.S. Treasuries surged above 5.3%, its highest level since 2002. Such high yields make risk-free returns highly attractive, prompting substantial capital to leave risk assets for the bond market. Second, a U.S. government wallet transferred around $100 million worth of Bitcoin and Binance Coin, further intensifying selling sentiment. In a knock-on effect, spot Bitcoin ETFs also saw significant net outflows.
However, analysts noted that Bitcoin is still holding above the key support level at its 21-day moving average. Tom Lee, head of research at Fundstrat, believes this could be a temporary bottom in the current bull market and that there is no need for excessive panic.
II. Macroeconomic Storm: Surging Treasury Yields Reshape Global Asset Pricing
The 10-year U.S. Treasury yield breaking above 5.3% carries profound implications for global financial markets. Bond yields have not reached this level since 2002, and even investors who have long been bearish on bonds are turning bullish on sovereign debt for the first time.
The immediate consequence of surging yields is mounting pressure on risk assets. Although the S&P 500 and Nasdaq have recently hit record highs, Bitcoin has decoupled from U.S. stocks, with investors clearly rotating funds out of crypto and into bonds. This “flight back to safety” suggests that in a high-interest-rate environment, crypto’s status as a risk asset is being repriced.
Markets are closely watching for the release of the minutes from the Federal Reserve’s September FOMC meeting to assess whether the Fed might resume its rate-hiking cycle. If the minutes send a clear signal of tighter policy, the crypto market could face even greater downward pressure.
III. Industry Highlights: Binance’s AI Upgrade and Continued Expansion of the BNB Chain Ecosystem
Despite market volatility, industry fundamentals remain positive. Binance co-founder He Yi revealed during an AMA on smart products that the Binance homepage is now fully customizable. AI-powered personalized recommendations will give every user a unique interface. More notably, Binance plans to let users delegate complex on-chain operations to AI agents, marking an important step forward for agentic finance.
Meanwhile, the number of real-world asset holders on BNB Chain has surpassed two million, far exceeding that of other major blockchains. This milestone reflects the accelerating adoption of tokenized real-world assets on BNB Chain by institutional and individual investors, consolidating its leading position in the tokenization sector. BNB also topped the Square’s popularity rankings, with more than 26,000 mentions, reflecting broadly bullish market sentiment.
IV. Accelerating Institutional Adoption: Solana Partners with JPMorgan to Launch a DvP Settlement System
The Solana Foundation has officially launched Solana DvP, an open-source delivery-versus-payment escrow program that enables atomic settlement of tokenized assets in a single transaction, with finality in seconds. Notably, JPMorgan contributed to the system’s design, signaling significant Wall Street recognition of Solana infrastructure’s potential in institutional finance.
In addition, the Winklevoss brothers have filed an S-1 application with the U.S. Securities and Exchange Commission for a spot Zcash ETF, planning to list it on Nasdaq with an annual fee of 0.25%. This has renewed interest in privacy coins. On Ethereum, the Glamsterdam upgrade has been successfully activated on the Sepolia testnet. It includes key improvements such as native proposer-builder separation and block-level access lists, paving the way for deployment on mainnet.
V. Market Outlook: Short-Term Pressure, but the Long-Term Thesis Remains Intact
Overall, the market is caught between macroeconomic interest-rate pressures and improving industry fundamentals. Elevated Treasury yields and the unwinding of leveraged positions may continue to weigh on prices in the short term. But on-chain data, the pace of institutional adoption, and the integration of AI technology suggest that the crypto market’s long-term growth thesis remains unchanged. For investors, managing leverage, watching key support levels, and patiently waiting for greater clarity on macroeconomic policy are prudent choices in the current environment.
#BTCFallsBelow$84K #BinanceLaunchesBinanceIntelligence #BNBChainRWA
I. Sudden Flash Crash: $500 Million in Bitcoin Long Positions Wiped Out Within Minutes
In the early hours of October 7, Beijing time, Bitcoin suffered a sharp flash crash. Its price plunged from around $86,600 to below $84,000, triggering the liquidation of more than $550 million in leveraged long positions within minutes. It was one of the largest single-hour liquidation events in recent times.
The sell-off was fueled by a combination of pressures. First, the yield on 10-year U.S. Treasuries surged above 5.3%, its highest level since 2002. Such high yields make risk-free returns highly attractive, prompting substantial capital to leave risk assets for the bond market. Second, a U.S. government wallet transferred around $100 million worth of Bitcoin and Binance Coin, further intensifying selling sentiment. In a knock-on effect, spot Bitcoin ETFs also saw significant net outflows.
However, analysts noted that Bitcoin is still holding above the key support level at its 21-day moving average. Tom Lee, head of research at Fundstrat, believes this could be a temporary bottom in the current bull market and that there is no need for excessive panic.
II. Macroeconomic Storm: Surging Treasury Yields Reshape Global Asset Pricing
The 10-year U.S. Treasury yield breaking above 5.3% carries profound implications for global financial markets. Bond yields have not reached this level since 2002, and even investors who have long been bearish on bonds are turning bullish on sovereign debt for the first time.
The immediate consequence of surging yields is mounting pressure on risk assets. Although the S&P 500 and Nasdaq have recently hit record highs, Bitcoin has decoupled from U.S. stocks, with investors clearly rotating funds out of crypto and into bonds. This “flight back to safety” suggests that in a high-interest-rate environment, crypto’s status as a risk asset is being repriced.
Markets are closely watching for the release of the minutes from the Federal Reserve’s September FOMC meeting to assess whether the Fed might resume its rate-hiking cycle. If the minutes send a clear signal of tighter policy, the crypto market could face even greater downward pressure.
III. Industry Highlights: Binance’s AI Upgrade and Continued Expansion of the BNB Chain Ecosystem
Despite market volatility, industry fundamentals remain positive. Binance co-founder He Yi revealed during an AMA on smart products that the Binance homepage is now fully customizable. AI-powered personalized recommendations will give every user a unique interface. More notably, Binance plans to let users delegate complex on-chain operations to AI agents, marking an important step forward for agentic finance.
Meanwhile, the number of real-world asset holders on BNB Chain has surpassed two million, far exceeding that of other major blockchains. This milestone reflects the accelerating adoption of tokenized real-world assets on BNB Chain by institutional and individual investors, consolidating its leading position in the tokenization sector. BNB also topped the Square’s popularity rankings, with more than 26,000 mentions, reflecting broadly bullish market sentiment.
IV. Accelerating Institutional Adoption: Solana Partners with JPMorgan to Launch a DvP Settlement System
The Solana Foundation has officially launched Solana DvP, an open-source delivery-versus-payment escrow program that enables atomic settlement of tokenized assets in a single transaction, with finality in seconds. Notably, JPMorgan contributed to the system’s design, signaling significant Wall Street recognition of Solana infrastructure’s potential in institutional finance.
In addition, the Winklevoss brothers have filed an S-1 application with the U.S. Securities and Exchange Commission for a spot Zcash ETF, planning to list it on Nasdaq with an annual fee of 0.25%. This has renewed interest in privacy coins. On Ethereum, the Glamsterdam upgrade has been successfully activated on the Sepolia testnet. It includes key improvements such as native proposer-builder separation and block-level access lists, paving the way for deployment on mainnet.
V. Market Outlook: Short-Term Pressure, but the Long-Term Thesis Remains Intact
Overall, the market is caught between macroeconomic interest-rate pressures and improving industry fundamentals. Elevated Treasury yields and the unwinding of leveraged positions may continue to weigh on prices in the short term. But on-chain data, the pace of institutional adoption, and the integration of AI technology suggest that the crypto market’s long-term growth thesis remains unchanged. For investors, managing leverage, watching key support levels, and patiently waiting for greater clarity on macroeconomic policy are prudent choices in the current environment.
#BTCFallsBelow$84K #BinanceLaunchesBinanceIntelligence #BNBChainRWA
11
·
--
U.S. Treasury yields remain high | Yesterday’s pullback doesn’t mean liquidity is loosening | Stay disciplined with BTC at $83,800
My stance is defensive. I’m not treating “yields fell a little” as a sign that Bitcoin has already received a green light from easier financial conditions. Binance Square is discussing BTC falling below $84,000, while Binance News has also relayed market claims that the 10-year U.S. Treasury yield rose above 5.3%. But a check of the U.S. Treasury’s published daily par yields shows the 10-year yield at 5.31% on October 5 and 5.27% on October 6, a one-day decline of 4 basis points. Over the same period, the 30-year yield fell from 5.66% to 5.64%. These are official end-of-day figures, not live intraday quotes, and yesterday’s pullback is no reason to say bond-market pressure has gone away.
Why am I watching these numbers? The 10-year Treasury yield is an important benchmark for discount rates and financing costs across global risk assets. When yields stay high, the opportunity cost of holding non-yielding BTC and the cost of leveraged funding are both harder to ignore. If rates fall and risk appetite recovers, that pressure may ease at the margin. But BTC is also affected by ETF flows, dollar liquidity, and changes in exchange positioning, so one Treasury data point cannot establish a causal link to the price. In particular, the Treasury’s figures reflect the curve around the previous trading day’s close. Today’s intraday moves need to be checked separately; figures with different timestamps should not be blended into a single “synchronized picture.”
The market is still giving me a cautious answer. A check of Binance BTC/USDT spot showed a price of around $83,816, down about 2.8% over 24 hours, with a range of $86,698.99 to $83,442. In other words, even though the official 10-year Treasury yield edged down from the previous day, BTC remains below $84,000 and close to its intraday low. At least so far, a slight decline in yields has not immediately reversed selling pressure in the crypto market. $84,000 is the level BTC needs to reclaim in the short term, while around $83,400 is the line of defense at this session’s low. Around $85,000 and $86,700 are the psychological resistance level and the intraday high area, respectively. A breakout needs confirmation from volume and time—not a news headline.
If I were trading this myself, I’d sit out for now: no bottom-fishing and no adding leverage. I’d consider a spot long using at most 0.3% of my total capital only if BTC closes above $84,300 for two consecutive 15-minute candles, holds $84,000–$84,300 on a retest, and Treasury yields don’t surge again. I’d take half off at $85,000, then close the rest if the price reaches $86,000. If, after entry, a 15-minute candle closes back below $83,800, I’d first cut the position in half; at $83,400, I’d stop out completely. If the price breaks below $83,400 first, the plan is off, and I’ll wait for a new support level to form. To overturn my defensive view, BTC would need to hold above $85,000 convincingly, with verifiable buying support—not an overblown interpretation of yesterday’s 4-basis-point decline as a policy shift.
Sources: U.S. Treasury daily Treasury par yield curve rates for October 5–6; Binance BTC/USDT spot snapshot. #BTCFallsBelow$84K #BTC
This is solely my personal market commentary and does not constitute investment advice.
U.S. Treasury yields remain high | Yesterday’s pullback doesn’t mean liquidity is loosening | Stay disciplined with BTC at $83,800
My stance is defensive. I’m not treating “yields fell a little” as a sign that Bitcoin has already received a green light from easier financial conditions. Binance Square is discussing BTC falling below $84,000, while Binance News has also relayed market claims that the 10-year U.S. Treasury yield rose above 5.3%. But a check of the U.S. Treasury’s published daily par yields shows the 10-year yield at 5.31% on October 5 and 5.27% on October 6, a one-day decline of 4 basis points. Over the same period, the 30-year yield fell from 5.66% to 5.64%. These are official end-of-day figures, not live intraday quotes, and yesterday’s pullback is no reason to say bond-market pressure has gone away.
Why am I watching these numbers? The 10-year Treasury yield is an important benchmark for discount rates and financing costs across global risk assets. When yields stay high, the opportunity cost of holding non-yielding BTC and the cost of leveraged funding are both harder to ignore. If rates fall and risk appetite recovers, that pressure may ease at the margin. But BTC is also affected by ETF flows, dollar liquidity, and changes in exchange positioning, so one Treasury data point cannot establish a causal link to the price. In particular, the Treasury’s figures reflect the curve around the previous trading day’s close. Today’s intraday moves need to be checked separately; figures with different timestamps should not be blended into a single “synchronized picture.”
The market is still giving me a cautious answer. A check of Binance BTC/USDT spot showed a price of around $83,816, down about 2.8% over 24 hours, with a range of $86,698.99 to $83,442. In other words, even though the official 10-year Treasury yield edged down from the previous day, BTC remains below $84,000 and close to its intraday low. At least so far, a slight decline in yields has not immediately reversed selling pressure in the crypto market. $84,000 is the level BTC needs to reclaim in the short term, while around $83,400 is the line of defense at this session’s low. Around $85,000 and $86,700 are the psychological resistance level and the intraday high area, respectively. A breakout needs confirmation from volume and time—not a news headline.
If I were trading this myself, I’d sit out for now: no bottom-fishing and no adding leverage. I’d consider a spot long using at most 0.3% of my total capital only if BTC closes above $84,300 for two consecutive 15-minute candles, holds $84,000–$84,300 on a retest, and Treasury yields don’t surge again. I’d take half off at $85,000, then close the rest if the price reaches $86,000. If, after entry, a 15-minute candle closes back below $83,800, I’d first cut the position in half; at $83,400, I’d stop out completely. If the price breaks below $83,400 first, the plan is off, and I’ll wait for a new support level to form. To overturn my defensive view, BTC would need to hold above $85,000 convincingly, with verifiable buying support—not an overblown interpretation of yesterday’s 4-basis-point decline as a policy shift.
Sources: U.S. Treasury daily Treasury par yield curve rates for October 5–6; Binance BTC/USDT spot snapshot. #BTCFallsBelow$84K #BTC
This is solely my personal market commentary and does not constitute investment advice.
My stance is defensive. I’m not treating “yields fell a little” as a sign that Bitcoin has already received a green light from easier financial conditions. Binance Square is discussing BTC falling below $84,000, while Binance News has also relayed market claims that the 10-year U.S. Treasury yield rose above 5.3%. But a check of the U.S. Treasury’s published daily par yields shows the 10-year yield at 5.31% on October 5 and 5.27% on October 6, a one-day decline of 4 basis points. Over the same period, the 30-year yield fell from 5.66% to 5.64%. These are official end-of-day figures, not live intraday quotes, and yesterday’s pullback is no reason to say bond-market pressure has gone away.
Why am I watching these numbers? The 10-year Treasury yield is an important benchmark for discount rates and financing costs across global risk assets. When yields stay high, the opportunity cost of holding non-yielding BTC and the cost of leveraged funding are both harder to ignore. If rates fall and risk appetite recovers, that pressure may ease at the margin. But BTC is also affected by ETF flows, dollar liquidity, and changes in exchange positioning, so one Treasury data point cannot establish a causal link to the price. In particular, the Treasury’s figures reflect the curve around the previous trading day’s close. Today’s intraday moves need to be checked separately; figures with different timestamps should not be blended into a single “synchronized picture.”
The market is still giving me a cautious answer. A check of Binance BTC/USDT spot showed a price of around $83,816, down about 2.8% over 24 hours, with a range of $86,698.99 to $83,442. In other words, even though the official 10-year Treasury yield edged down from the previous day, BTC remains below $84,000 and close to its intraday low. At least so far, a slight decline in yields has not immediately reversed selling pressure in the crypto market. $84,000 is the level BTC needs to reclaim in the short term, while around $83,400 is the line of defense at this session’s low. Around $85,000 and $86,700 are the psychological resistance level and the intraday high area, respectively. A breakout needs confirmation from volume and time—not a news headline.
If I were trading this myself, I’d sit out for now: no bottom-fishing and no adding leverage. I’d consider a spot long using at most 0.3% of my total capital only if BTC closes above $84,300 for two consecutive 15-minute candles, holds $84,000–$84,300 on a retest, and Treasury yields don’t surge again. I’d take half off at $85,000, then close the rest if the price reaches $86,000. If, after entry, a 15-minute candle closes back below $83,800, I’d first cut the position in half; at $83,400, I’d stop out completely. If the price breaks below $83,400 first, the plan is off, and I’ll wait for a new support level to form. To overturn my defensive view, BTC would need to hold above $85,000 convincingly, with verifiable buying support—not an overblown interpretation of yesterday’s 4-basis-point decline as a policy shift.
Sources: U.S. Treasury daily Treasury par yield curve rates for October 5–6; Binance BTC/USDT spot snapshot. #BTCFallsBelow$84K #BTC
This is solely my personal market commentary and does not constitute investment advice.
6
·
--
Today at a café, I noticed the person at the next table staring at their phone with a furrowed brow. It turned out Bitcoin had fallen below the $84,000 mark. This reminded me of the market turbulence over the past few days. According to CoinMarketCap data, Bitcoin has experienced sharp price swings since April, reaching a high of $89,000, but recently it has begun a steep correction amid the combined pressures of macroeconomic headwinds and regulatory uncertainty. Leading analytics firm Glassnode noted that the current decline is closely linked to central banks around the world tightening monetary policy and institutional investors taking a cautious stance. Just yesterday, the Federal Reserve again hinted that it might raise interest rates further, intensifying market sentiment favoring the sell-off of digital assets. Watching the numbers flicker across the screen, I couldn't help wondering: are these extreme fluctuations a test or an opportunity for the long-term development of the crypto market? In any case, investors all seem to be waiting for a clear signal. #BTCFallsBelow$84K
#BTC $BTC
Today at a café, I noticed the person at the next table staring at their phone with a furrowed brow. It turned out Bitcoin had fallen below the $84,000 mark. This reminded me of the market turbulence over the past few days. According to CoinMarketCap data, Bitcoin has experienced sharp price swings since April, reaching a high of $89,000, but recently it has begun a steep correction amid the combined pressures of macroeconomic headwinds and regulatory uncertainty. Leading analytics firm Glassnode noted that the current decline is closely linked to central banks around the world tightening monetary policy and institutional investors taking a cautious stance. Just yesterday, the Federal Reserve again hinted that it might raise interest rates further, intensifying market sentiment favoring the sell-off of digital assets. Watching the numbers flicker across the screen, I couldn't help wondering: are these extreme fluctuations a test or an opportunity for the long-term development of the crypto market? In any case, investors all seem to be waiting for a clear signal. #BTCFallsBelow$84K
#BTC $BTC
#BTC $BTC
183
Log in to explore more content
Join global crypto users on Binance Square
⚡️ Get latest and useful information about crypto.
💬 Trusted by the world’s largest crypto exchange.
👍 Discover real insights from verified creators.
Email / Phone number
Trending Topics
1
#CPIWatch
89.4M views
511,039 Discussing
2
#SouthKoreaPlansTighterCybersecurityRules
1,540 views
111 Discussing
3
#BTCFallsBelow$81K
17,662 views
77 Discussing
4
#TradersBetOnThreeMoreFedHikes
23,013 views
429 Discussing
5
#BitcoinFallsBelow$83KAgain
5,154 views
37 Discussing
6
#BastionPressesSkyAIOverSOLSales
6,656 views
239 Discussing
7
#PatrickWittExitsWhiteHouseCryptoRole
11,220 views
229 Discussing
8
#HEXFounderRichardHeartArrestedInIstanbul
6,329 views
175 Discussing
9
#SolanaSchedulesAlpenglowUpgradeForOct21
5,358 views
131 Discussing
10
#KOSPIFalls6%IntradayTriggeringSidecar
6,988 views
114 Discussing