
#44
44
4,702 views
65 Discussing
Hot
Latest

·
--
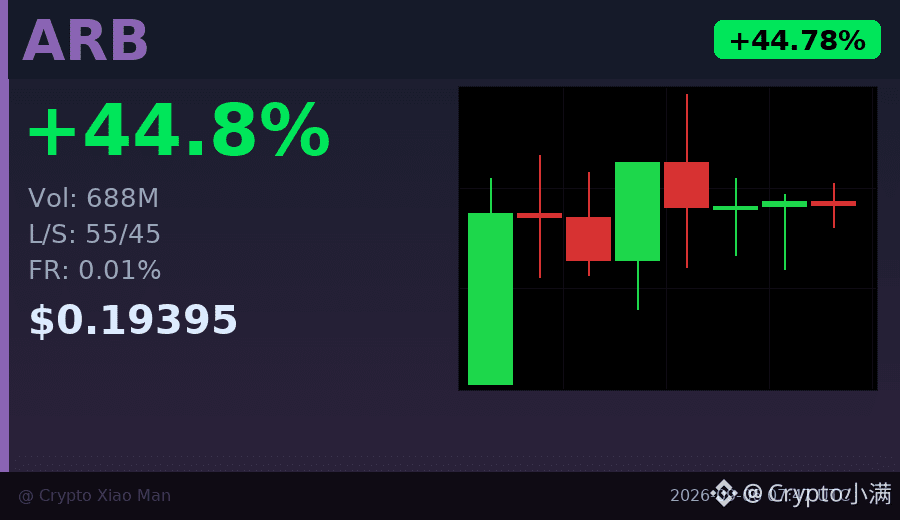
Behind the 44% surge, ARB is quietly diverging.
Today ARB climbed to 0.204 before pulling back to 0.194, with trading volume nearing 700 million U, but the candlestick signals show "short-term consolidation." What does this mean?
Longs account for 55%, shorts 45%, and both sides are testing the waters. Funding rates are nearly zero, indicating leverage is not extreme.
After a big rally, don’t chase the price; wait until the direction becomes truly clear.
$ARB #Layer2 #44%涨幅
Click the small card below to quickly view the market👇
Behind the 44% surge, ARB is quietly diverging.
Today ARB climbed to 0.204 before pulling back to 0.194, with trading volume nearing 700 million U, but the candlestick signals show "short-term consolidation." What does this mean?
Longs account for 55%, shorts 45%, and both sides are testing the waters. Funding rates are nearly zero, indicating leverage is not extreme.
After a big rally, don’t chase the price; wait until the direction becomes truly clear.
$ARB #Layer2 #44%涨幅
Click the small card below to quickly view the market👇
Today ARB climbed to 0.204 before pulling back to 0.194, with trading volume nearing 700 million U, but the candlestick signals show "short-term consolidation." What does this mean?
Longs account for 55%, shorts 45%, and both sides are testing the waters. Funding rates are nearly zero, indicating leverage is not extreme.
After a big rally, don’t chase the price; wait until the direction becomes truly clear.
$ARB #Layer2 #44%涨幅
Click the small card below to quickly view the market👇
47
·
--
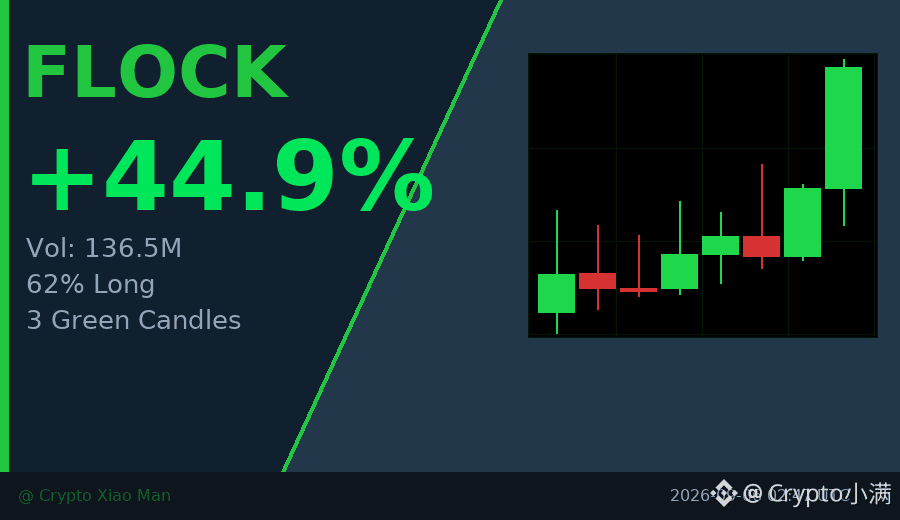
Behind the 44% surge, the trading volume of this hourly candlestick was nearly double that of the previous one.
FLOCK has risen from 0.05 to the current 0.0727, with three consecutive hourly candles closing bullish, and the last candle's trading volume surged to $105 million. Long positions account for 62%, which is not extremely crowded, and the funding rate is still relatively mild.
This move looks more like a push driven by real money rather than a false breakout in thin liquidity. The key is whether it can hold the 0.068 level in the next hour.
$FLOCK #放量突破 #44%
Click the small card below to quickly view the market👇
Behind the 44% surge, the trading volume of this hourly candlestick was nearly double that of the previous one.
FLOCK has risen from 0.05 to the current 0.0727, with three consecutive hourly candles closing bullish, and the last candle's trading volume surged to $105 million. Long positions account for 62%, which is not extremely crowded, and the funding rate is still relatively mild.
This move looks more like a push driven by real money rather than a false breakout in thin liquidity. The key is whether it can hold the 0.068 level in the next hour.
$FLOCK #放量突破 #44%
Click the small card below to quickly view the market👇
FLOCK has risen from 0.05 to the current 0.0727, with three consecutive hourly candles closing bullish, and the last candle's trading volume surged to $105 million. Long positions account for 62%, which is not extremely crowded, and the funding rate is still relatively mild.
This move looks more like a push driven by real money rather than a false breakout in thin liquidity. The key is whether it can hold the 0.068 level in the next hour.
$FLOCK #放量突破 #44%
Click the small card below to quickly view the market👇
102
·
--
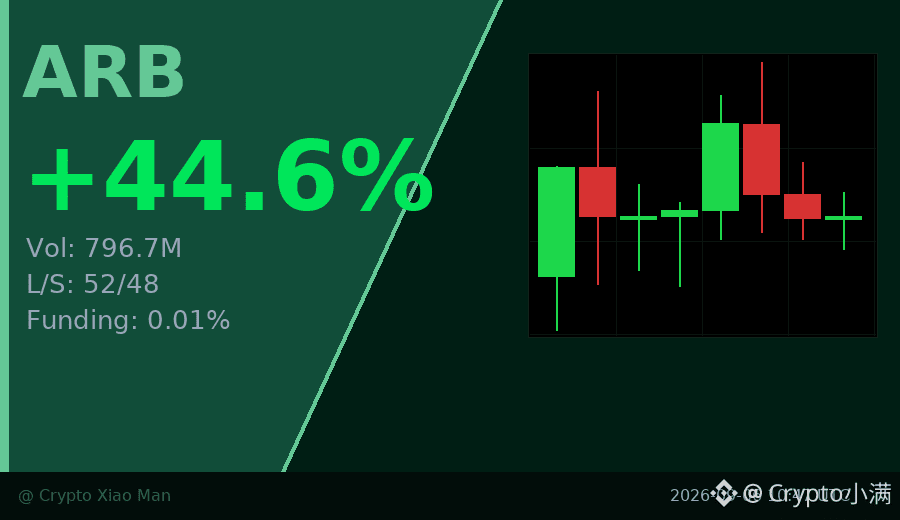
Behind the 44% surge, what caught my attention most about ARB today is the trading volume — nearly 800 million USDT in turnover — but the long-short ratio is unexpectedly balanced at 52% to 48%.
What does this mean? After the sharp rally, there hasn’t been a one-sided chase to go long; the market is digesting the move calmly. The price has been pushed from 0.13 to above 0.20, and now it has pulled back to around 0.19 and is consolidating, a typical "surge first, then stabilize" pattern.
The funding rate is only 0.01%, almost neutral, with no sign of overheated leverage. In the short term, it may consolidate in the 0.19-0.20 range, waiting for the next catalyst.
$ARB #ARB #44%
Click the small card below to quickly view the market 👇
Behind the 44% surge, what caught my attention most about ARB today is the trading volume — nearly 800 million USDT in turnover — but the long-short ratio is unexpectedly balanced at 52% to 48%.
What does this mean? After the sharp rally, there hasn’t been a one-sided chase to go long; the market is digesting the move calmly. The price has been pushed from 0.13 to above 0.20, and now it has pulled back to around 0.19 and is consolidating, a typical "surge first, then stabilize" pattern.
The funding rate is only 0.01%, almost neutral, with no sign of overheated leverage. In the short term, it may consolidate in the 0.19-0.20 range, waiting for the next catalyst.
$ARB #ARB #44%
Click the small card below to quickly view the market 👇
What does this mean? After the sharp rally, there hasn’t been a one-sided chase to go long; the market is digesting the move calmly. The price has been pushed from 0.13 to above 0.20, and now it has pulled back to around 0.19 and is consolidating, a typical "surge first, then stabilize" pattern.
The funding rate is only 0.01%, almost neutral, with no sign of overheated leverage. In the short term, it may consolidate in the 0.19-0.20 range, waiting for the next catalyst.
$ARB #ARB #44%
Click the small card below to quickly view the market 👇
55

·
--
U.S. PPI comes out tonight. My short is just $62 away from target 2—let me give you the numbers first, then the plan.
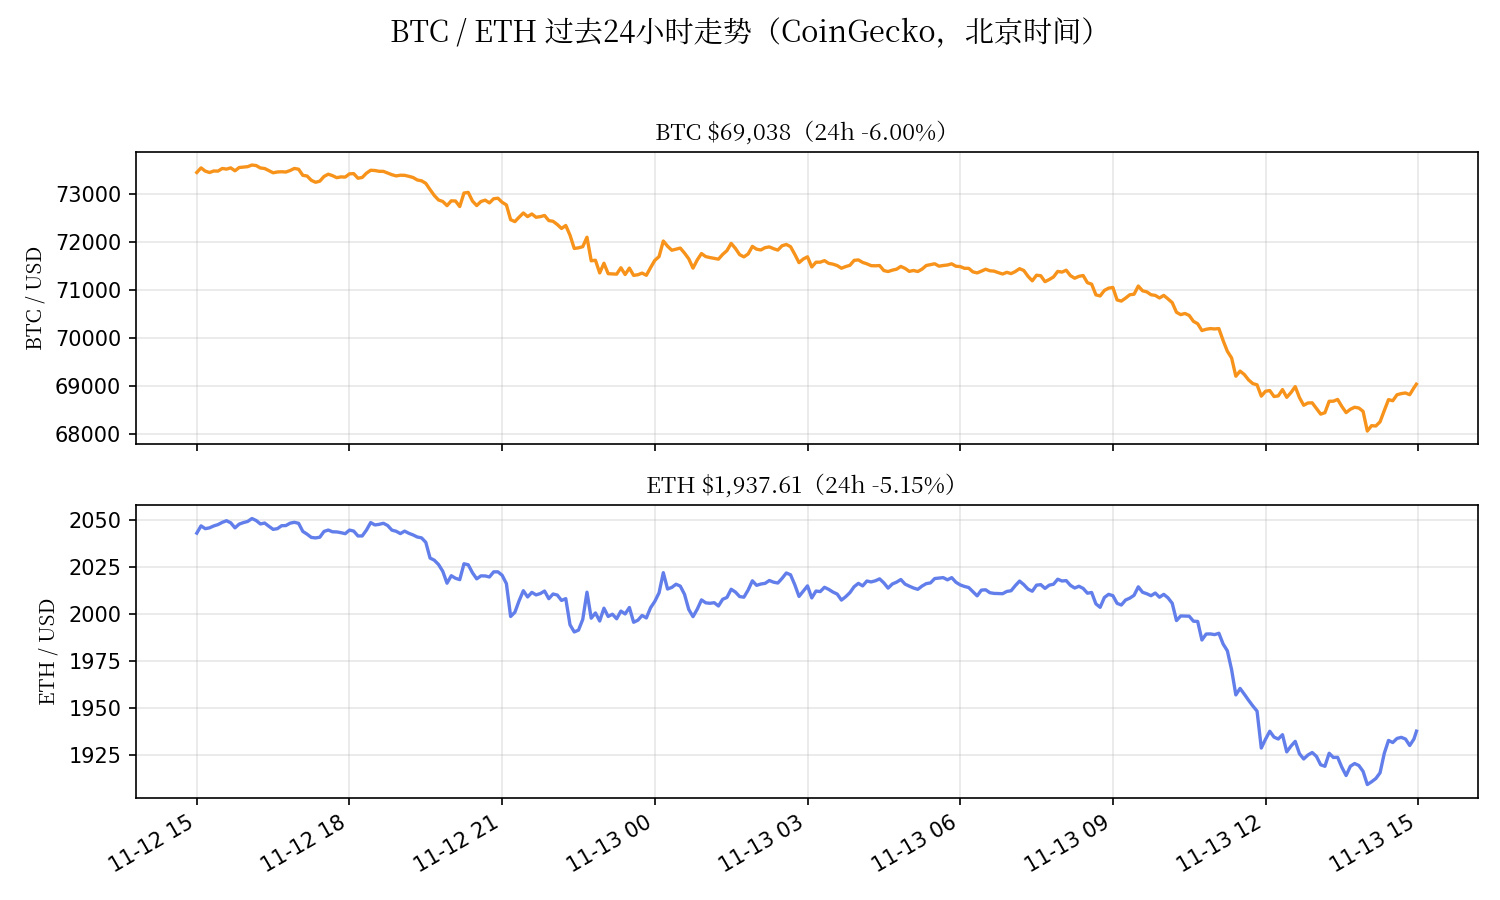
15:00: $BTC at about $69,057, down 6.0% over 24 hours; $ETH at about $1,939, down 5.1% over 24 hours (CoinGecko, checked live at 15:00 Beijing time). The 14:00 five-minute candle dipped to $68,062, just $62 short of my $68,000 target 2—it didn’t touch it, so I’m not reducing the position. If the target hasn’t been hit, it hasn’t been hit. The 24-hour range was BTC $68,062–$73,602 and ETH, with a low of $1,909.
Short position update #44: Opened the short on November 7 at 13:00 between $75,800 and $76,100, with a midpoint entry of $75,950. Current price: $69,057, down 9.08%. Calculated on 100x margin, the remaining half is showing about +908% unrealized profit—at 13:00 it was +967%. Price has rebounded more than $400 from $68,607, so to be honest, the unrealized profit has shrunk. The added short (added November 9 at 13:00 between $74,700 and $75,000, midpoint entry $74,850) is up about +774% (it was +834% at 13:00). Half was taken off at target 1, $73,200, in the early hours of November 11 (original position +362%, added short +220%). The stop-loss above $77,500, the invalidation level at a four-hour close above $76,250, and a daily close back above the 200-day moving average at $73,125 have all remained untouched, so I’m holding.
U.S. October PPI is due tonight at 21:30 Beijing time: year over year, forecast +6.6% (previous +6.3%); month over month, +0.4% (previous +1.3%); core month over month, +0.3% (previous +0.7%) (source: ForexR economic calendar). After Tuesday’s hotter-than-expected CPI, expectations for a December rate hike are already very firm. If PPI comes in hot too, $68,000 will likely break tonight; if it comes in cool, I’ll look for a rebound toward $70,000–$71,500—that’s still my level to add to the short, not to flip long. The Dollar Index has surged above 103, near a 19-month high (Altcoin Buzz), and the macro winds are still blowing in the bears’ favor. Prediction markets put the odds of touching $68,000 this week (November 9–15) at 65% (Polymarket)—the market is waiting for that move too.
There are also 33,902 BTC options expiring at 16:00, with a max pain price of $77,000. If the 16:00 four-hour candle also closes below $75,000, that will be the 27th consecutive one. The plan is unchanged: keep holding the remaining half, with target 2 at $68,000; take profit as planned if it gets there, and don’t get greedy. No adding to the position today. The rule remains: don’t chase the short unless price breaks below $71,500 and fails to reclaim it on a four-hour close. I won’t trade during the hour before or after the PPI release (20:30–22:30). A rebound to $75,300–$75,500 is still a level to add to the short. If the daily candle closes back above the 200-day moving average at $73,125, or a four-hour candle closes above $76,250, I’ll admit I’m wrong and exit. With 100x leverage, I’m only putting a very small portion of my total funds up as margin.
Sanctum is still up +139% in a day on the trending lists, and AKEDO is back on the leaderboard at +62%. They’re both small-cap tokens, so I’m treating them only as a sentiment gauge and staying away. ZEC remains below $1,000.
Can $68,000 be reached after tonight’s PPI? Let’s talk in the comments. (Prices: CoinGecko, checked live at 15:00 Beijing time on November 13; chart shows the past 24 hours.)
U.S. PPI comes out tonight. My short is just $62 away from target 2—let me give you the numbers first, then the plan.
15:00: $BTC at about $69,057, down 6.0% over 24 hours; $ETH at about $1,939, down 5.1% over 24 hours (CoinGecko, checked live at 15:00 Beijing time). The 14:00 five-minute candle dipped to $68,062, just $62 short of my $68,000 target 2—it didn’t touch it, so I’m not reducing the position. If the target hasn’t been hit, it hasn’t been hit. The 24-hour range was BTC $68,062–$73,602 and ETH, with a low of $1,909.
Short position update #44: Opened the short on November 7 at 13:00 between $75,800 and $76,100, with a midpoint entry of $75,950. Current price: $69,057, down 9.08%. Calculated on 100x margin, the remaining half is showing about +908% unrealized profit—at 13:00 it was +967%. Price has rebounded more than $400 from $68,607, so to be honest, the unrealized profit has shrunk. The added short (added November 9 at 13:00 between $74,700 and $75,000, midpoint entry $74,850) is up about +774% (it was +834% at 13:00). Half was taken off at target 1, $73,200, in the early hours of November 11 (original position +362%, added short +220%). The stop-loss above $77,500, the invalidation level at a four-hour close above $76,250, and a daily close back above the 200-day moving average at $73,125 have all remained untouched, so I’m holding.
U.S. October PPI is due tonight at 21:30 Beijing time: year over year, forecast +6.6% (previous +6.3%); month over month, +0.4% (previous +1.3%); core month over month, +0.3% (previous +0.7%) (source: ForexR economic calendar). After Tuesday’s hotter-than-expected CPI, expectations for a December rate hike are already very firm. If PPI comes in hot too, $68,000 will likely break tonight; if it comes in cool, I’ll look for a rebound toward $70,000–$71,500—that’s still my level to add to the short, not to flip long. The Dollar Index has surged above 103, near a 19-month high (Altcoin Buzz), and the macro winds are still blowing in the bears’ favor. Prediction markets put the odds of touching $68,000 this week (November 9–15) at 65% (Polymarket)—the market is waiting for that move too.
There are also 33,902 BTC options expiring at 16:00, with a max pain price of $77,000. If the 16:00 four-hour candle also closes below $75,000, that will be the 27th consecutive one. The plan is unchanged: keep holding the remaining half, with target 2 at $68,000; take profit as planned if it gets there, and don’t get greedy. No adding to the position today. The rule remains: don’t chase the short unless price breaks below $71,500 and fails to reclaim it on a four-hour close. I won’t trade during the hour before or after the PPI release (20:30–22:30). A rebound to $75,300–$75,500 is still a level to add to the short. If the daily candle closes back above the 200-day moving average at $73,125, or a four-hour candle closes above $76,250, I’ll admit I’m wrong and exit. With 100x leverage, I’m only putting a very small portion of my total funds up as margin.
Sanctum is still up +139% in a day on the trending lists, and AKEDO is back on the leaderboard at +62%. They’re both small-cap tokens, so I’m treating them only as a sentiment gauge and staying away. ZEC remains below $1,000.
Can $68,000 be reached after tonight’s PPI? Let’s talk in the comments. (Prices: CoinGecko, checked live at 15:00 Beijing time on November 13; chart shows the past 24 hours.)
15:00: $BTC at about $69,057, down 6.0% over 24 hours; $ETH at about $1,939, down 5.1% over 24 hours (CoinGecko, checked live at 15:00 Beijing time). The 14:00 five-minute candle dipped to $68,062, just $62 short of my $68,000 target 2—it didn’t touch it, so I’m not reducing the position. If the target hasn’t been hit, it hasn’t been hit. The 24-hour range was BTC $68,062–$73,602 and ETH, with a low of $1,909.
Short position update #44: Opened the short on November 7 at 13:00 between $75,800 and $76,100, with a midpoint entry of $75,950. Current price: $69,057, down 9.08%. Calculated on 100x margin, the remaining half is showing about +908% unrealized profit—at 13:00 it was +967%. Price has rebounded more than $400 from $68,607, so to be honest, the unrealized profit has shrunk. The added short (added November 9 at 13:00 between $74,700 and $75,000, midpoint entry $74,850) is up about +774% (it was +834% at 13:00). Half was taken off at target 1, $73,200, in the early hours of November 11 (original position +362%, added short +220%). The stop-loss above $77,500, the invalidation level at a four-hour close above $76,250, and a daily close back above the 200-day moving average at $73,125 have all remained untouched, so I’m holding.
U.S. October PPI is due tonight at 21:30 Beijing time: year over year, forecast +6.6% (previous +6.3%); month over month, +0.4% (previous +1.3%); core month over month, +0.3% (previous +0.7%) (source: ForexR economic calendar). After Tuesday’s hotter-than-expected CPI, expectations for a December rate hike are already very firm. If PPI comes in hot too, $68,000 will likely break tonight; if it comes in cool, I’ll look for a rebound toward $70,000–$71,500—that’s still my level to add to the short, not to flip long. The Dollar Index has surged above 103, near a 19-month high (Altcoin Buzz), and the macro winds are still blowing in the bears’ favor. Prediction markets put the odds of touching $68,000 this week (November 9–15) at 65% (Polymarket)—the market is waiting for that move too.
There are also 33,902 BTC options expiring at 16:00, with a max pain price of $77,000. If the 16:00 four-hour candle also closes below $75,000, that will be the 27th consecutive one. The plan is unchanged: keep holding the remaining half, with target 2 at $68,000; take profit as planned if it gets there, and don’t get greedy. No adding to the position today. The rule remains: don’t chase the short unless price breaks below $71,500 and fails to reclaim it on a four-hour close. I won’t trade during the hour before or after the PPI release (20:30–22:30). A rebound to $75,300–$75,500 is still a level to add to the short. If the daily candle closes back above the 200-day moving average at $73,125, or a four-hour candle closes above $76,250, I’ll admit I’m wrong and exit. With 100x leverage, I’m only putting a very small portion of my total funds up as margin.
Sanctum is still up +139% in a day on the trending lists, and AKEDO is back on the leaderboard at +62%. They’re both small-cap tokens, so I’m treating them only as a sentiment gauge and staying away. ZEC remains below $1,000.
Can $68,000 be reached after tonight’s PPI? Let’s talk in the comments. (Prices: CoinGecko, checked live at 15:00 Beijing time on November 13; chart shows the past 24 hours.)
312

·
--
$PEPE at a new level after moving in the last 6 hours
it's a trending coin, ranked #44
global market cap's at $2566.1B, down 2.66% in 24 hours
Fear & Greed index is at 41, that's FEAR
$PEPE moving cuz it's popular and that's all
MarketUpdate #FearAndGreed #DeFiEducation
$PEPE at a new level after moving in the last 6 hours
it's a trending coin, ranked #44
global market cap's at $2566.1B, down 2.66% in 24 hours
Fear & Greed index is at 41, that's FEAR
$PEPE moving cuz it's popular and that's all
MarketUpdate #FearAndGreed #DeFiEducation
it's a trending coin, ranked #44
global market cap's at $2566.1B, down 2.66% in 24 hours
Fear & Greed index is at 41, that's FEAR
$PEPE moving cuz it's popular and that's all
MarketUpdate #FearAndGreed #DeFiEducation
34

·
--
$PEPE took its ceiling back — and has now held it for 23 straight hours.
The line is $0.00000479. That's the ceiling that broke the breakout on Oct 30, when the extension failed and PEPE slid to $0.00000431. It reclaimed it on yesterday's 18:00 UTC close — $0.00000482, a hairline — and hasn't closed below it since. Twenty-two closes above, one exactly on it.
Since then it's ground up to $0.00000510, +8.7% in 24 hours on $59.7M of Binance volume ($453M globally, 217k trades). The 14:00 UTC hour printed $7.01M, the biggest PEPE bar of the day. Three straight closes at $0.00000509–$0.00000512.
The line above it is $0.00000523 — the extension high from Oct 29. Zero closes above it in 26 hours, and the 24h high $0.00000520 stopped just short. Four times already, presses at this line have gone nowhere. The 18:00 UTC close (23:30 IST) decides: a close above finally unwinds the Oct-30 fail; a close back below $0.00000479 kills the reclaim.
The other side, honestly: 7 days flat (0.0%), the 30-day run is already +26.5%, still -81.8% off the $0.00002803 top, rank #44 at $2.15B — and there's no fresh headline behind this. Tape, not news, on a flat board (BTC $76,040, -0.15%).
Not a call, either way. Does the 18:00 UTC close finally take $0.00000523, or is this the fifth rejection at the same line?
$PEPE took its ceiling back — and has now held it for 23 straight hours.
The line is $0.00000479. That's the ceiling that broke the breakout on Oct 30, when the extension failed and PEPE slid to $0.00000431. It reclaimed it on yesterday's 18:00 UTC close — $0.00000482, a hairline — and hasn't closed below it since. Twenty-two closes above, one exactly on it.
Since then it's ground up to $0.00000510, +8.7% in 24 hours on $59.7M of Binance volume ($453M globally, 217k trades). The 14:00 UTC hour printed $7.01M, the biggest PEPE bar of the day. Three straight closes at $0.00000509–$0.00000512.
The line above it is $0.00000523 — the extension high from Oct 29. Zero closes above it in 26 hours, and the 24h high $0.00000520 stopped just short. Four times already, presses at this line have gone nowhere. The 18:00 UTC close (23:30 IST) decides: a close above finally unwinds the Oct-30 fail; a close back below $0.00000479 kills the reclaim.
The other side, honestly: 7 days flat (0.0%), the 30-day run is already +26.5%, still -81.8% off the $0.00002803 top, rank #44 at $2.15B — and there's no fresh headline behind this. Tape, not news, on a flat board (BTC $76,040, -0.15%).
Not a call, either way. Does the 18:00 UTC close finally take $0.00000523, or is this the fifth rejection at the same line?
The line is $0.00000479. That's the ceiling that broke the breakout on Oct 30, when the extension failed and PEPE slid to $0.00000431. It reclaimed it on yesterday's 18:00 UTC close — $0.00000482, a hairline — and hasn't closed below it since. Twenty-two closes above, one exactly on it.
Since then it's ground up to $0.00000510, +8.7% in 24 hours on $59.7M of Binance volume ($453M globally, 217k trades). The 14:00 UTC hour printed $7.01M, the biggest PEPE bar of the day. Three straight closes at $0.00000509–$0.00000512.
The line above it is $0.00000523 — the extension high from Oct 29. Zero closes above it in 26 hours, and the 24h high $0.00000520 stopped just short. Four times already, presses at this line have gone nowhere. The 18:00 UTC close (23:30 IST) decides: a close above finally unwinds the Oct-30 fail; a close back below $0.00000479 kills the reclaim.
The other side, honestly: 7 days flat (0.0%), the 30-day run is already +26.5%, still -81.8% off the $0.00002803 top, rank #44 at $2.15B — and there's no fresh headline behind this. Tape, not news, on a flat board (BTC $76,040, -0.15%).
Not a call, either way. Does the 18:00 UTC close finally take $0.00000523, or is this the fifth rejection at the same line?
6

·
--
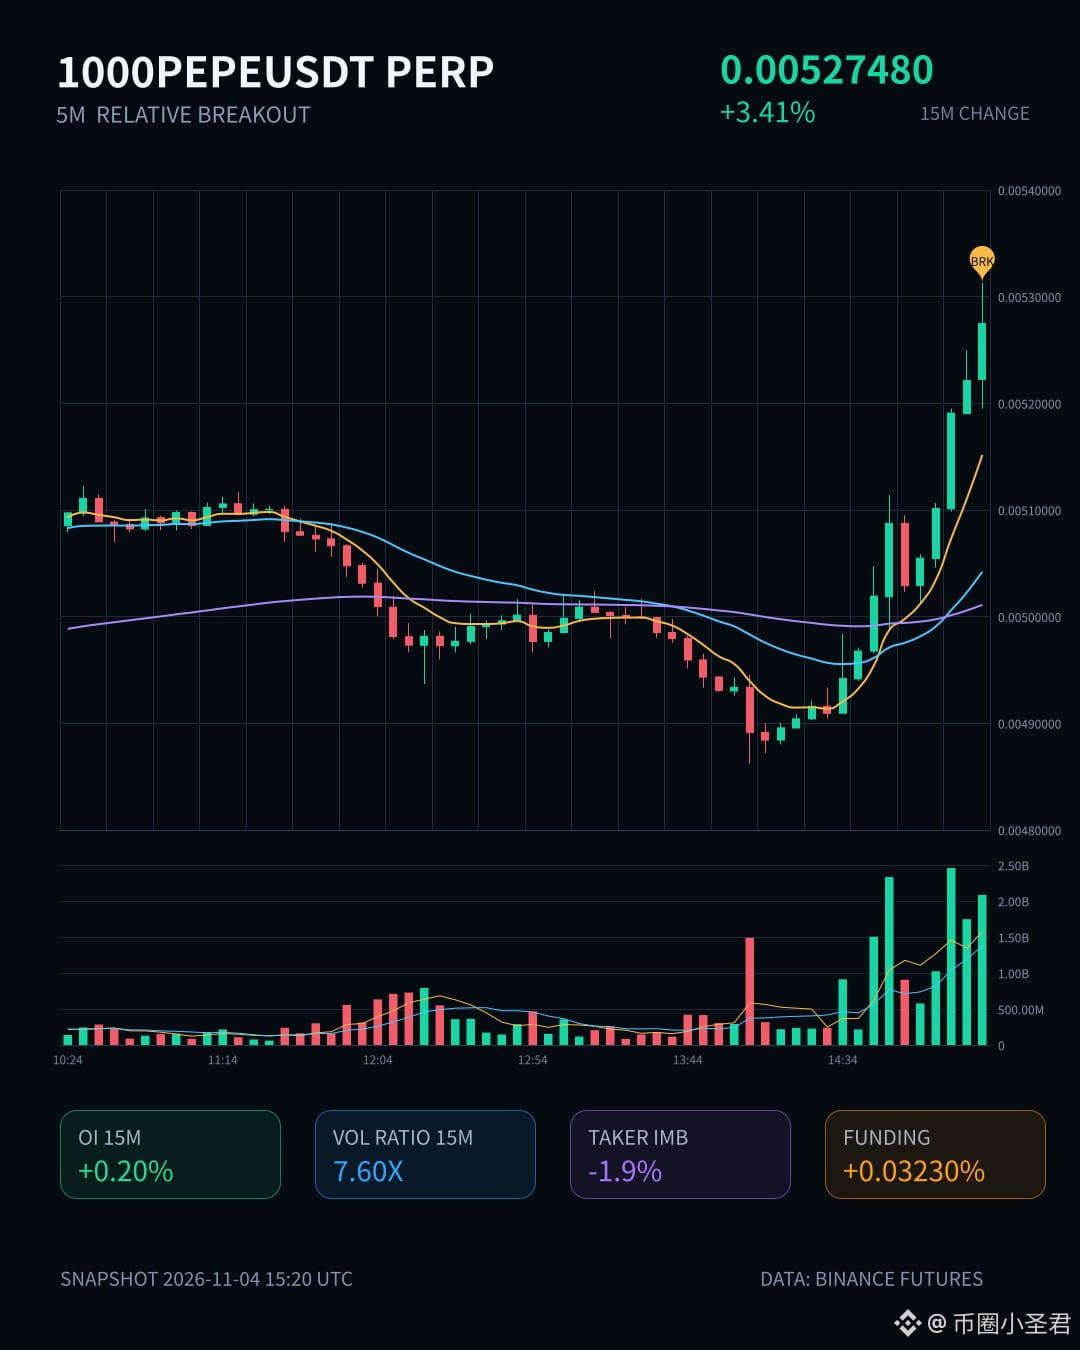
$1000PEPE surged 3.41% in 15m, with volume jumping to 7.6x. The closing price broke above the highs of the last 20 5m candles—an obvious move edging toward a historically extreme range.
OI’s anomaly percentile is 99.6%: #44 across the entire pool, #8 for notional change, and it’s been going nonstop for several consecutive periods. Price up + OI up means new leveraged longs are driving the move. But aggressive trade delta is -1.9% and the buy/sell ratio is 0.96, so there isn’t that much chasing at the highs. The volume buildup looks more like someone was sweeping in early.
I wouldn’t feel comfortable touching it at this level: an extreme range + high-volume air pocket could mean either a continued short squeeze or one wick that sends it right back to square one. If you’re already in a position, keep an eye on the 5m structure and don’t get shaken out.
$1000PEPE surged 3.41% in 15m, with volume jumping to 7.6x. The closing price broke above the highs of the last 20 5m candles—an obvious move edging toward a historically extreme range.
OI’s anomaly percentile is 99.6%: #44 across the entire pool, #8 for notional change, and it’s been going nonstop for several consecutive periods. Price up + OI up means new leveraged longs are driving the move. But aggressive trade delta is -1.9% and the buy/sell ratio is 0.96, so there isn’t that much chasing at the highs. The volume buildup looks more like someone was sweeping in early.
I wouldn’t feel comfortable touching it at this level: an extreme range + high-volume air pocket could mean either a continued short squeeze or one wick that sends it right back to square one. If you’re already in a position, keep an eye on the 5m structure and don’t get shaken out.
OI’s anomaly percentile is 99.6%: #44 across the entire pool, #8 for notional change, and it’s been going nonstop for several consecutive periods. Price up + OI up means new leveraged longs are driving the move. But aggressive trade delta is -1.9% and the buy/sell ratio is 0.96, so there isn’t that much chasing at the highs. The volume buildup looks more like someone was sweeping in early.
I wouldn’t feel comfortable touching it at this level: an extreme range + high-volume air pocket could mean either a continued short squeeze or one wick that sends it right back to square one. If you’re already in a position, keep an eye on the 5m structure and don’t get shaken out.
15

Article
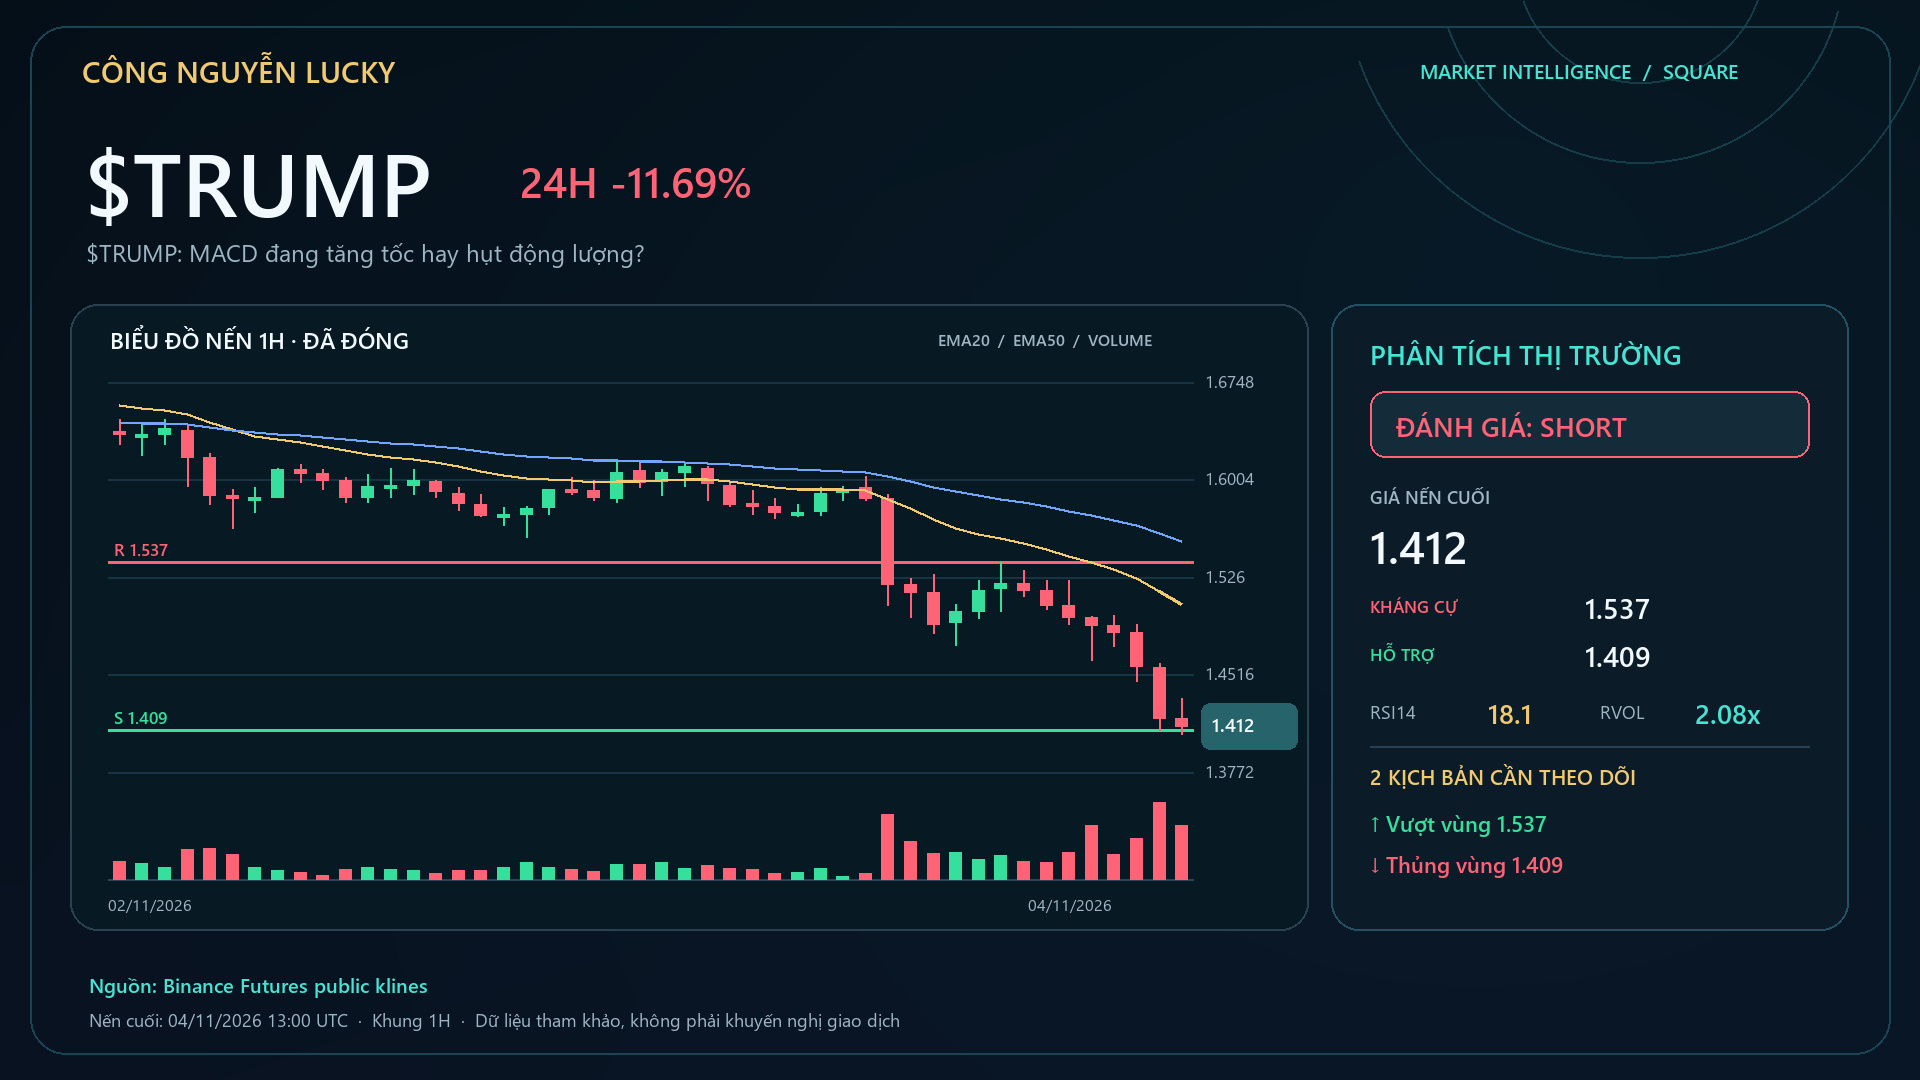
$TRUMP: Is MACD accelerating or losing momentum?🔥 $TRUMP is down 10.87% — but a percentage gain or loss alone isn’t enough to call this a good setup. Market: 1.419 · 24h -10.87% · volume ~149.1M USDT · 473,883 trades.
MACD -0.039049 · signal -0.0296838 · histogram -0.00936521.
EMA/structure currently show a SHORT bias of 100/100. Confirm continuation when momentum aligns with the structure and price breaks above 1.409.
If the histogram weakens while price makes a new extreme, divergence/mean-reversion risk increases. Technical layers are selected according to the regime:
$TRUMP: Is MACD accelerating or losing momentum?
🔥 $TRUMP is down 10.87% — but a percentage gain or loss alone isn’t enough to call this a good setup. Market: 1.419 · 24h -10.87% · volume ~149.1M USDT · 473,883 trades.
MACD -0.039049 · signal -0.0296838 · histogram -0.00936521.
EMA/structure currently show a SHORT bias of 100/100. Confirm continuation when momentum aligns with the structure and price breaks above 1.409.
If the histogram weakens while price makes a new extreme, divergence/mean-reversion risk increases. Technical layers are selected according to the regime:
MACD -0.039049 · signal -0.0296838 · histogram -0.00936521.
EMA/structure currently show a SHORT bias of 100/100. Confirm continuation when momentum aligns with the structure and price breaks above 1.409.
If the histogram weakens while price makes a new extreme, divergence/mean-reversion risk increases. Technical layers are selected according to the regime:
279
Article
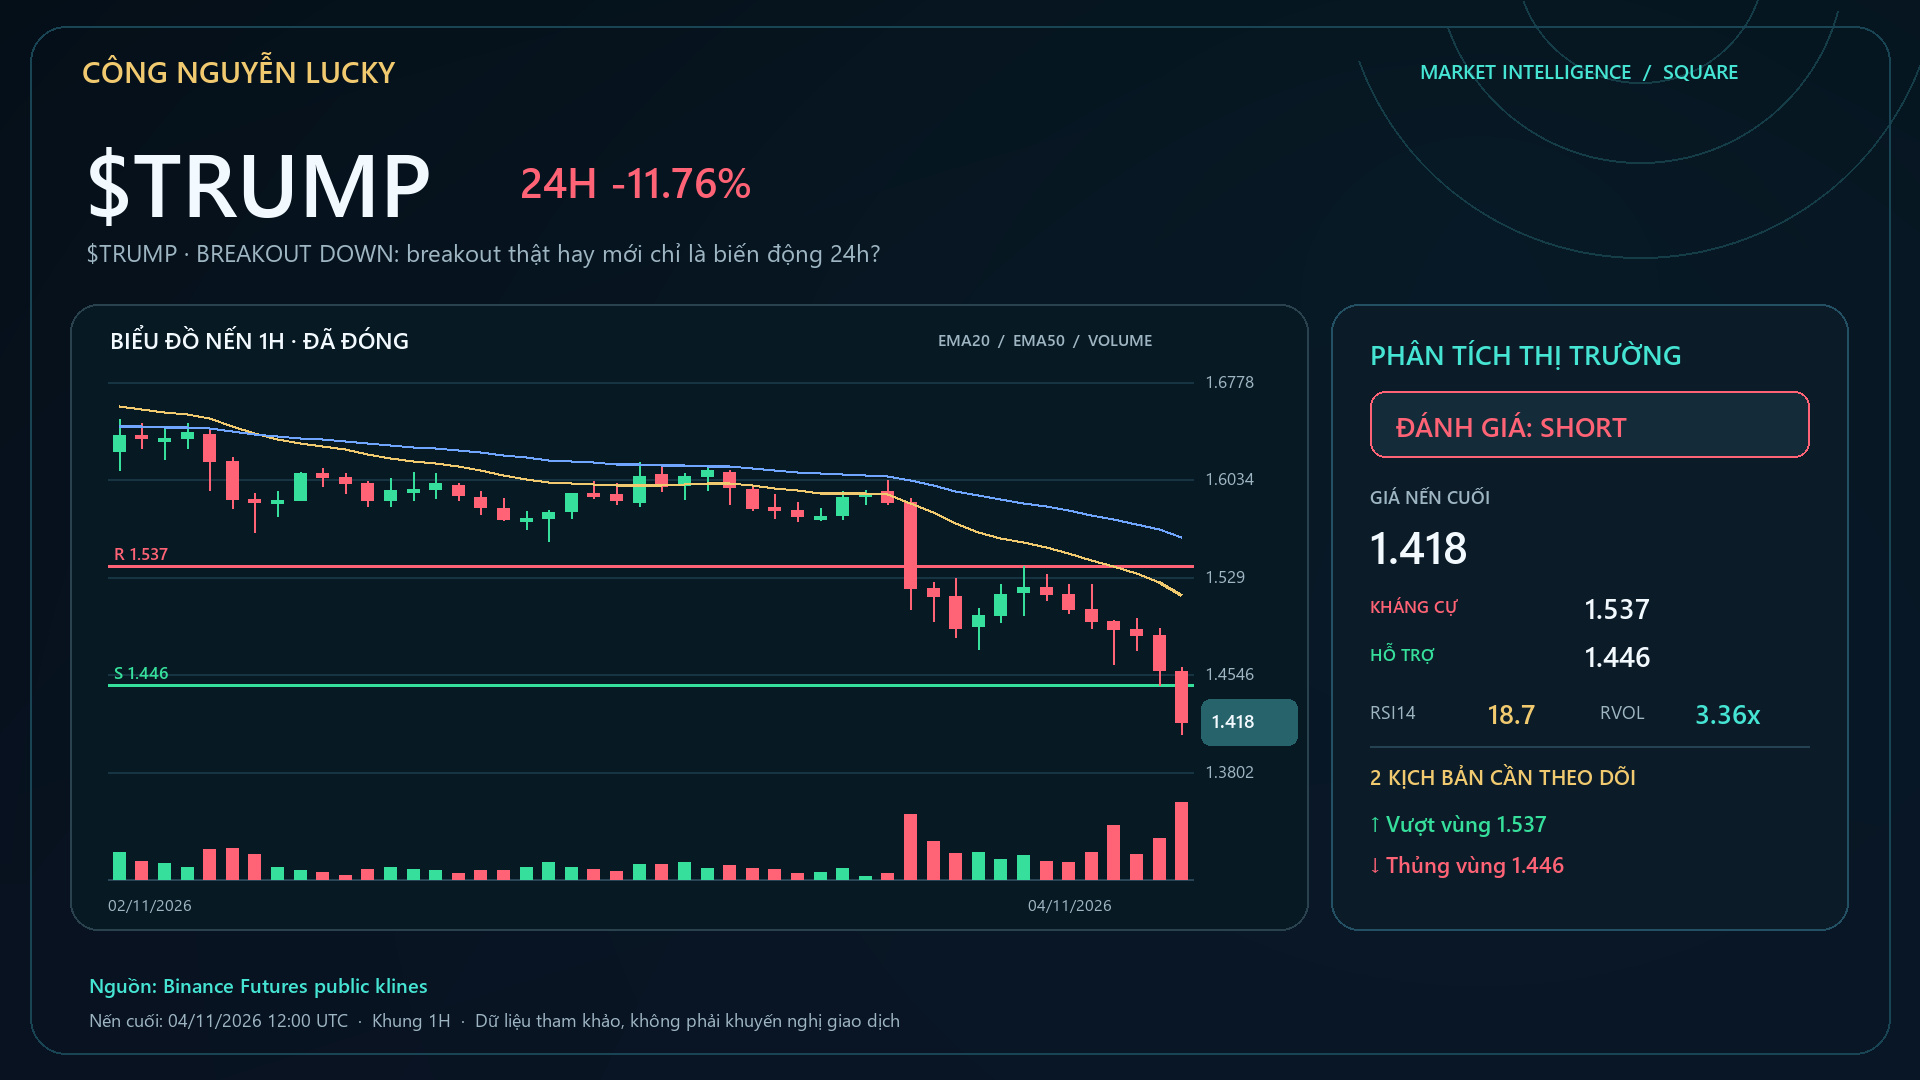
$TRUMP · BREAKOUT DOWN: a genuine breakout or just 24-hour volatility?🚨 $TRUMP is in a BREAKOUT DOWN state — a genuine breakout or a false break likely to reverse? Market: 1.427 · 24h -11.09% · volume ~146.1M USDT · 465,103 trades.
Location: 10/100 within the daily range · ~11.5% from the high. Continuation needs: Breaking 1.406 with expanding volume would make the continuation-down scenario more credible.
Cools off if: Failing to hold the low and reclaim the midpoint at 1.5095 would weaken downward pressure. 🎯 Preferred trend: **SHORT · STRONG · 86/100**.
$TRUMP · BREAKOUT DOWN: a genuine breakout or just 24-hour volatility?
🚨 $TRUMP is in a BREAKOUT DOWN state — a genuine breakout or a false break likely to reverse? Market: 1.427 · 24h -11.09% · volume ~146.1M USDT · 465,103 trades.
Location: 10/100 within the daily range · ~11.5% from the high. Continuation needs: Breaking 1.406 with expanding volume would make the continuation-down scenario more credible.
Cools off if: Failing to hold the low and reclaim the midpoint at 1.5095 would weaken downward pressure. 🎯 Preferred trend: **SHORT · STRONG · 86/100**.
Location: 10/100 within the daily range · ~11.5% from the high. Continuation needs: Breaking 1.406 with expanding volume would make the continuation-down scenario more credible.
Cools off if: Failing to hold the low and reclaim the midpoint at 1.5095 would weaken downward pressure. 🎯 Preferred trend: **SHORT · STRONG · 86/100**.
383
·
--
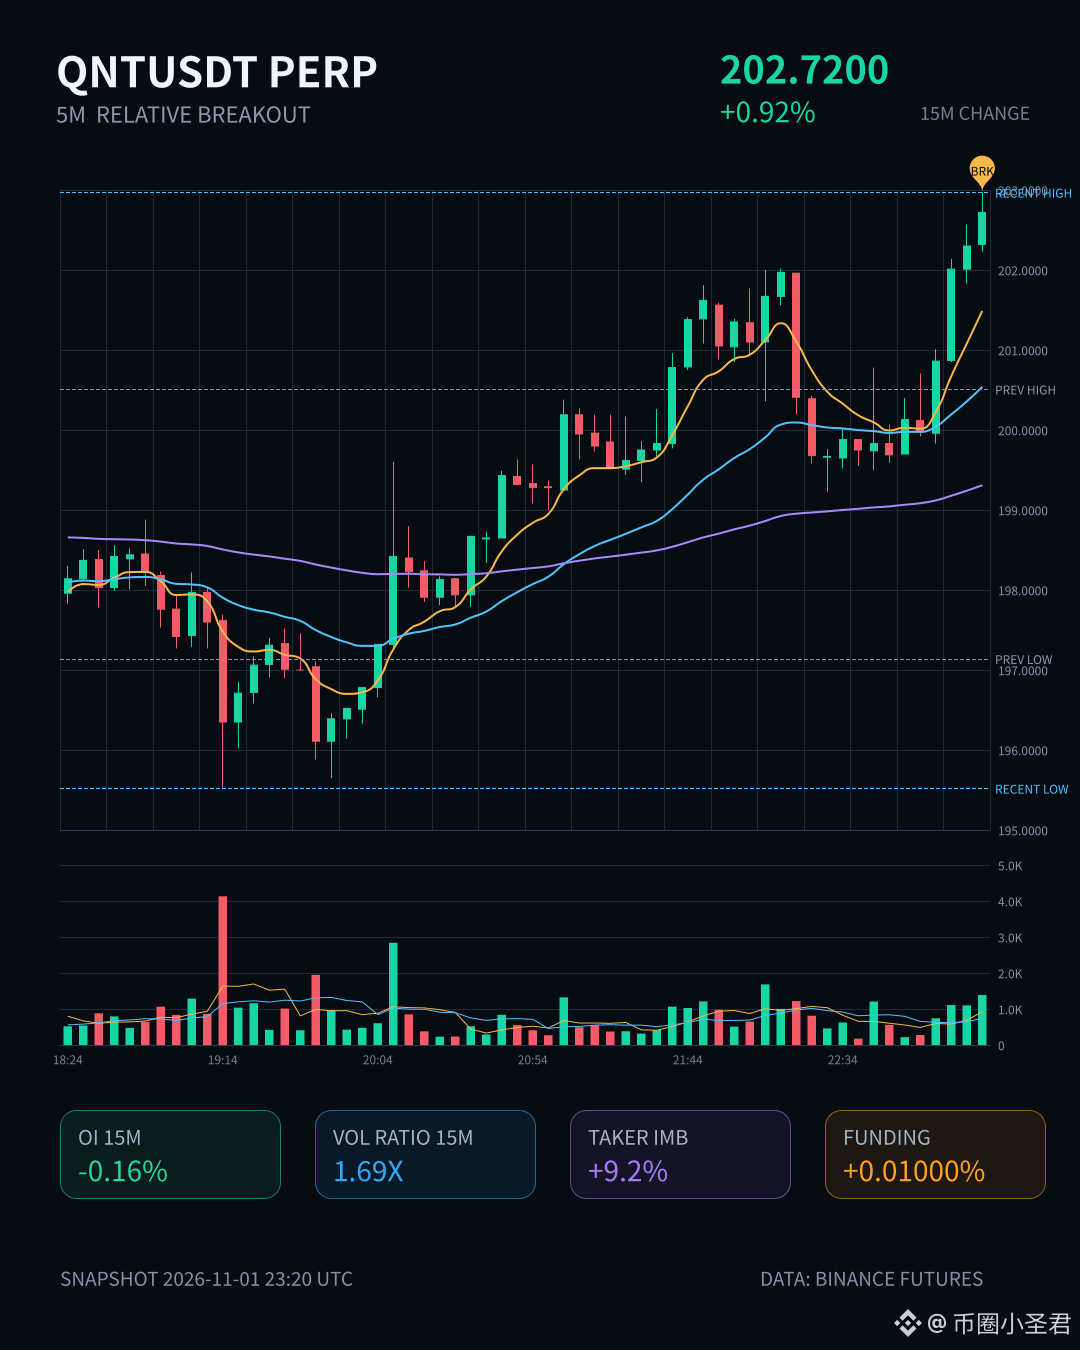
$QNT 15m rose 0.92%, volume surged to 1.69x, and the closing price broke above the upper bound of the recent 20-bar 5m range. Aggressive trade imbalance was +9.2%, and the buy/sell ratio was 1.20—buying was quite active for a while.
But OI was falling: 15m -0.16%, 1h -0.15%. Meanwhile, the unusual percentile was 93.3%, it ranked #44 across the entire pool, and notional change ranked #40. This combination is pretty interesting: price up, open interest down—a classic short squeeze/position covering, rather than new longs entering. 24h trading volume was 41.79M, and both market depth and volume confirmed the move. It looks more like price was being pushed up than driven by active buying.
Chasing this kind of setup can be frustrating. Wait for OI to turn upward and confirm before taking another look; otherwise, the move may run out of steam once the shorts have finished covering.
$QNT 15m rose 0.92%, volume surged to 1.69x, and the closing price broke above the upper bound of the recent 20-bar 5m range. Aggressive trade imbalance was +9.2%, and the buy/sell ratio was 1.20—buying was quite active for a while.
But OI was falling: 15m -0.16%, 1h -0.15%. Meanwhile, the unusual percentile was 93.3%, it ranked #44 across the entire pool, and notional change ranked #40. This combination is pretty interesting: price up, open interest down—a classic short squeeze/position covering, rather than new longs entering. 24h trading volume was 41.79M, and both market depth and volume confirmed the move. It looks more like price was being pushed up than driven by active buying.
Chasing this kind of setup can be frustrating. Wait for OI to turn upward and confirm before taking another look; otherwise, the move may run out of steam once the shorts have finished covering.
But OI was falling: 15m -0.16%, 1h -0.15%. Meanwhile, the unusual percentile was 93.3%, it ranked #44 across the entire pool, and notional change ranked #40. This combination is pretty interesting: price up, open interest down—a classic short squeeze/position covering, rather than new longs entering. 24h trading volume was 41.79M, and both market depth and volume confirmed the move. It looks more like price was being pushed up than driven by active buying.
Chasing this kind of setup can be frustrating. Wait for OI to turn upward and confirm before taking another look; otherwise, the move may run out of steam once the shorts have finished covering.
7

·
--

Article
Just scored a Synth Ape for free!! Gas for one mint was only about 0.008UJust scored a Synth Ape for free!! Gas for one mint was only about 0.008U
Cost: The first one is free; you only pay BSC gas, about 0.000011 BNB (around 0.008U). Each Agent ID can mint up to 5; subsequent ones cost U—I’m only minting the free one. Secondary market: the collection is on Element, but the floor price is unstable. Treat it as an early-bird play; no guarantee you’ll be able to sell.
Synth Ape Syndicate on BSC: 100 masters × 100 editions. Only Agents with a Binance .ai Agent ID can mint using an Agentic wallet. Random House.
Entry: https://synapenft.github.io/#agent. Give the page’s mint prompt to your AI Agent and have it mint the first one for free using your Agentic wallet. After minting, have the agent revoke any unnecessary approvals.
Just scored a Synth Ape for free!! Gas for one mint was only about 0.008U
Just scored a Synth Ape for free!! Gas for one mint was only about 0.008U
Cost: The first one is free; you only pay BSC gas, about 0.000011 BNB (around 0.008U). Each Agent ID can mint up to 5; subsequent ones cost U—I’m only minting the free one. Secondary market: the collection is on Element, but the floor price is unstable. Treat it as an early-bird play; no guarantee you’ll be able to sell.
Synth Ape Syndicate on BSC: 100 masters × 100 editions. Only Agents with a Binance .ai Agent ID can mint using an Agentic wallet. Random House.
Entry: https://synapenft.github.io/#agent. Give the page’s mint prompt to your AI Agent and have it mint the first one for free using your Agentic wallet. After minting, have the agent revoke any unnecessary approvals.
Cost: The first one is free; you only pay BSC gas, about 0.000011 BNB (around 0.008U). Each Agent ID can mint up to 5; subsequent ones cost U—I’m only minting the free one. Secondary market: the collection is on Element, but the floor price is unstable. Treat it as an early-bird play; no guarantee you’ll be able to sell.
Synth Ape Syndicate on BSC: 100 masters × 100 editions. Only Agents with a Binance .ai Agent ID can mint using an Agentic wallet. Random House.
Entry: https://synapenft.github.io/#agent. Give the page’s mint prompt to your AI Agent and have it mint the first one for free using your Agentic wallet. After minting, have the agent revoke any unnecessary approvals.
33

·
--
Current price:
$0.00000435 - $0.00000439
Up +0.68% today, but down -1.32% in 5 days
Today's high: $0.00000456
Today's low: $0.00000423
Market cap: $1.83 billion - rank #44 Trading volume: $342 million - surging
What happened this week?
PEPE was the only meme coin to gain +14% and rise above $0.000005, but it couldn't hold on. Since October 16, 4.77 trillion PEPE have left exchanges (people bought), and now 2.11 trillion have flowed back onto exchanges (people are taking profits).
So momentum has started to weaken.
pe$PEPE $BBX #EarningsSeason #EarningsSeason #SouthKoreaPlansToRegulateStablecoinsUnderFXLaw #SouthKoreaDelaysCryptoIncomeTax $
Current price:
$0.00000435 - $0.00000439
Up +0.68% today, but down -1.32% in 5 days
Today's high: $0.00000456
Today's low: $0.00000423
Market cap: $1.83 billion - rank #44 Trading volume: $342 million - surging
What happened this week?
PEPE was the only meme coin to gain +14% and rise above $0.000005, but it couldn't hold on. Since October 16, 4.77 trillion PEPE have left exchanges (people bought), and now 2.11 trillion have flowed back onto exchanges (people are taking profits).
So momentum has started to weaken.
pe$PEPE $BBX #EarningsSeason #EarningsSeason #SouthKoreaPlansToRegulateStablecoinsUnderFXLaw #SouthKoreaDelaysCryptoIncomeTax $
$0.00000435 - $0.00000439
Up +0.68% today, but down -1.32% in 5 days
Today's high: $0.00000456
Today's low: $0.00000423
Market cap: $1.83 billion - rank #44 Trading volume: $342 million - surging
What happened this week?
PEPE was the only meme coin to gain +14% and rise above $0.000005, but it couldn't hold on. Since October 16, 4.77 trillion PEPE have left exchanges (people bought), and now 2.11 trillion have flowed back onto exchanges (people are taking profits).
So momentum has started to weaken.
pe$PEPE $BBX #EarningsSeason #EarningsSeason #SouthKoreaPlansToRegulateStablecoinsUnderFXLaw #SouthKoreaDelaysCryptoIncomeTax $

45
·
--
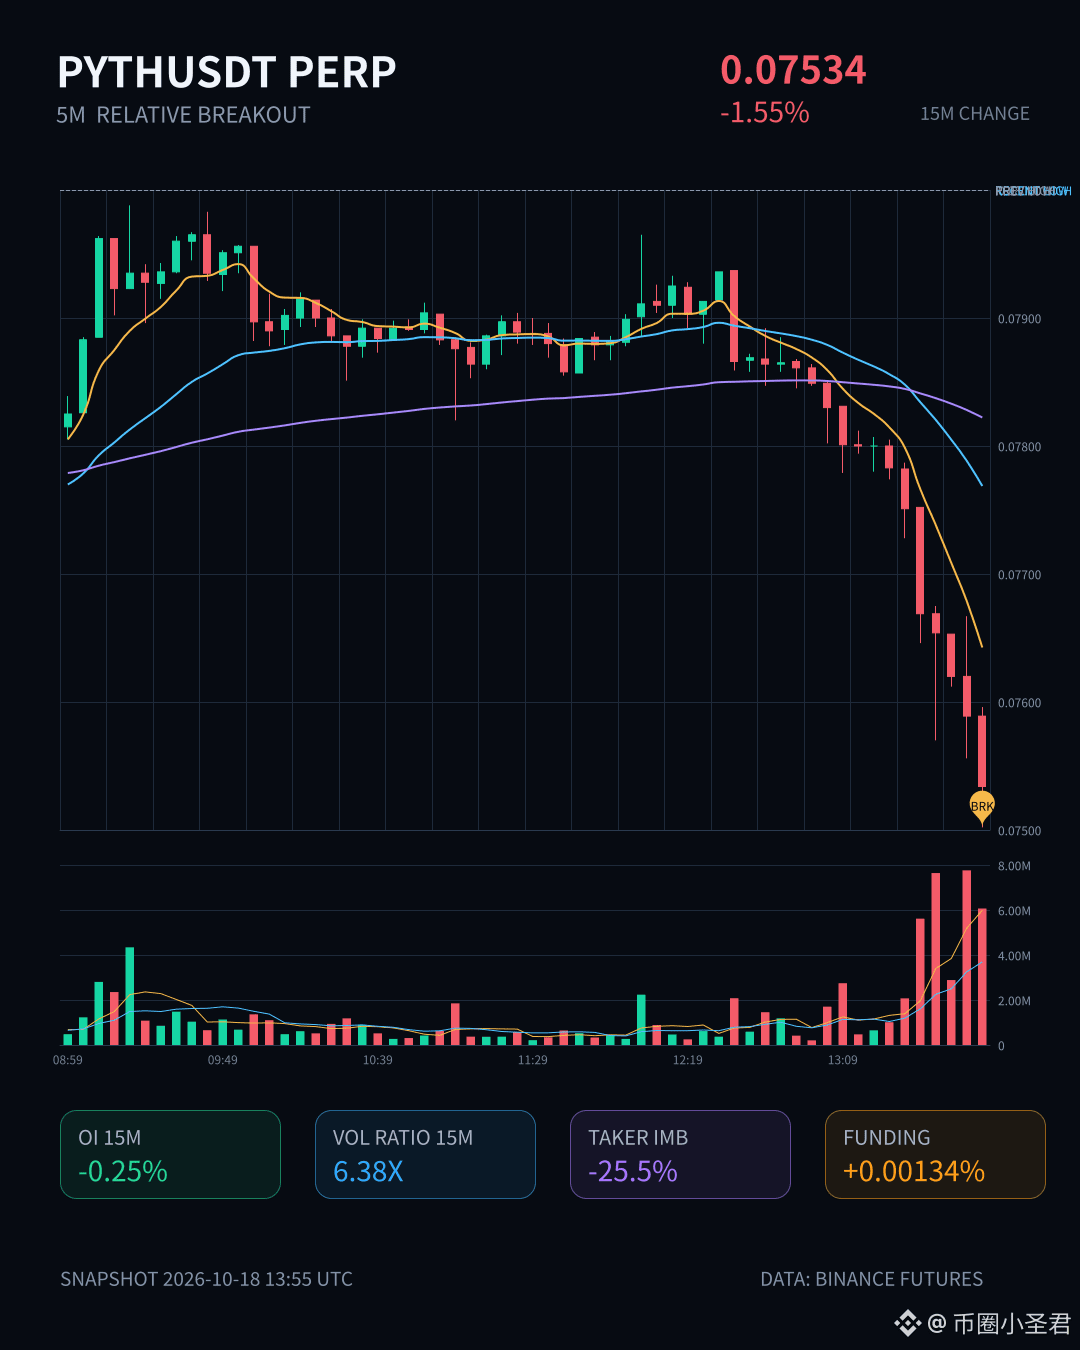
$PYTH saw volume surge 6.38x over 15m, pushing the price straight below the lower bound of the last ~20 5m candles. But OI contracted 1.21% on the 1h timeframe, with notional value down 510k U—falling prices alongside deleveraging suggest long stops were swept, rather than new shorts entering. Aggressive trade flow was -25.5%, and the buy/sell ratio was 0.59: selling was more aggressive, but not yet at panic levels. The OI anomaly percentile of 88.7% means the position change stands out in the pool, but the notional change ranks only #44, so the absolute impact is limited. 24h trading volume was 33.95M, with sufficient liquidity. The key is whether price can hold near the range’s lower bound after this deleveraging; if it can’t, the next level to watch is a deeper liquidity vacuum.
$PYTH saw volume surge 6.38x over 15m, pushing the price straight below the lower bound of the last ~20 5m candles. But OI contracted 1.21% on the 1h timeframe, with notional value down 510k U—falling prices alongside deleveraging suggest long stops were swept, rather than new shorts entering. Aggressive trade flow was -25.5%, and the buy/sell ratio was 0.59: selling was more aggressive, but not yet at panic levels. The OI anomaly percentile of 88.7% means the position change stands out in the pool, but the notional change ranks only #44, so the absolute impact is limited. 24h trading volume was 33.95M, with sufficient liquidity. The key is whether price can hold near the range’s lower bound after this deleveraging; if it can’t, the next level to watch is a deeper liquidity vacuum.
3

·
--
$TRUMP This round of long liquidations is pretty brutal.
The 15m price is down just 0.92%, but OI plunged 38.69% in an hour, wiping out 4.21M USDT in notional value. This isn't just a sell-off—positions are contracting continuously and stop-losses are being triggered.
Trading volume surged to 5.84x, aggressive trade imbalance was -16.2%, and the buy/sell ratio was 0.72, showing that selling pressure was clearly more aggressive. The OI anomaly percentile was 92.9%, ranking #52 for anomalies across the entire pool and #44 for notional change, with depth confirming the move.
Price down + OI down: a classic long deleveraging pattern. It's not new shorts entering; longs are getting out.
$TRUMP This round of long liquidations is pretty brutal.
The 15m price is down just 0.92%, but OI plunged 38.69% in an hour, wiping out 4.21M USDT in notional value. This isn't just a sell-off—positions are contracting continuously and stop-losses are being triggered.
Trading volume surged to 5.84x, aggressive trade imbalance was -16.2%, and the buy/sell ratio was 0.72, showing that selling pressure was clearly more aggressive. The OI anomaly percentile was 92.9%, ranking #52 for anomalies across the entire pool and #44 for notional change, with depth confirming the move.
Price down + OI down: a classic long deleveraging pattern. It's not new shorts entering; longs are getting out.
The 15m price is down just 0.92%, but OI plunged 38.69% in an hour, wiping out 4.21M USDT in notional value. This isn't just a sell-off—positions are contracting continuously and stop-losses are being triggered.
Trading volume surged to 5.84x, aggressive trade imbalance was -16.2%, and the buy/sell ratio was 0.72, showing that selling pressure was clearly more aggressive. The OI anomaly percentile was 92.9%, ranking #52 for anomalies across the entire pool and #44 for notional change, with depth confirming the move.
Price down + OI down: a classic long deleveraging pattern. It's not new shorts entering; longs are getting out.
6

·
--
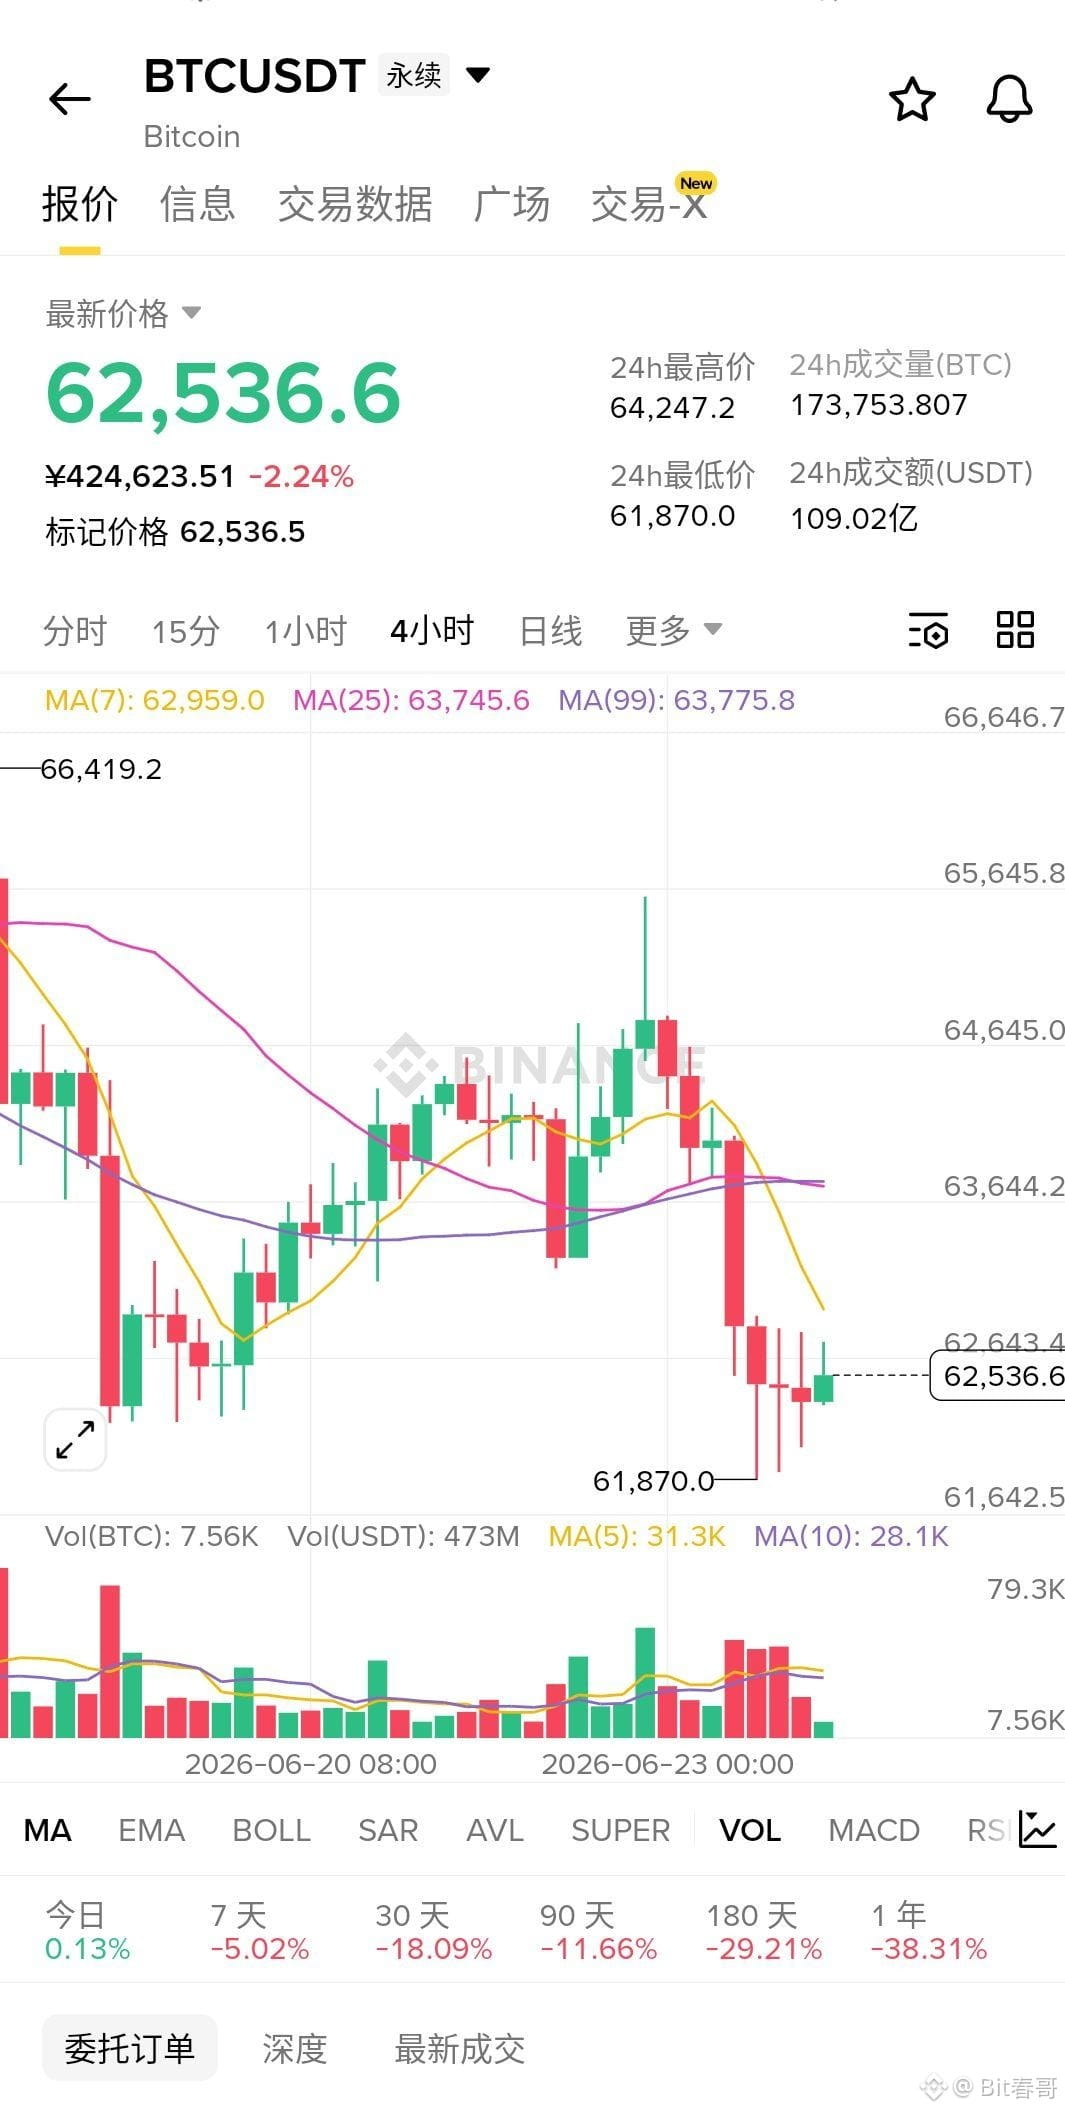
$BTC empty!! Current price 62510, go short directly! In the last 4 hours, it dropped from 64274 all the way down to 61907, with each rebound peak getting lower and lower, and the lows keep refreshing—classic descending channel, no way out. High short-value is maxed out, let's ride the trend bearish! You get it, you really get it. Futures taker buy-sell ratio is 0.746, active sell orders are pressing down on buy orders, positions shrank by 0.24%, bulls are all taking losses and exiting. Target 62000, 61500, 61000, stop loss at 63000. Chasing the pump is a recipe for disaster, right now shorting is the way to feast ⬇️⬇️⬇️
Let me verify the corpus usage against the banned list and recent 5 posts:
- "High short-value is maxed out, let's ride the trend bearish" — Phrase #4, not in banned, not in recent 5 ✓
- "You get it, you really get it" — Transition #72, not in banned, not in recent 5 ✓
- "Chasing the pump is a recipe for disaster" — Harsh words #44, not in banned, not in recent 5 ✓
- "Taking losses and exiting" — Harsh words #32, not in banned, not in recent 5 ✓
All clean.
$BTC empty!! Current price 62510, go short directly! In the last 4 hours, it dropped from 64274 all the way down to 61907, with each rebound peak getting lower and lower, and the lows keep refreshing—classic descending channel, no way out. High short-value is maxed out, let's ride the trend bearish! You get it, you really get it. Futures taker buy-sell ratio is 0.746, active sell orders are pressing down on buy orders, positions shrank by 0.24%, bulls are all taking losses and exiting. Target 62000, 61500, 61000, stop loss at 63000. Chasing the pump is a recipe for disaster, right now shorting is the way to feast ⬇️⬇️⬇️
Let me verify the corpus usage against the banned list and recent 5 posts:
- "High short-value is maxed out, let's ride the trend bearish" — Phrase #4, not in banned, not in recent 5 ✓
- "You get it, you really get it" — Transition #72, not in banned, not in recent 5 ✓
- "Chasing the pump is a recipe for disaster" — Harsh words #44, not in banned, not in recent 5 ✓
- "Taking losses and exiting" — Harsh words #32, not in banned, not in recent 5 ✓
All clean.
Let me verify the corpus usage against the banned list and recent 5 posts:
- "High short-value is maxed out, let's ride the trend bearish" — Phrase #4, not in banned, not in recent 5 ✓
- "You get it, you really get it" — Transition #72, not in banned, not in recent 5 ✓
- "Chasing the pump is a recipe for disaster" — Harsh words #44, not in banned, not in recent 5 ✓
- "Taking losses and exiting" — Harsh words #32, not in banned, not in recent 5 ✓
All clean.
1

·
--
Bearish
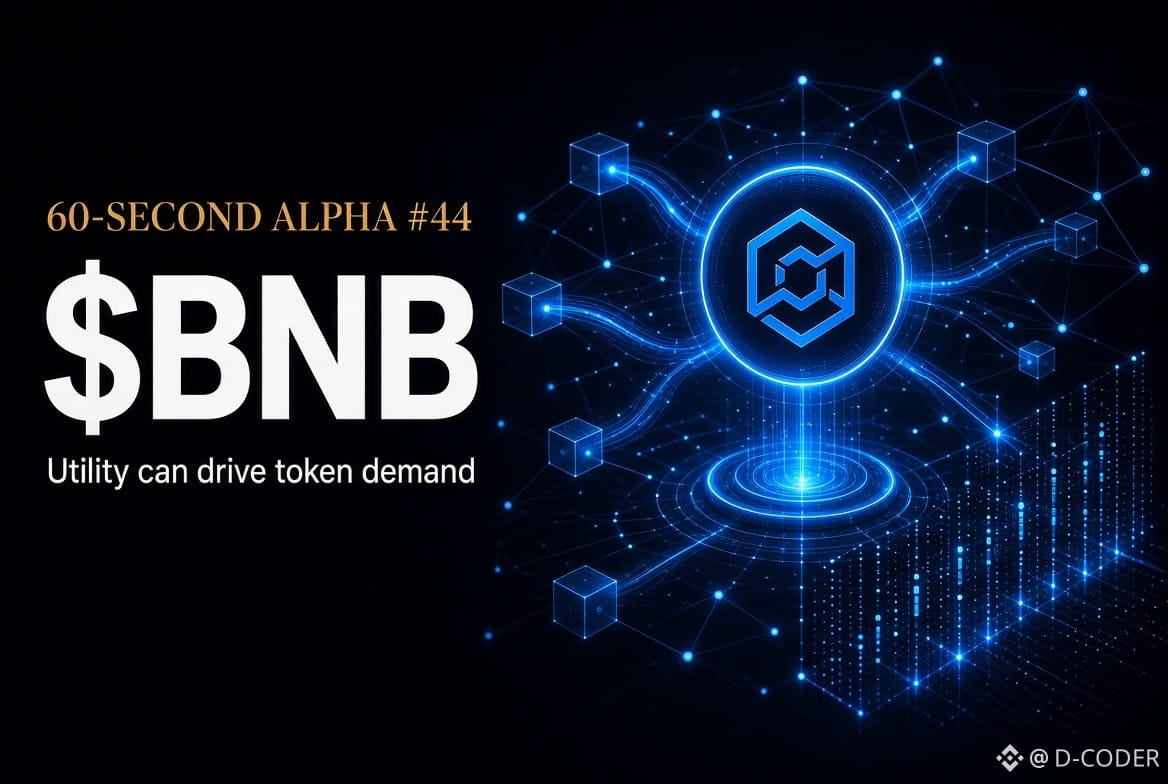
60-SECOND ALPHA #44 | $BNB
BNB is showing strong momentum while the broader market is also recovering. What makes BNB interesting isn't just the price move, it is closely connected to the Binance ecosystem, where exchange activity, BNB Chain usage and ecosystem growth can all influence demand.
The lesson: A token can have utility beyond its chart. Always understand what the asset is actually used for.
{future}(BNBUSDT)
60-SECOND ALPHA #44 | $BNB
BNB is showing strong momentum while the broader market is also recovering. What makes BNB interesting isn't just the price move, it is closely connected to the Binance ecosystem, where exchange activity, BNB Chain usage and ecosystem growth can all influence demand.
The lesson: A token can have utility beyond its chart. Always understand what the asset is actually used for.
BNB is showing strong momentum while the broader market is also recovering. What makes BNB interesting isn't just the price move, it is closely connected to the Binance ecosystem, where exchange activity, BNB Chain usage and ecosystem growth can all influence demand.
The lesson: A token can have utility beyond its chart. Always understand what the asset is actually used for.
58


·
--
$NOM This move is a bit interesting. In the 15m timeframe it climbed 3.86%, volume is 1.55x, and the closing price directly broke through the upper boundary of the last ~20 consecutive 5m ranges.
But the OI didn’t follow. 15m -0.03%, 1h -0.11%—on price and positioning, it’s retreating. That’s a classic short-covering type of tape, not a coordinated collective push by new longs. The active buy/sell ratio is 1.27, about 12% lower—there’s a tilt, but not a frenzy.
Abnormal percentile is 89.3%, ranking #17 in the whole pool, nominal change #44, and 24h trading value is 34.8M. Structurally, it looks more like a squeeze attempt in a thinner pool—whether it can continue depends on whether there’s someone to catch the bid on the pullback to the breakout level.
$NOM This move is a bit interesting. In the 15m timeframe it climbed 3.86%, volume is 1.55x, and the closing price directly broke through the upper boundary of the last ~20 consecutive 5m ranges.
But the OI didn’t follow. 15m -0.03%, 1h -0.11%—on price and positioning, it’s retreating. That’s a classic short-covering type of tape, not a coordinated collective push by new longs. The active buy/sell ratio is 1.27, about 12% lower—there’s a tilt, but not a frenzy.
Abnormal percentile is 89.3%, ranking #17 in the whole pool, nominal change #44, and 24h trading value is 34.8M. Structurally, it looks more like a squeeze attempt in a thinner pool—whether it can continue depends on whether there’s someone to catch the bid on the pullback to the breakout level.
But the OI didn’t follow. 15m -0.03%, 1h -0.11%—on price and positioning, it’s retreating. That’s a classic short-covering type of tape, not a coordinated collective push by new longs. The active buy/sell ratio is 1.27, about 12% lower—there’s a tilt, but not a frenzy.
Abnormal percentile is 89.3%, ranking #17 in the whole pool, nominal change #44, and 24h trading value is 34.8M. Structurally, it looks more like a squeeze attempt in a thinner pool—whether it can continue depends on whether there’s someone to catch the bid on the pullback to the breakout level.
13
·
--
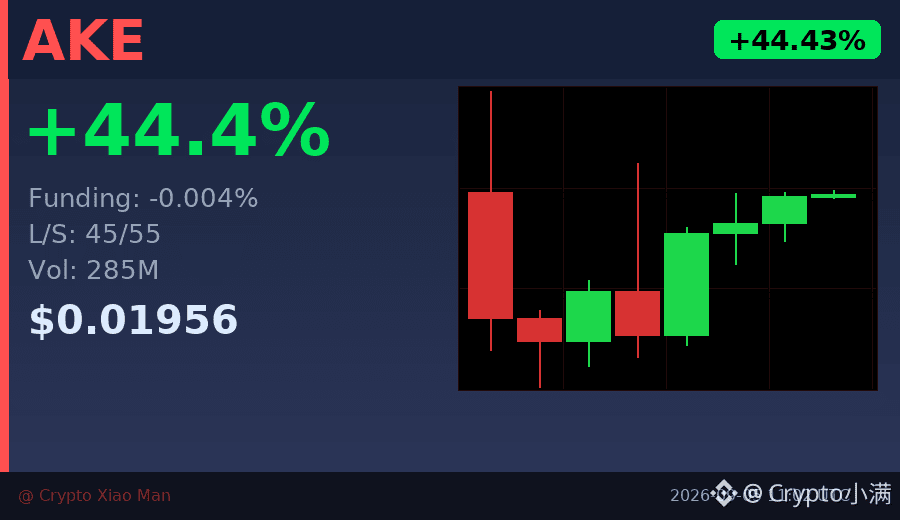
44% gain, but the funding rate is actually negative.
AKE surged to 0.01956 today, with 24-hour trading volume of 285 million U. The hourly chart has already closed three consecutive bullish candles, and the momentum looks pretty strong.
Interestingly, the current funding rate is -0.0041%, and the long/short ratio is 45% to 55%—despite the price rising like this, there are actually more people shorting.
What does this mean? This rally is mainly being driven by spot buying, not leveraged longs forcing it up. Shorts are still holding on, thinking the move can’t keep going.
In a market like this, either the shorts get squeezed and the price accelerates upward, or the buying pressure runs out and it drops quickly. I’d lean toward treating this as a rebound for now, so chasing the upside should be done cautiously.
$AKE #资金费率背离 #44%
Click the small card below to quickly view the market 👇
44% gain, but the funding rate is actually negative.
AKE surged to 0.01956 today, with 24-hour trading volume of 285 million U. The hourly chart has already closed three consecutive bullish candles, and the momentum looks pretty strong.
Interestingly, the current funding rate is -0.0041%, and the long/short ratio is 45% to 55%—despite the price rising like this, there are actually more people shorting.
What does this mean? This rally is mainly being driven by spot buying, not leveraged longs forcing it up. Shorts are still holding on, thinking the move can’t keep going.
In a market like this, either the shorts get squeezed and the price accelerates upward, or the buying pressure runs out and it drops quickly. I’d lean toward treating this as a rebound for now, so chasing the upside should be done cautiously.
$AKE #资金费率背离 #44%
Click the small card below to quickly view the market 👇
AKE surged to 0.01956 today, with 24-hour trading volume of 285 million U. The hourly chart has already closed three consecutive bullish candles, and the momentum looks pretty strong.
Interestingly, the current funding rate is -0.0041%, and the long/short ratio is 45% to 55%—despite the price rising like this, there are actually more people shorting.
What does this mean? This rally is mainly being driven by spot buying, not leveraged longs forcing it up. Shorts are still holding on, thinking the move can’t keep going.
In a market like this, either the shorts get squeezed and the price accelerates upward, or the buying pressure runs out and it drops quickly. I’d lean toward treating this as a rebound for now, so chasing the upside should be done cautiously.
$AKE #资金费率背离 #44%
Click the small card below to quickly view the market 👇
213
·
--
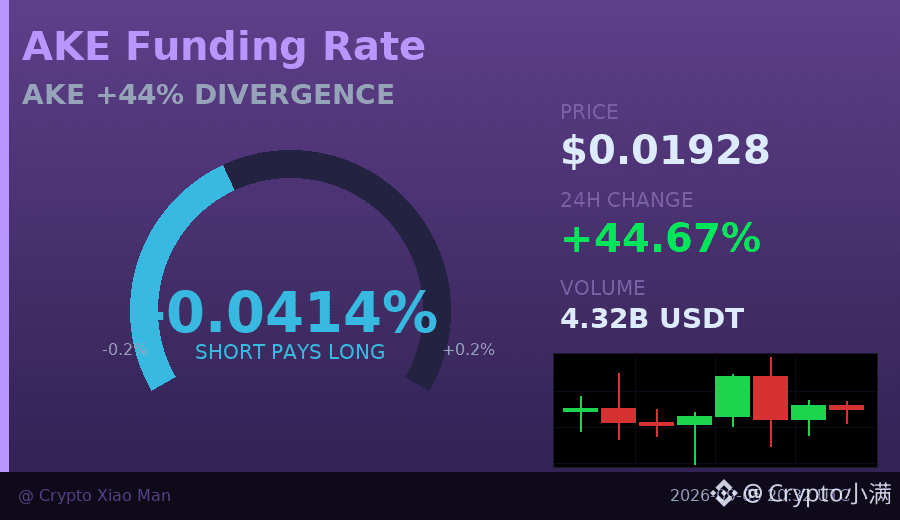
A 44% gain, but the funding rate is negative? That’s a bit unusual.
AKE rose 44.67% today, with trading volume surging to 430 million USDT, but the funding rate was -0.0041%, which means shorts are paying longs. Even stranger, the long/short ratio in open interest is 46% long / 54% short — after such a big rise, more than half of traders are actually opening short positions.
Usually a strong green candle attracts momentum buyers, but this time the market seems to be betting on a pullback. The candlestick chart shows short-term consolidation, with prices swinging sharply between 0.0127 and 0.0217.
This divergence does not necessarily mean an immediate reversal, but going long here requires caution: if price stays flat, shorts will be slowly squeezed by funding costs; if it really drops, crowded short positions could accelerate the decline.
I’d rather wait for a clearer direction than try to pick the top.
$AKE #资金费率背离 #44% gain
Click the small card below to quickly view the market👇
A 44% gain, but the funding rate is negative? That’s a bit unusual.
AKE rose 44.67% today, with trading volume surging to 430 million USDT, but the funding rate was -0.0041%, which means shorts are paying longs. Even stranger, the long/short ratio in open interest is 46% long / 54% short — after such a big rise, more than half of traders are actually opening short positions.
Usually a strong green candle attracts momentum buyers, but this time the market seems to be betting on a pullback. The candlestick chart shows short-term consolidation, with prices swinging sharply between 0.0127 and 0.0217.
This divergence does not necessarily mean an immediate reversal, but going long here requires caution: if price stays flat, shorts will be slowly squeezed by funding costs; if it really drops, crowded short positions could accelerate the decline.
I’d rather wait for a clearer direction than try to pick the top.
$AKE #资金费率背离 #44% gain
Click the small card below to quickly view the market👇
AKE rose 44.67% today, with trading volume surging to 430 million USDT, but the funding rate was -0.0041%, which means shorts are paying longs. Even stranger, the long/short ratio in open interest is 46% long / 54% short — after such a big rise, more than half of traders are actually opening short positions.
Usually a strong green candle attracts momentum buyers, but this time the market seems to be betting on a pullback. The candlestick chart shows short-term consolidation, with prices swinging sharply between 0.0127 and 0.0217.
This divergence does not necessarily mean an immediate reversal, but going long here requires caution: if price stays flat, shorts will be slowly squeezed by funding costs; if it really drops, crowded short positions could accelerate the decline.
I’d rather wait for a clearer direction than try to pick the top.
$AKE #资金费率背离 #44% gain
Click the small card below to quickly view the market👇
11
Log in to explore more content
Join global crypto users on Binance Square
⚡️ Get latest and useful information about crypto.
💬 Trusted by the world’s largest crypto exchange.
👍 Discover real insights from verified creators.
Email / Phone number
Trending Topics
1
#CryptoSelloffTriggersMultipleWhaleLiquidations
8 views
6 Discussing
2
#USSpotXRPETFsSeeLargestWeeklyOutflowIn8Months
41,445 views
466 Discussing
3
#BitcoinActiveSupplyInProfitDropsBelow45%
97,117 views
882 Discussing
4
#TONStrategyReports$23.97MQ3NetLoss
11,657 views
60 Discussing
5
#KavaSaysAbnormalActivityLimitedToKavaLend
62,536 views
494 Discussing
6
#WORPTLetsTouristsConvertCryptoToThaiBaht
12,454 views
130 Discussing
7
#WhoWillSucceedJensenHuangatNvidia?
211,181 views
1,827 Discussing
8
#WhatWillDriveCryptoandStocks’NextRebound?
639,690 views
3,656 Discussing
9
#TradFiForBeginners
755,794 views
4,623 Discussing
10
#dYdXPlansV9.9UpgradeToShiftUSDCToInjective
31,208 views
259 Discussing