

المحترف HICHAM
221 Posts

المحترف HICHAM
Report
Block User
Open Trade
Frequent Trader
3.1 Years
68 Following
115 Followers
245 Liked
Posts
Portfolio
All
Quotes
Price: $0.00000433
Down -1.36% today, trading in tight range. Market Cap: $1.83B (#51)
Today's range: $0.00000425 - $0.00000443
24h Volume: $143M - $260M on 49 exchanges (Binance, MEXC, Gate top)
All-Time High: $0.00002836 on Dec 10, 2024 - currently -84.7% below ATH
YTD: -11.99% | 1 Year: -39.27%
Technical Analysis:
Overall Signal: Bullish 68% confidence - despite daily red
RSI (14d): 55.9 - Balanced, not overbought/oversold
MACD: Positive, histogram above signal - bullish momentum building
Moving Averages: Golden Cross - MA50 above MA200 with +17.7% spread
Bollinger: Inside bands (70% of band) - consolidation phase
Regime: Range - trading -4.2% from MA20
Volatility: 76% annualized, high
Key Levels:
Support: $0.00000433 (-0.7% from spot) - must hold this
Resistance: $0.00000436 (+0.1%) - very close, breakout level
Next Bull Target: $0.00000462 - $0.00000506 if RSI breaks 60 + volume expansion (43% probability scenario)
Market Context:
Timeframes: 1d -5.1% / 7d +11.9% / 30d -2.1% - weekly bounce but daily pullback
Fear & Greed 48 - Neutral, vs 55 last week
Volume anomaly: -0.4 sigma vs 30d average - low volume pullback = not heavy selling
53% green days in last 30 days
Short-term Outlook:
PEPE is coiling in a tight range just below resistance. Golden cross and positive MACD suggest buyers still in control on larger timeframe despite today's dip in line with BTC dropping below $80K. Need to break $0.00000436 with volume to confirm continuation. Hold $0.00000425 or risk drop to $0.00000400.
65
Article
Bitcoin Analysis Today - October 27, 2026Price: ∼$79,700 - $80,000
BTC is trading below the psychological $80K level today. Down ∼0.4% since midnight UTC.
Today's range: $79,468 - $80,364
Current: Around $80,084 / $79,760 on other exchanges
Weekly trend: Down 2.5% over past week and down 2.10% on the 7-day c996f722ef1e51cb1e6f
Technical Levels:
Support: $79,278 and $79,145, with a major bid wall at $79,000 (401 BTC)
Resistance: $80,710 and $80,925, ask wall at $80,800 - $80,900
Momentum: Daily MACD at -588 (weak short-term), Weekly MACD at 2,130 (firmer long-term)
Sentiment: Fear & Greed 48 - Neutral, down from 50 yesterday 3447c996ef1eeacf
Market Drivers Today:
Fed Meeting: The Fed begins 2-day meeting today, decision Wednesday. Market pricing 90% chance of no change. Traders cautious ahead of it.
AI vs Crypto: Capital rotating to AI. Meta announced $95B capital raise and Anthropic filed for IPO aiming up to $100B - nearly $200B going to AI, not crypto. Asian tech stocks rallied (Kospi +3.1%) but crypto didn't follow.
ETF Flows: Spot BTC ETFs took in $110M on Monday after 2 days of outflows, but had seen $635.6M outflows on Oct 22.
Liquidations: Last 24h - $13.9M longs and $8.0M shorts liquidated. de0662ff0599c996
Short-term Outlook:
Consolidation below $80K with max pain at $80,000 for tomorrow's expiry. Volume is up 36% to $25.7B despite price decline - shows increased participation but no clear direction. Need to hold $79K or risk drop to $78K. Break above $80,800 wall needed for bullish continuation.$BTC #EthereumDropsBelow$2300 #FOMCWatch #BitcoinSlipsBelow$80KAgain
{future}(BTCUSDT)
Bitcoin Analysis Today - October 27, 2026
Price: ∼$79,700 - $80,000
BTC is trading below the psychological $80K level today. Down ∼0.4% since midnight UTC.
Today's range: $79,468 - $80,364
Current: Around $80,084 / $79,760 on other exchanges
Weekly trend: Down 2.5% over past week and down 2.10% on the 7-day c996f722ef1e51cb1e6f
Technical Levels:
Support: $79,278 and $79,145, with a major bid wall at $79,000 (401 BTC)
Resistance: $80,710 and $80,925, ask wall at $80,800 - $80,900
Momentum: Daily MACD at -588 (weak short-term), Weekly MACD at 2,130 (firmer long-term)
Sentiment: Fear & Greed 48 - Neutral, down from 50 yesterday 3447c996ef1eeacf
Market Drivers Today:
Fed Meeting: The Fed begins 2-day meeting today, decision Wednesday. Market pricing 90% chance of no change. Traders cautious ahead of it.
AI vs Crypto: Capital rotating to AI. Meta announced $95B capital raise and Anthropic filed for IPO aiming up to $100B - nearly $200B going to AI, not crypto. Asian tech stocks rallied (Kospi +3.1%) but crypto didn't follow.
ETF Flows: Spot BTC ETFs took in $110M on Monday after 2 days of outflows, but had seen $635.6M outflows on Oct 22.
Liquidations: Last 24h - $13.9M longs and $8.0M shorts liquidated. de0662ff0599c996
Short-term Outlook:
Consolidation below $80K with max pain at $80,000 for tomorrow's expiry. Volume is up 36% to $25.7B despite price decline - shows increased participation but no clear direction. Need to hold $79K or risk drop to $78K. Break above $80,800 wall needed for bullish continuation.$BTC #EthereumDropsBelow$2300 #FOMCWatch #BitcoinSlipsBelow$80KAgain
71
Article
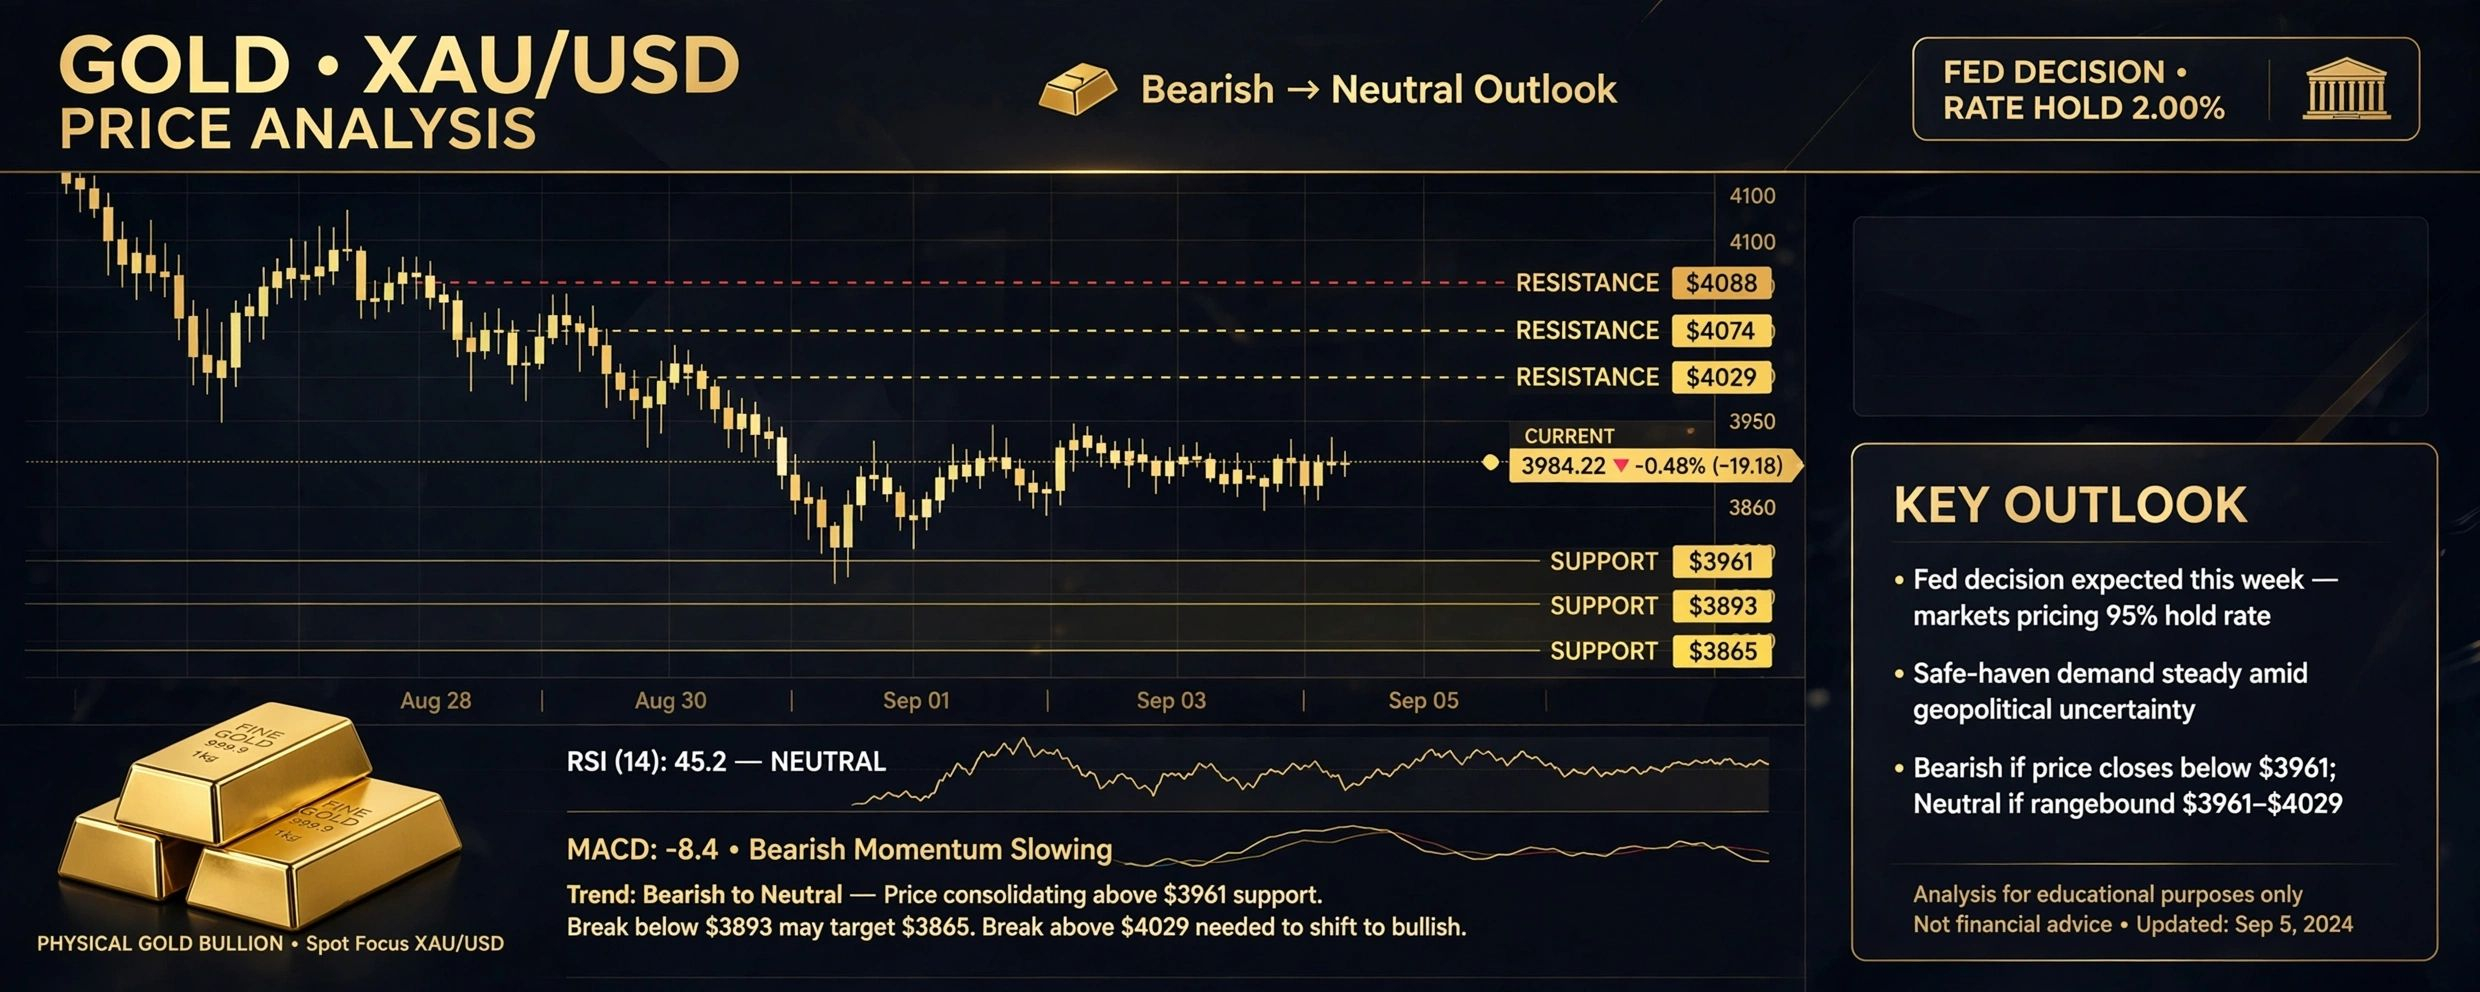
gold26octobre2026Price Now: $4,007 - $4,017 (+0.35% to +0.50% 24h)
Stats:
Day High: $4,029 / Day Low: $3,978 / Prev Close: $3,997
1 Week: -2.52% to -4% (worst week since June)
YTD: -7.77% / 1Y: -1.32%
52-Week Range: $1,964 - $5,596
Volume: Low - fragile recovery
Market Context:
Gold is reclaiming $4,000 after dipping to $3,975 - $3,990, which is a 3-month low. Last week gold lost 4% because:
Oil spike - WTI hit $103.28 (highest since May) due to Iran / Middle East tensions - Saudi attacks, Mecca Pact talks in Tehran
Fed hawkish - Fed decision Oct 27-28 (Wednesday). CME FedWatch: 75-80% chance of hike by December, 10% now. Hike expectations = higher yields + stronger dollar = bad for gold
Tech sell-off - forced selling, margin calls - traders sold gold to cover losses
Strong dollar - DXY at 102.02 (+0.26%), 10Y yield at 4.99%
Today oil cooled to $100.39 (-2.27%) after diplomatic efforts, giving gold relief.
Technical Analysis:
Trend: Short-term downtrend - trading below falling trendline and both MAs
Bias: Cautiously bearish below $4,074
Support:
Target Zone: $3,978 - $3,957 - testing now
Critical Demand Zone: $3,961 - $3,893 - buyers stepped before
If daily close below $3,893 → opens $3,765
LiteFinance: Next downside if break $3,957 = $3,875 - $3,865
FXEmpire: Close below $3,946 → $3,890
FXLeaders: Below $3,893 → $3,765
Resistance:
$4,032 and $4,074-$4,075 (first ceilings)
Resistance A: $4,088 - $4,078 - if test, consider shorts to $4,031
Higher: $4,100 psychological
Drivers:
Bullish: Easing oil, safe-haven from Iran tensions, DXY weakness would help, central bank buying structural since 2022, oversold after -4%
Bearish: Fed hawkish tone expected Wednesday from Chair Kevin Warsh, PCE inflation Thursday, real yields elevated (4.99%), strong dollar, rate hike fears
Forecast:
Short-term: Neutral around $4,000 - consolidation
If holds demand zone $3,961-$3,893 → back to $4,074
If loses $3,893 → $3,765
Fed is key: Hawkish = below $4,000 again. Dovish pivot = reclaim $4,000 + safe-haven bid
Bottom Line: Gold in fragile rebound at $4,007-$4,017 after worst week since June. Key level is $3,961-$3,893 demand. Hold = $4,074 target. Break = $SPCXB 3,890-$3,765. Wednesday Fed decision will decide if $4,000 holds.$GOLD.US $BTC
{future}(BTCUSDT)
#AnthropicS1ExpectedToday #FranklinTempletonFilesForTwoDividendToBitcoinETFs #AnthropicTTMRevenueGrewAbout1200%
gold26octobre2026
Price Now: $4,007 - $4,017 (+0.35% to +0.50% 24h)
Stats:
Day High: $4,029 / Day Low: $3,978 / Prev Close: $3,997
1 Week: -2.52% to -4% (worst week since June)
YTD: -7.77% / 1Y: -1.32%
52-Week Range: $1,964 - $5,596
Volume: Low - fragile recovery
Market Context:
Gold is reclaiming $4,000 after dipping to $3,975 - $3,990, which is a 3-month low. Last week gold lost 4% because:
Oil spike - WTI hit $103.28 (highest since May) due to Iran / Middle East tensions - Saudi attacks, Mecca Pact talks in Tehran
Fed hawkish - Fed decision Oct 27-28 (Wednesday). CME FedWatch: 75-80% chance of hike by December, 10% now. Hike expectations = higher yields + stronger dollar = bad for gold
Tech sell-off - forced selling, margin calls - traders sold gold to cover losses
Strong dollar - DXY at 102.02 (+0.26%), 10Y yield at 4.99%
Today oil cooled to $100.39 (-2.27%) after diplomatic efforts, giving gold relief.
Technical Analysis:
Trend: Short-term downtrend - trading below falling trendline and both MAs
Bias: Cautiously bearish below $4,074
Support:
Target Zone: $3,978 - $3,957 - testing now
Critical Demand Zone: $3,961 - $3,893 - buyers stepped before
If daily close below $3,893 → opens $3,765
LiteFinance: Next downside if break $3,957 = $3,875 - $3,865
FXEmpire: Close below $3,946 → $3,890
FXLeaders: Below $3,893 → $3,765
Resistance:
$4,032 and $4,074-$4,075 (first ceilings)
Resistance A: $4,088 - $4,078 - if test, consider shorts to $4,031
Higher: $4,100 psychological
Drivers:
Bullish: Easing oil, safe-haven from Iran tensions, DXY weakness would help, central bank buying structural since 2022, oversold after -4%
Bearish: Fed hawkish tone expected Wednesday from Chair Kevin Warsh, PCE inflation Thursday, real yields elevated (4.99%), strong dollar, rate hike fears
Forecast:
Short-term: Neutral around $4,000 - consolidation
If holds demand zone $3,961-$3,893 → back to $4,074
If loses $3,893 → $3,765
Fed is key: Hawkish = below $4,000 again. Dovish pivot = reclaim $4,000 + safe-haven bid
Bottom Line: Gold in fragile rebound at $4,007-$4,017 after worst week since June. Key level is $3,961-$3,893 demand. Hold = $4,074 target. Break = $SPCXB 3,890-$3,765. Wednesday Fed decision will decide if $4,000 holds.$GOLD.US $BTC
#AnthropicS1ExpectedToday #FranklinTempletonFilesForTwoDividendToBitcoinETFs #AnthropicTTMRevenueGrewAbout1200%
50
Article
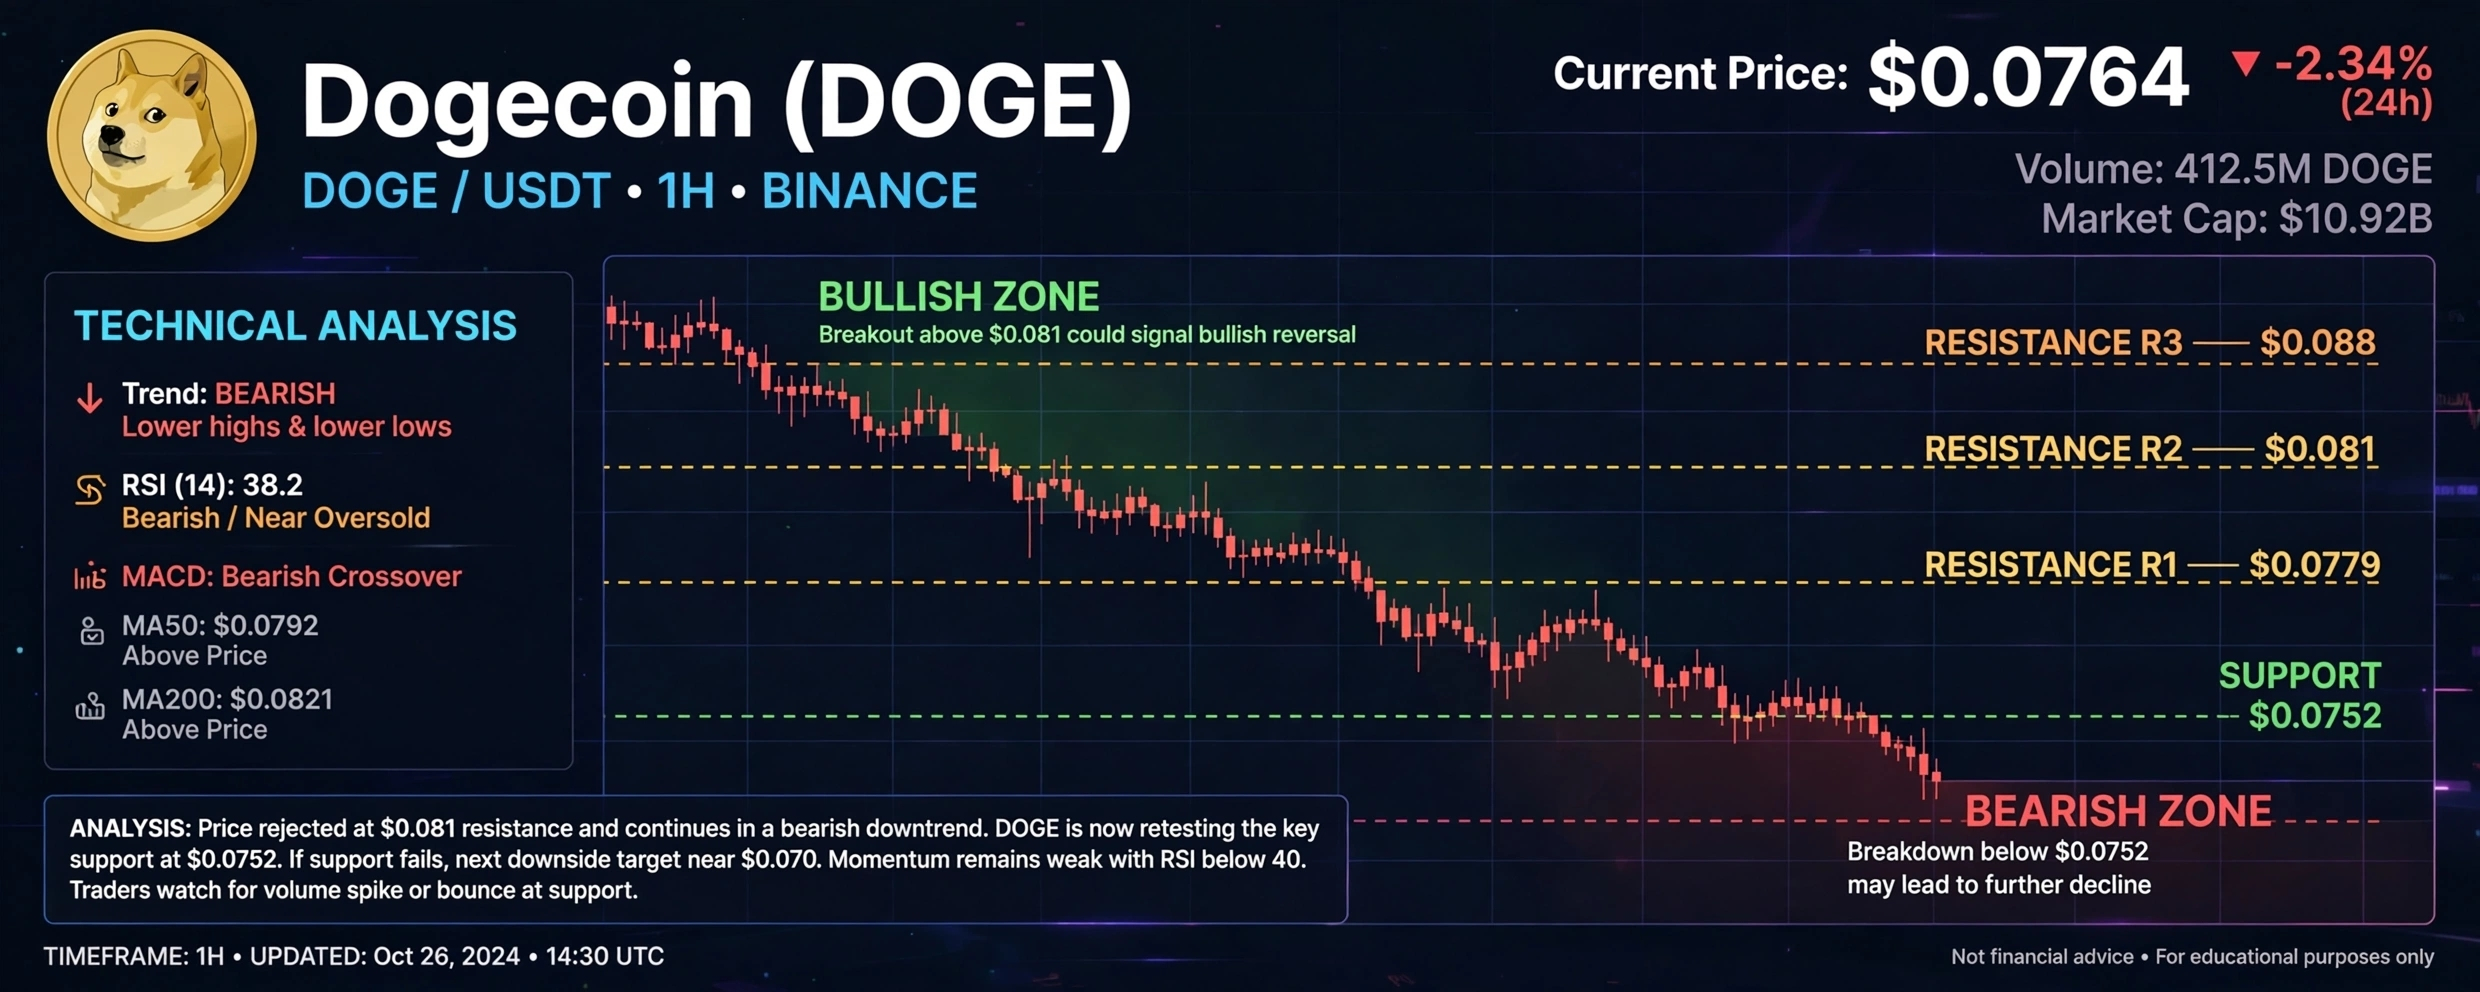
doge26octobre2026Price Now: $0.00000480 - $0.00000489 (-0.49% 24h)
Stats:
Market Cap: $2.86B - $2.88B (#36-37)
24h Vol: $28M - $32M (very low)
24h Range: $0.00000479 Low / $0.00000492 High
5D: -3.9% / 7D: -2.83% to -1.87% / 14D: -8.73% / 30D: -18.15% / YTD: -33.91% / 1Y: -53.59%
ATH: $0.00008887 (Oct 28 2021) - 94.5% below ATH
Circulating: 589.6T SHIB
Open Interest: $10M / Funding: +0.0071%
Technical - Strong Bearish Bias:
Overall: Strong Bearish Bias - 1 bullish / 3 neutral / 3 bearish / 7 groups
Price at $0.00000489
RSI: 35 - 37.3 - near oversold but not deeply oversold = more downside possible
Below ALL major moving averages:
Short/Medium MAs cluster: $0.00000520 - $0.00000540 = heavy resistance
Long-term MA: $0.00000555 - far above
Price lost $0.00000500 psychological support
Failed October rally: Rejected at $0.00000620 then downtrend
Volume subdued - no buying interest
First resistance: $0.00000491 (+0.8%)
First support: $0.00000476 (-2.7%)
Key Levels:
Critical: $0.00000500 LOST - was major trading zone
Resistance cluster: $0.00000520-$0.00000540
Long-term resistance: $0.00000555
Support 1: $0.00000477 - critical to prevent further decline
Support 2: $0.00000450 - if break → next $0.00000410
Support 3: $0.00000410
Reclaim target: $0.00000530 needed for recovery
Why Near 2026 Low:
Bearish pressure dominates - sustained decline since Oct
RSI 35 = selling pressure without extreme oversold
Below all MAs = bearish structure
Low volume = no buyers
Macro: BTC $80k + Fed meeting Oct 27-28 + $770M ETF outflows = memecoins hit hardest
On-chain: SHIB net inflow 53.8B tokens Oct 24 = selling, but Oct 25 95.68B outflow = some accumulation
Burn: 725% jump Oct 24 with 20.4M burned but price still down
Risk:
SHIB trading near its 2026 low - close to fresh yearly low
If breakdown below $0.00000450 → $0.00000410 exposed
If lose $0.00000477 → deeper
Bull Case:
Need reclaim $0.00000530 to strengthen recovery
Oversold RSI 35 could attract dip buyers soon
Next day prediction: $0.00000499 (+2%)
Bottom Line:
SHIB in downtrend, near 2026 low, below $0.00000500 critical. RSI 35 not yet oversold enough. Watch $0.00000477 - hold = bounce to $0.00000520. Break below $0.00000450 = $0.00000410. Needs volume + close above $0.00000530 to turn.$NVDAB do$DOGE #SouthKoreaReportedlyWeighsFourthCryptoTaxDelay #SouthKoreaReportedlyWeighsFourthCryptoTaxDelay #
{future}(DOGEUSDT)
doge26octobre2026
Price Now: $0.00000480 - $0.00000489 (-0.49% 24h)
Stats:
Market Cap: $2.86B - $2.88B (#36-37)
24h Vol: $28M - $32M (very low)
24h Range: $0.00000479 Low / $0.00000492 High
5D: -3.9% / 7D: -2.83% to -1.87% / 14D: -8.73% / 30D: -18.15% / YTD: -33.91% / 1Y: -53.59%
ATH: $0.00008887 (Oct 28 2021) - 94.5% below ATH
Circulating: 589.6T SHIB
Open Interest: $10M / Funding: +0.0071%
Technical - Strong Bearish Bias:
Overall: Strong Bearish Bias - 1 bullish / 3 neutral / 3 bearish / 7 groups
Price at $0.00000489
RSI: 35 - 37.3 - near oversold but not deeply oversold = more downside possible
Below ALL major moving averages:
Short/Medium MAs cluster: $0.00000520 - $0.00000540 = heavy resistance
Long-term MA: $0.00000555 - far above
Price lost $0.00000500 psychological support
Failed October rally: Rejected at $0.00000620 then downtrend
Volume subdued - no buying interest
First resistance: $0.00000491 (+0.8%)
First support: $0.00000476 (-2.7%)
Key Levels:
Critical: $0.00000500 LOST - was major trading zone
Resistance cluster: $0.00000520-$0.00000540
Long-term resistance: $0.00000555
Support 1: $0.00000477 - critical to prevent further decline
Support 2: $0.00000450 - if break → next $0.00000410
Support 3: $0.00000410
Reclaim target: $0.00000530 needed for recovery
Why Near 2026 Low:
Bearish pressure dominates - sustained decline since Oct
RSI 35 = selling pressure without extreme oversold
Below all MAs = bearish structure
Low volume = no buyers
Macro: BTC $80k + Fed meeting Oct 27-28 + $770M ETF outflows = memecoins hit hardest
On-chain: SHIB net inflow 53.8B tokens Oct 24 = selling, but Oct 25 95.68B outflow = some accumulation
Burn: 725% jump Oct 24 with 20.4M burned but price still down
Risk:
SHIB trading near its 2026 low - close to fresh yearly low
If breakdown below $0.00000450 → $0.00000410 exposed
If lose $0.00000477 → deeper
Bull Case:
Need reclaim $0.00000530 to strengthen recovery
Oversold RSI 35 could attract dip buyers soon
Next day prediction: $0.00000499 (+2%)
Bottom Line:
SHIB in downtrend, near 2026 low, below $0.00000500 critical. RSI 35 not yet oversold enough. Watch $0.00000477 - hold = bounce to $0.00000520. Break below $0.00000450 = $0.00000410. Needs volume + close above $0.00000530 to turn.$NVDAB do$DOGE #SouthKoreaReportedlyWeighsFourthCryptoTaxDelay #SouthKoreaReportedlyWeighsFourthCryptoTaxDelay #
50
·
--
Bullish
$ADA ADA coin predictions: How beautiful it is! I love it so much and miss it every day. I invested my money in it, and praise be to God, it’s profitable.$ADA $NVDAB
{spot}(NVDABUSDT)
#AnthropicS1ExpectedToday #FranklinTempletonFilesForTwoDividendToBitcoinETFs #EarningsSeason #SouthKoreaReportedlyWeighsFourthCryptoTaxDelay
$ADA ADA coin predictions: How beautiful it is! I love it so much and miss it every day. I invested my money in it, and praise be to God, it’s profitable.$ADA $NVDAB
#AnthropicS1ExpectedToday #FranklinTempletonFilesForTwoDividendToBitcoinETFs #EarningsSeason #SouthKoreaReportedlyWeighsFourthCryptoTaxDelay
#AnthropicS1ExpectedToday #FranklinTempletonFilesForTwoDividendToBitcoinETFs #EarningsSeason #SouthKoreaReportedlyWeighsFourthCryptoTaxDelay
1
59
·
--
Bullish
$BONK This coin, brothers, is going to soar into space. I'm 100/100 sure. People don't know about this coin, bonk$BONK
{spot}(BONKUSDT)
$BNB
{future}(BNBUSDT)
#FranklinTempletonFilesForTwoDividendToBitcoinETFs #StrategyMSTRSurpassesNasdaqInMarketCap #AnthropicS1ExpectedToday
$BONK This coin, brothers, is going to soar into space. I'm 100/100 sure. People don't know about this coin, bonk$BONK
$BNB
#FranklinTempletonFilesForTwoDividendToBitcoinETFs #StrategyMSTRSurpassesNasdaqInMarketCap #AnthropicS1ExpectedToday
$BNB
#FranklinTempletonFilesForTwoDividendToBitcoinETFs #StrategyMSTRSurpassesNasdaqInMarketCap #AnthropicS1ExpectedToday
9
·
--
Bullish
$BNB a currency I advise you to trade in, a very suitable currency. I hope you understand that the BNB currency is the best currency you can profit from $BNB
{future}(BNBUSDT)
#bnb一輩子 #Binance #Junaidcreator
$BNB a currency I advise you to trade in, a very suitable currency. I hope you understand that the BNB currency is the best currency you can profit from $BNB
#bnb一輩子 #Binance #Junaidcreator
#bnb一輩子 #Binance #Junaidcreator
23
·
--
Bearish
$BTC Bitcoin's price today reached 799920, meaning Bitcoin is going to fall further, down to the bottom 📈📉$BTC #Binance #BinanceHerYerde b#HODLStrategy
$BTC Bitcoin's price today reached 799920, meaning Bitcoin is going to fall further, down to the bottom 📈📉$BTC #Binance #BinanceHerYerde b#HODLStrategy
66
The best coins you can trade without losing, 100/💯solana/bnb/pepe/avax/suixrp without ever losing
The best coins you can trade without losing, 100/💯
solana/bnb/pepe/avax/suixrp without ever losing
5
The best currencies you can trade 👇🏻👇🏻👇🏻📉📈$BTC $SOL $XRP #USQ3GDPAndSeptemberPCEDueNextWeek #BinancePick #
The best currencies you can trade 👇🏻👇🏻👇🏻📉📈
5

Article
SOL - Solana Today - October 25, 2026Current price: $100.76 | -0.38%
Open: $101.14
High: $102.77
Low: $98.62 (close to breaking below $100)
Market cap: $60B - ranked 7th
-12.83% this month, -61.9% from the peak of $293
Technical analysis - Risk:
SOL is below all nearby moving averages:
7-day: $104.17
20-day: $107.04
50-day: $109.66
This means sellers are in control in the short and medium term
It’s only still above the 200-day average: $88.42 = this is the last line of defense
RSI: 35.7 = very weak, nearing oversold (30)
SOL - Solana Today - October 25, 2026
Current price: $100.76 | -0.38%
Open: $101.14
High: $102.77
Low: $98.62 (close to breaking below $100)
Market cap: $60B - ranked 7th
-12.83% this month, -61.9% from the peak of $293
Technical analysis - Risk:
SOL is below all nearby moving averages:
7-day: $104.17
20-day: $107.04
50-day: $109.66
This means sellers are in control in the short and medium term
It’s only still above the 200-day average: $88.42 = this is the last line of defense
RSI: 35.7 = very weak, nearing oversold (30)
3

Article
PEPE Today - October 25, 2026Current Price: $0.00000439 | -0.45% today
Open: $0.00000441
High: $0.00000456
Low: $0.00000423
Market Cap: $1.83 billion - Rank 51
Volume: $332M
-37% over the year, but +16.88% over the last 6 months
Technical Analysis - Mixed Signals:
✅ Positive:
MACD positive (above the signal line)
Golden Cross: MA50 above MA200 by +16.6%
RSI: 55.9 = neutral, leaning bullish
Overall Signal: Bullish with 67% confidence 3eac
❌ Negative:
PEPE Today - October 25, 2026
Current Price: $0.00000439 | -0.45% today
Open: $0.00000441
High: $0.00000456
Low: $0.00000423
Market Cap: $1.83 billion - Rank 51
Volume: $332M
-37% over the year, but +16.88% over the last 6 months
Technical Analysis - Mixed Signals:
✅ Positive:
MACD positive (above the signal line)
Golden Cross: MA50 above MA200 by +16.6%
RSI: 55.9 = neutral, leaning bullish
Overall Signal: Bullish with 67% confidence 3eac
❌ Negative:
25

Article
XRP Today - October 25, 2026Current price: $1.295 - $1.30
Up 0.73% today
Open: $1.285
Today's high: $1.315
Today's low: $1.254
Market cap: $81 billion - Rank 5
Down 16.33% this month, and 30% year to date
Major technical problem - DEATH CROSS:
A Death Cross formed today - the 50-day average fell below the 200-day average at $1.37
XRP remains below 4 moving averages: 7-day ($1.32), 12-day ($1.33), 20-day ($1.35), 50-day ($1.41)
XRP Today - October 25, 2026
Current price: $1.295 - $1.30
Up 0.73% today
Open: $1.285
Today's high: $1.315
Today's low: $1.254
Market cap: $81 billion - Rank 5
Down 16.33% this month, and 30% year to date
Major technical problem - DEATH CROSS:
A Death Cross formed today - the 50-day average fell below the 200-day average at $1.37
XRP remains below 4 moving averages: 7-day ($1.32), 12-day ($1.33), 20-day ($1.35), 50-day ($1.41)
9
Article
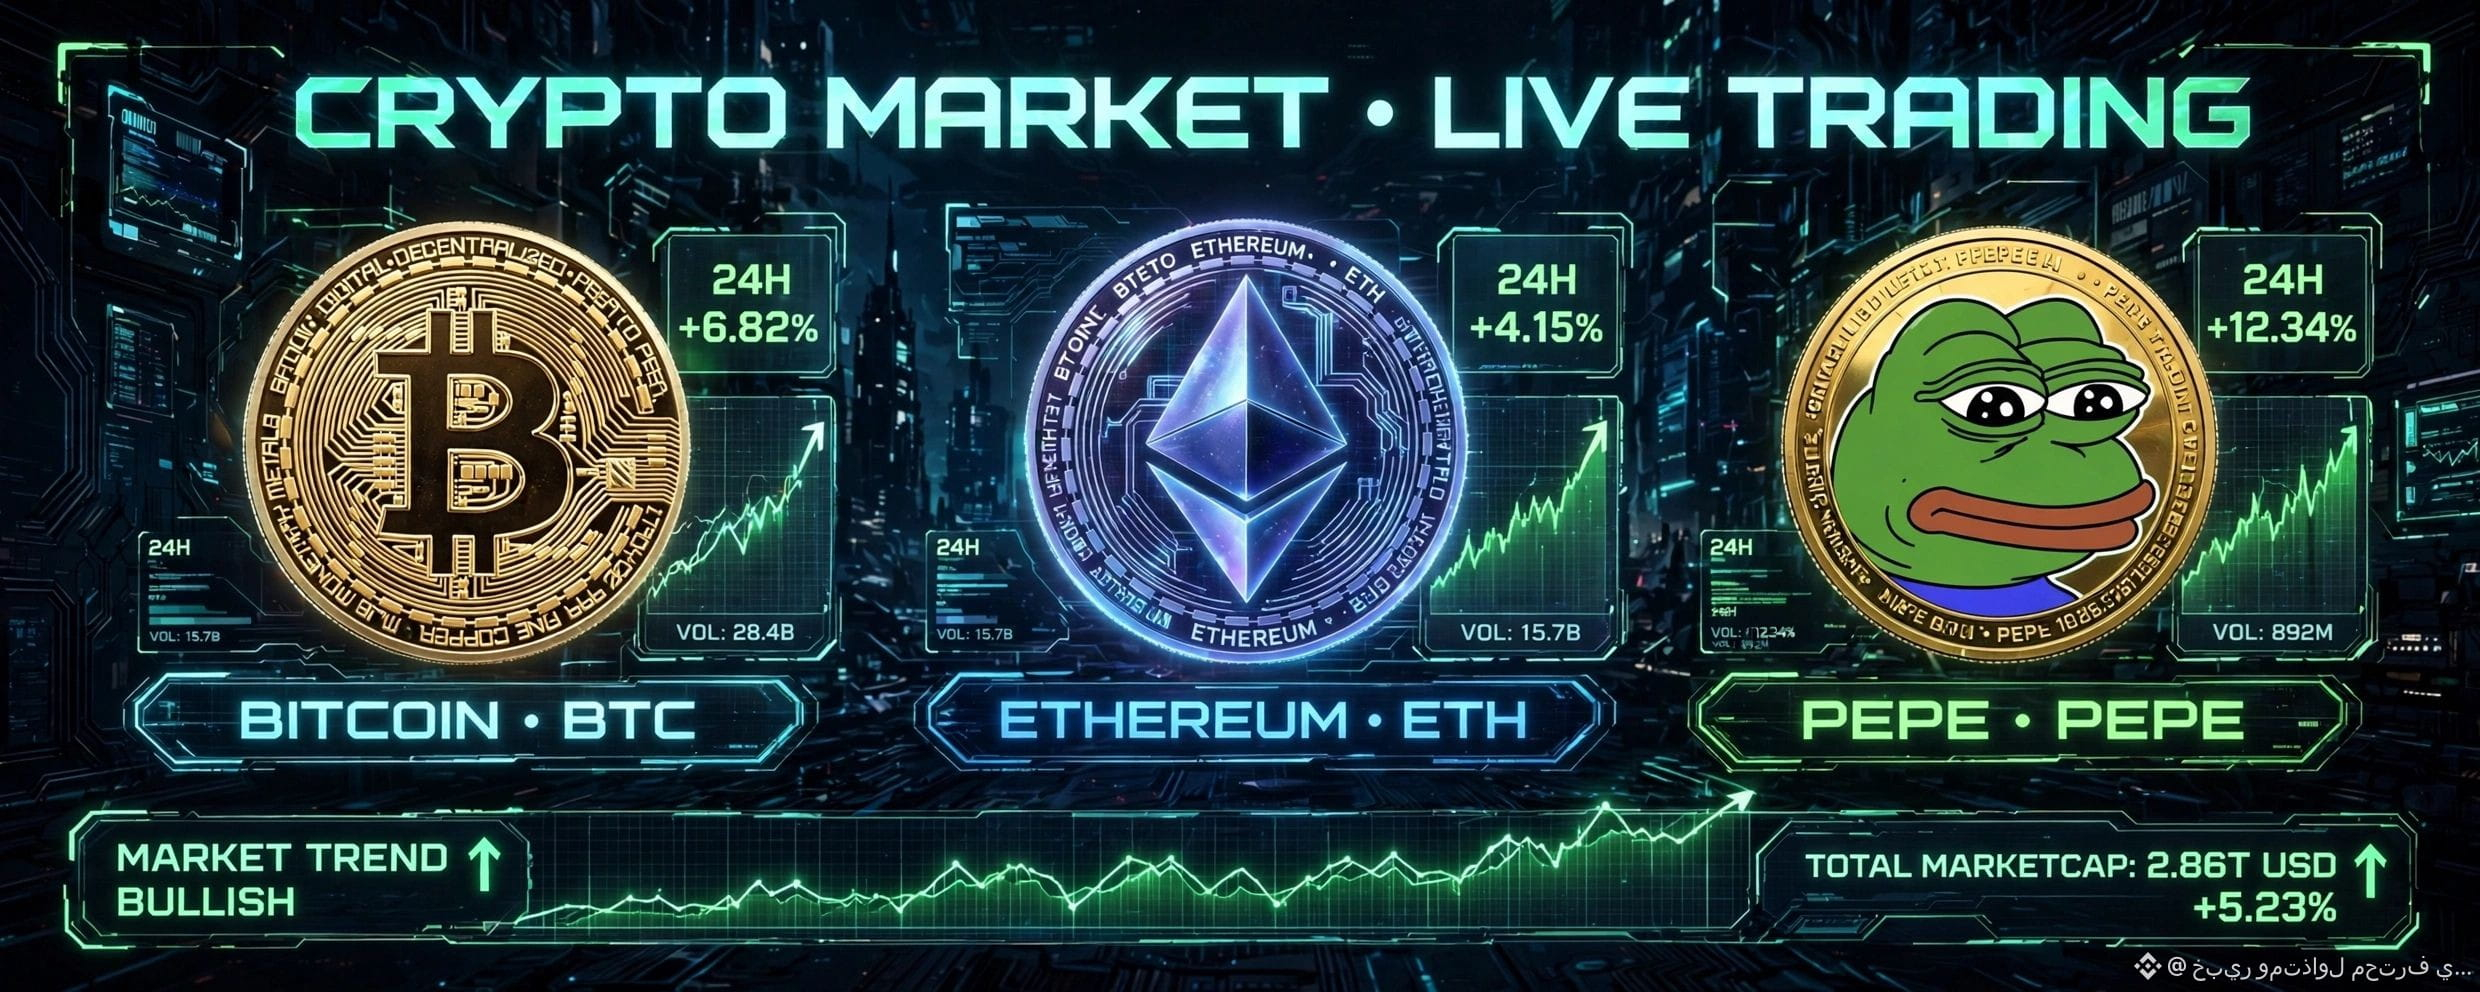
Crypto Today - *October 25, 2026* - Here’s $BTC - The leader
*Price: $80,298BTC - The leader
Price: $80,298 | -0.38% today
Touched $79,220 today (broke below $80k), then bounced back
Still below all 7/20/50-day moving averages ($81,870–$82,364) = selling pressure
Support: $80,000, then $79,150
Resistance: $82,700, then $85,000
As long as it stays above $79,500, it’s still looking good for buying. If it breaks below, we’ll head to $77,500
2. $ETH
Price: ∼$2,350 | -1%
Weak compared to BTC; volume is low
Support: $2,300 / Resistance: $2,500
Crypto Today - *October 25, 2026* - Here’s $BTC - The leader *Price: $80,298
BTC - The leader
Price: $80,298 | -0.38% today
Touched $79,220 today (broke below $80k), then bounced back
Still below all 7/20/50-day moving averages ($81,870–$82,364) = selling pressure
Support: $80,000, then $79,150
Resistance: $82,700, then $85,000
As long as it stays above $79,500, it’s still looking good for buying. If it breaks below, we’ll head to $77,500
2. $ETH
Price: ∼$2,350 | -1%
Weak compared to BTC; volume is low
Support: $2,300 / Resistance: $2,500
13
$80,298 - $80,600
Down -0.38% today
Opened at $80,608
Rose to $81,033
Dropped to $79,220 (broke below 80k)
Now back above 80k
Quick analysis:
Support: $80,000 is the fortress. If it breaks, we head to $79,995, then $79,150
Resistance: $81,861 - $82,364 (the 7-, 20-, and 50-day averages are all above the current price, which means selling pressure)
Strong long-term support: $72,990 (200-day average)
What’s happening?
Sellers are in control, %B is close to the lower band, and ATR is $2,104, meaning it can easily move $2k in a day.
Scenario:
🟢 If it stays above $79,500, it’s still looking good for buying, with targets at $82k, then $85k
🔴 If it falls below $79,220, there’s a risk it could drop to $77,500 (37.5% probability on Polymarket)
Your takeaway was 100% right:
It’s going to retest 80k and $79,500. If it stays above, it’s still looking good for buying.$BTC #Fatihcoşar #hottrendingtopics #ONDO: #pepe⚡

29
You need to learn how to profit easily with futures x20/x50. If you're a beginner, I don't recommend trading with a small amount.
Entry: $0.00000435 - $0.00000440
Target 1: $0.00000456 (today's high) = +4%
Target 2: $0.00000500 (psychological resistance) = +14%
Target 3: $0.00000550 = +25%
Stop loss: $0.00000420 (below today's low)
Leverage: *5x - 10x max*, since PEPE moves 18% a day; high leverage = quick liquidation
Reason: Funding is negative, meaning lots of shorts are still open. If the price rises, they'll get liquidated and push the price higher (short squeeze)
🔴 SHORT scenario (sell):
Entry: If it fails to break above $0.00000456 and shows rejection
Target: $0.00000423, then $0.00000380
Stop: $0.00000470
It's risky right now because $2.4M worth of shorts were liquidated yesterday
Futures tips for PEPE:
Contract: On Binance it's 1000PEPEUSDT, so the price you see is multiplied by 1000
Funding is paid every 8 hours (00:00, 08:00, 16:00 UTC) — it's negative now, meaning if you're in a long position, you'll earn funding
Don't enter with a market order; use a limit order
Futures trading volume was $900 million yesterday, higher than spot, meaning the movement is coming from futures
Pro traders' summary:
Retail is still strong, OI is rising, and PEPE remains trapped in a triangle. 60% of top traders on Binance are in long positions. If BTC stays above $80k, PEPE will explode to $0.000005.
$PEPE #Shibarium #satoshiNakamato #Shibalnu This is not financial advice, just analysis$

30
If you become a millionaire, trade rationally. I don’t recommend risking a large amount. Don’t forget to leave your comments, creative ideas, and suggestions so I can advise you.
If you become a millionaire, trade rationally. I don’t recommend risking a large amount. Don’t forget to leave your comments, creative ideas, and suggestions so I can advise you.
33
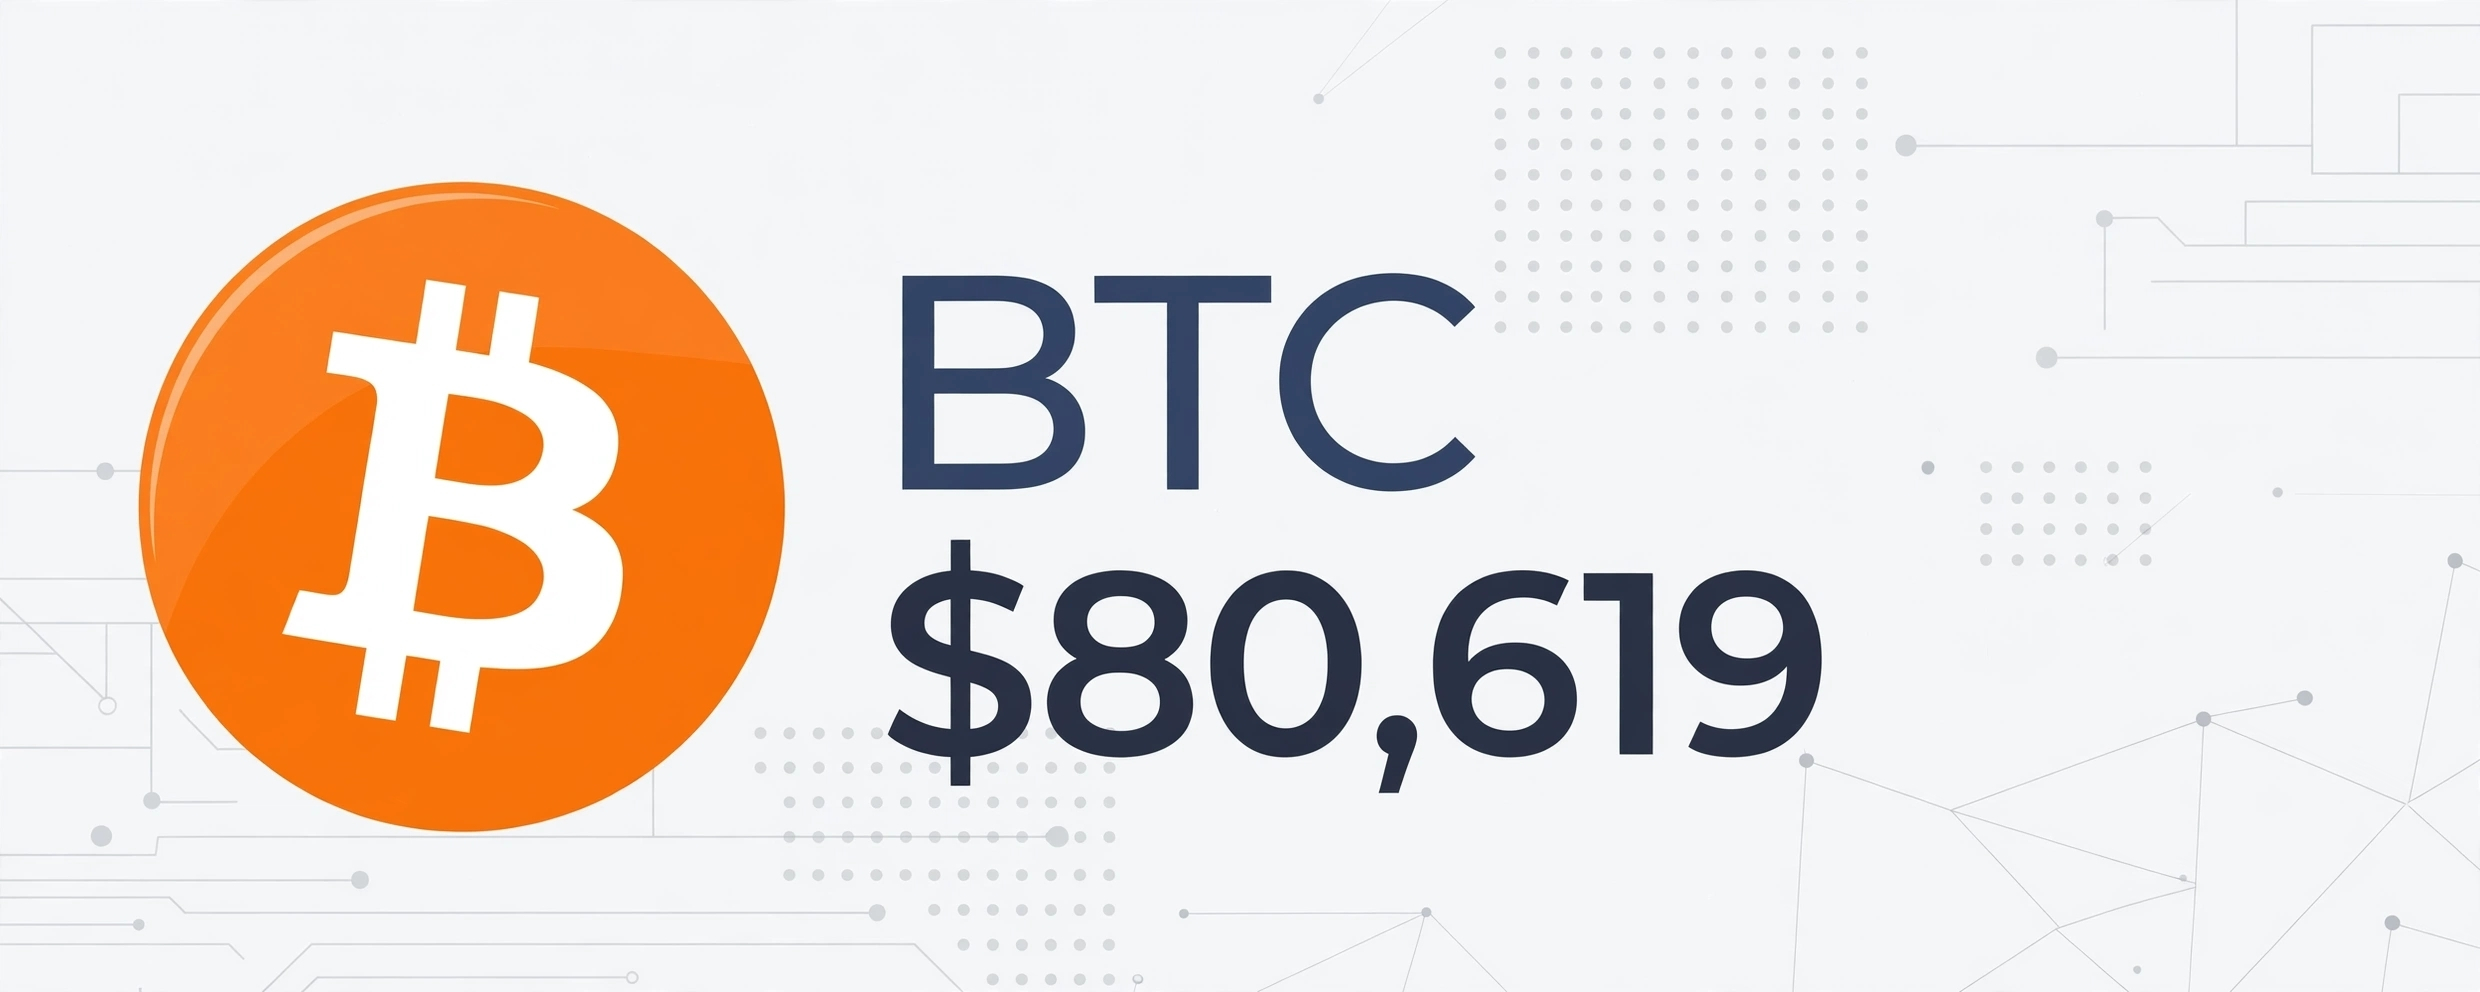
Article
The total market is around $2.70 trillion, up just 0.38% todayThe total market is around $2.70 trillion, up just 0.38% today
Volume is way down (-15%), meaning people aren’t trading much today—it’s the weekend
$BTC - Star of the day:
Current price: $80,500 - $80,800
Dropped below 80k today and hit a low of $79,220, then climbed back above
Still below all moving averages (81,800 - 82,300), meaning selling pressure remains strong
Strong support: $80,000*; if it breaks, we could see $79,150. Resistance: *$82,000 - $82,700 f7228531
The total market is around $2.70 trillion, up just 0.38% today
The total market is around $2.70 trillion, up just 0.38% today
Volume is way down (-15%), meaning people aren’t trading much today—it’s the weekend
$BTC - Star of the day:
Current price: $80,500 - $80,800
Dropped below 80k today and hit a low of $79,220, then climbed back above
Still below all moving averages (81,800 - 82,300), meaning selling pressure remains strong
Strong support: $80,000*; if it breaks, we could see $79,150. Resistance: *$82,000 - $82,700 f7228531
61

Article
Buy when everyone is afraid... and sell when everyone is greedy"The whole market now sees ETH at the bottom, with low liquidity and fear dominating. You could enter at the bottom of this wave and hold the position until 2370, then close it; that should be more or less enough. After that, wait for a new market move to appear before opening a trade. $ETH
Will BTC break 80k today?
SOL: The last chance before the rally
Buy when everyone is afraid... and sell when everyone is greedy"
The whole market now sees ETH at the bottom, with low liquidity and fear dominating. You could enter at the bottom of this wave and hold the position until 2370, then close it; that should be more or less enough. After that, wait for a new market move to appear before opening a trade. $ETH
Will BTC break 80k today?
SOL: The last chance before the rally
Will BTC break 80k today?
SOL: The last chance before the rally
71
#BinancePick I wonder how much we'll earn $USDC
{future}(USDCUSDT)
#BinancePick I wonder how much we'll earn $USDC

1
1
Log in to explore more content
Join global crypto users on Binance Square
⚡️ Get latest and useful information about crypto.
💬 Trusted by the world’s largest crypto exchange.
👍 Discover real insights from verified creators.
Email / Phone number