nasdaq100

193,218 නැරඹීම්
541 සාකච්ඡා කරමින්
Crypto news J
·
--
纳斯达克官网确认,2026年12月6日(周日)美东时间晚9点起实施23/5交易:每周5天、每天23小时,从周日晚9点至周五晚8点,仅每日晚8-9点暂停1小时维护#纳斯达克时间更改 #Nasdaq100
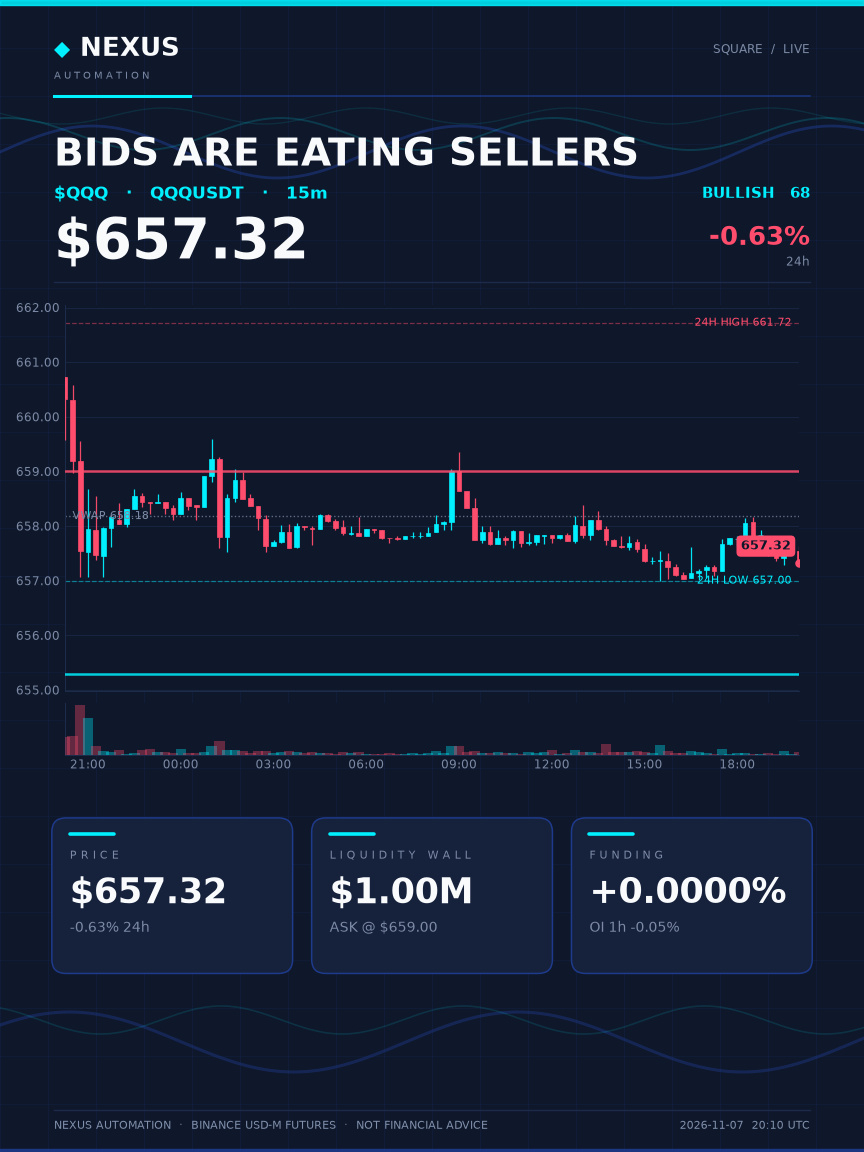
$QQQ has heavy bid depth sitting near $655, and price keeps avoiding it. Taker flow is 0.04x on the recent Binance buckets, so market sellers are hitting bids. The floor is doing all the work, and I am not paying up in the middle. Open interest is -0.05% in the last hour and -0.38% over four, so nobody new is committing real size. Liquidity pools and stops are building below the recent low, which is exactly why I am not chasing this candle. Price is at the bottom of the 24h range with 0.04% average travel - compression this tight usually resolves violently. So does that wall hold into the close, or does it get pulled the second real volume shows up? 📌 $QQQ · #Nasdaq100 #Macro #BinanceSquare #DataDriven Data: Binance USD-M futures (funding, open interest, orderbook depth, taker flow)
$QQQ has heavy bid depth sitting near $655, and price keeps avoiding it.

Taker flow is 0.04x on the recent Binance buckets, so market sellers are hitting bids. The floor is doing all the work, and I am not paying up in the middle. Open interest is -0.05% in the last hour and -0.38% over four, so nobody new is committing real size. Liquidity pools and stops are building below the recent low, which is exactly why I am not chasing this candle. Price is at the bottom of the 24h range with 0.04% average travel - compression this tight usually resolves violently.

So does that wall hold into the close, or does it get pulled the second real volume shows up?

📌 $QQQ · #Nasdaq100 #Macro #BinanceSquare #DataDriven
Data: Binance USD-M futures (funding, open interest, orderbook depth, taker flow)
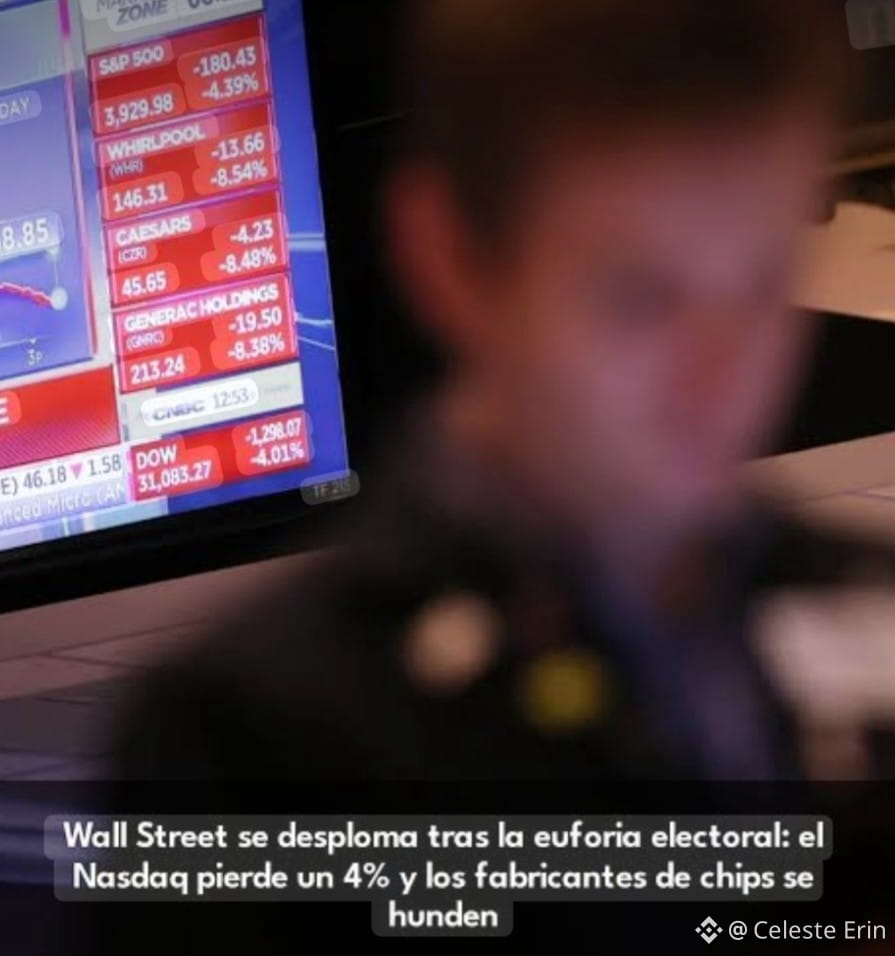
📉 EL NASDAQ 100 CAE UN 6 % ANTE EL DESPLOME DE LOS FABRICANTES DE CHIPS Y TEMORES REGULATORIOS EN IA 💻⚡ Especulaciones sobre nuevas regulaciones en EE. UU. desencadenan ventas masivas en semiconductores como Nvidia. 🔍 PUNTOS CLAVE DEL IMPACTO EN MERCADOS: 📊 Caída del Nasdaq 100: Retroceso del 6 % arrastrado por la volatilidad del sector tecnológico. 🧮 Desplome de semiconductores: El índice sectorial se hundió un 11 %, marcando su peor desempeño semanal desde abril de 2025. 🏛️ Factor regulatorio: Inversionistas prevén mayores controles e inspecciones a la industria de la inteligencia artificial. ¿Creen que esta corrección en las acciones tecnológicas de IA provocará una rotación de capital hacia activos digitales como $BTC? 💭👇 ¡Los leo en los comentarios! #BinanceSquare #Nasdaq100 #Semiconductors #TechCorrection #CryptoCommunity $TSLAB {spot}(TSLABUSDT) $NVDAB {spot}(NVDABUSDT) $SPCXB {spot}(SPCXBUSDT)
📉 EL NASDAQ 100 CAE UN 6 % ANTE EL DESPLOME DE LOS FABRICANTES DE CHIPS Y TEMORES REGULATORIOS EN IA 💻⚡

Especulaciones sobre nuevas regulaciones en EE. UU. desencadenan ventas masivas en semiconductores como Nvidia.

🔍 PUNTOS CLAVE DEL IMPACTO EN MERCADOS:
📊 Caída del Nasdaq 100: Retroceso del 6 % arrastrado por la volatilidad del sector tecnológico.

🧮 Desplome de semiconductores: El índice sectorial se hundió un 11 %, marcando su peor desempeño semanal desde abril de 2025.

🏛️ Factor regulatorio: Inversionistas prevén mayores controles e inspecciones a la industria de la inteligencia artificial.

¿Creen que esta corrección en las acciones tecnológicas de IA provocará una rotación de capital hacia activos digitales como $BTC?

💭👇 ¡Los leo en los comentarios!

#BinanceSquare #Nasdaq100 #Semiconductors #TechCorrection #CryptoCommunity
$TSLAB
$NVDAB
$SPCXB
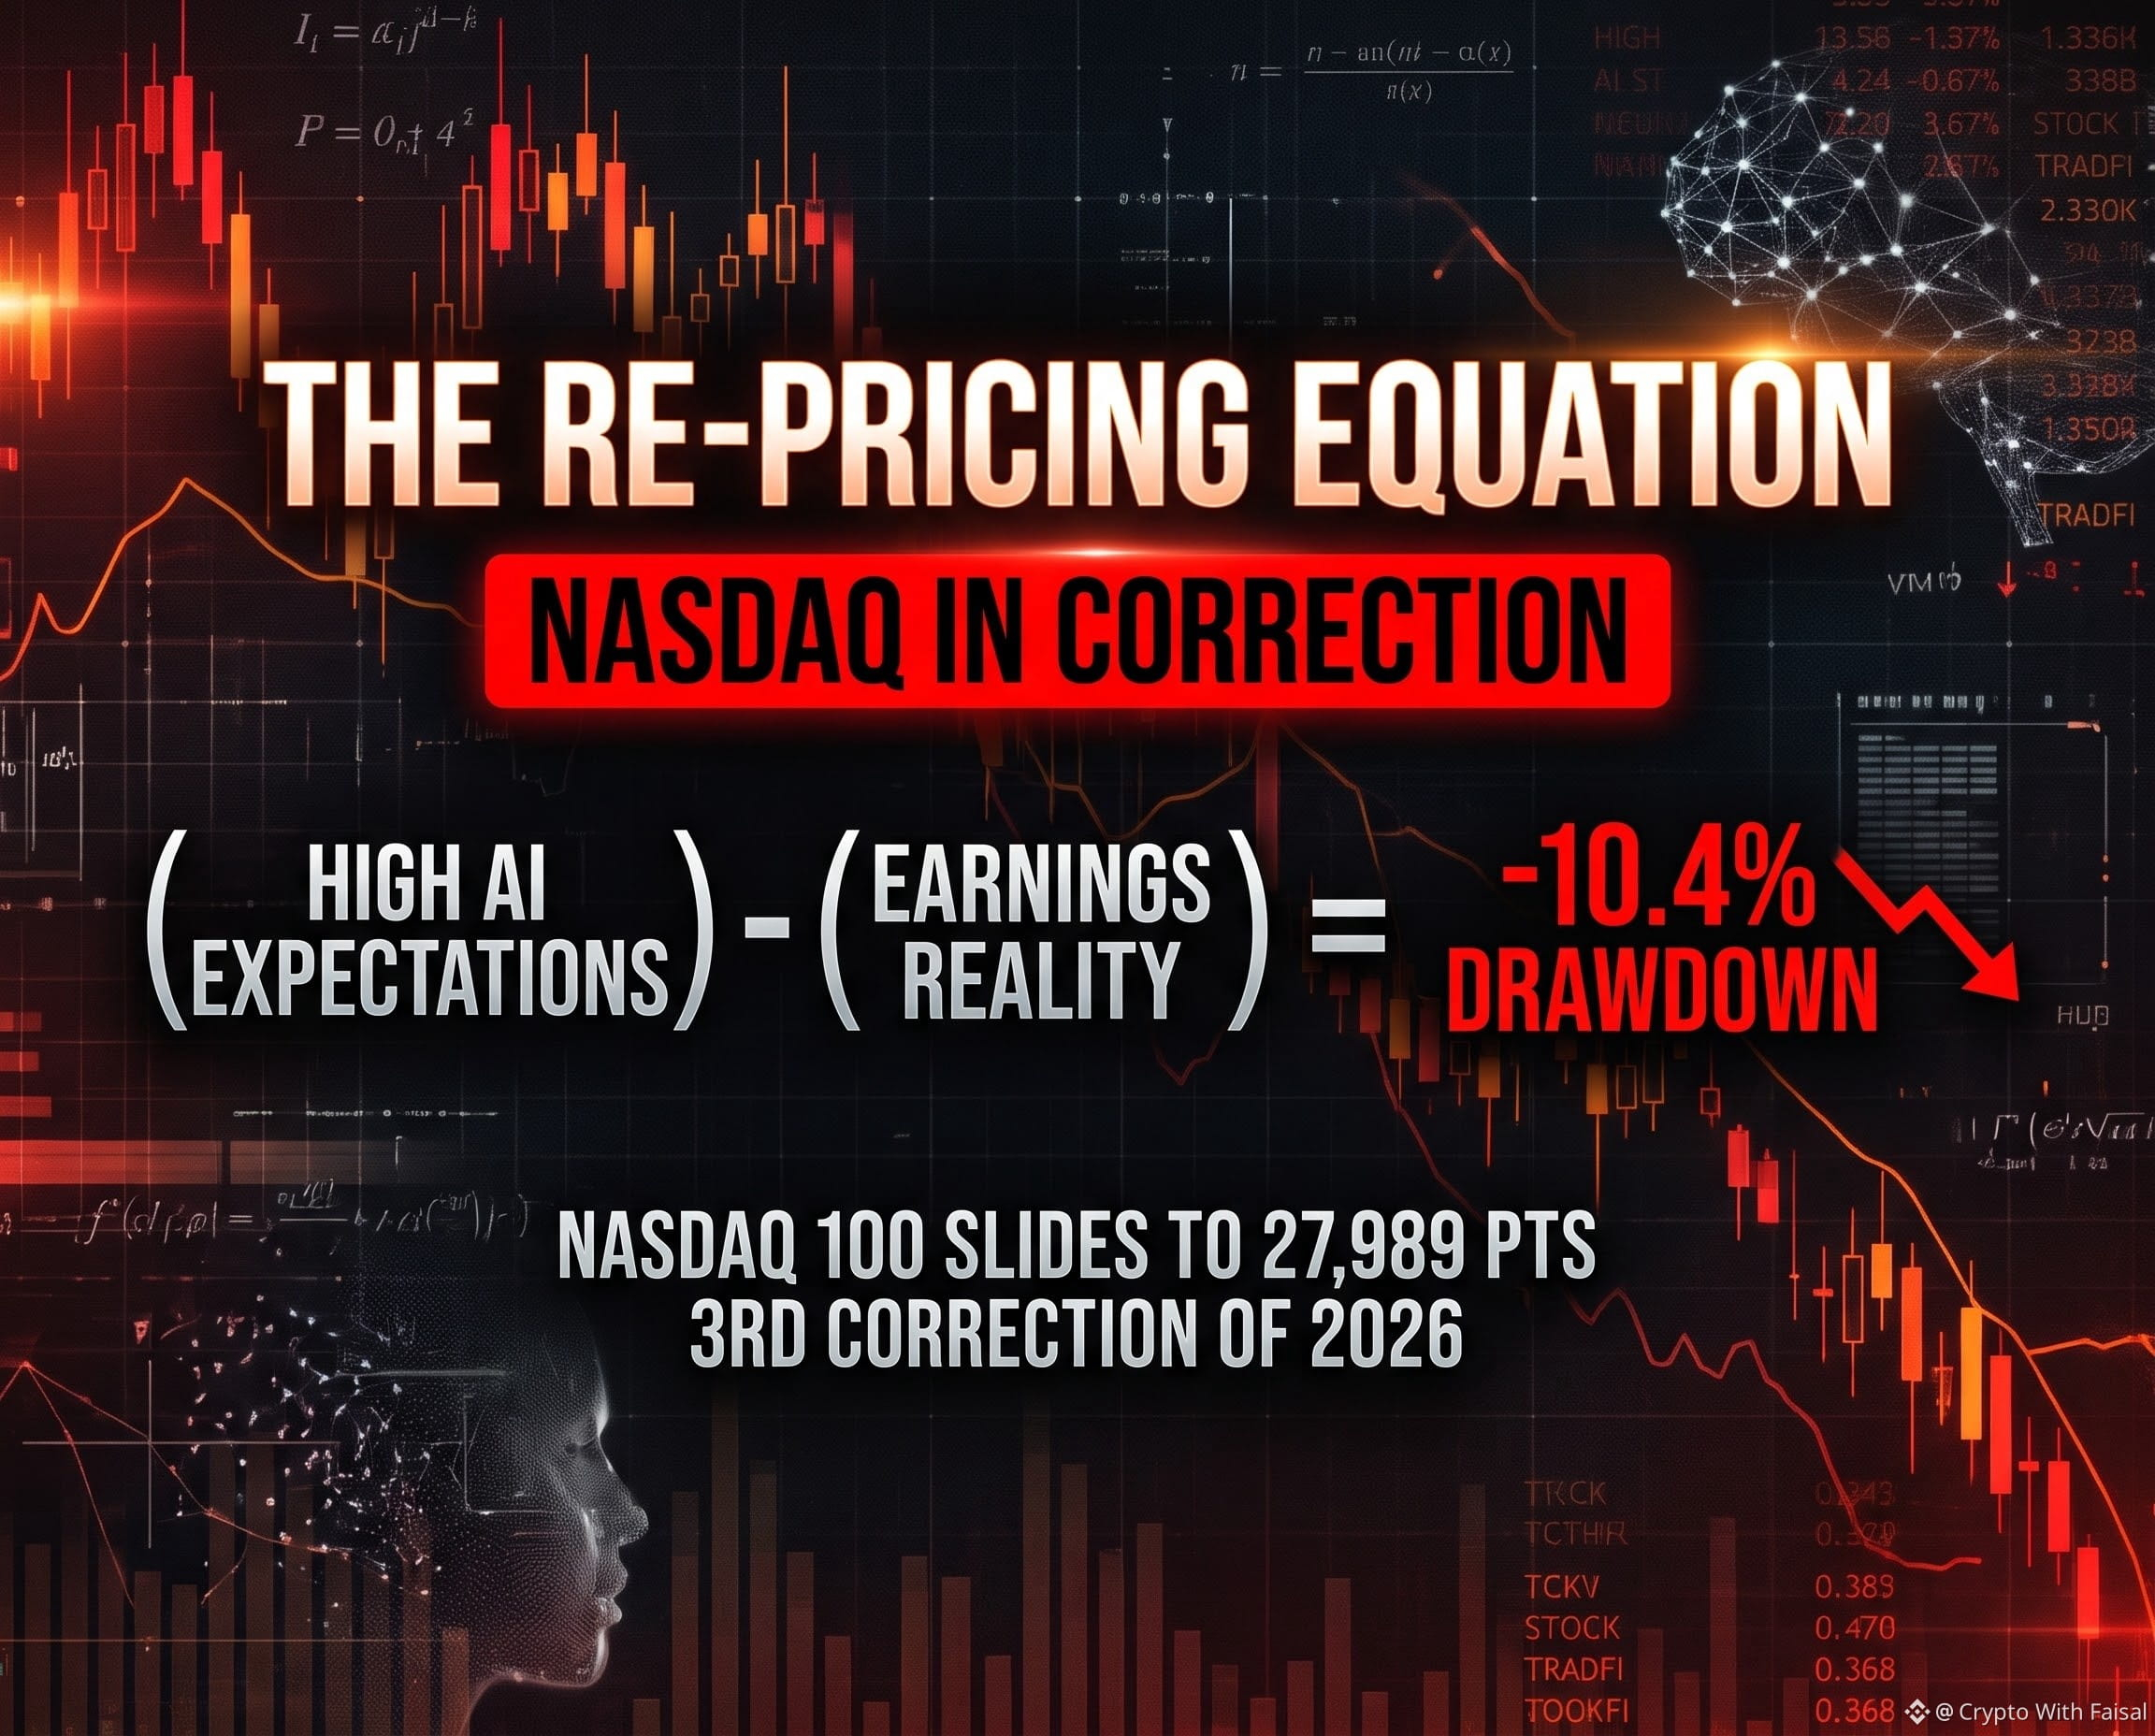
🚨 THE RE-PRICING EQUATION: Nasdaq In Correction 🚨 #nasdaq100enterscorrection The tech-heavy benchmark has officially slid into its third technical correction of 2026. Let's calculate the global market stress using pure math 🧮👇 ​(High AI Expectations) - (Tech Earnings Reality) = -10.4% Drawdown 📉 ​The Market Input: (The Trigger) = Driven by a heavy tech slide, the Nasdaq 100 ($US100) dropped to close at 27,989 points on Monday—marking a cumulative decline of 10.4% from its Oct 6 peak. ​The Key Deliverable: (The Reality) ➔ Hyper-inflated AI expectations have slammed into reality. Mixed earnings from semiconductor giants, weak guidance, and anxiety ahead of the US midterm elections have forced institutional de-risking. ​The Breakdown: A TradFi correction often spills over to crypto as "risk-on" assets see leverage wiped out. However, the index is still up ~11% Year-to-Date, indicating a natural cooling of a crowded trade rather than a full-scale macro collapse. ​Are you buying this mega-cap tech & crypto dip, or is the AI-driven market bubble finally about to burst? ❓👇💬 $BTC {future}(BTCUSDT) $ETH {future}(ETHUSDT) $SOL {future}(SOLUSDT) ​#Nasdaq100 #TradFi #MarketAnalysis
🚨 THE RE-PRICING EQUATION: Nasdaq In Correction 🚨
#nasdaq100enterscorrection
The tech-heavy benchmark has officially slid into its third technical correction of 2026. Let's calculate the global market stress using pure math 🧮👇

​(High AI Expectations) - (Tech Earnings Reality) = -10.4% Drawdown 📉

​The Market Input:

(The Trigger) = Driven by a heavy tech slide, the Nasdaq 100 ($US100) dropped to close at 27,989 points on Monday—marking a cumulative decline of 10.4% from its Oct 6 peak.

​The Key Deliverable:

(The Reality) ➔ Hyper-inflated AI expectations have slammed into reality. Mixed earnings from semiconductor giants, weak guidance, and anxiety ahead of the US midterm elections have forced institutional de-risking.

​The Breakdown:

A TradFi correction often spills over to crypto as "risk-on" assets see leverage wiped out. However, the index is still up ~11% Year-to-Date, indicating a natural cooling of a crowded trade rather than a full-scale macro collapse.

​Are you buying this mega-cap tech & crypto dip, or is the AI-driven market bubble finally about to burst? ❓👇💬
$BTC

$ETH

$SOL


​#Nasdaq100 #TradFi #MarketAnalysis
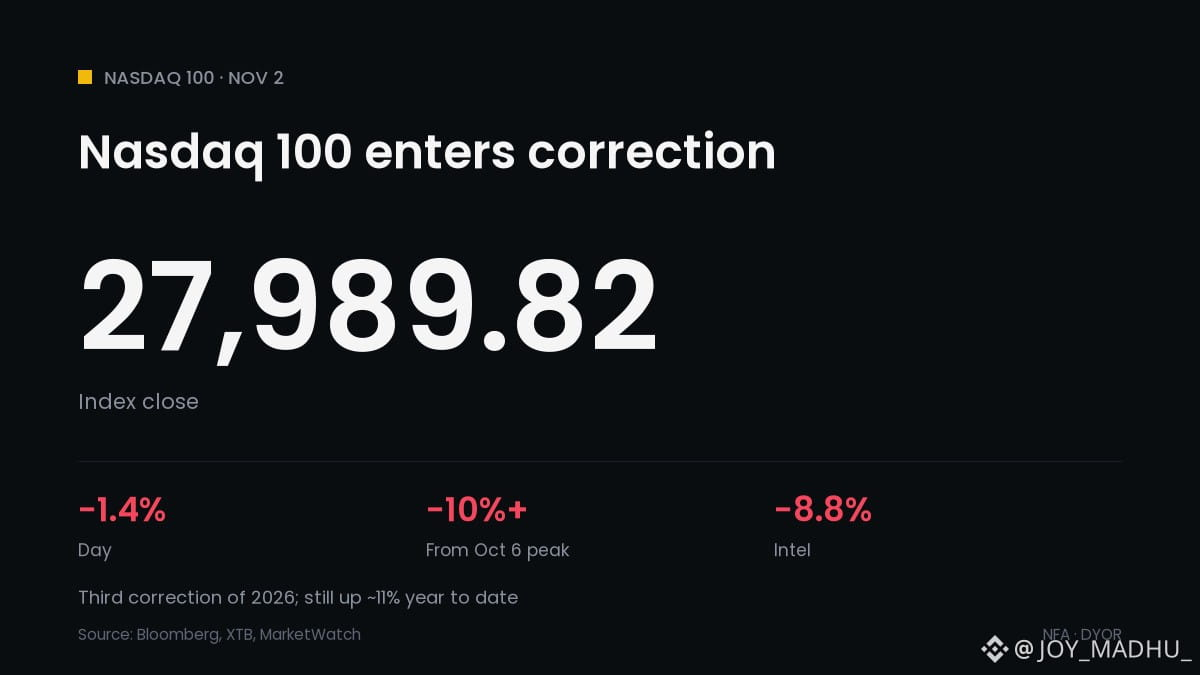
#Nasdaq100EntersCorrection 📉 Nasdaq 100 Slips Into Correction as AI Spending Worries Grow 📊 Index fell 1.4% to 27,989.82 on Nov 2, more than 10% below its Oct 6 peak 📅 Third correction of 2026, yet still up about 11% year to date 💾 Chip stocks led it: AMD -7.5%, Micron -5.8%, Intel -8.8% 🏦 Oracle fell about 9% on reports of a $20B debt and equity raise ⚠️ Alphabet had its worst day ever last week on weak ad and search revenue 🗓️ AMD and Arista report today, a fresh test for AI demand What it means for crypto: $BTC has often moved with Nasdaq in risk-off stretches, so a deeper tech slide could weigh on sentiment. Analysts note the broader market has held up better than tech, and nothing is guaranteed either way. Is this a healthy reset or the start of a bigger AI unwind? 👇 $BTC $ETH #CryptoNews #Nasdaq100 #AI #Nasdaq100EntersCorrection
#Nasdaq100EntersCorrection

📉 Nasdaq 100 Slips Into Correction as AI Spending Worries Grow

📊 Index fell 1.4% to 27,989.82 on Nov 2, more than 10% below its Oct 6 peak
📅 Third correction of 2026, yet still up about 11% year to date
💾 Chip stocks led it: AMD -7.5%, Micron -5.8%, Intel -8.8%
🏦 Oracle fell about 9% on reports of a $20B debt and equity raise
⚠️ Alphabet had its worst day ever last week on weak ad and search revenue
🗓️ AMD and Arista report today, a fresh test for AI demand

What it means for crypto: $BTC has often moved with Nasdaq in risk-off stretches, so a deeper tech slide could weigh on sentiment. Analysts note the broader market has held up better than tech, and nothing is guaranteed either way.

Is this a healthy reset or the start of a bigger AI unwind? 👇

$BTC $ETH
#CryptoNews #Nasdaq100 #AI #Nasdaq100EntersCorrection
📊 $SQQQB IS SHOWING A STRONG MARKET MOVE! Not every opportunity comes from the crypto market! $SQQQB has gained 8.80%, bringing its current price to $40.69. 📈 Market Statistics: • Current Price: $40.69 • 24H Change: +8.80% • Asset: ProShares UltraPro Short QQQ ⚡ What Traders Should Know: This is a leveraged inverse ETF designed to deliver approximately -3x the daily performance of the Nasdaq-100. Its price can move sharply depending on the underlying index. It is a high-risk trading instrument, not a traditional crypto token. Always understand the daily reset and leverage risks before trading. #SQQQB #ProShares #Nasdaq100 #ETFTrading
📊 $SQQQB IS SHOWING A STRONG MARKET MOVE!

Not every opportunity comes from the crypto market!

$SQQQB has gained 8.80%, bringing its current price to $40.69.

📈 Market Statistics:
• Current Price: $40.69
• 24H Change: +8.80%
• Asset: ProShares UltraPro Short QQQ

⚡ What Traders Should Know:

This is a leveraged inverse ETF designed to deliver approximately -3x the daily performance of the Nasdaq-100.

Its price can move sharply depending on the underlying index. It is a high-risk trading instrument, not a traditional crypto token.

Always understand the daily reset and leverage risks before trading.

#SQQQB #ProShares #Nasdaq100 #ETFTrading
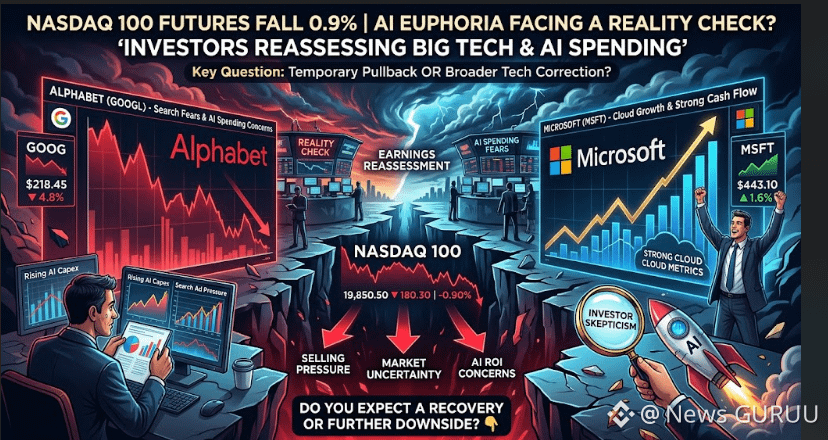
#nasdaq100futuresfall0.9% #GOOGL 🚨 Nasdaq 100 Futures Drop 0.9% — Is AI Hype Fading? 📉 Alphabet slides as investors worry about rising AI costs and returns. 📈 Microsoft gains on strong cash flow and a positive cloud outlook. Investors now want real profits from AI spending, not just big promises. 🎯 My View: Avoid chasing the move until the market confirms its direction. More tech selling could deepen the correction. 👀 Recovery ahead or more downside? What’s your take?."CLICK ON THE BELOW YELLOW COIN TAG TO GO TO DESIRED TRADING PAGE TO GET BENEFIT TRADE"$GOOG.US $MSFTB $GOOGLB {spot}(GOOGLBUSDT) {spot}(MSFTBUSDT) {stock_us}(GOOG.US) #Nasdaq100 #AIStocks
#nasdaq100futuresfall0.9% #GOOGL
🚨 Nasdaq 100 Futures Drop 0.9% — Is AI Hype Fading?
📉 Alphabet slides as investors worry about rising AI costs and returns.
📈 Microsoft gains on strong cash flow and a positive cloud outlook.
Investors now want real profits from AI spending, not just big promises.
🎯 My View: Avoid chasing the move until the market confirms its direction. More tech selling could deepen the correction.
👀 Recovery ahead or more downside? What’s your take?."CLICK ON THE BELOW YELLOW COIN TAG TO GO TO DESIRED TRADING PAGE TO GET BENEFIT TRADE"$GOOG.US $MSFTB $GOOGLB
#Nasdaq100 #AIStocks
GOOGUS+1.10%
MSFTB-0.14%
GOOGLB+0.41%
QQQ closed at $725.61, up 0.60% in the latest reported session. The Nasdaq-100 held up after the Fed’s rate decision, but today’s earnings and inflation signals could quickly change the mood. My lean: cautiously bullish while QQQ holds its recent gains—but tech optimism still needs earnings to back it up. Are dip buyers stepping in, or is this just a brief pause before more volatility? $QQQB #Nasdaq100 #TechStocks
QQQ closed at $725.61, up 0.60% in the latest reported session. The Nasdaq-100 held up after the Fed’s rate decision, but today’s earnings and inflation signals could quickly change the mood.

My lean: cautiously bullish while QQQ holds its recent gains—but tech optimism still needs earnings to back it up.

Are dip buyers stepping in, or is this just a brief pause before more volatility?

$QQQB #Nasdaq100 #TechStocks
$BTC | Square is asking whether Microsoft can deliver on AI. On the desk that question is really about the Nasdaq 100's structure. SatoshiMacro's tracker shows the top seven names, Apple, Microsoft, Nvidia, Alphabet, Amazon, Meta and Tesla, carry roughly 50 percent of index weight, with Apple once near 14 percent. One soft print can move the whole benchmark. The index closed 29,651.44 on 27 October, still under the 6 October record of 31,224. BTC-NDX correlation has averaged 0.37 since 2020, peaking near 0.65 in past tightening shocks. My read: single-name risk wearing an index costume. ASIC's retail CFD loss-rate warning does not care which ticker caused the move. https://satoshimacro.com/tools/crypto/markets/nasdaq-100/?utm_source=binance_square&utm_medium=social&utm_campaign=autopilot_short-2 #SatoshiMacro #CanMicrosoftDeliverOnAI #Nasdaq100 #Bitcoin
$BTC | Square is asking whether Microsoft can deliver on AI. On the desk that question is really about the Nasdaq 100's structure. SatoshiMacro's tracker shows the top seven names, Apple, Microsoft, Nvidia, Alphabet, Amazon, Meta and Tesla, carry roughly 50 percent of index weight, with Apple once near 14 percent. One soft print can move the whole benchmark. The index closed 29,651.44 on 27 October, still under the 6 October record of 31,224. BTC-NDX correlation has averaged 0.37 since 2020, peaking near 0.65 in past tightening shocks. My read: single-name risk wearing an index costume. ASIC's retail CFD loss-rate warning does not care which ticker caused the move.
https://satoshimacro.com/tools/crypto/markets/nasdaq-100/?utm_source=binance_square&utm_medium=social&utm_campaign=autopilot_short-2
#SatoshiMacro #CanMicrosoftDeliverOnAI #Nasdaq100 #Bitcoin
ලිපිය
Janus Henderson e Centrifuge anunciam fundo JQQQ, com exposição ao Nasdaq-100 na blockchain Stellar.Um dos índices mais conhecidos do mercado financeiro ganhou uma nova estrutura de investimento baseada em blockchain. Em 27 de outubro de 2026, Janus Henderson e Centrifuge anunciaram o lançamento do JQQQ, fundo estruturado para oferecer exposição ao desempenho do Nasdaq-100 por meio da rede Stellar. A iniciativa representa mais um avanço da tokenização de ativos financeiros tradicionais. O que foi anunciado? O JQQQ utiliza a infraestrutura da Centrifuge para emissão e operação de participações em um fundo na blockchain. A estratégia busca acompanhar o Nasdaq-100, índice que reúne grandes empresas não financeiras listadas na bolsa Nasdaq. O uso do índice é licenciado pela Nasdaq. Isso, porém, não significa que a Nasdaq patrocine ou garanta o produto. O fundo será lançado exclusivamente na rede Stellar e destinado a investidores elegíveis nas jurisdições onde sua oferta for legalmente permitida. Pessoas dos Estados Unidos não poderão investir. O que torna esse lançamento diferente? Diferentemente de tokens criados por terceiros para representar ações negociadas em bolsas tradicionais, o JQQQ foi estruturado como um produto de investimento emitido e operado diretamente em infraestrutura blockchain. Isso pode facilitar sua integração futura com aplicações financeiras digitais, como carteiras institucionais programáveis e sistemas de garantias. Importante: essas possibilidades não significam que todas essas funcionalidades já estejam disponíveis. O que o investidor realmente possui? O JQQQ oferece exposição econômica indireta a um produto que acompanha o Nasdaq-100. Comprar participações no fundo não significa adquirir diretamente as ações das empresas integrantes do índice, nem receber automaticamente os direitos de seus acionistas. Também existem riscos específicos relacionados a contratos inteligentes, custódia digital, liquidez e infraestrutura blockchain. Qual é a importância para o mercado cripto? O lançamento demonstra que instituições financeiras estão ampliando a utilização de redes públicas para estruturar produtos tradicionais. Segundo a Janus Henderson, sua plataforma de estratégias institucionais onchain já supera US$ 1 bilhão em ativos distribuídos entre títulos públicos, crédito e ações. Essa expansão é relevante para a infraestrutura de tokenização, mas não comprova aumento de demanda pelo token XLM nem garante valorização de qualquer criptomoeda. O que acompanhar agora? Os próximos indicadores serão a adesão de investidores elegíveis, o volume efetivamente aplicado no JQQQ, a liquidez e a integração com outras aplicações financeiras. Também será importante verificar quais jurisdições permitirão a distribuição do fundo. A principal mudança é estrutural: produtos financeiros tradicionais estão começando a ser desenvolvidos diretamente em blockchain, em vez de apenas receber representações digitais posteriores. 💬 Você acredita que fundos tokenizados poderão se tornar uma alternativa relevante aos produtos financeiros tradicionais? $XLM #Tokenizacao #Stellar #Nasdaq100

Janus Henderson e Centrifuge anunciam fundo JQQQ, com exposição ao Nasdaq-100 na blockchain Stellar.

Um dos índices mais conhecidos do mercado financeiro ganhou uma nova estrutura de investimento baseada em blockchain.
Em 27 de outubro de 2026, Janus Henderson e Centrifuge anunciaram o lançamento do JQQQ, fundo estruturado para oferecer exposição ao desempenho do Nasdaq-100 por meio da rede Stellar.
A iniciativa representa mais um avanço da tokenização de ativos financeiros tradicionais.
O que foi anunciado?
O JQQQ utiliza a infraestrutura da Centrifuge para emissão e operação de participações em um fundo na blockchain.
A estratégia busca acompanhar o Nasdaq-100, índice que reúne grandes empresas não financeiras listadas na bolsa Nasdaq.
O uso do índice é licenciado pela Nasdaq. Isso, porém, não significa que a Nasdaq patrocine ou garanta o produto.
O fundo será lançado exclusivamente na rede Stellar e destinado a investidores elegíveis nas jurisdições onde sua oferta for legalmente permitida. Pessoas dos Estados Unidos não poderão investir.
O que torna esse lançamento diferente?
Diferentemente de tokens criados por terceiros para representar ações negociadas em bolsas tradicionais, o JQQQ foi estruturado como um produto de investimento emitido e operado diretamente em infraestrutura blockchain.
Isso pode facilitar sua integração futura com aplicações financeiras digitais, como carteiras institucionais programáveis e sistemas de garantias.
Importante: essas possibilidades não significam que todas essas funcionalidades já estejam disponíveis.
O que o investidor realmente possui?
O JQQQ oferece exposição econômica indireta a um produto que acompanha o Nasdaq-100.
Comprar participações no fundo não significa adquirir diretamente as ações das empresas integrantes do índice, nem receber automaticamente os direitos de seus acionistas.
Também existem riscos específicos relacionados a contratos inteligentes, custódia digital, liquidez e infraestrutura blockchain.
Qual é a importância para o mercado cripto?
O lançamento demonstra que instituições financeiras estão ampliando a utilização de redes públicas para estruturar produtos tradicionais.
Segundo a Janus Henderson, sua plataforma de estratégias institucionais onchain já supera US$ 1 bilhão em ativos distribuídos entre títulos públicos, crédito e ações.
Essa expansão é relevante para a infraestrutura de tokenização, mas não comprova aumento de demanda pelo token XLM nem garante valorização de qualquer criptomoeda.
O que acompanhar agora?
Os próximos indicadores serão a adesão de investidores elegíveis, o volume efetivamente aplicado no JQQQ, a liquidez e a integração com outras aplicações financeiras.
Também será importante verificar quais jurisdições permitirão a distribuição do fundo.
A principal mudança é estrutural: produtos financeiros tradicionais estão começando a ser desenvolvidos diretamente em blockchain, em vez de apenas receber representações digitais posteriores.
💬 Você acredita que fundos tokenizados poderão se tornar uma alternativa relevante aos produtos financeiros tradicionais?
$XLM #Tokenizacao #Stellar #Nasdaq100

The Nasdaq-100 is coming onchain—and the structure caught my eye. 👀 Janus Henderson, the $500 billion asset manager, and Centrifuge are launching the first licensed Nasdaq-100 fund on Stellar. The key distinction: it’s issuer-sponsored, not a third-party stock token. That’s the part I find more interesting than the headline. 🏛️ Does issuer sponsorship make an onchain fund more credible to you, or would you need more details first? #Tokenization #Stellar #Nasdaq100

The Nasdaq-100 is coming onchain—and the structure caught my eye. 👀

Janus Henderson, the $500 billion asset manager, and Centrifuge are launching the first licensed Nasdaq-100 fund on Stellar.

The key distinction: it’s issuer-sponsored, not a third-party stock token. That’s the part I find more interesting than the headline. 🏛️

Does issuer sponsorship make an onchain fund more credible to you, or would you need more details first?

#Tokenization #Stellar #Nasdaq100

QQQ is around $712.20, up about 1.1% in the latest session. The rebound comes just as Alphabet, Microsoft and Amazon report earnings, putting AI spending and returns in the spotlight. One green day won’t settle that debate. My lean: bearish near term until tech earnings bring buyers back with conviction. Will this bounce hold through Big Tech earnings—or fade when the numbers arrive? #qqqbcoin #Nasdaq100 #TechStocks
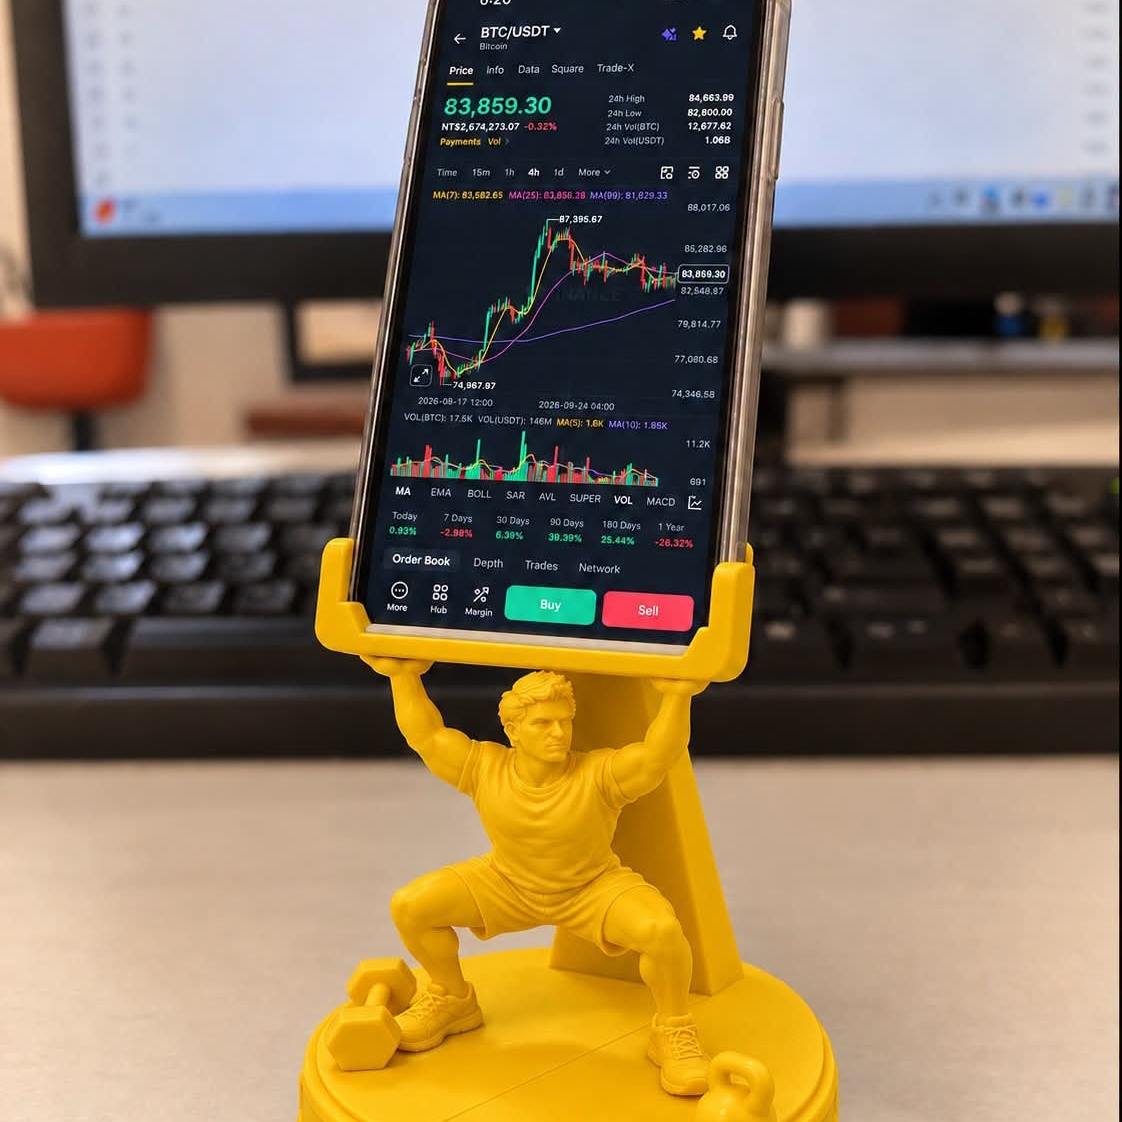
QQQ is around $712.20, up about 1.1% in the latest session.

The rebound comes just as Alphabet, Microsoft and Amazon report earnings, putting AI spending and returns in the spotlight. One green day won’t settle that debate.

My lean: bearish near term until tech earnings bring buyers back with conviction.

Will this bounce hold through Big Tech earnings—or fade when the numbers arrive?

#qqqbcoin #Nasdaq100 #TechStocks

📉 $QQQ Drops as AI Capex Fears Pressure Big Tech Traders are questioning whether AI spending is delivering returns fast enough. QQQ fell 2.62% to $706.22 and now sits 7.42% below its 52-week high. Meta, Nvidia and chip names led the selloff as heavy capex and weaker free cash flow raised valuation risk. ⚠️ Key levels: support near $706 and $700. A break below $700 puts $686.57 in focus, while rebounds face resistance near $714 and $718. Next catalysts: Microsoft earnings and the Oct. 28 Fed decision. #Stocks #QQQ #NASDAQ100 #META #NVDA #MSFT #AI {future}(QQQUSDT)
📉 $QQQ Drops as AI Capex Fears Pressure Big Tech
Traders are questioning whether AI spending is delivering returns fast enough.

QQQ fell 2.62% to $706.22 and now sits 7.42% below its 52-week high. Meta, Nvidia and chip names led the selloff as heavy capex and weaker free cash flow raised valuation risk. ⚠️

Key levels: support near $706 and $700. A break below $700 puts $686.57 in focus, while rebounds face resistance near $714 and $718. Next catalysts: Microsoft earnings and the Oct. 28 Fed decision. #Stocks #QQQ #NASDAQ100 #META #NVDA #MSFT #AI
·
--
$Nasdaq 100 Rebounds from Support: Recovery or Relief Bounce? ◆━━━━━━━━━━━━━━━━━━ Market Overview The US 100 Index is trading near 29,822, up about 1.1% on the day. After peaking above 31,000 in early October, the index sold off sharply, then found buyers near key support. Volatility has been high, and momentum is turning back up. ◆━━━━━━━━━━━━━━━━━━ Technical Analysis The 28,898 level is the major support. Price tested this zone, held, and bounced, a classic reaction at a level that has mattered since the summer. On the upside, the index is back near the 29,800 area, which has acted as both support and resistance in recent months. The October high near 31,300 marks the top of the recent range. A rebound after a sharp drop can be a recovery or just a pause, so confirmation matters. ◆━━━━━━━━━━━━━━━━━━ 🟢 Bullish Case A daily close above 30,700 could signal strength and open a retest of 31,300. 🔴 Bearish Case A daily close below 28,898 would break the support and may expose 28,000. ⚪ Neutral Case The index may chop between 28,900 and 30,700 while the market decides on direction. ◆━━━━━━━━━━━━━━━━━━ Key Levels ➤ Resistance: R1 30,700 | R2 31,300 ➤ Support: S1 28,898 | S2 28,000 Context Tech strength often sets the tone for risk assets, including crypto. ◆━━━━━━━━━━━━━━━━━━ Conclusion Watch how NDQ behaves around 30,000 and whether support at 28,898 keeps holding. Not financial advice. Always do your own research. ◆━━━━━━━━━━━━━━━━━━ #Nasdaq100 #EarningsSeason #ChinaSeeksToSeize61800BTC #KOSPISinks3.52%ToLowestCloseSinceApril #TeslaSlides5%PreMarket $NDAQ.US {stock_us}(NDAQ.US) $NDIV.ETF {etf_us}(NDIV.ETF)
$Nasdaq 100 Rebounds from Support: Recovery or Relief Bounce?

◆━━━━━━━━━━━━━━━━━━

Market Overview

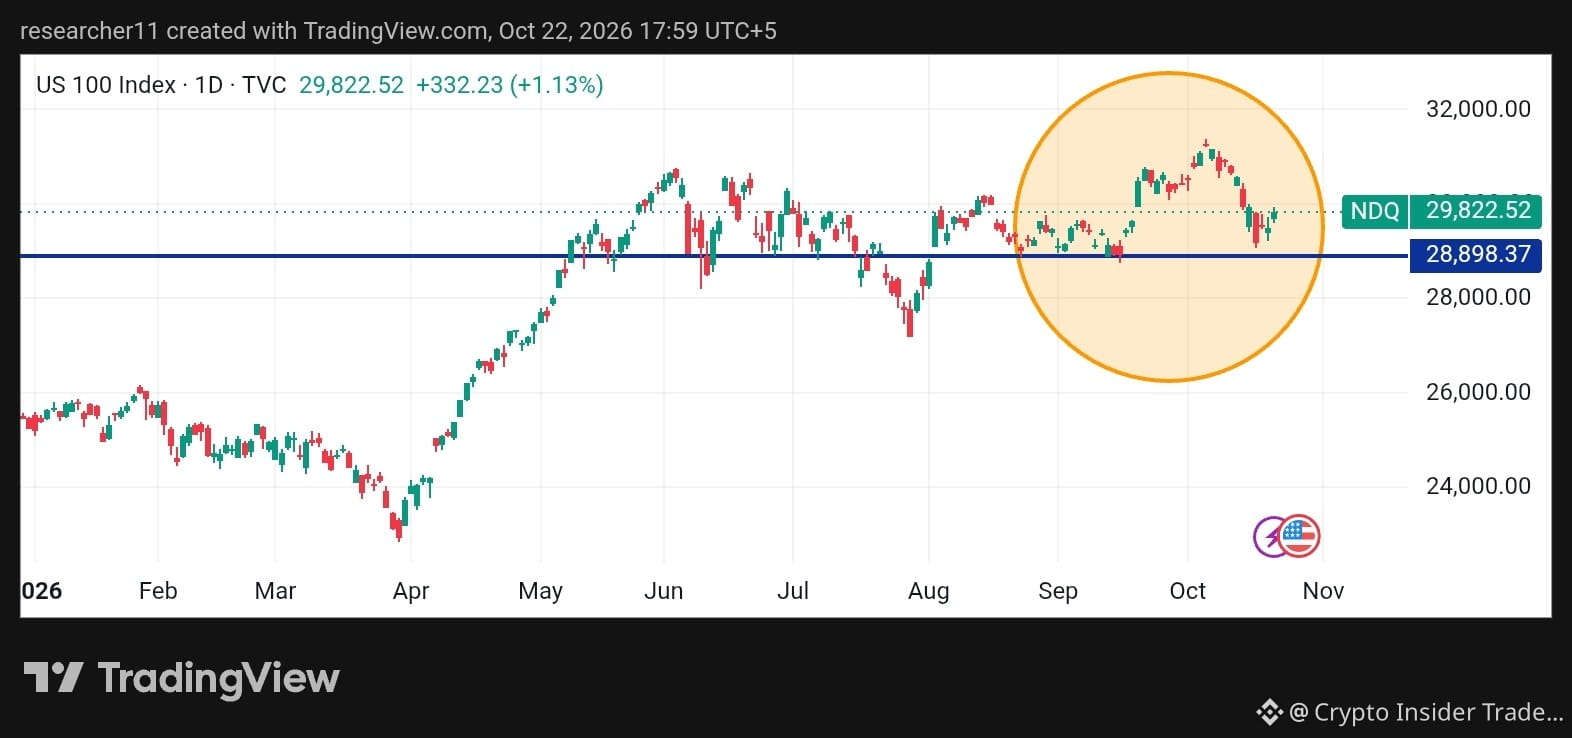
The US 100 Index is trading near 29,822, up about 1.1% on the day. After peaking above 31,000 in early October, the index sold off sharply, then found buyers near key support. Volatility has been high, and momentum is turning back up.

◆━━━━━━━━━━━━━━━━━━

Technical Analysis

The 28,898 level is the major support. Price tested this zone, held, and bounced, a classic reaction at a level that has mattered since the summer.

On the upside, the index is back near the 29,800 area, which has acted as both support and resistance in recent months. The October high near 31,300 marks the top of the recent range.

A rebound after a sharp drop can be a recovery or just a pause, so confirmation matters.

◆━━━━━━━━━━━━━━━━━━

🟢 Bullish Case

A daily close above 30,700 could signal strength and open a retest of 31,300.

🔴 Bearish Case

A daily close below 28,898 would break the support and may expose 28,000.

⚪ Neutral Case

The index may chop between 28,900 and 30,700 while the market decides on direction.

◆━━━━━━━━━━━━━━━━━━

Key Levels

➤ Resistance: R1 30,700 | R2 31,300

➤ Support: S1 28,898 | S2 28,000

Context

Tech strength often sets the tone for risk assets, including crypto.

◆━━━━━━━━━━━━━━━━━━

Conclusion

Watch how NDQ behaves around 30,000 and whether support at 28,898 keeps holding.

Not financial advice. Always do your own research.

◆━━━━━━━━━━━━━━━━━━
#Nasdaq100 #EarningsSeason #ChinaSeeksToSeize61800BTC #KOSPISinks3.52%ToLowestCloseSinceApril #TeslaSlides5%PreMarket
$NDAQ.US

$NDIV.ETF
NDAQUS-0.02%
NDIVETF+2.42%
$BTC | Nasdaq posted its widest weekly gap since July 2002. SatoshiMacro's Nasdaq 100 tracker shows the index closed 29,187.55 on 16 October, 6.5 percent below the 31,224 record set ten days earlier. On the desk a gap like that reads as a volatility signal, not a verdict. Bitcoin has run about 2.4 times NDX daily volatility since 2020, so a move this size in equities often shows up amplified in BTC. My read is the multiplier matters more than the correlation this week. That 2.4x is a long-run average, not a next-session forecast. Australian accounts carry the AUD/USD layer too, 5 to 10 percentage points a year on SatoshiMacro's own data, on top of the index move. Size for both. https://satoshimacro.com/tools/crypto/markets/nasdaq-100/?utm_source=binance_square&utm_medium=social&utm_campaign=autopilot_short-1 #SatoshiMacro #NasdaqDowWeeklyGapWidestSinceJuly2002 #Nasdaq100 #Bitcoin
$BTC | Nasdaq posted its widest weekly gap since July 2002. SatoshiMacro's Nasdaq 100 tracker shows the index closed 29,187.55 on 16 October, 6.5 percent below the 31,224 record set ten days earlier. On the desk a gap like that reads as a volatility signal, not a verdict. Bitcoin has run about 2.4 times NDX daily volatility since 2020, so a move this size in equities often shows up amplified in BTC. My read is the multiplier matters more than the correlation this week. That 2.4x is a long-run average, not a next-session forecast. Australian accounts carry the AUD/USD layer too, 5 to 10 percentage points a year on SatoshiMacro's own data, on top of the index move. Size for both.

https://satoshimacro.com/tools/crypto/markets/nasdaq-100/?utm_source=binance_square&utm_medium=social&utm_campaign=autopilot_short-1

#SatoshiMacro #NasdaqDowWeeklyGapWidestSinceJuly2002 #Nasdaq100 #Bitcoin
·
--
බෙයාරිෂ්
සත්යායනය කළ
🚨📉 زلزال في وول ستريت… ناسداك 100 يسجل أسوأ أسبوع منذ أبريل 2025! 🔥 أسبوع قاسٍ لعمالقة التكنولوجيا الأمريكية، بعدما تكبّد مؤشر Nasdaq 100 خسارة بلغت 5.5% خلال الأسبوع المنتهي في 16 أكتوبر 2026. 📊 الأرقام تكشف حجم التراجع: 🔴 خسارة أسبوعية: 5.5% 🔴 تراجع يقارب 7% من قمته الأخيرة المسجلة قبل نحو 10 أيام. 🔴 أكبر انخفاض أسبوعي منذ أبريل 2025. ⚠️ ما الذي يحدث في الأسواق؟ تتصاعد مخاوف المستثمرين بشأن التقييمات المرتفعة لأسهم التكنولوجيا، وجدوى الإنفاق الضخم على الذكاء الاصطناعي، في ظل ضغوط تكاليف التمويل. المشكلة ليست فقط في حجم الهبوط، بل في سرعة انتقال المستثمرين من شهية المخاطرة إلى الحذر. 📌 والسؤال الأهم الآن: هل نحن أمام تصحيح صحي بعد موجة صعود قوية… أم بداية موجة هبوط أعمق في أسهم التكنولوجيا؟ 💬 هل تعتبر هذا التراجع فرصة للشراء أم إشارة للخروج؟ #Nasdaq100 {spot}(NVDABUSDT) {spot}(METABUSDT) {spot}(MSFTBUSDT)
🚨📉 زلزال في وول ستريت… ناسداك 100 يسجل أسوأ أسبوع منذ أبريل 2025!

🔥 أسبوع قاسٍ لعمالقة التكنولوجيا الأمريكية، بعدما تكبّد مؤشر Nasdaq 100 خسارة بلغت 5.5% خلال الأسبوع المنتهي في 16 أكتوبر 2026.

📊 الأرقام تكشف حجم التراجع:

🔴 خسارة أسبوعية: 5.5%

🔴 تراجع يقارب 7% من قمته الأخيرة المسجلة قبل نحو 10 أيام.

🔴 أكبر انخفاض أسبوعي منذ أبريل 2025.

⚠️ ما الذي يحدث في الأسواق؟

تتصاعد مخاوف المستثمرين بشأن التقييمات المرتفعة لأسهم التكنولوجيا، وجدوى الإنفاق الضخم على الذكاء الاصطناعي، في ظل ضغوط تكاليف التمويل.

المشكلة ليست فقط في حجم الهبوط، بل في سرعة انتقال المستثمرين من شهية المخاطرة إلى الحذر.

📌 والسؤال الأهم الآن:

هل نحن أمام تصحيح صحي بعد موجة صعود قوية… أم بداية موجة هبوط أعمق في أسهم التكنولوجيا؟

💬 هل تعتبر هذا التراجع فرصة للشراء أم إشارة للخروج؟

#Nasdaq100


Real Betis Balompié vs. FC Barcelona

Real Betis Balompié vs. FC Barcelona

BAR99%BET1%Draw1%
පරිමාව $784,561.47
·
--
බෙයාරිෂ්
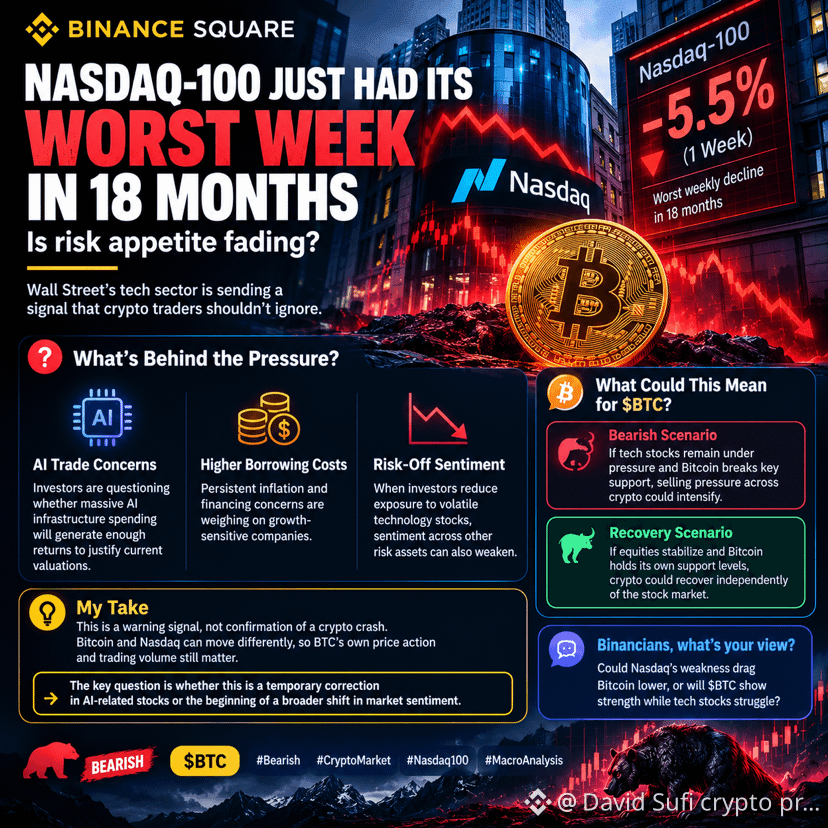
#nasdaq100falls5.5%inworstweekin18months ⏬⏬⏬⏬⏬⏬⏬⏬⏬⏬⏬⏬⏬⏬⏬NASDAQ-100 JUST HAD ITS WORST WEEK IN 18 MONTHS — IS RISK APPETITE FADING? Wall Street’s tech sector is sending a signal that crypto traders shouldn’t ignore. 📉 The Nasdaq-100 fell approximately 5.5% during the week ending October 16, marking its steepest weekly decline in around 18 months. What’s behind the pressure? 🔻 AI trade concerns: Investors are questioning whether massive AI infrastructure spending will generate enough returns to justify current valuations. 🔻 Higher borrowing costs: Persistent inflation and financing concerns are weighing on growth-sensitive companies. 🔻 Risk-off sentiment: When investors reduce exposure to volatile technology stocks, sentiment across other risk assets can also weaken. What could this mean for $BTC? 🐻 Bearish scenario: If tech stocks remain under pressure and Bitcoin breaks key support, selling pressure across crypto could intensify. 🐂 Recovery scenario: If equities stabilize and Bitcoin holds its own support levels, crypto could recover independently of the stock market. ⚠️ My take: This is a warning signal, not confirmation of a crypto crash. Bitcoin and Nasdaq can move differently, so BTC’s own price action and trading volume still matter. The key question is whether this is a temporary correction in AI-related stocks or the beginning of a broader shift in market sentiment. 💬 Binancians, what’s your view? Could Nasdaq’s weakness drag Bitcoin lower, or will $BTC show strength while tech stocks struggle? #BTC #Bearish #Nasdaq100 #CryptoMarket #MacroAnalysis {future}(BTCUSDT)
#nasdaq100falls5.5%inworstweekin18months ⏬⏬⏬⏬⏬⏬⏬⏬⏬⏬⏬⏬⏬⏬⏬NASDAQ-100 JUST HAD ITS WORST WEEK IN 18 MONTHS — IS RISK APPETITE FADING?

Wall Street’s tech sector is sending a signal that crypto traders shouldn’t ignore. 📉

The Nasdaq-100 fell approximately 5.5% during the week ending October 16, marking its steepest weekly decline in around 18 months.

What’s behind the pressure?

🔻 AI trade concerns: Investors are questioning whether massive AI infrastructure spending will generate enough returns to justify current valuations.

🔻 Higher borrowing costs: Persistent inflation and financing concerns are weighing on growth-sensitive companies.

🔻 Risk-off sentiment: When investors reduce exposure to volatile technology stocks, sentiment across other risk assets can also weaken.

What could this mean for $BTC ?

🐻 Bearish scenario: If tech stocks remain under pressure and Bitcoin breaks key support, selling pressure across crypto could intensify.

🐂 Recovery scenario: If equities stabilize and Bitcoin holds its own support levels, crypto could recover independently of the stock market.

⚠️ My take: This is a warning signal, not confirmation of a crypto crash. Bitcoin and Nasdaq can move differently, so BTC’s own price action and trading volume still matter.

The key question is whether this is a temporary correction in AI-related stocks or the beginning of a broader shift in market sentiment.

💬 Binancians, what’s your view? Could Nasdaq’s weakness drag Bitcoin lower, or will $BTC show strength while tech stocks struggle?

#BTC #Bearish #Nasdaq100 #CryptoMarket #MacroAnalysis
Nasdaq-100 Just Had Its Worst Week in 18 Months. Is the AI Trade Losing Momentum? The Nasdaq-100 dropped approximately 5.5% during the week ending October 16, marking its steepest weekly decline in around 18 months. The pressure came largely from technology, semiconductor and AI-related stocks as investors questioned whether the AI investment boom can justify its massive spending and valuations. Rising oil prices and inflation concerns added another layer of uncertainty. Source: Financial Times Here is what matters for traders: Tech stocks: Further weakness could expose overextended positions. Bitcoin and crypto: A broader risk-off move could pressure speculative assets, although correlation is not guaranteed. The next signal: Watch upcoming tech earnings, inflation expectations and Federal Reserve guidance. My take: one brutal week does not confirm a bear market, but it does challenge the assumption that AI-linked stocks can keep climbing without interruption. I would focus on price structure, liquidity and confirmation rather than blindly buying the dip. When market sentiment shifts, protecting capital matters more than proving a bullish thesis right. Is this a healthy correction or the beginning of a deeper risk-off phase? #Nasdaq100 #Nasdaq100Falls5.5%InWorstWeekIn18Months
Nasdaq-100 Just Had Its Worst Week in 18 Months. Is the AI Trade Losing Momentum?

The Nasdaq-100 dropped approximately 5.5% during the week ending October 16, marking its steepest weekly decline in around 18 months. The pressure came largely from technology, semiconductor and AI-related stocks as investors questioned whether the AI investment boom can justify its massive spending and valuations. Rising oil prices and inflation concerns added another layer of uncertainty. Source: Financial Times

Here is what matters for traders:

Tech stocks: Further weakness could expose overextended positions.

Bitcoin and crypto: A broader risk-off move could pressure speculative assets, although correlation is not guaranteed.

The next signal: Watch upcoming tech earnings, inflation expectations and Federal Reserve guidance.

My take: one brutal week does not confirm a bear market, but it does challenge the assumption that AI-linked stocks can keep climbing without interruption.

I would focus on price structure, liquidity and confirmation rather than blindly buying the dip. When market sentiment shifts, protecting capital matters more than proving a bullish thesis right.

Is this a healthy correction or the beginning of a deeper risk-off phase?

#Nasdaq100
#Nasdaq100Falls5.5%InWorstWeekIn18Months
$BTC | Square is trading on bets for three more Fed hikes. On the desk, financing legs move on the bet itself, not the decision. The Nasdaq 100 is the most rate-sensitive major US index because its earnings are long-dated, and the 10-year yield behind it is effectively its discount rate. SatoshiMacro's Nasdaq 100 tracker shows BTC's rolling 90-day correlation to the NDX averages 0.37 since 2020, but tightening shocks pushed it to 0.65 in May 2022. My read is this spike has further to run. Limitation: it fades hard around halvings or ETF launches, and the ASX-listed NDQ still costs AU holders 0.48 percent a year versus QQQ's 0.20 percent. https://satoshimacro.com/tools/crypto/markets/nasdaq-100/?utm_source=binance_square&utm_medium=social&utm_campaign=autopilot_trend #SatoshiMacro #TradersBetOnThreeMoreFedHikes #Bitcoin #Nasdaq100
$BTC | Square is trading on bets for three more Fed hikes. On the desk, financing legs move on the bet itself, not the decision. The Nasdaq 100 is the most rate-sensitive major US index because its earnings are long-dated, and the 10-year yield behind it is effectively its discount rate. SatoshiMacro's Nasdaq 100 tracker shows BTC's rolling 90-day correlation to the NDX averages 0.37 since 2020, but tightening shocks pushed it to 0.65 in May 2022. My read is this spike has further to run. Limitation: it fades hard around halvings or ETF launches, and the ASX-listed NDQ still costs AU holders 0.48 percent a year versus QQQ's 0.20 percent.
https://satoshimacro.com/tools/crypto/markets/nasdaq-100/?utm_source=binance_square&utm_medium=social&utm_campaign=autopilot_trend
#SatoshiMacro #TradersBetOnThreeMoreFedHikes #Bitcoin #Nasdaq100
තවත් අන්තර්ගතයන් ගවේෂණය කිරීමට ඇතුල් වන්න
Binance චතුරශ්‍රය හි ගෝලීය ක්‍රිප්ටෝ පරිශීලකයින් හා එක්වන්න
⚡️ ක්‍රිප්ටෝ පිළිබඳ නවතම සහ ප්‍රයෝජනවත් තොරතුරු ලබා ගන්න.
💬 ලොව විශාලතම ක්‍රිප්ටෝ හුවමාරුව මගින් විශ්වාස කෙරේ.
👍 සත්‍යායනය කරන ලද නිර්මාණකරුවන්ගෙන් සැබෑ විදසුන් සොයා ගන්න.
විද්‍යුත් තැපෑල / දුරකථන අංකය