

Abd FXT
106 Публикации
Abd FXT
Отправить жалобу
Заблокировать пользователя
Abd-FX | Full-Time Trader | Forex | Crypto | Stock | Daily Free Signals & Analysis | Follow for Profit 💰
Открытая сделка
Случайный трейдер
1.5 г
222 подписок(и/а)
28 подписчиков(а)
17 понравилось
Посты
Портфель
Все
Цитирования
Видео
·
--
What is Support and Resistance?
Support: It is a price level on the chart where a downward trend pauses as buying pressure increases, pushing the price back up. It acts like a floor.
Resistance: It is a price level where upward momentum stops due to selling pressure, causing the price to reverse downward. It acts like a ceiling.
Importance: Traders look for buy entries near support and sell/profit-take near resistance. A broken resistance often becomes new support, and vice versa.
#trading #BinanceSquare #crypto #supportandresistance #TechnicalAnalysiss
33
·
--
What is Fibonacci Retracement? 📊
Fibonacci Retracement is a popular technical analysis tool used by crypto traders to identify potential support and resistance levels. Markets never move in a straight line—after a strong move, price usually retraces before continuing its main trend.
This tool plots key ratios: 23.6%, 38.2%, 50%, 61.8%, and 78.6%. Among these, the 61.8% and 50% levels are considered the strongest pullback zones for entry opportunities. Master these levels to improve your trade entries and r
#BinanceSquare #cryptotrading #TechnicalAnalysis #Fibonacci #tradingStrategy
52
·
--
Master RSI in Crypto Trading! 📊
The RSI ranges from 0 to 100 to spot trend reversals.
🔹 Overbought (>70): Price rose quickly; watch for a potential pullback.
🔹 Oversold (<30): Asset may be undervalued; watch for a bullish bounce.
🔹 Divergence: Opposite price & RSI movements hint at a trend shift.
💡 Tip: Combine RSI with support & resistance for better accuracy!
#Binance #Crypto #RSI #TradingTips
57
·
--
What is Moving Average (MA)? 📈
Moving Average is a key technical indicator that smoothes out price action by calculating the average price over a specific timeframe.
Key Types:
🔹 SMA: Simple average of prices.
🔹 EMA: Gives more weight to recent prices for faster signals.
How to Use:
• Trend: Price above MA = Bullish, below = Bearish.
• Crossed Signals: Golden Cross (Buy) occurs when short MA crosses above long MA; Death Cross (Sell) when it crosses below.
#MovingAverage #CryptoTrading #BinanceSquare
67
·
--
Price Action is a trading methodology where decisions are made purely by analyzing price movements, candlestick patterns, and market structure on a chart, without relying on technical indicators.
In simple terms, price action traders evaluate historical price behavior to forecast future trends. Key elements include support & resistance levels, trendlines, breakouts, and retests. By cutting out laggy indicators, it provides a clean, real-time view of market psychology and institutional order flow, making it one#PriceAction #cryptotrading #BinanceSquare #TechnicalAnalysis
In simple terms, price action traders evaluate historical price behavior to forecast future trends. Key elements include support & resistance levels, trendlines, breakouts, and retests. By cutting out laggy indicators, it provides a clean, real-time view of market psychology and institutional order flow, making it one#PriceAction #cryptotrading #BinanceSquare #TechnicalAnalysis
52
·
--
What is a Technical Indicator? 📈
A Technical Indicator is a mathematical tool based on price and volume history. It helps traders analyze market trends and spot entry or exit points.
Types:
Lagging: Confirms current trends (e.g., Moving Average, MACD).
Leading: Predicts trend reversals (e.g., RSI).
Combine indicators with Price Action and SMC to manage risk effectively! 🚀
#Crypto #BinanceSquare #TechnicalAnalysis #TradingIndicators #CryptoEducation #PriceAction #TradingTips #SMC #Binance
77
·
--
Understanding Trading Volume is crucial for mastering Forex markets. Volume represents the total number of contracts or lots traded in a currency pair within a given tim
📈 Why is it essential?
Market Strength: High volume confirms strong participation from institutional investors and banks.
Breakout Validation: Price breakouts backed by high volume signal reliable trend continuation.
Avoid Fakeouts: Low volume price moves are often misleading traps.
Master volume analysis to boost your trading accuracy! 🚀
#forex #TradingVolume #BinanceSquare #smartmoney #TechnicalAnalysiss
73
·
--
বাইন্যান্স স্কয়ার (Binance Square) কি এবং ট্রেডারদের জন্য এটি কেন অত্যন্ত গুরুত্বপূর্ণ—এক ভিডিওতেই জেনে নিন সহজ বাংলায়!
এই ভিডিওতে আমরা কভার করেছি:
- Binance Square কি?
- এর মূল বৈশিষ্ট্য ও সুবিধাসমূহ
- কিভাবে এটি ব্যবহার করে ক্রিপ্টো মার্কেট আপডেট পাবেন
- বাইন্যান্স স্কয়ার থেকে ইনকাম ও রিওয়ার্ডের সুযোগ
ভিডিওটি ভালো লাগলে লাইক দিন এবং ট্রেডিং ও ক্রিপ্টো সম্পর্কিত আরও নতুন আপডেটের জন্য চ্যানেলটি সাবস্ক্রাইব করে পাশে থাকুন!
#BinanceSquare #CryptoBangla #Binance #cryptotrading #TradingTips
2
·
--
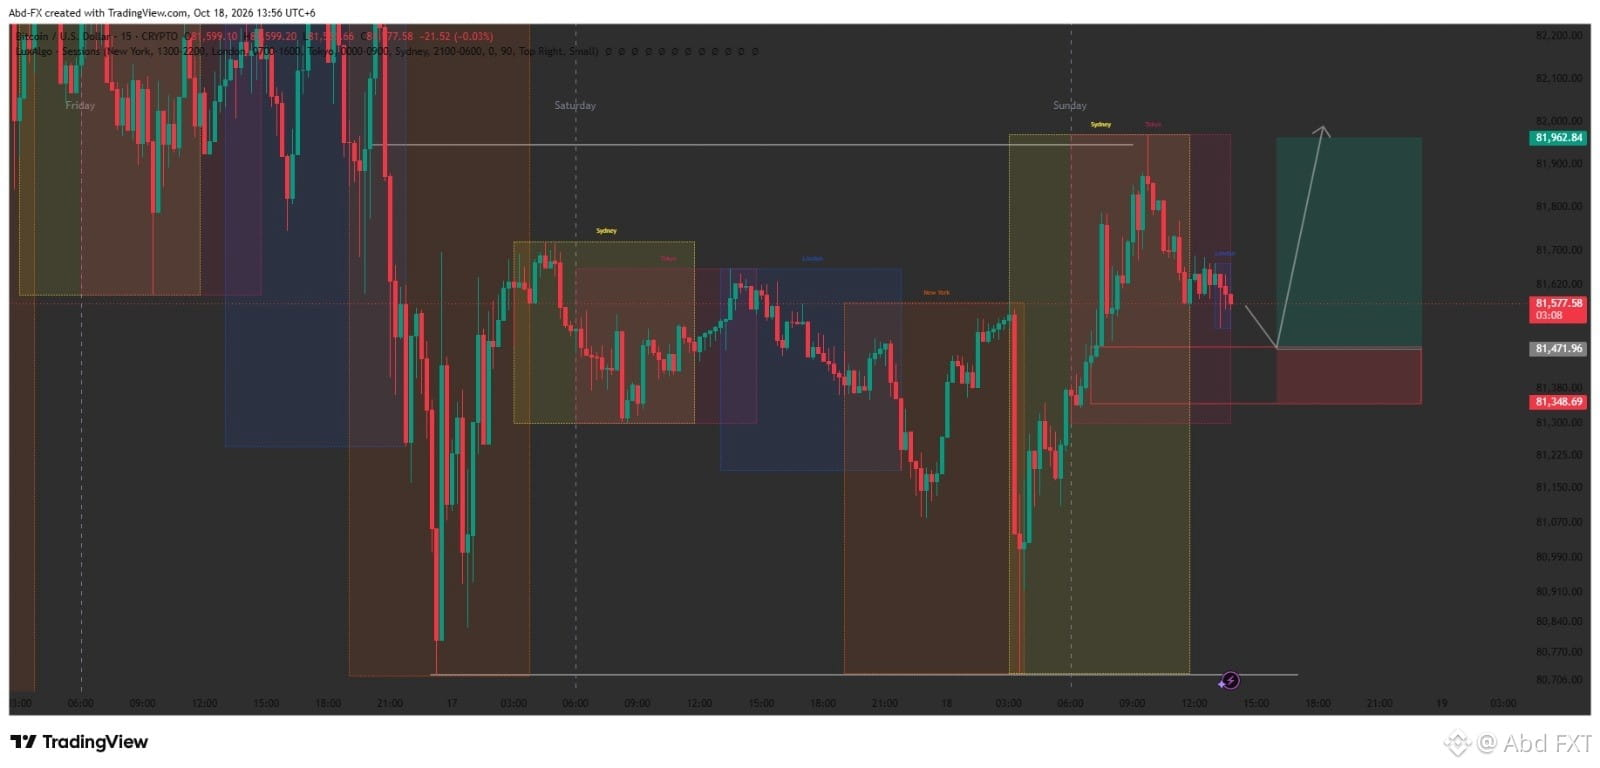
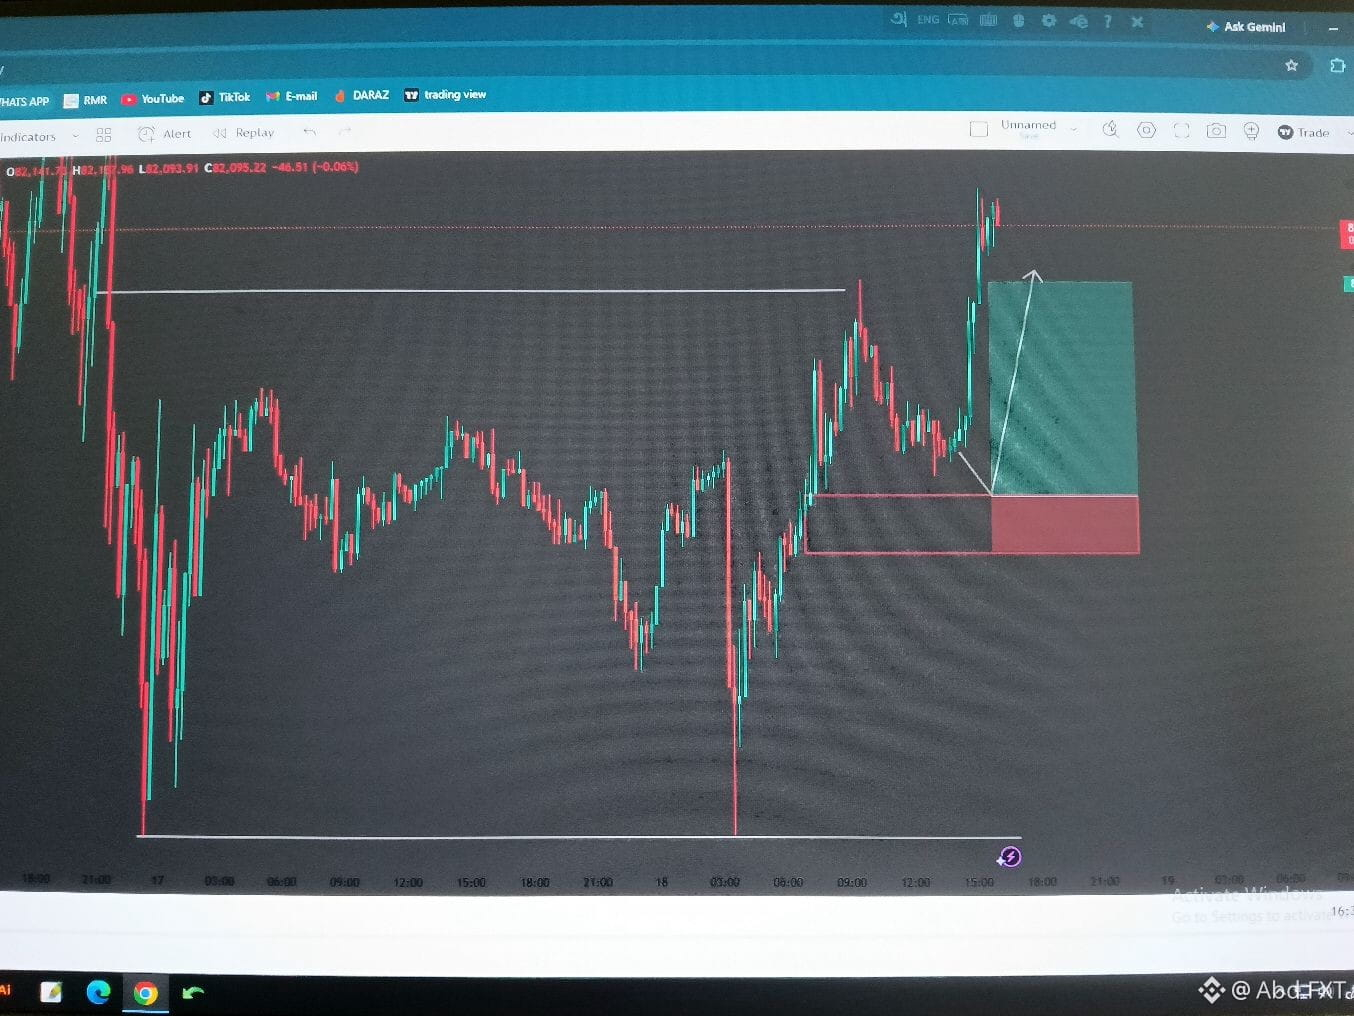
BTC Update: Entry Missed, But Direction Was Perfect! 🎯 - Abd-FX
I did my analysis earlier for a Buy from the 81,471 Zone.
But the market pumped to 82k+ before even coming to my entry.
Many new traders will now FOMO Buy at the top and get trapped.
I won't.
My Rule is Simple:
No Entry = No Trade.
A correct analysis doesn't mean you have to take every trade.
Sometimes, letting the market go is also part of trading.
Today's Lesson:
On Sundays, BTC often pumps without a retest.
Noted for next time.
Waiting for the next clean setup.
Did you catch this pump? Let me know in the comments 👇
#AbdFX #BTC #bitcoin #cryptotrading #tradingpsychology
78
·
--
Option 1: Detailed & Professional (Recommended for Binance Square)
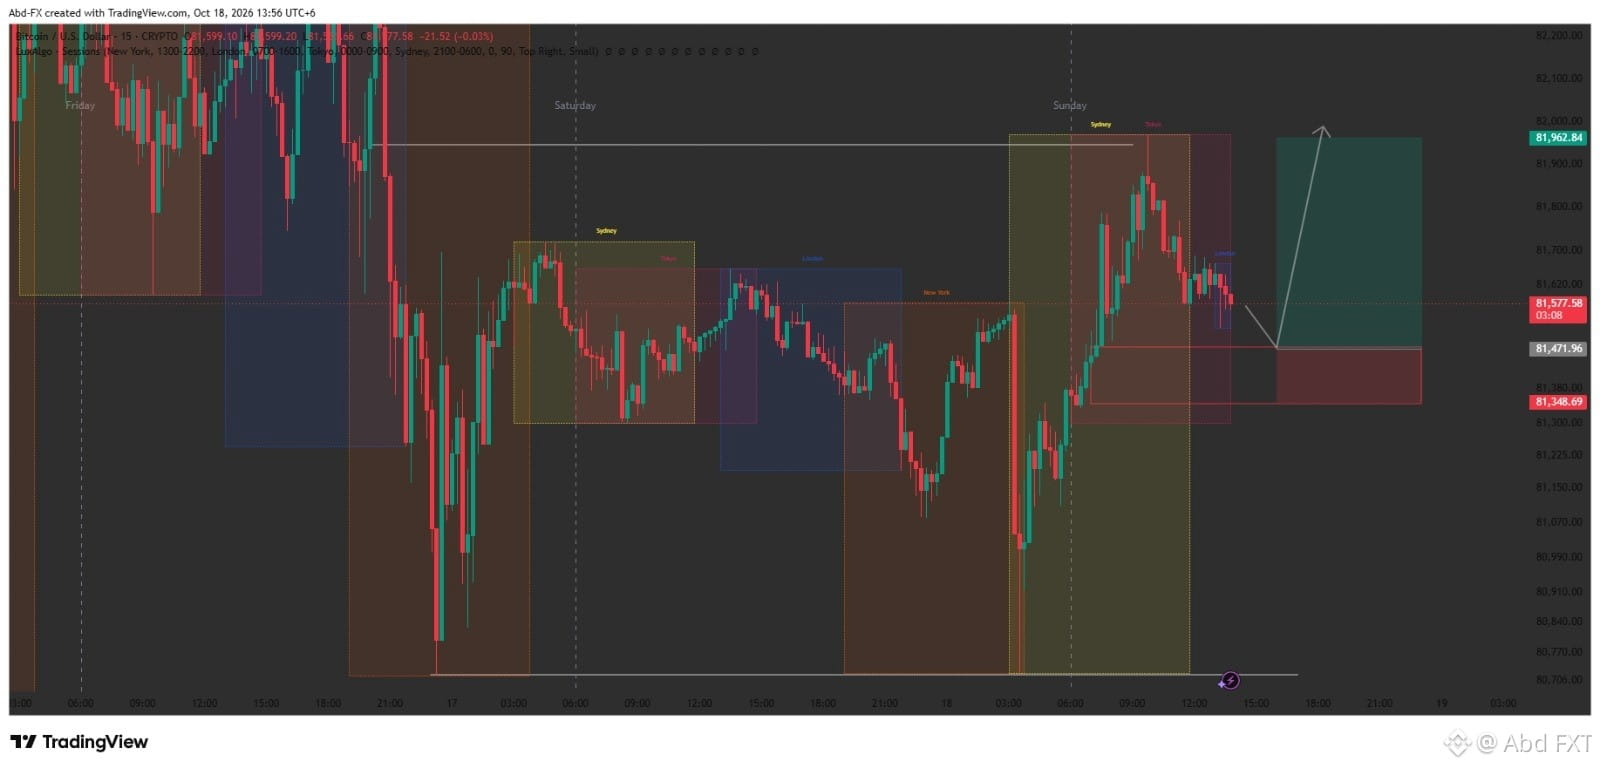
🚀 BTC/USD Short-Term Setup: Potential Long Opportunity Ahead! 📈
Bitcoin (BTC) is currently pulling back towards a key support zone. Based on the current market structure on the 15-minute timeframe, a solid Long (Buy) trade setup is forming! 🎯
📊 Trade Setup Details:
Pair: BTC/USD (15m Chart)
Entry Zone: $81,470 – $81,500
Take Profit (TP): $81,962
Stop Loss (SL): $81,348
💡 Technical Analysis:
Price is currently retracing to test the $81,471 support level. A proper rejection or bullish reaction at this zone could spark a rally toward the $81,960+ target. The Risk-to-Reward ratio is very favorable for a short-term scalp/day trade!
⚠️ Disclaimer: This post is for educational purposes only and not financial advice. Always do your own research (DYOR) and strictly manage your risk.
#BTC #bitcoin #CryptoTrading #TechnicalAnalysis #BinanceSquare
74
·
--
The key difference between Forex and Binary Trading is market mechanics & risk:
🔹 Forex: Real market trading using SL/TP and strategy. Positions can be held as long as needed.
🔹 Binary: Fixed-time option (e.g., 1 min) predicting price direction. High risk, similar to gambling.
Choose Forex/Crypto for long-term growth.
#Forex #BinaryTrading #TradingTips #crypto #BinanceSquare
🔹 Forex: Real market trading using SL/TP and strategy. Positions can be held as long as needed.
🔹 Binary: Fixed-time option (e.g., 1 min) predicting price direction. High risk, similar to gambling.
Choose Forex/Crypto for long-term growth.
#Forex #BinaryTrading #TradingTips #crypto #BinanceSquare
68
·
--
Stock market hocche emon ekta digital platform jekhane public companies tader share buy & sell kore. 📈
When companies need capital to grow their business, tara stock market-e share issue kore funds raise kore. Investors share kine company-r fractional ownership pay.
Company profitable hole share price baare Ebong dividend paowa jay. Downside risk-o thake. It works as the driving force of an economy & financial growth! 🚀💵#StockMarket #trading #Investing #BinanceSquare #ShareMarket #TradingTips #FinancialEducation
46
·
--
Stock market hocche emon ekta digital platform jekhane public companies tader share buy & sell kore. 📈
When companies need capital to grow their business, tara stock market-e share issue kore funds raise kore. Investors share kine company-r fractional ownership pay.
Company profitable hole share price baare Ebong dividend paowa jay. Downside risk-o thake. It works as the driving force of an economy & financial growth! 🚀💵
#stockmarket #Trading #Investing #BinanceSquare #Binance
60
·
--
The Gold Market is a global financial market where gold is traded based on live international rates. Widely recognized as a top Safe-Haven Asset, investors rely on gold during inflation and economic uncertainties to preserve capital.
On Binance, you can trade gold directly via gold-backed tokens like PAXG or speculate on its price action through Futures with leverage. It is an essential asset for hedging risks and portfolio diversification.
#GoldMarket #Binance #PAXG #cryptotrading #SafeHavenMove
On Binance, you can trade gold directly via gold-backed tokens like PAXG or speculate on its price action through Futures with leverage. It is an essential asset for hedging risks and portfolio diversification.
#GoldMarket #Binance #PAXG #cryptotrading #SafeHavenMove
99
·
--
*What is Crypto Market? 🚀*
A digital market where BTC, ETH & other cryptos are traded via blockchain. No banks or central control.
*Key Features:*
✓ 24/7 Trading - never closes
✓ Decentralized - no single entity
✓ High Volatility - risk management is key
It's the future of digital finance! 🔥
#CryptoMarket #BinanceSquare #cryptotrading #blockchain #bitcoin
1
58
·
--
Where Did Forex Trading Come From? From Gold Standard to Digital Market! 📜
We trade on digital screens today, but Forex’s journey actually began with gold! 🪙
Introduced in 1871, the Gold Standard system pegged paper currency value directly to gold. In 1971, the collapse of the Bretton Woods Agreement gave birth to today's free-floating currency era.
By the 1990s, online technology brought Forex right to everyday traders. Today, it stands as the world's largest financial market, reaching over $8 trillion in daily volume! 🚀
#ForexHistory #Trading #BinanceSquare #crypto #FX101
109
·
--
What is Traded in the Forex Market?
Forex is the world's largest market where national currencies are traded in pairs, like EUR/USD or GBP/JPY.
Main Traded Assets:
Currencies: Major, Minor, and Exotic pairs.
Commodities: Gold (XAU), Silver (XAG), and Crude Oil (WTI).
Indices & Stocks: US500, Nasdaq, and top global assets.
Traders profit by predicting price movements based on interest rates, economic data, and news.
#forex #CryptoTrading #Binance #forextrading #TradingBasics #BTC
145
·
--
What is Quote Currency in Crypto Trading?
In trading pairs, there are two parts: Base Currency and Quote Currency.
For example, in BTC/USDT:
BTC is the Base Currency (what you buy).
USDT is the Quote Currency (the price value).
The Quote Currency tells you how much money is needed to buy 1 unit of the Base Currency. If BTC/USDT is $60,000, you need 60,000 USDT to buy 1 BTC.
Common Quote Currencies are USDT, BUSD, and BTC.
#Binance #cryptotrading #QuoteCurrency #CryptoBasics #TradingTips #BTC
53
·
--
What is a Base Currency in trading?
In any currency or crypto pair, like BTC/USDT, the first coin listed (BTC) is your Base Currency.
It is the main asset you are actually buying or selling. The second coin, USDT, is the Quote Currency, which tells you the price.
So, when you buy BTC/USDT on Binance, you give USDT to get BTC. Simply put, Base Currency is what you hold or trade!"
Quick explanation of Base Currency in crypto trading! 🪙📊
#BaseCurrency #BinanceSquare #cryptotrading #LearnCrypto #tradingtips
76
Войдите, чтобы посмотреть больше материала
Присоединяйтесь к пользователям криптовалют по всему миру на Binance Square
⚡️ Получайте новейшую и полезную информацию о криптоактивах.
💬 Нам доверяет крупнейшая в мире криптобиржа.
👍 Получите достоверные аналитические данные от верифицированных создателей контента.
Эл. почта/номер телефона
В тренде
FedWatch
Просмотров: 16.4M
39,634 обсуждают
🚨 🇺🇸 PETER SCHIFF JUST THREW A BIG WARNING AT THE FED!
Peter Schiff is calling Kevin Warsh’s tough talk on inflation a “bluff,” and his prediction could have major implications for the markets.
Schiff believes the Fed could eventually return to money printing through quantitative easing (QE) and even cut interest rates next year, despite inflation continuing to rise.
Think about that for a moment.
🔥 Inflation could remain a problem. 🔥 The Fed could still move toward easier monetary policy. 🔥 More liquidity could flow into financial markets.
If this scenario plays out, it could create a very different market environment for stocks, gold, Bitcoin, and the wider crypto market.
But there’s a catch: if inflation stays high, the Fed could face a difficult choice between fighting rising prices and supporting the economy.
Will Warsh stick to a tough inflation policy, or will the Fed eventually change direction?
The next move could matter a lot for investors.
#FedWatch #EarningsSeason #USMidtermElections #BrazilCryptoExchangesMustApplyForLicensesByFriday #StanDruckenmillerBecomesInvestorInTradeXYZ
Jackson Liam
·Лайков: 4
·Просмотров: 8.8k
EarningsSeason
Просмотров: 6.5M
32,351 обсуждают
USMidtermElections
Просмотров: 57,156
740 обсуждают