
#stablecoinmarketshrinksatfastestpacesinceterraluna
stablecoinmarketshrinksatfastestpacesinceterraluna
Популярные
Новые

·
--
#StablecoinMarketShrinksAtFastestPaceSinceTerraLuna
💸 $12B Gone in 30 Days: Crypto's Dry Powder Is Leaving
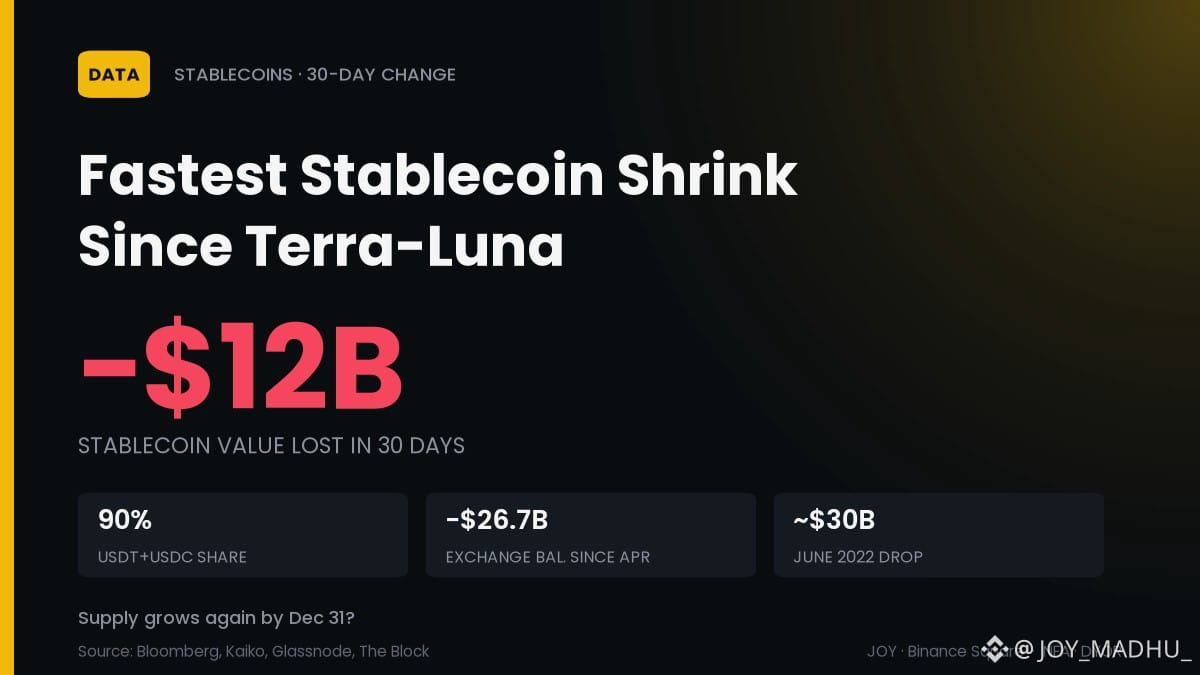
Stablecoins shrink at the fastest pace since Terra-Luna: cash is exiting, not rotating (Bloomberg).
📉 ~$12B lost in 30 days as BTC hit a ~4-month low (Kaiko)
📊 USDT and USDC were 90% of the drop, each down ~4%
🏦 Their exchange balances: -$26.7B since April (Glassnode)
📅 June 2022: ~$30B drop, 5 months before BTC's bottom
My read: renewed supply growth is the first sign of new money.
By Dec 31: does supply grow again, or shrink $10B more? 👇
$BTC $USDC
#StablecoinMarketShrinksAtFastestPaceSinceTerraLuna #Stablecoins #Crypto
#StablecoinMarketShrinksAtFastestPaceSinceTerraLuna
💸 $12B Gone in 30 Days: Crypto's Dry Powder Is Leaving
Stablecoins shrink at the fastest pace since Terra-Luna: cash is exiting, not rotating (Bloomberg).
📉 ~$12B lost in 30 days as BTC hit a ~4-month low (Kaiko)
📊 USDT and USDC were 90% of the drop, each down ~4%
🏦 Their exchange balances: -$26.7B since April (Glassnode)
📅 June 2022: ~$30B drop, 5 months before BTC's bottom
My read: renewed supply growth is the first sign of new money.
By Dec 31: does supply grow again, or shrink $10B more? 👇
$BTC $USDC
#StablecoinMarketShrinksAtFastestPaceSinceTerraLuna #Stablecoins #Crypto
💸 $12B Gone in 30 Days: Crypto's Dry Powder Is Leaving
Stablecoins shrink at the fastest pace since Terra-Luna: cash is exiting, not rotating (Bloomberg).
📉 ~$12B lost in 30 days as BTC hit a ~4-month low (Kaiko)
📊 USDT and USDC were 90% of the drop, each down ~4%
🏦 Their exchange balances: -$26.7B since April (Glassnode)
📅 June 2022: ~$30B drop, 5 months before BTC's bottom
My read: renewed supply growth is the first sign of new money.
By Dec 31: does supply grow again, or shrink $10B more? 👇
$BTC $USDC
#StablecoinMarketShrinksAtFastestPaceSinceTerraLuna #Stablecoins #Crypto
18

·
--
Падение
#stablecoinmarketshrinksatfastestpacesinceterraluna
🚨 RUNNING OUT OF STEAM LIKE DURING TERRA-LUNA? 🚨
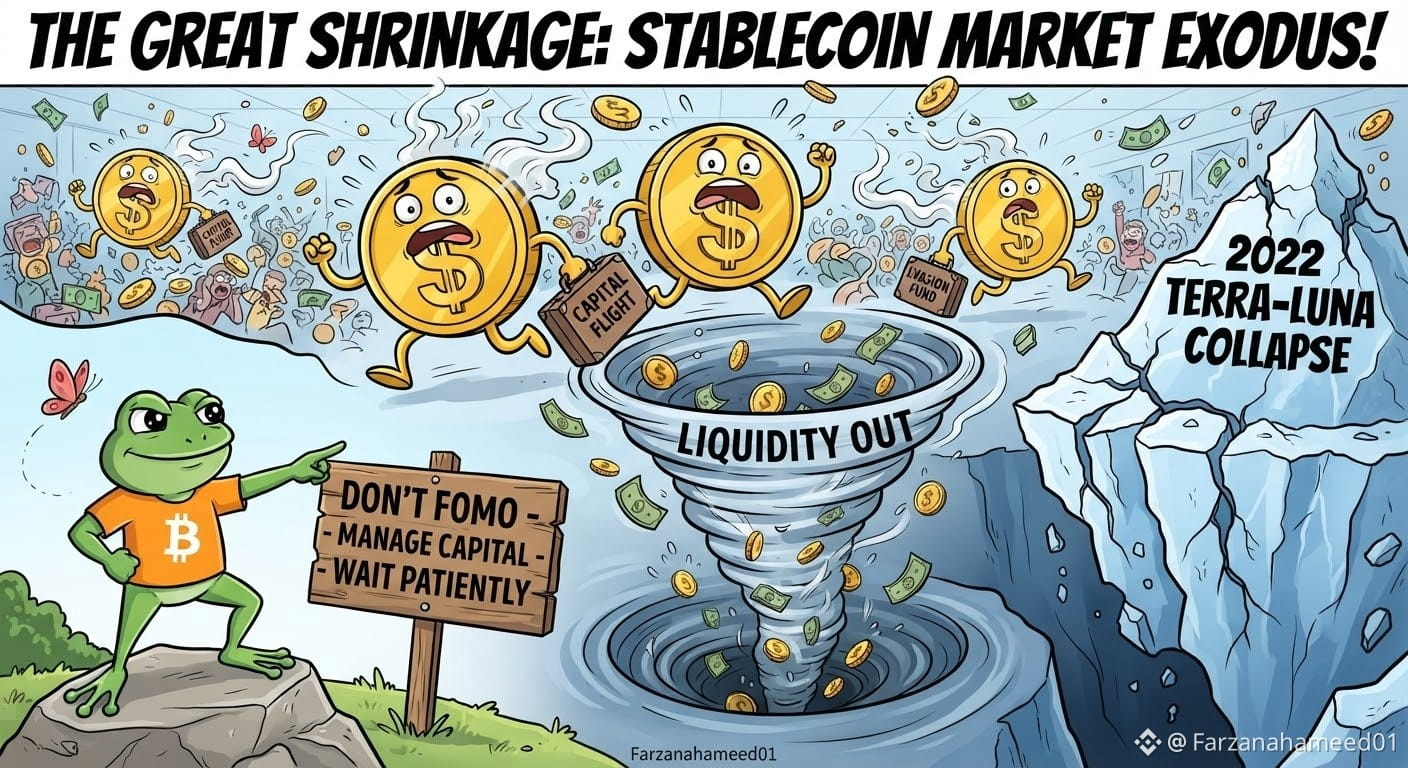
The stablecoin market has just "evaporated" at its fastest pace since the 2022 crash! Instead of seeking shelter in USDT or USDC as before, money is quietly flowing out of the market altogether.
Why? Attractive traditional interest rates, combined with profit-taking pressure, are prompting the "whales" to swap coins for cash and put it in savings accounts for a safer return.
What should traders do now? Don't FOMO into blindly buying the dip! Manage your capital carefully, prioritize liquidity in top coins, and patiently wait for money to flow back in.
⚠️ This is not financial advice.
👇
$BTC - Watch for stablecoin evaporation, strong.
$ETH - Watch for whales to cash, strong.
$EVAA - Watch for liquidity in top coins, strong.
✨𝐅𝐀𝐑𝐙𝐀𝐍𝐀 𝐇𝐀𝐌𝐄𝐄𝐃 𝐎𝐅𝐅𝐈𝐂𝐈𝐀𝐋 • 🦋 ✨
#CryptoMarket #Stablecoins #TradingTips #RiskManagement
#stablecoinmarketshrinksatfastestpacesinceterraluna
🚨 RUNNING OUT OF STEAM LIKE DURING TERRA-LUNA? 🚨
The stablecoin market has just "evaporated" at its fastest pace since the 2022 crash! Instead of seeking shelter in USDT or USDC as before, money is quietly flowing out of the market altogether.
Why? Attractive traditional interest rates, combined with profit-taking pressure, are prompting the "whales" to swap coins for cash and put it in savings accounts for a safer return.
What should traders do now? Don't FOMO into blindly buying the dip! Manage your capital carefully, prioritize liquidity in top coins, and patiently wait for money to flow back in.
⚠️ This is not financial advice.
👇
$BTC - Watch for stablecoin evaporation, strong.
$ETH - Watch for whales to cash, strong.
$EVAA - Watch for liquidity in top coins, strong.
✨𝐅𝐀𝐑𝐙𝐀𝐍𝐀 𝐇𝐀𝐌𝐄𝐄𝐃 𝐎𝐅𝐅𝐈𝐂𝐈𝐀𝐋 • 🦋 ✨
#CryptoMarket #Stablecoins #TradingTips #RiskManagement
🚨 RUNNING OUT OF STEAM LIKE DURING TERRA-LUNA? 🚨
The stablecoin market has just "evaporated" at its fastest pace since the 2022 crash! Instead of seeking shelter in USDT or USDC as before, money is quietly flowing out of the market altogether.
Why? Attractive traditional interest rates, combined with profit-taking pressure, are prompting the "whales" to swap coins for cash and put it in savings accounts for a safer return.
What should traders do now? Don't FOMO into blindly buying the dip! Manage your capital carefully, prioritize liquidity in top coins, and patiently wait for money to flow back in.
⚠️ This is not financial advice.
👇
$BTC - Watch for stablecoin evaporation, strong.
$ETH - Watch for whales to cash, strong.
$EVAA - Watch for liquidity in top coins, strong.
✨𝐅𝐀𝐑𝐙𝐀𝐍𝐀 𝐇𝐀𝐌𝐄𝐄𝐃 𝐎𝐅𝐅𝐈𝐂𝐈𝐀𝐋 • 🦋 ✨
#CryptoMarket #Stablecoins #TradingTips #RiskManagement
Vinhtocdo:
Báo hiệu thị trường bán tháo hay là đáy rồi? $BLESS
1
5
574

·
--
Статья
💵📉 Stablecoin Market Shrinks at Its Fastest Pace Since Terra-Luna: Should Crypto Investors Worry?#CypherpunkReports$306MQ3NetProfit
Stablecoins are the cash of the crypto world, so when their supply falls, traders pay attention. 👀 The market has just posted its sharpest contraction since the **Terra-Luna collapse of 2022**. 🚨 This guide explains what the data shows, what it does and doesn't mean, and what to watch next. 🧠
## 📊 What the Numbers Say
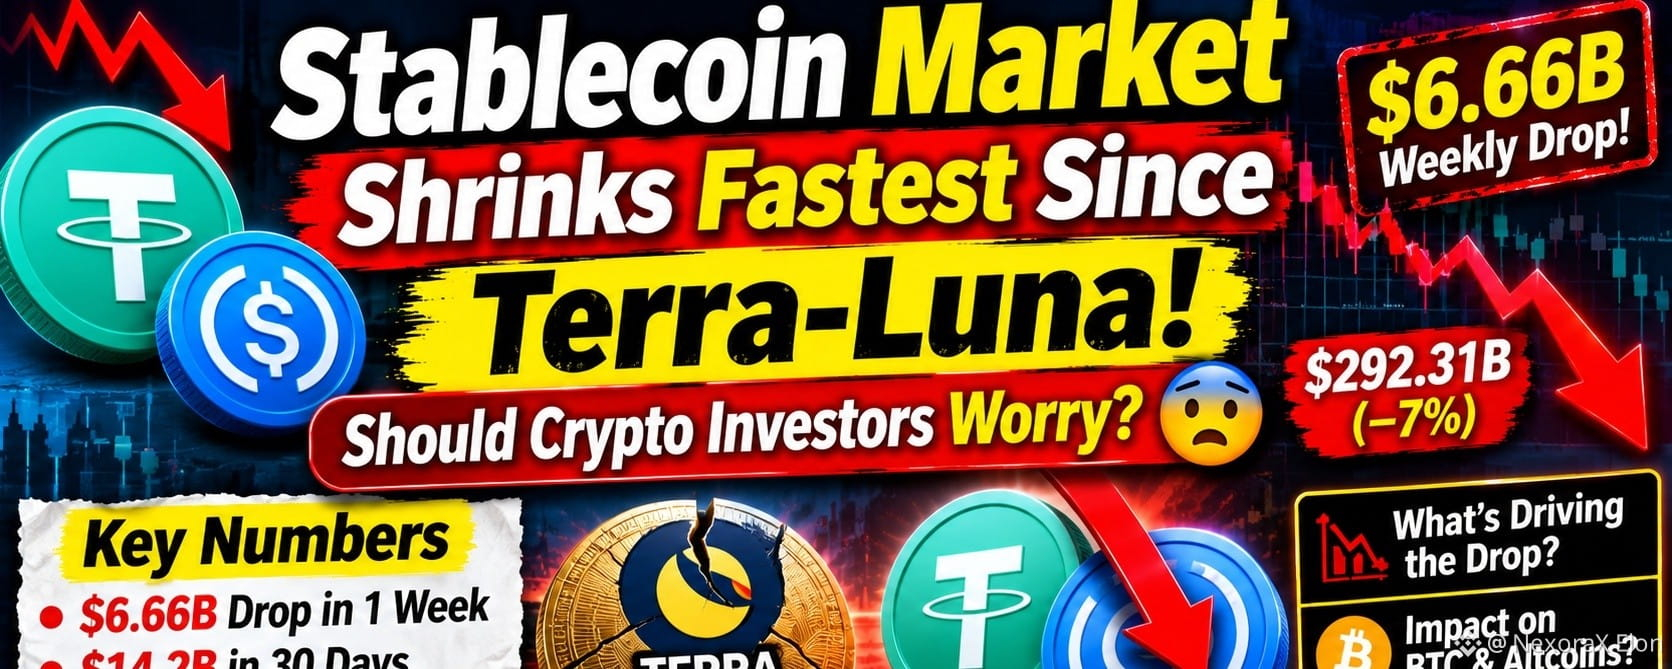
- 📆 **Biggest weekly drop of 2026:** Stablecoin supply fell **$6.66 billion** in the seven days to November 7, to about **$292.31 billion**, according to DefiLlama data. Some reports call it the deepest weekly drop since the week UST collapsed in May 2022. 😮
- 🗓️ **30-day contraction:** Glassnode reported that supply fell **$14.2 billion** over the 30 days to November 10, the largest monthly decline since June 2022.
- 🏔️ **From the peak:** Supply reached about **$315.5 billion on May 17, 2026**. It has since fallen by roughly **$21–23 billion, or about 7%**.
- 🪙 **USDT and USDC lead the drop:** In the week to November 7, USDT fell about **$3.1 billion** to around $177 billion, and USDC fell about **$1.3 billion** to around $70.6 billion. Together they make up roughly 85–88% of the market. 🏦
## ✅ Both Major Coins Kept Their Peg
This is not a Terra-style panic. 🛡️ Neither USDT nor USDC lost its dollar peg. On November 8, USDT traded at about $0.9989 and USDC at about $0.9995. 💵 The shrinkage comes from **redemptions** (people cashing out), not from a failure of the coins. 💡
## 🆚 How Does It Compare With 2022?
The headline is accurate on **pace**, but **not on scale**. ⚖️
- 🌋 **2022:** Terra-Luna, FTX, Celsius and BlockFi wiped out about **26%** of the stablecoin market (roughly $166B down to $122B). The TerraUSD collapse alone erased about $18B.
- 📉 **June 2022** saw a 30-day stablecoin supply drop of nearly **$30 billion**.
- 📉 **Today:** The decline is about **7%** from the peak. It is large, but far smaller than the 2022 crash. 🙌
So "fastest since Terra" is true for some recent measures, but there is no sign of a systemic collapse. 🧩
## 🔎 Why Is Supply Falling?
Analysts point to several factors: 🕵️
1. 💸 **Cash leaving crypto.** Santiment notes that a falling stablecoin market cap suggests many investors are cashing out to fiat instead of preparing to buy dips.
2. 📉 **A weak Bitcoin market.** BTC is trading around $64,000–$65,000, so traders have less appetite to keep dry powder on exchanges.
3. 🏛️ **Regulation.** Earlier reporting linked the 2026 decline partly to MiCA enforcement and regulatory pressure in some markets.
4. 🔄 **Competition and rotation.** Newer regulated stablecoins such as USDG and Open USD (backed by firms including Visa, Stripe, Mastercard and BlackRock, launched June 30) are taking some share from the USDT and USDC duopoly.
5. 🧾 **Reduced on-chain liquidity** as the market cools.
## 🤔 Why Does It Matter for Bitcoin and Altcoins?
Stablecoins are the **fuel** for crypto trading. ⛽ When supply grows, there is more buying power ready to enter the market. When it shrinks, there is less. Analysts flagged that shrinking supply could mean **less buying power for a rebound**. 📉
Shrinking supply can also hurt DeFi. 🏗️ Lending slows, yields can fall, and protocol activity can drop, which weakens recovery momentum.
## 🐂 The Optimistic Case
Not everyone is alarmed. 🌈
- 📈 **Transaction volume stayed strong.** Adjusted stablecoin transaction volume hit a record **$1.79 trillion in June 2026**, even as market cap fell. The "pipes" are working harder than ever.
- 🌍 **Long-term growth trend.** One analyst called an earlier decline "a relatively small pullback in a long-term growth market."
- 🔁 **Supply rotation.** Some funds are moving to newer stablecoins, so not all supply is simply disappearing.
## 🐻 The Cautious Case
- 🔻 The contraction is **accelerating**, with early November the steepest stretch of the year.
- 💔 **Capital leaving** can mean fewer buyers when prices fall.
- 🏦 **High concentration risk:** USDT holds roughly 63% of supply and USDC about 25%, so large moves in those two shape the whole market.
## 🔭 What to Watch Next
- 📈 **A reading above $300 billion** would end the current 10-day decline, according to DefiLlama-based reporting.
- 📉 **A reading below $291.68 billion** would set a new 2026 low. 🔻
- 🪙 **USDT and USDC redemptions** in the coming weeks.
- 🏛️ **Regulatory news** in the US and Europe.
- 📊 **Bitcoin's price action**, since stablecoin flows and BTC often move together. 🔗
## 🛡️ Smart Tips for Investors
1. 🧠 **Watch the trend, not one number.** A single weekly drop doesn't define a bear market.
2. 🪙 **Spread your stablecoin risk** across more than one reputable issuer and avoid keeping everything in one place.
3. 🔐 **Prefer self-custody or trusted platforms** for large balances, and understand how each coin is backed.
4. ⚖️ **Manage leverage carefully** in a fragile market.
5. 📰 **Verify claims.** Dramatic headlines can mix up pace and scale. Check the data on DefiLlama, Glassnode or similar trackers.
## 🎯 Final Thoughts
The stablecoin market is shrinking at a pace not seen since 2022, and that is a real warning sign for crypto liquidity. 🚨 But there is **no depeg, no collapse and no Terra-style crisis**, and the current drop is about 7% from the peak, not 26%. 🌤️ The real question is whether cash is merely resting on the sidelines or leaving the market for good. Stay informed, stay diversified and avoid panic decisions. 💪📊
*⚠️
#XRPFallsTo$0.89LowestSinceNovember2024 #BitcoinExtendsLosingStreakToSixWeeks #StablecoinMarketShrinksAtFastestPaceSinceTerraLuna #OPTIMJACKAttackInfectsAtLeast186Websites
**:** #Stablecoins #USDT #USDC #CryptoMarket #TerraLuna
*
💵📉 Stablecoin Market Shrinks at Its Fastest Pace Since Terra-Luna: Should Crypto Investors Worry?
#CypherpunkReports$306MQ3NetProfit
Stablecoins are the cash of the crypto world, so when their supply falls, traders pay attention. 👀 The market has just posted its sharpest contraction since the **Terra-Luna collapse of 2022**. 🚨 This guide explains what the data shows, what it does and doesn't mean, and what to watch next. 🧠
## 📊 What the Numbers Say
- 📆 **Biggest weekly drop of 2026:** Stablecoin supply fell **$6.66 billion** in the seven days to November 7, to about **$292.31 billion**, according to DefiLlama data. Some reports call it the deepest weekly drop since the week UST collapsed in May 2022. 😮
- 🗓️ **30-day contraction:** Glassnode reported that supply fell **$14.2 billion** over the 30 days to November 10, the largest monthly decline since June 2022.
- 🏔️ **From the peak:** Supply reached about **$315.5 billion on May 17, 2026**. It has since fallen by roughly **$21–23 billion, or about 7%**.
- 🪙 **USDT and USDC lead the drop:** In the week to November 7, USDT fell about **$3.1 billion** to around $177 billion, and USDC fell about **$1.3 billion** to around $70.6 billion. Together they make up roughly 85–88% of the market. 🏦
## ✅ Both Major Coins Kept Their Peg
This is not a Terra-style panic. 🛡️ Neither USDT nor USDC lost its dollar peg. On November 8, USDT traded at about $0.9989 and USDC at about $0.9995. 💵 The shrinkage comes from **redemptions** (people cashing out), not from a failure of the coins. 💡
## 🆚 How Does It Compare With 2022?
The headline is accurate on **pace**, but **not on scale**. ⚖️
- 🌋 **2022:** Terra-Luna, FTX, Celsius and BlockFi wiped out about **26%** of the stablecoin market (roughly $166B down to $122B). The TerraUSD collapse alone erased about $18B.
- 📉 **June 2022** saw a 30-day stablecoin supply drop of nearly **$30 billion**.
- 📉 **Today:** The decline is about **7%** from the peak. It is large, but far smaller than the 2022 crash. 🙌
So "fastest since Terra" is true for some recent measures, but there is no sign of a systemic collapse. 🧩
## 🔎 Why Is Supply Falling?
Analysts point to several factors: 🕵️
1. 💸 **Cash leaving crypto.** Santiment notes that a falling stablecoin market cap suggests many investors are cashing out to fiat instead of preparing to buy dips.
2. 📉 **A weak Bitcoin market.** BTC is trading around $64,000–$65,000, so traders have less appetite to keep dry powder on exchanges.
3. 🏛️ **Regulation.** Earlier reporting linked the 2026 decline partly to MiCA enforcement and regulatory pressure in some markets.
4. 🔄 **Competition and rotation.** Newer regulated stablecoins such as USDG and Open USD (backed by firms including Visa, Stripe, Mastercard and BlackRock, launched June 30) are taking some share from the USDT and USDC duopoly.
5. 🧾 **Reduced on-chain liquidity** as the market cools.
## 🤔 Why Does It Matter for Bitcoin and Altcoins?
Stablecoins are the **fuel** for crypto trading. ⛽ When supply grows, there is more buying power ready to enter the market. When it shrinks, there is less. Analysts flagged that shrinking supply could mean **less buying power for a rebound**. 📉
Shrinking supply can also hurt DeFi. 🏗️ Lending slows, yields can fall, and protocol activity can drop, which weakens recovery momentum.
## 🐂 The Optimistic Case
Not everyone is alarmed. 🌈
- 📈 **Transaction volume stayed strong.** Adjusted stablecoin transaction volume hit a record **$1.79 trillion in June 2026**, even as market cap fell. The "pipes" are working harder than ever.
- 🌍 **Long-term growth trend.** One analyst called an earlier decline "a relatively small pullback in a long-term growth market."
- 🔁 **Supply rotation.** Some funds are moving to newer stablecoins, so not all supply is simply disappearing.
## 🐻 The Cautious Case
- 🔻 The contraction is **accelerating**, with early November the steepest stretch of the year.
- 💔 **Capital leaving** can mean fewer buyers when prices fall.
- 🏦 **High concentration risk:** USDT holds roughly 63% of supply and USDC about 25%, so large moves in those two shape the whole market.
## 🔭 What to Watch Next
- 📈 **A reading above $300 billion** would end the current 10-day decline, according to DefiLlama-based reporting.
- 📉 **A reading below $291.68 billion** would set a new 2026 low. 🔻
- 🪙 **USDT and USDC redemptions** in the coming weeks.
- 🏛️ **Regulatory news** in the US and Europe.
- 📊 **Bitcoin's price action**, since stablecoin flows and BTC often move together. 🔗
## 🛡️ Smart Tips for Investors
1. 🧠 **Watch the trend, not one number.** A single weekly drop doesn't define a bear market.
2. 🪙 **Spread your stablecoin risk** across more than one reputable issuer and avoid keeping everything in one place.
3. 🔐 **Prefer self-custody or trusted platforms** for large balances, and understand how each coin is backed.
4. ⚖️ **Manage leverage carefully** in a fragile market.
5. 📰 **Verify claims.** Dramatic headlines can mix up pace and scale. Check the data on DefiLlama, Glassnode or similar trackers.
## 🎯 Final Thoughts
The stablecoin market is shrinking at a pace not seen since 2022, and that is a real warning sign for crypto liquidity. 🚨 But there is **no depeg, no collapse and no Terra-style crisis**, and the current drop is about 7% from the peak, not 26%. 🌤️ The real question is whether cash is merely resting on the sidelines or leaving the market for good. Stay informed, stay diversified and avoid panic decisions. 💪📊
*⚠️
#XRPFallsTo$0.89LowestSinceNovember2024 #BitcoinExtendsLosingStreakToSixWeeks #StablecoinMarketShrinksAtFastestPaceSinceTerraLuna #OPTIMJACKAttackInfectsAtLeast186Websites
**:** #Stablecoins #USDT #USDC #CryptoMarket #TerraLuna
*
Stablecoins are the cash of the crypto world, so when their supply falls, traders pay attention. 👀 The market has just posted its sharpest contraction since the **Terra-Luna collapse of 2022**. 🚨 This guide explains what the data shows, what it does and doesn't mean, and what to watch next. 🧠
## 📊 What the Numbers Say
- 📆 **Biggest weekly drop of 2026:** Stablecoin supply fell **$6.66 billion** in the seven days to November 7, to about **$292.31 billion**, according to DefiLlama data. Some reports call it the deepest weekly drop since the week UST collapsed in May 2022. 😮
- 🗓️ **30-day contraction:** Glassnode reported that supply fell **$14.2 billion** over the 30 days to November 10, the largest monthly decline since June 2022.
- 🏔️ **From the peak:** Supply reached about **$315.5 billion on May 17, 2026**. It has since fallen by roughly **$21–23 billion, or about 7%**.
- 🪙 **USDT and USDC lead the drop:** In the week to November 7, USDT fell about **$3.1 billion** to around $177 billion, and USDC fell about **$1.3 billion** to around $70.6 billion. Together they make up roughly 85–88% of the market. 🏦
## ✅ Both Major Coins Kept Their Peg
This is not a Terra-style panic. 🛡️ Neither USDT nor USDC lost its dollar peg. On November 8, USDT traded at about $0.9989 and USDC at about $0.9995. 💵 The shrinkage comes from **redemptions** (people cashing out), not from a failure of the coins. 💡
## 🆚 How Does It Compare With 2022?
The headline is accurate on **pace**, but **not on scale**. ⚖️
- 🌋 **2022:** Terra-Luna, FTX, Celsius and BlockFi wiped out about **26%** of the stablecoin market (roughly $166B down to $122B). The TerraUSD collapse alone erased about $18B.
- 📉 **June 2022** saw a 30-day stablecoin supply drop of nearly **$30 billion**.
- 📉 **Today:** The decline is about **7%** from the peak. It is large, but far smaller than the 2022 crash. 🙌
So "fastest since Terra" is true for some recent measures, but there is no sign of a systemic collapse. 🧩
## 🔎 Why Is Supply Falling?
Analysts point to several factors: 🕵️
1. 💸 **Cash leaving crypto.** Santiment notes that a falling stablecoin market cap suggests many investors are cashing out to fiat instead of preparing to buy dips.
2. 📉 **A weak Bitcoin market.** BTC is trading around $64,000–$65,000, so traders have less appetite to keep dry powder on exchanges.
3. 🏛️ **Regulation.** Earlier reporting linked the 2026 decline partly to MiCA enforcement and regulatory pressure in some markets.
4. 🔄 **Competition and rotation.** Newer regulated stablecoins such as USDG and Open USD (backed by firms including Visa, Stripe, Mastercard and BlackRock, launched June 30) are taking some share from the USDT and USDC duopoly.
5. 🧾 **Reduced on-chain liquidity** as the market cools.
## 🤔 Why Does It Matter for Bitcoin and Altcoins?
Stablecoins are the **fuel** for crypto trading. ⛽ When supply grows, there is more buying power ready to enter the market. When it shrinks, there is less. Analysts flagged that shrinking supply could mean **less buying power for a rebound**. 📉
Shrinking supply can also hurt DeFi. 🏗️ Lending slows, yields can fall, and protocol activity can drop, which weakens recovery momentum.
## 🐂 The Optimistic Case
Not everyone is alarmed. 🌈
- 📈 **Transaction volume stayed strong.** Adjusted stablecoin transaction volume hit a record **$1.79 trillion in June 2026**, even as market cap fell. The "pipes" are working harder than ever.
- 🌍 **Long-term growth trend.** One analyst called an earlier decline "a relatively small pullback in a long-term growth market."
- 🔁 **Supply rotation.** Some funds are moving to newer stablecoins, so not all supply is simply disappearing.
## 🐻 The Cautious Case
- 🔻 The contraction is **accelerating**, with early November the steepest stretch of the year.
- 💔 **Capital leaving** can mean fewer buyers when prices fall.
- 🏦 **High concentration risk:** USDT holds roughly 63% of supply and USDC about 25%, so large moves in those two shape the whole market.
## 🔭 What to Watch Next
- 📈 **A reading above $300 billion** would end the current 10-day decline, according to DefiLlama-based reporting.
- 📉 **A reading below $291.68 billion** would set a new 2026 low. 🔻
- 🪙 **USDT and USDC redemptions** in the coming weeks.
- 🏛️ **Regulatory news** in the US and Europe.
- 📊 **Bitcoin's price action**, since stablecoin flows and BTC often move together. 🔗
## 🛡️ Smart Tips for Investors
1. 🧠 **Watch the trend, not one number.** A single weekly drop doesn't define a bear market.
2. 🪙 **Spread your stablecoin risk** across more than one reputable issuer and avoid keeping everything in one place.
3. 🔐 **Prefer self-custody or trusted platforms** for large balances, and understand how each coin is backed.
4. ⚖️ **Manage leverage carefully** in a fragile market.
5. 📰 **Verify claims.** Dramatic headlines can mix up pace and scale. Check the data on DefiLlama, Glassnode or similar trackers.
## 🎯 Final Thoughts
The stablecoin market is shrinking at a pace not seen since 2022, and that is a real warning sign for crypto liquidity. 🚨 But there is **no depeg, no collapse and no Terra-style crisis**, and the current drop is about 7% from the peak, not 26%. 🌤️ The real question is whether cash is merely resting on the sidelines or leaving the market for good. Stay informed, stay diversified and avoid panic decisions. 💪📊
*⚠️
#XRPFallsTo$0.89LowestSinceNovember2024 #BitcoinExtendsLosingStreakToSixWeeks #StablecoinMarketShrinksAtFastestPaceSinceTerraLuna #OPTIMJACKAttackInfectsAtLeast186Websites
**:** #Stablecoins #USDT #USDC #CryptoMarket #TerraLuna
*
1
83

·
--
Падение
#stablecoinmarketshrinksatfastestpacesinceterraluna
🚨 HỤT HƠI NHƯ THỜI TERRA-LUNA? 🚨
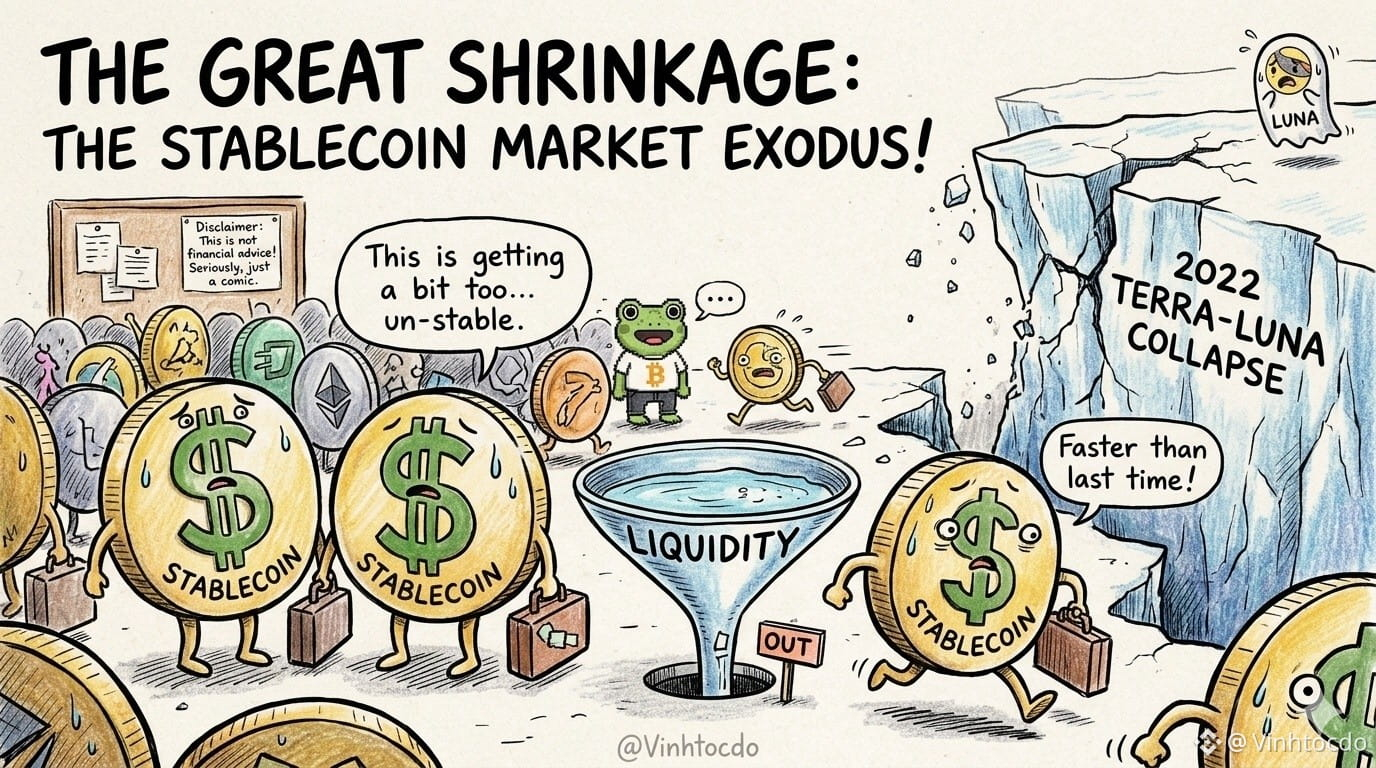
Thị trường stablecoin vừa "bốc hơi" với tốc độ nhanh nhất kể từ cú sập năm 2022! Thay vì trú ẩn bằng USDT hay USDC như trước, dòng tiền đang lặng lẽ rút hẳn khỏi thị trường.
Tại sao? Lãi suất truyền thống hấp dẫn kết hợp áp lực chốt lời khiến các "cá mập" đổi coin sang tiền mặt để gửi tiết kiệm cho lành.
Trader làm gì lúc này? Đừng FOMO bắt đáy mù quáng! Hãy quản lý vốn chặt, ưu tiên giữ thanh khoản ở các đồng top và kiên nhẫn chờ dòng tiền quay lại.
⚠️ Đây không phải lời khuyên tài chính.
👇 Click giao dịch bên dưới để ủng hộ tôi:
$BTC
{spot}(BTCUSDT)
$ETH
{spot}(ETHUSDT)
$EVAA
{future}(EVAAUSDT)
#CryptoMarket #Stablecoins #TradingTips #BinanceSquare #RiskManagement #VINHTOCDO
#stablecoinmarketshrinksatfastestpacesinceterraluna
🚨 HỤT HƠI NHƯ THỜI TERRA-LUNA? 🚨
Thị trường stablecoin vừa "bốc hơi" với tốc độ nhanh nhất kể từ cú sập năm 2022! Thay vì trú ẩn bằng USDT hay USDC như trước, dòng tiền đang lặng lẽ rút hẳn khỏi thị trường.
Tại sao? Lãi suất truyền thống hấp dẫn kết hợp áp lực chốt lời khiến các "cá mập" đổi coin sang tiền mặt để gửi tiết kiệm cho lành.
Trader làm gì lúc này? Đừng FOMO bắt đáy mù quáng! Hãy quản lý vốn chặt, ưu tiên giữ thanh khoản ở các đồng top và kiên nhẫn chờ dòng tiền quay lại.
⚠️ Đây không phải lời khuyên tài chính.
👇 Click giao dịch bên dưới để ủng hộ tôi:
$BTC
$ETH
$EVAA
#CryptoMarket #Stablecoins #TradingTips #BinanceSquare #RiskManagement #VINHTOCDO
🚨 HỤT HƠI NHƯ THỜI TERRA-LUNA? 🚨
Thị trường stablecoin vừa "bốc hơi" với tốc độ nhanh nhất kể từ cú sập năm 2022! Thay vì trú ẩn bằng USDT hay USDC như trước, dòng tiền đang lặng lẽ rút hẳn khỏi thị trường.
Tại sao? Lãi suất truyền thống hấp dẫn kết hợp áp lực chốt lời khiến các "cá mập" đổi coin sang tiền mặt để gửi tiết kiệm cho lành.
Trader làm gì lúc này? Đừng FOMO bắt đáy mù quáng! Hãy quản lý vốn chặt, ưu tiên giữ thanh khoản ở các đồng top và kiên nhẫn chờ dòng tiền quay lại.
⚠️ Đây không phải lời khuyên tài chính.
👇 Click giao dịch bên dưới để ủng hộ tôi:
$BTC
$ETH
$EVAA
#CryptoMarket #Stablecoins #TradingTips #BinanceSquare #RiskManagement #VINHTOCDO
Crypto_ ramos:
$TLM me sacará de la pobreza
3
4
6.3k


·
--
$AKE USDT is showing signs of a recovery, but one important resistance level could decide its next move.
AKE is trading around $0.010205, up 7.59%, after bouncing strongly from the $0.009733 low. Buyers have stepped in after a clear period of selling pressure, pushing price back above the $0.0100 zone.
Here’s what I’m watching:
Key Support: $0.01012 – $0.00990
Major Support: $0.009733
Immediate Resistance: $0.01034
Next Resistance: $0.01056 – $0.01078
The 15-minute chart shows a strong recovery candle, but sellers have already reacted around the $0.01030–$0.01034 area. The latest pullback makes this level even more important.
Bullish Scenario: If buyers defend $0.01012 and reclaim $0.01034, AKE could attempt another move toward $0.01056, followed by $0.01078.
Bearish Scenario: If price loses $0.01012, the recovery could weaken and open the door toward $0.00990 and potentially $0.009733.
Volume is already notable, with 24-hour trading volume around 179.39M USDT. That makes this move worth watching, but confirmation is still needed.
I'm not chasing the green candles here. I want to see buyers hold support and break resistance with strength.
The big question: Is AKE preparing for another leg up, or will sellers reject this recovery again?
Cash is a position. Let the market confirm first.
$ZEC $LAB
#AnthropicIPOTestsInvestorAppetiteForAI #BitcoinExtendsLosingStreakToSixWeeks #StablecoinMarketShrinksAtFastestPaceSinceTerraLuna #OPTIMJACKAttackInfectsAtLeast186Websites
$AKE USDT is showing signs of a recovery, but one important resistance level could decide its next move.
AKE is trading around $0.010205, up 7.59%, after bouncing strongly from the $0.009733 low. Buyers have stepped in after a clear period of selling pressure, pushing price back above the $0.0100 zone.
Here’s what I’m watching:
Key Support: $0.01012 – $0.00990
Major Support: $0.009733
Immediate Resistance: $0.01034
Next Resistance: $0.01056 – $0.01078
The 15-minute chart shows a strong recovery candle, but sellers have already reacted around the $0.01030–$0.01034 area. The latest pullback makes this level even more important.
Bullish Scenario: If buyers defend $0.01012 and reclaim $0.01034, AKE could attempt another move toward $0.01056, followed by $0.01078.
Bearish Scenario: If price loses $0.01012, the recovery could weaken and open the door toward $0.00990 and potentially $0.009733.
Volume is already notable, with 24-hour trading volume around 179.39M USDT. That makes this move worth watching, but confirmation is still needed.
I'm not chasing the green candles here. I want to see buyers hold support and break resistance with strength.
The big question: Is AKE preparing for another leg up, or will sellers reject this recovery again?
Cash is a position. Let the market confirm first.
$ZEC $LAB
#AnthropicIPOTestsInvestorAppetiteForAI #BitcoinExtendsLosingStreakToSixWeeks #StablecoinMarketShrinksAtFastestPaceSinceTerraLuna #OPTIMJACKAttackInfectsAtLeast186Websites
AKE is trading around $0.010205, up 7.59%, after bouncing strongly from the $0.009733 low. Buyers have stepped in after a clear period of selling pressure, pushing price back above the $0.0100 zone.
Here’s what I’m watching:
Key Support: $0.01012 – $0.00990
Major Support: $0.009733
Immediate Resistance: $0.01034
Next Resistance: $0.01056 – $0.01078
The 15-minute chart shows a strong recovery candle, but sellers have already reacted around the $0.01030–$0.01034 area. The latest pullback makes this level even more important.
Bullish Scenario: If buyers defend $0.01012 and reclaim $0.01034, AKE could attempt another move toward $0.01056, followed by $0.01078.
Bearish Scenario: If price loses $0.01012, the recovery could weaken and open the door toward $0.00990 and potentially $0.009733.
Volume is already notable, with 24-hour trading volume around 179.39M USDT. That makes this move worth watching, but confirmation is still needed.
I'm not chasing the green candles here. I want to see buyers hold support and break resistance with strength.
The big question: Is AKE preparing for another leg up, or will sellers reject this recovery again?
Cash is a position. Let the market confirm first.
$ZEC $LAB
#AnthropicIPOTestsInvestorAppetiteForAI #BitcoinExtendsLosingStreakToSixWeeks #StablecoinMarketShrinksAtFastestPaceSinceTerraLuna #OPTIMJACKAttackInfectsAtLeast186Websites
LONG
SHORT
22 ч. осталось
1
698


·
--
Рост
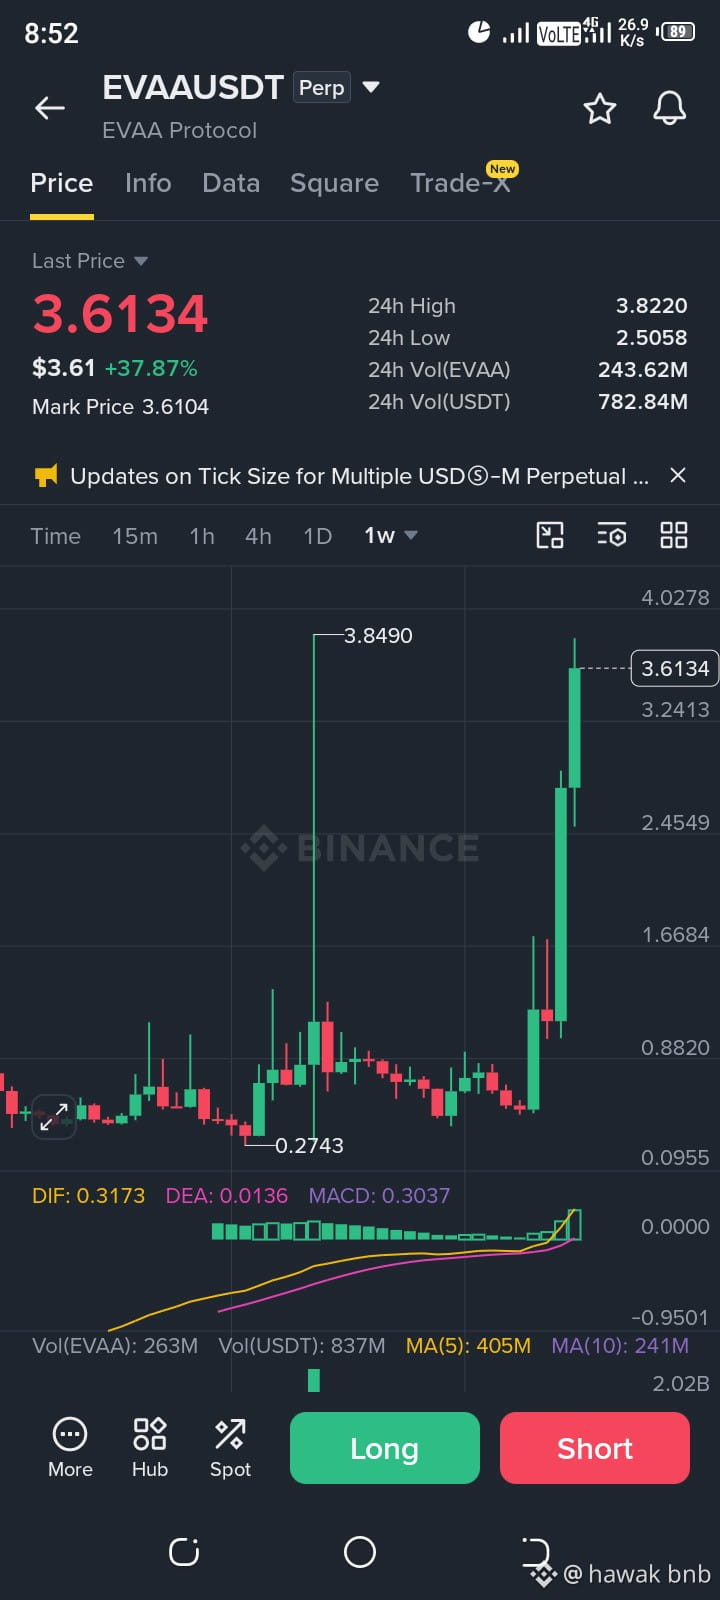
EVAA/USDT Technical Analysis
The 1-week (1W) chart for EVAA/USDT Perpetual on Binance reflects a high-momentum breakout and an explosive bullish trend. Currently trading at $3.6134, the asset has posted an impressive daily gain of +37.87%, continuing a broader macro expansion from its significant historical lows.
Price Action & Volatility
The weekly timeframe showcases immense price expansion following a prolonged consolidation phase above the $0.2743 major swing low. The token recently reached a 24-hour high of $3.8220 (with historical wicks touching up to $3.8490) before facing mild resistance near the $4.00 psychological barrier. The 24-hour low is marked at $2.5058, demonstrating strong underlying bid support that quickly absorbed selling pressure during intraday pullbacks.
Volume & Liquidity
Market participation is exceptionally robust, backed by a 24-hour trading volume of 243.62M EVAA and 782.84M USDT. This massive surge in capital influx validates the bullish continuation pattern, indicating that institutional and retail interest is heavily skewed toward momentum accumulation.
Momentum & Indicators
MACD: The Moving Average Convergence Divergence indicator reveals powerful bullish momentum. The DIF line (0.3173) is situated significantly above the DEA line (0.0136), accompanied by expanding green histogram bars (MACD: 0.3037), signaling strong trend continuation without immediate signs of macro exhaustion.
Moving Averages & Support/Resistance: Immediate support is established around the $3.2413 and $2.4549 structural levels. A sustained hold above these zones will likely pave the way for a retest of the $3.8490 resistance, with a clean breakout targeting price discovery above $4.0278.
@Square-Creator-d9bc6d489341a #EVAAUSDT🔻 $EVAA #WhatInvestmentSignalsDo13FFilingsReveal? #StablecoinMarketShrinksAtFastestPaceSinceTerraLuna
{future}(EVAAUSDT)
#AnthropicIPOTestsInvestorAppetiteForAI #NvidiaBoardNotConsideringHuang’sReturnasCEO
EVAA/USDT Technical Analysis
The 1-week (1W) chart for EVAA/USDT Perpetual on Binance reflects a high-momentum breakout and an explosive bullish trend. Currently trading at $3.6134, the asset has posted an impressive daily gain of +37.87%, continuing a broader macro expansion from its significant historical lows.
Price Action & Volatility
The weekly timeframe showcases immense price expansion following a prolonged consolidation phase above the $0.2743 major swing low. The token recently reached a 24-hour high of $3.8220 (with historical wicks touching up to $3.8490) before facing mild resistance near the $4.00 psychological barrier. The 24-hour low is marked at $2.5058, demonstrating strong underlying bid support that quickly absorbed selling pressure during intraday pullbacks.
Volume & Liquidity
Market participation is exceptionally robust, backed by a 24-hour trading volume of 243.62M EVAA and 782.84M USDT. This massive surge in capital influx validates the bullish continuation pattern, indicating that institutional and retail interest is heavily skewed toward momentum accumulation.
Momentum & Indicators
MACD: The Moving Average Convergence Divergence indicator reveals powerful bullish momentum. The DIF line (0.3173) is situated significantly above the DEA line (0.0136), accompanied by expanding green histogram bars (MACD: 0.3037), signaling strong trend continuation without immediate signs of macro exhaustion.
Moving Averages & Support/Resistance: Immediate support is established around the $3.2413 and $2.4549 structural levels. A sustained hold above these zones will likely pave the way for a retest of the $3.8490 resistance, with a clean breakout targeting price discovery above $4.0278.
@Evaa_ #EVAAUSDT🔻 $EVAA #WhatInvestmentSignalsDo13FFilingsReveal? #StablecoinMarketShrinksAtFastestPaceSinceTerraLuna
#AnthropicIPOTestsInvestorAppetiteForAI #NvidiaBoardNotConsideringHuang’sReturnasCEO
The 1-week (1W) chart for EVAA/USDT Perpetual on Binance reflects a high-momentum breakout and an explosive bullish trend. Currently trading at $3.6134, the asset has posted an impressive daily gain of +37.87%, continuing a broader macro expansion from its significant historical lows.
Price Action & Volatility
The weekly timeframe showcases immense price expansion following a prolonged consolidation phase above the $0.2743 major swing low. The token recently reached a 24-hour high of $3.8220 (with historical wicks touching up to $3.8490) before facing mild resistance near the $4.00 psychological barrier. The 24-hour low is marked at $2.5058, demonstrating strong underlying bid support that quickly absorbed selling pressure during intraday pullbacks.
Volume & Liquidity
Market participation is exceptionally robust, backed by a 24-hour trading volume of 243.62M EVAA and 782.84M USDT. This massive surge in capital influx validates the bullish continuation pattern, indicating that institutional and retail interest is heavily skewed toward momentum accumulation.
Momentum & Indicators
MACD: The Moving Average Convergence Divergence indicator reveals powerful bullish momentum. The DIF line (0.3173) is situated significantly above the DEA line (0.0136), accompanied by expanding green histogram bars (MACD: 0.3037), signaling strong trend continuation without immediate signs of macro exhaustion.
Moving Averages & Support/Resistance: Immediate support is established around the $3.2413 and $2.4549 structural levels. A sustained hold above these zones will likely pave the way for a retest of the $3.8490 resistance, with a clean breakout targeting price discovery above $4.0278.
@Evaa_ #EVAAUSDT🔻 $EVAA #WhatInvestmentSignalsDo13FFilingsReveal? #StablecoinMarketShrinksAtFastestPaceSinceTerraLuna
#AnthropicIPOTestsInvestorAppetiteForAI #NvidiaBoardNotConsideringHuang’sReturnasCEO
1
283

·
--
$HUMA A Long Liquidation
$5.35K in HUMA longs got flushed at $0.00909 on Binance! Bulls just took a painful hit. Now all eyes are on buyer support — if sellers keep control, another downside squeeze could be coming. 👀
Recent futures data shows HUMA's open interest climbing sharply alongside its price, meaning fresh leverage is entering the market. Volatility could get wild. Seandra AI
#StablecoinMarketShrinksAtFastestPaceSinceTerraLuna #OPTIMJACKAttackInfectsAtLeast186Websites #AnthropicIPOTestsInvestorAppetiteForAI
$HUMA A Long Liquidation
$5.35K in HUMA longs got flushed at $0.00909 on Binance! Bulls just took a painful hit. Now all eyes are on buyer support — if sellers keep control, another downside squeeze could be coming. 👀
Recent futures data shows HUMA's open interest climbing sharply alongside its price, meaning fresh leverage is entering the market. Volatility could get wild. Seandra AI
#StablecoinMarketShrinksAtFastestPaceSinceTerraLuna #OPTIMJACKAttackInfectsAtLeast186Websites #AnthropicIPOTestsInvestorAppetiteForAI
$5.35K in HUMA longs got flushed at $0.00909 on Binance! Bulls just took a painful hit. Now all eyes are on buyer support — if sellers keep control, another downside squeeze could be coming. 👀
Recent futures data shows HUMA's open interest climbing sharply alongside its price, meaning fresh leverage is entering the market. Volatility could get wild. Seandra AI
#StablecoinMarketShrinksAtFastestPaceSinceTerraLuna #OPTIMJACKAttackInfectsAtLeast186Websites #AnthropicIPOTestsInvestorAppetiteForAI
73

·
--
Падение
$BTC just recorded a fresh liquidation event, wiping out $8.0478K in long positions at $64,331.01. This shakeout puts bullish traders under pressure and makes the current price zone important. If buyers manage to regain control, a recovery move could bring new momentum.
Ep: $64,331.01
Tp: $65,000 – $65,500
Sl: $63,900
Let's go $BTC #WhatInvestmentSignalsDo13FFilingsReveal? #OPTIMJACKAttackInfectsAtLeast186Websites #StablecoinMarketShrinksAtFastestPaceSinceTerraLuna
$BTC just recorded a fresh liquidation event, wiping out $8.0478K in long positions at $64,331.01. This shakeout puts bullish traders under pressure and makes the current price zone important. If buyers manage to regain control, a recovery move could bring new momentum.
Ep: $64,331.01
Tp: $65,000 – $65,500
Sl: $63,900
Let's go $BTC #WhatInvestmentSignalsDo13FFilingsReveal? #OPTIMJACKAttackInfectsAtLeast186Websites #StablecoinMarketShrinksAtFastestPaceSinceTerraLuna
Ep: $64,331.01
Tp: $65,000 – $65,500
Sl: $63,900
Let's go $BTC #WhatInvestmentSignalsDo13FFilingsReveal? #OPTIMJACKAttackInfectsAtLeast186Websites #StablecoinMarketShrinksAtFastestPaceSinceTerraLuna
37

·
--
Рост
$HUMA WAKES UP! Bulls Are Taking Control! HUMAUSDT is showing impressive strength with a +43.82% gain, trading around 0.009236. The strong upward move puts this token on the momentum watchlist, but buyers must defend the latest gains to keep the bullish structure alive. Support: Exact support requires chart confirmation. Resistance: Watch the recent high and next rejection zone. 🎯 Targets: Next upside targets should be mapped using confirmed resistance levels. Next Move: Holding the current momentum could open the door for another bullish leg, while weakness may invite a retracement. Pro Tip: Watch for a successful retest instead of entering after an extended pump.
#BitcoinExtendsLosingStreakToSixWeeks #StablecoinMarketShrinksAtFastestPaceSinceTerraLuna #WhatInvestmentSignalsDo13FFilingsReveal?
{spot}(HUMAUSDT)
$HUMA WAKES UP! Bulls Are Taking Control! HUMAUSDT is showing impressive strength with a +43.82% gain, trading around 0.009236. The strong upward move puts this token on the momentum watchlist, but buyers must defend the latest gains to keep the bullish structure alive. Support: Exact support requires chart confirmation. Resistance: Watch the recent high and next rejection zone. 🎯 Targets: Next upside targets should be mapped using confirmed resistance levels. Next Move: Holding the current momentum could open the door for another bullish leg, while weakness may invite a retracement. Pro Tip: Watch for a successful retest instead of entering after an extended pump.
#BitcoinExtendsLosingStreakToSixWeeks #StablecoinMarketShrinksAtFastestPaceSinceTerraLuna #WhatInvestmentSignalsDo13FFilingsReveal?
#BitcoinExtendsLosingStreakToSixWeeks #StablecoinMarketShrinksAtFastestPaceSinceTerraLuna #WhatInvestmentSignalsDo13FFilingsReveal?
173

·
--
Рост
$HUMA IS EXPLODING! BULLS ARE TAKING OVER! 🔥
HUMA is stealing the spotlight with an impressive 45.98% surge, pushing its price to $0.00927!
Buyers are showing serious strength, and the momentum is getting difficult to ignore. If bulls maintain control and break through the next resistance zone, another explosive move could be on the table.
🎯 Key Levels:
- Support 1: $0.00850
- Strong Support: $0.00800
- Resistance 1: $0.00980
- Major Resistance: $0.01080
- Next Target: $0.01150–$0.01350
🔥 A confirmed breakout above $0.01080 could open the door to another powerful rally.
Watch the volume, protect your capital, and don't chase green candles blindly.
HUMA is on the radar!
{spot}(HUMAUSDT)
#AnthropicIPOTestsInvestorAppetiteForAI #NvidiaBoardNotConsideringHuang’sReturnasCEO #OPTIMJACKAttackInfectsAtLeast186Websites #StablecoinMarketShrinksAtFastestPaceSinceTerraLuna #BitcoinExtendsLosingStreakToSixWeeks
$HUMA IS EXPLODING! BULLS ARE TAKING OVER! 🔥
HUMA is stealing the spotlight with an impressive 45.98% surge, pushing its price to $0.00927!
Buyers are showing serious strength, and the momentum is getting difficult to ignore. If bulls maintain control and break through the next resistance zone, another explosive move could be on the table.
🎯 Key Levels:
- Support 1: $0.00850
- Strong Support: $0.00800
- Resistance 1: $0.00980
- Major Resistance: $0.01080
- Next Target: $0.01150–$0.01350
🔥 A confirmed breakout above $0.01080 could open the door to another powerful rally.
Watch the volume, protect your capital, and don't chase green candles blindly.
HUMA is on the radar!
#AnthropicIPOTestsInvestorAppetiteForAI #NvidiaBoardNotConsideringHuang’sReturnasCEO #OPTIMJACKAttackInfectsAtLeast186Websites #StablecoinMarketShrinksAtFastestPaceSinceTerraLuna #BitcoinExtendsLosingStreakToSixWeeks
HUMA is stealing the spotlight with an impressive 45.98% surge, pushing its price to $0.00927!
Buyers are showing serious strength, and the momentum is getting difficult to ignore. If bulls maintain control and break through the next resistance zone, another explosive move could be on the table.
🎯 Key Levels:
- Support 1: $0.00850
- Strong Support: $0.00800
- Resistance 1: $0.00980
- Major Resistance: $0.01080
- Next Target: $0.01150–$0.01350
🔥 A confirmed breakout above $0.01080 could open the door to another powerful rally.
Watch the volume, protect your capital, and don't chase green candles blindly.
HUMA is on the radar!
#AnthropicIPOTestsInvestorAppetiteForAI #NvidiaBoardNotConsideringHuang’sReturnasCEO #OPTIMJACKAttackInfectsAtLeast186Websites #StablecoinMarketShrinksAtFastestPaceSinceTerraLuna #BitcoinExtendsLosingStreakToSixWeeks
1
98

·
--
🚀 TOP 3 CRYPTO GAINERS – BLESS, HUMA & CROSS: WHAT'S NEXT?
Three coins are showing strong market momentum today. BLESS is leading with an 84.24% gain, followed by HUMA at 43.72% and CROSS at 29.91%. But after such sharp moves, chasing green candles can be risky. Here are my trading levels to watch.
🔥 1. BLESS/USDT
Current Price: $0.016858
Buy Zone: $0.01580–$0.01630
Target 1: $0.01750
Target 2: $0.01850
Target 3: $0.02000
Stop Loss: $0.01500
🔥 2. HUMA/USDT
Current Price: $0.009276
Buy Zone: $0.00880–$0.00905
Target 1: $0.00960
Target 2: $0.01000
Target 3: $0.01080
Stop Loss: $0.00840
🔥 3. CROSS/USDT
Current Price: $0.15060
Buy Zone: $0.14400–$0.14800
Target 1: $0.15500
Target 2: $0.16200
Target 3: $0.17200
Stop Loss: $0.13900
My Trading Strategy:
I would not rush into any of these coins after a big pump. Wait for a healthy pullback, bullish confirmation, and strong buying volume. Take profits step by step and respect your stop loss.
Remember, momentum creates opportunities, but risk management protects your capital. These levels are estimates, not guaranteed outcomes.#StablecoinMarketShrinksAtFastestPaceSinceTerraLuna #InvescoStablecoinReservesFundLaunchesOnEthereum #NvidiaBoardNotConsideringHuang’sReturnasCEO #AnthropicIPOTestsInvestorAppetiteForAI $BLESS
{future}(BLESSUSDT)
$HUMA
{spot}(HUMAUSDT)
$CROSS
{future}(CROSSUSDT)
🚀 TOP 3 CRYPTO GAINERS – BLESS, HUMA & CROSS: WHAT'S NEXT?
Three coins are showing strong market momentum today. BLESS is leading with an 84.24% gain, followed by HUMA at 43.72% and CROSS at 29.91%. But after such sharp moves, chasing green candles can be risky. Here are my trading levels to watch.
🔥 1. BLESS/USDT
Current Price: $0.016858
Buy Zone: $0.01580–$0.01630
Target 1: $0.01750
Target 2: $0.01850
Target 3: $0.02000
Stop Loss: $0.01500
🔥 2. HUMA/USDT
Current Price: $0.009276
Buy Zone: $0.00880–$0.00905
Target 1: $0.00960
Target 2: $0.01000
Target 3: $0.01080
Stop Loss: $0.00840
🔥 3. CROSS/USDT
Current Price: $0.15060
Buy Zone: $0.14400–$0.14800
Target 1: $0.15500
Target 2: $0.16200
Target 3: $0.17200
Stop Loss: $0.13900
My Trading Strategy:
I would not rush into any of these coins after a big pump. Wait for a healthy pullback, bullish confirmation, and strong buying volume. Take profits step by step and respect your stop loss.
Remember, momentum creates opportunities, but risk management protects your capital. These levels are estimates, not guaranteed outcomes.#StablecoinMarketShrinksAtFastestPaceSinceTerraLuna #InvescoStablecoinReservesFundLaunchesOnEthereum #NvidiaBoardNotConsideringHuang’sReturnasCEO #AnthropicIPOTestsInvestorAppetiteForAI $BLESS
$HUMA
$CROSS
Three coins are showing strong market momentum today. BLESS is leading with an 84.24% gain, followed by HUMA at 43.72% and CROSS at 29.91%. But after such sharp moves, chasing green candles can be risky. Here are my trading levels to watch.
🔥 1. BLESS/USDT
Current Price: $0.016858
Buy Zone: $0.01580–$0.01630
Target 1: $0.01750
Target 2: $0.01850
Target 3: $0.02000
Stop Loss: $0.01500
🔥 2. HUMA/USDT
Current Price: $0.009276
Buy Zone: $0.00880–$0.00905
Target 1: $0.00960
Target 2: $0.01000
Target 3: $0.01080
Stop Loss: $0.00840
🔥 3. CROSS/USDT
Current Price: $0.15060
Buy Zone: $0.14400–$0.14800
Target 1: $0.15500
Target 2: $0.16200
Target 3: $0.17200
Stop Loss: $0.13900
My Trading Strategy:
I would not rush into any of these coins after a big pump. Wait for a healthy pullback, bullish confirmation, and strong buying volume. Take profits step by step and respect your stop loss.
Remember, momentum creates opportunities, but risk management protects your capital. These levels are estimates, not guaranteed outcomes.#StablecoinMarketShrinksAtFastestPaceSinceTerraLuna #InvescoStablecoinReservesFundLaunchesOnEthereum #NvidiaBoardNotConsideringHuang’sReturnasCEO #AnthropicIPOTestsInvestorAppetiteForAI $BLESS
$HUMA
$CROSS
BLESS💪🕺💙🪻
HUMA🌹🪻💝
CROSS🌹🪻💙
22 ч. осталось
1.4k

·
--
$SIREN
{alpha}(560x997a58129890bbda032231a52ed1ddc845fc18e1)
Social Media Post (X / Binance Square / Telegram)
🚨 $SIREN Market Update & Next Price Targets 🚨
$SIREN is currently consolidating around $0.026 – $0.027 after heavy volatility. While the broader crypto market sits in Extreme Fear, traders are watching key technical levels for the next breakout or breakdown. [1, 2, 3, 4]
📊 Key Levels to Watch:
🟢 Immediate Resistance (Upside Targets): $0.0278 – $0.0285
A clean break and hold above the 50-day moving average opens the door toward $0.0350. [1, 2]
🔴 Key Support (Downside Risk): $0.0241 – $0.0247
Losing this zone could drag price back toward the $0.0208 – $0.0226 range. [1, 2]
⚠️ Keep in Mind:
• AI + Meme Narrative: Upcoming AI trading agent tools remain "coming soon"—actual product launches will be the real catalyst.
• High Concentration: Over 50% of the circulating supply sits in a single custody wallet, meaning whale moves can trigger sharp swings. [1, 2, 3]
#StablecoinMarketShrinksAtFastestPaceSinceTerraLuna #OPTIMJACKAttackInfectsAtLeast186Websites
$SIREN
Social Media Post (X / Binance Square / Telegram)
🚨 $SIREN Market Update & Next Price Targets 🚨
$SIREN is currently consolidating around $0.026 – $0.027 after heavy volatility. While the broader crypto market sits in Extreme Fear, traders are watching key technical levels for the next breakout or breakdown. [1, 2, 3, 4]
📊 Key Levels to Watch:
🟢 Immediate Resistance (Upside Targets): $0.0278 – $0.0285
A clean break and hold above the 50-day moving average opens the door toward $0.0350. [1, 2]
🔴 Key Support (Downside Risk): $0.0241 – $0.0247
Losing this zone could drag price back toward the $0.0208 – $0.0226 range. [1, 2]
⚠️ Keep in Mind:
• AI + Meme Narrative: Upcoming AI trading agent tools remain "coming soon"—actual product launches will be the real catalyst.
• High Concentration: Over 50% of the circulating supply sits in a single custody wallet, meaning whale moves can trigger sharp swings. [1, 2, 3]
#StablecoinMarketShrinksAtFastestPaceSinceTerraLuna #OPTIMJACKAttackInfectsAtLeast186Websites
Social Media Post (X / Binance Square / Telegram)
🚨 $SIREN Market Update & Next Price Targets 🚨
$SIREN is currently consolidating around $0.026 – $0.027 after heavy volatility. While the broader crypto market sits in Extreme Fear, traders are watching key technical levels for the next breakout or breakdown. [1, 2, 3, 4]
📊 Key Levels to Watch:
🟢 Immediate Resistance (Upside Targets): $0.0278 – $0.0285
A clean break and hold above the 50-day moving average opens the door toward $0.0350. [1, 2]
🔴 Key Support (Downside Risk): $0.0241 – $0.0247
Losing this zone could drag price back toward the $0.0208 – $0.0226 range. [1, 2]
⚠️ Keep in Mind:
• AI + Meme Narrative: Upcoming AI trading agent tools remain "coming soon"—actual product launches will be the real catalyst.
• High Concentration: Over 50% of the circulating supply sits in a single custody wallet, meaning whale moves can trigger sharp swings. [1, 2, 3]
#StablecoinMarketShrinksAtFastestPaceSinceTerraLuna #OPTIMJACKAttackInfectsAtLeast186Websites
232

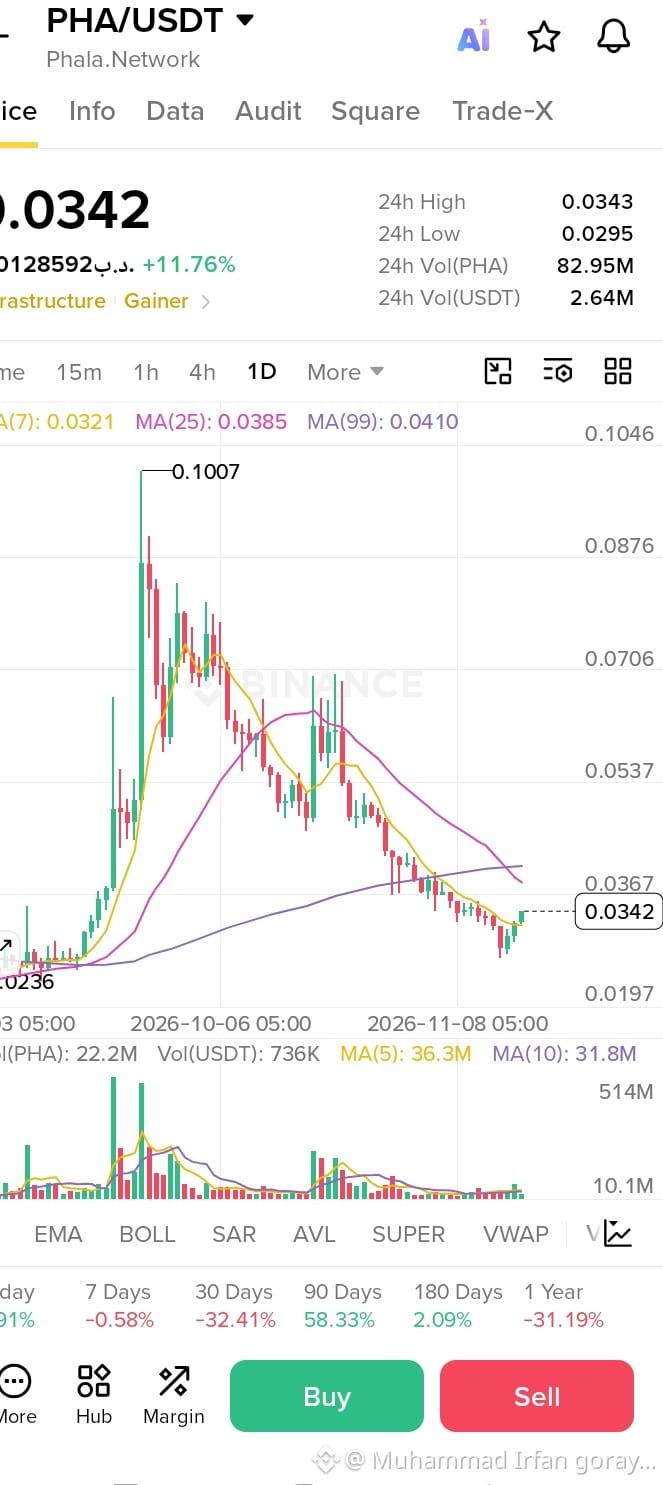
$PHA - Phala Network*
A decentralized cloud computing platform for confidential, verifiable AI computation. Listed on Binance, OKX, KuCoin.
*Live Today - 17 Nov 2026:*
- *Price: $0.0341* - *+11.80% Today*
- *24h Range: $0.0295 - $0.0343*
- *Volume: $1.04M on Binance + $242M total volume*
- *Market Cap: $28.36M* - Rank #383
- *Performance:*
- 5 days: -11.34%
- 1 month: -44.49%
- 1 year: -41.88%
- *ATH: $1.41* on May 15, 2021 - Now -97.5% down from ATH
*Chart Analysis:*
1. *Downtrend:* From $0.055 down to $0.0271 low on Nov 14 - dropped 50% in 2 weeks
2. *Bottom:* Made double bottom at $0.0271 on Nov 14 - same as crypto market bottom
3. *Recovery:* From $0.0271 to $0.0341 - *+25.8% recovery in 3 days*
4. *Today:* Breakout with volume above $0.031 - bullish momentum
*Key Levels:*
- *Support: $0.031 / $0.0295 / $0.0271 (Strong Low)*
- *Resistance: $0.0343 (Today's High) / $0.038 / $0.042*
- *If $0.0343 breaks:* Next target $0.038 - $0.040
- *If $0.0305 breaks:* Could retest $0.0285
This is a low-cap AI privacy coin. Moves with AI narrative. Current move looks like trend reversal after long correction. Good risk/reward near $0.03 support with stop loss below $0.0271.#OPTIMJACKAttackInfectsAtLeast186Websites #StablecoinMarketShrinksAtFastestPaceSinceTerraLuna
$PHA - Phala Network*
A decentralized cloud computing platform for confidential, verifiable AI computation. Listed on Binance, OKX, KuCoin.
*Live Today - 17 Nov 2026:*
- *Price: $0.0341* - *+11.80% Today*
- *24h Range: $0.0295 - $0.0343*
- *Volume: $1.04M on Binance + $242M total volume*
- *Market Cap: $28.36M* - Rank #383
- *Performance:*
- 5 days: -11.34%
- 1 month: -44.49%
- 1 year: -41.88%
- *ATH: $1.41* on May 15, 2021 - Now -97.5% down from ATH
*Chart Analysis:*
1. *Downtrend:* From $0.055 down to $0.0271 low on Nov 14 - dropped 50% in 2 weeks
2. *Bottom:* Made double bottom at $0.0271 on Nov 14 - same as crypto market bottom
3. *Recovery:* From $0.0271 to $0.0341 - *+25.8% recovery in 3 days*
4. *Today:* Breakout with volume above $0.031 - bullish momentum
*Key Levels:*
- *Support: $0.031 / $0.0295 / $0.0271 (Strong Low)*
- *Resistance: $0.0343 (Today's High) / $0.038 / $0.042*
- *If $0.0343 breaks:* Next target $0.038 - $0.040
- *If $0.0305 breaks:* Could retest $0.0285
This is a low-cap AI privacy coin. Moves with AI narrative. Current move looks like trend reversal after long correction. Good risk/reward near $0.03 support with stop loss below $0.0271.#OPTIMJACKAttackInfectsAtLeast186Websites #StablecoinMarketShrinksAtFastestPaceSinceTerraLuna
A decentralized cloud computing platform for confidential, verifiable AI computation. Listed on Binance, OKX, KuCoin.
*Live Today - 17 Nov 2026:*
- *Price: $0.0341* - *+11.80% Today*
- *24h Range: $0.0295 - $0.0343*
- *Volume: $1.04M on Binance + $242M total volume*
- *Market Cap: $28.36M* - Rank #383
- *Performance:*
- 5 days: -11.34%
- 1 month: -44.49%
- 1 year: -41.88%
- *ATH: $1.41* on May 15, 2021 - Now -97.5% down from ATH
*Chart Analysis:*
1. *Downtrend:* From $0.055 down to $0.0271 low on Nov 14 - dropped 50% in 2 weeks
2. *Bottom:* Made double bottom at $0.0271 on Nov 14 - same as crypto market bottom
3. *Recovery:* From $0.0271 to $0.0341 - *+25.8% recovery in 3 days*
4. *Today:* Breakout with volume above $0.031 - bullish momentum
*Key Levels:*
- *Support: $0.031 / $0.0295 / $0.0271 (Strong Low)*
- *Resistance: $0.0343 (Today's High) / $0.038 / $0.042*
- *If $0.0343 breaks:* Next target $0.038 - $0.040
- *If $0.0305 breaks:* Could retest $0.0285
This is a low-cap AI privacy coin. Moves with AI narrative. Current move looks like trend reversal after long correction. Good risk/reward near $0.03 support with stop loss below $0.0271.#OPTIMJACKAttackInfectsAtLeast186Websites #StablecoinMarketShrinksAtFastestPaceSinceTerraLuna
50

·
--
🇷🇺 RUSSIA OPENS RETAIL CRYPTO TODAY (NOV 17)
Russia's retail crypto rules start today for Bitcoin($BTC ), Ether($ETH ) and USDT, with non-qualified investors capped at 300,000 rubles a year per intermediary. A test is required before purchases.
⚠️ It's unclear how quickly intermediaries will open access in practice.
$SOL #AnthropicIPOTestsInvestorAppetiteForAI #NvidiaBoardNotConsideringHuang’sReturnasCEO #WhatInvestmentSignalsDo13FFilingsReveal? #StablecoinMarketShrinksAtFastestPaceSinceTerraLuna
🇷🇺 RUSSIA OPENS RETAIL CRYPTO TODAY (NOV 17)
Russia's retail crypto rules start today for Bitcoin($BTC ), Ether($ETH ) and USDT, with non-qualified investors capped at 300,000 rubles a year per intermediary. A test is required before purchases.
⚠️ It's unclear how quickly intermediaries will open access in practice.
$SOL #AnthropicIPOTestsInvestorAppetiteForAI #NvidiaBoardNotConsideringHuang’sReturnasCEO #WhatInvestmentSignalsDo13FFilingsReveal? #StablecoinMarketShrinksAtFastestPaceSinceTerraLuna
Russia's retail crypto rules start today for Bitcoin($BTC ), Ether($ETH ) and USDT, with non-qualified investors capped at 300,000 rubles a year per intermediary. A test is required before purchases.
⚠️ It's unclear how quickly intermediaries will open access in practice.
$SOL #AnthropicIPOTestsInvestorAppetiteForAI #NvidiaBoardNotConsideringHuang’sReturnasCEO #WhatInvestmentSignalsDo13FFilingsReveal? #StablecoinMarketShrinksAtFastestPaceSinceTerraLuna
5

·
--
Hello guys please like my posts and follow me🙈🌹✌🏻
$MSFTB $NVDAB $AMZNB #StablecoinMarketShrinksAtFastestPaceSinceTerraLuna #StrategySells2.09MMSTRSharesFor$244.7M #OPTIMJACKAttackInfectsAtLeast186Websites #CypherpunkReports$306MQ3NetProfit #InvescoStablecoinReservesFundLaunchesOnEthereum
Hello guys please like my posts and follow me🙈🌹✌🏻
$MSFTB $NVDAB $AMZNB #StablecoinMarketShrinksAtFastestPaceSinceTerraLuna #StrategySells2.09MMSTRSharesFor$244.7M #OPTIMJACKAttackInfectsAtLeast186Websites #CypherpunkReports$306MQ3NetProfit #InvescoStablecoinReservesFundLaunchesOnEthereum
$MSFTB $NVDAB $AMZNB #StablecoinMarketShrinksAtFastestPaceSinceTerraLuna #StrategySells2.09MMSTRSharesFor$244.7M #OPTIMJACKAttackInfectsAtLeast186Websites #CypherpunkReports$306MQ3NetProfit #InvescoStablecoinReservesFundLaunchesOnEthereum
10
·
--
Рост
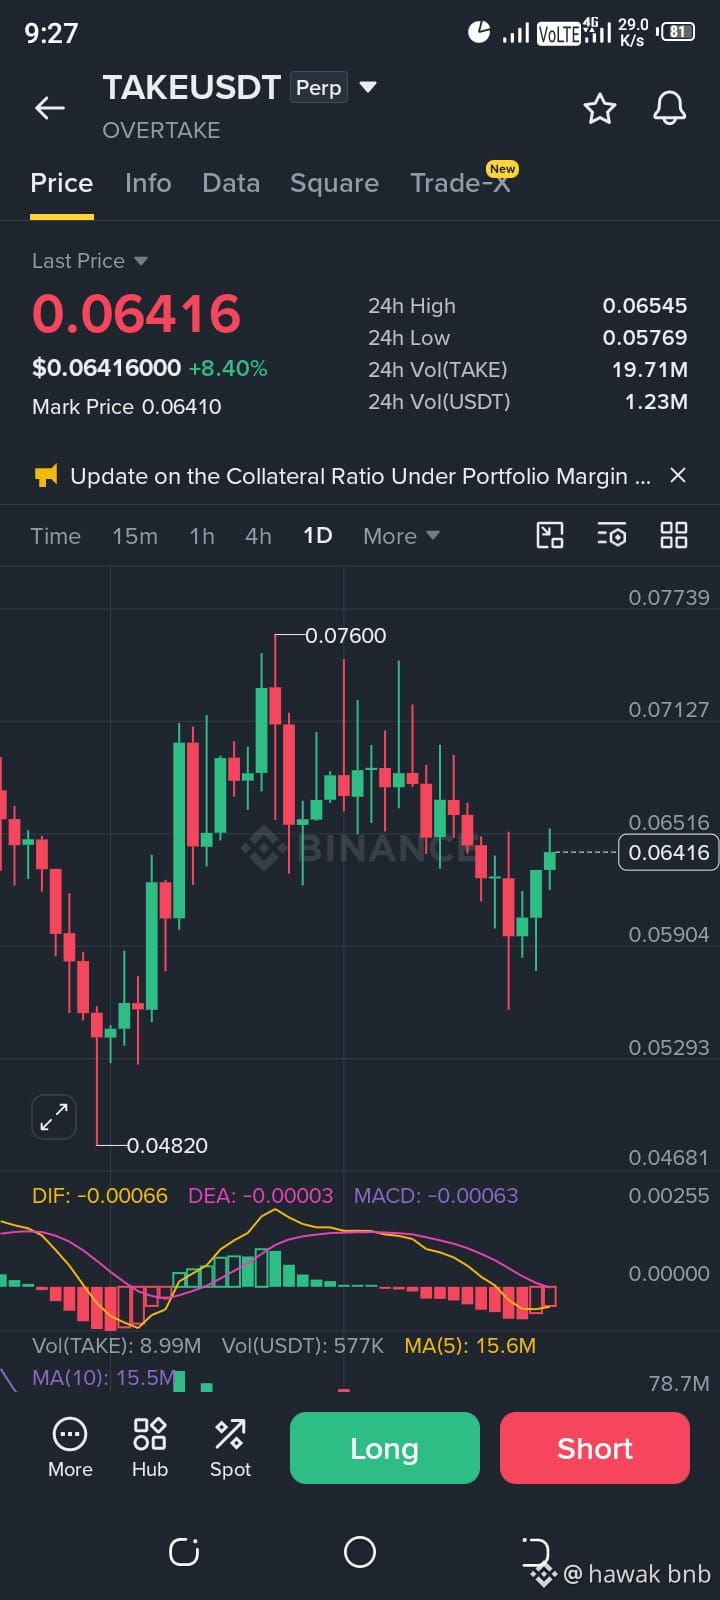
The 1-day (1D) chart for TAKE/USDT Perpetual (OVERTAKE) on Binance displays a fluctuating consolidation and recovery range following previous swing highs and subsequent retracements. Currently trading at $0.06416, the asset registers a 24-hour gain of +8.40%, supported by mild buying pressure and steady market participation.
Price Action & Trend Structure
The daily timeframe shows that the asset previously reached a swing high peak of $0.07600 before undergoing a corrective downward phase that tested a local low of $0.04820. From that base floor, prices established a recovery pattern with higher lows and intermittent consolidation. Over the past 24 hours, the price recorded a high of $0.06545 and a low of $0.05769. The current green candlestick indicates an ongoing upward push attempting to retest the upper resistance boundary. @Square-Creator-a41651125 #TAKE $TAKE
{future}(TAKEUSDT)
#AnthropicIPOTestsInvestorAppetiteForAI #BitcoinExtendsLosingStreakToSixWeeks #StablecoinMarketShrinksAtFastestPaceSinceTerraLuna #InvescoStablecoinReservesFundLaunchesOnEthereum
Volume & Liquidity
Market turnover remains relatively moderate, recording a 24-hour trading volume of 19.71M TAKE and 1.23M USDT. This steady volume reflects balanced market interest, though it lacks the explosive capital inflows typically required for an aggressive macro breakout.
The 1-day (1D) chart for TAKE/USDT Perpetual (OVERTAKE) on Binance displays a fluctuating consolidation and recovery range following previous swing highs and subsequent retracements. Currently trading at $0.06416, the asset registers a 24-hour gain of +8.40%, supported by mild buying pressure and steady market participation.
Price Action & Trend Structure
The daily timeframe shows that the asset previously reached a swing high peak of $0.07600 before undergoing a corrective downward phase that tested a local low of $0.04820. From that base floor, prices established a recovery pattern with higher lows and intermittent consolidation. Over the past 24 hours, the price recorded a high of $0.06545 and a low of $0.05769. The current green candlestick indicates an ongoing upward push attempting to retest the upper resistance boundary. @take #TAKE $TAKE
#AnthropicIPOTestsInvestorAppetiteForAI #BitcoinExtendsLosingStreakToSixWeeks #StablecoinMarketShrinksAtFastestPaceSinceTerraLuna #InvescoStablecoinReservesFundLaunchesOnEthereum
Volume & Liquidity
Market turnover remains relatively moderate, recording a 24-hour trading volume of 19.71M TAKE and 1.23M USDT. This steady volume reflects balanced market interest, though it lacks the explosive capital inflows typically required for an aggressive macro breakout.
Price Action & Trend Structure
The daily timeframe shows that the asset previously reached a swing high peak of $0.07600 before undergoing a corrective downward phase that tested a local low of $0.04820. From that base floor, prices established a recovery pattern with higher lows and intermittent consolidation. Over the past 24 hours, the price recorded a high of $0.06545 and a low of $0.05769. The current green candlestick indicates an ongoing upward push attempting to retest the upper resistance boundary. @take #TAKE $TAKE
#AnthropicIPOTestsInvestorAppetiteForAI #BitcoinExtendsLosingStreakToSixWeeks #StablecoinMarketShrinksAtFastestPaceSinceTerraLuna #InvescoStablecoinReservesFundLaunchesOnEthereum
Volume & Liquidity
Market turnover remains relatively moderate, recording a 24-hour trading volume of 19.71M TAKE and 1.23M USDT. This steady volume reflects balanced market interest, though it lacks the explosive capital inflows typically required for an aggressive macro breakout.
1
6
·
--
Падение
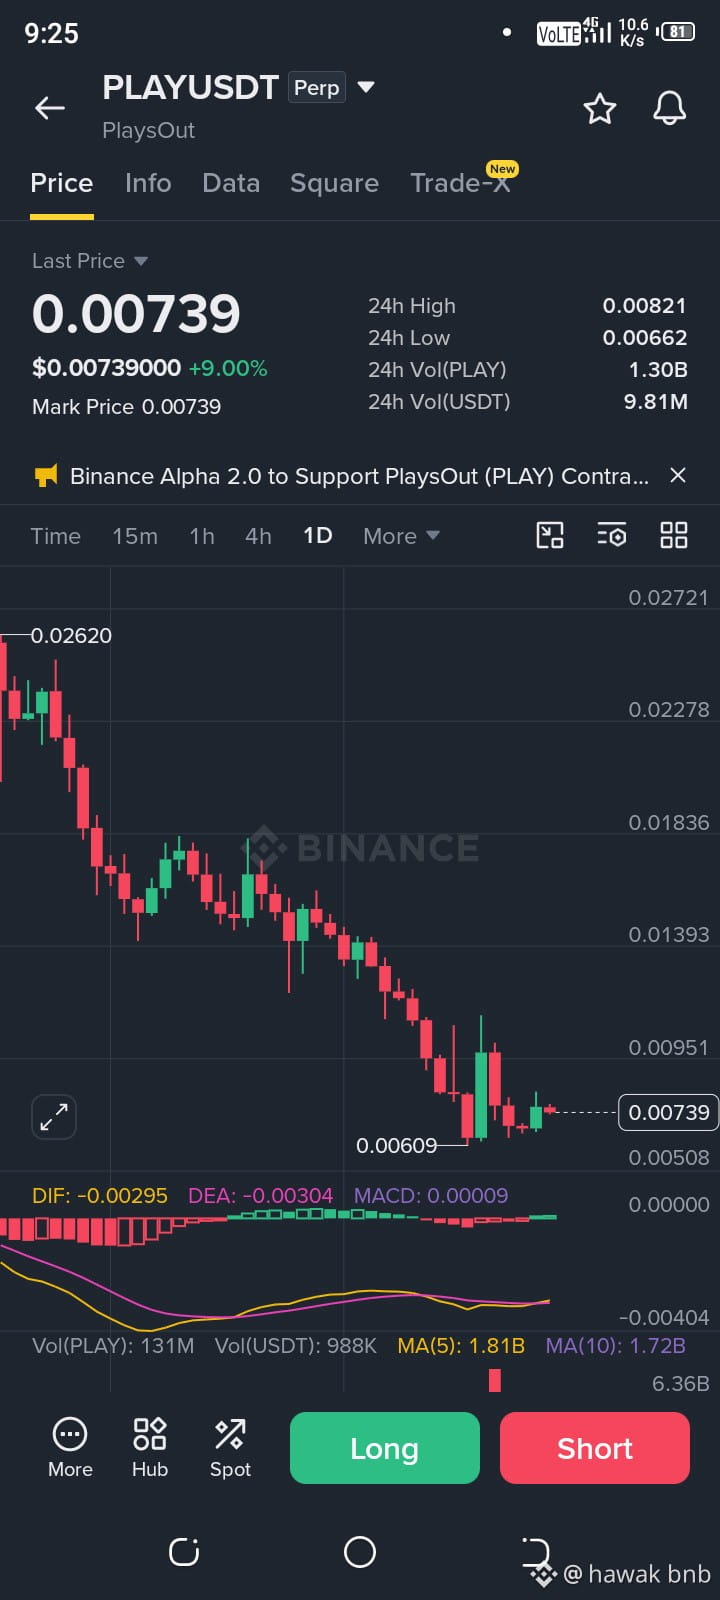
The 1-day (1D) chart for PLAY/USDT Perpetual (PlaysOut) on Binance displays a prolonged macro downtrend followed by an early phase of price stabilization and minor recovery. Currently trading at $0.00739, the asset reflects a 24-hour gain of +9.00%, supported by mild buying interest and recent ecosystem updates regarding contract integration on Binance Alpha 2.0.
Price Action & Trend Structure
The daily timeframe highlights an extended distribution phase that descended from a significant swing high peak of $0.02620, forming a persistent sequence of lower highs and lower lows. Prices compressed steadily until reaching a local bottom floor at a 24-hour low of $0.00662 (with wicks touching down to $0.00609). From this support zone, buyers initiated a modest corrective bounce, pushing the price up to a 24-hour peak of $0.00821 before consolidating around the current level. Despite this slight upward shift, the broader macroeconomic structure remains heavily bearish.
Volume & Liquidity
Market turnover remains relatively subdued, recording a 24-hour trading volume of 1.30B PLAY and 9.81M USDT. This modest volume indicates cautious participation, suggesting that traders are waiting for stronger confirmation signals before committing large capital to the asset. @player #play $PLAY
{future}(PLAYUSDT)
#AnthropicIPOTestsInvestorAppetiteForAI #WhatInvestmentSignalsDo13FFilingsReveal? #InvescoStablecoinReservesFundLaunchesOnEthereum #StablecoinMarketShrinksAtFastestPaceSinceTerraLuna
The 1-day (1D) chart for PLAY/USDT Perpetual (PlaysOut) on Binance displays a prolonged macro downtrend followed by an early phase of price stabilization and minor recovery. Currently trading at $0.00739, the asset reflects a 24-hour gain of +9.00%, supported by mild buying interest and recent ecosystem updates regarding contract integration on Binance Alpha 2.0.
Price Action & Trend Structure
The daily timeframe highlights an extended distribution phase that descended from a significant swing high peak of $0.02620, forming a persistent sequence of lower highs and lower lows. Prices compressed steadily until reaching a local bottom floor at a 24-hour low of $0.00662 (with wicks touching down to $0.00609). From this support zone, buyers initiated a modest corrective bounce, pushing the price up to a 24-hour peak of $0.00821 before consolidating around the current level. Despite this slight upward shift, the broader macroeconomic structure remains heavily bearish.
Volume & Liquidity
Market turnover remains relatively subdued, recording a 24-hour trading volume of 1.30B PLAY and 9.81M USDT. This modest volume indicates cautious participation, suggesting that traders are waiting for stronger confirmation signals before committing large capital to the asset. @play #play $PLAY
#AnthropicIPOTestsInvestorAppetiteForAI #WhatInvestmentSignalsDo13FFilingsReveal? #InvescoStablecoinReservesFundLaunchesOnEthereum #StablecoinMarketShrinksAtFastestPaceSinceTerraLuna
Price Action & Trend Structure
The daily timeframe highlights an extended distribution phase that descended from a significant swing high peak of $0.02620, forming a persistent sequence of lower highs and lower lows. Prices compressed steadily until reaching a local bottom floor at a 24-hour low of $0.00662 (with wicks touching down to $0.00609). From this support zone, buyers initiated a modest corrective bounce, pushing the price up to a 24-hour peak of $0.00821 before consolidating around the current level. Despite this slight upward shift, the broader macroeconomic structure remains heavily bearish.
Volume & Liquidity
Market turnover remains relatively subdued, recording a 24-hour trading volume of 1.30B PLAY and 9.81M USDT. This modest volume indicates cautious participation, suggesting that traders are waiting for stronger confirmation signals before committing large capital to the asset. @play #play $PLAY
#AnthropicIPOTestsInvestorAppetiteForAI #WhatInvestmentSignalsDo13FFilingsReveal? #InvescoStablecoinReservesFundLaunchesOnEthereum #StablecoinMarketShrinksAtFastestPaceSinceTerraLuna
1
10
·
--
Рост
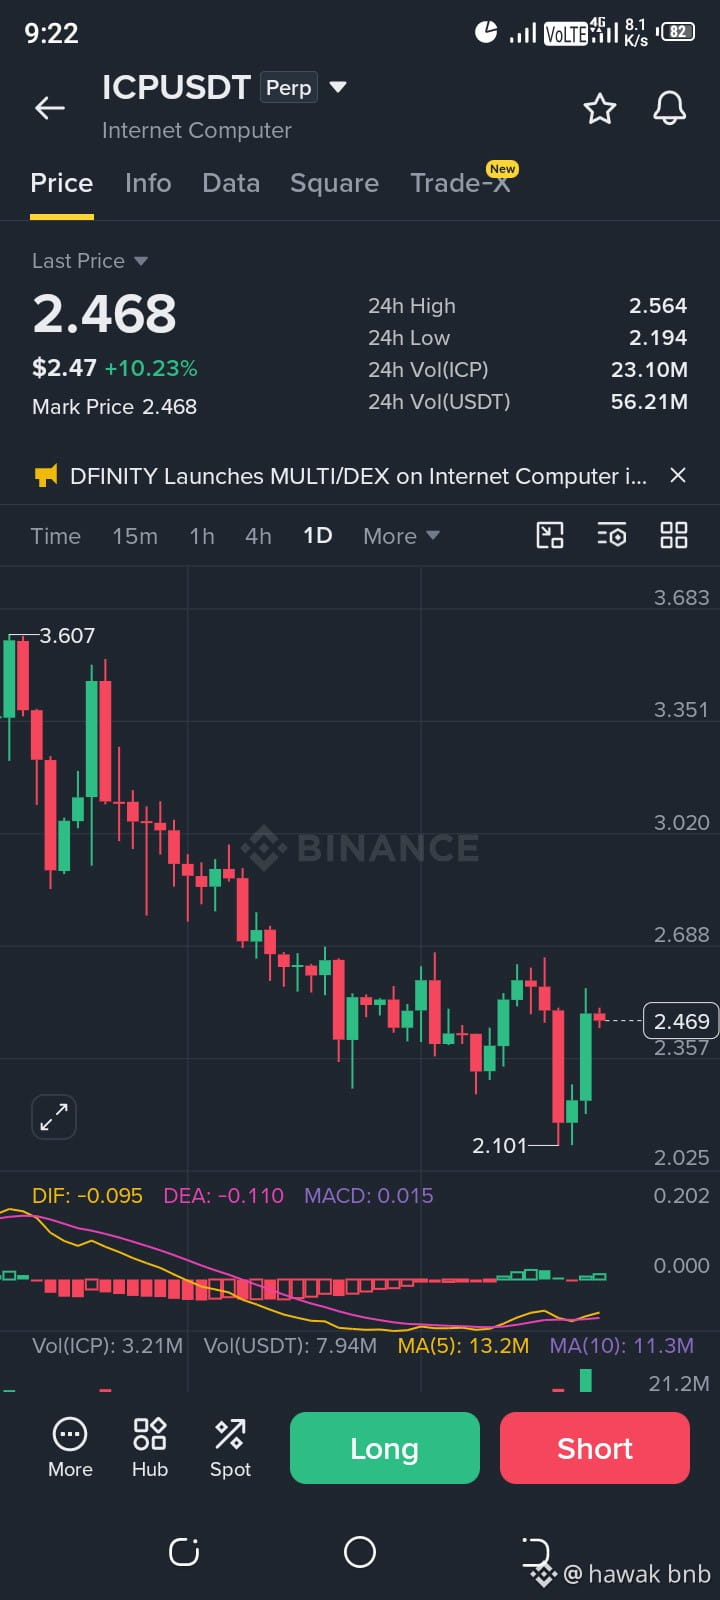
The 1-day (1D) chart for ICP/USDT Perpetual (Internet Computer) on Binance displays a corrective recovery phase following an extended macro downtrend. Currently trading at $2.468, the asset registers a solid 24-hour gain of +10.23%, supported by active market participation and recent ecosystem developments regarding the launch of MULTI/DEX.
Price Action & Trend Structure
The daily timeframe shows that the asset previously experienced heavy distribution from a swing high peak of $3.607, printing a sequence of lower lows and lower highs. Prices compressed downward before establishing a firm bottom base at a 24-hour low of $2.194 (with wicks reaching down to $2.101). From this support zone, buyers stepped in to initiate a corrective bounce, pushing the price up to a 24-hour peak of $2.564 before a mild retracement to the current level. Despite this positive intraday reaction, the broader macro structure remains cautious until key overhead resistance levels are breached.
Volume & Liquidity
Market turnover remains steady, recording a 24-hour trading volume of 23.10M ICP and 56.21M USDT. This volume activity highlights balanced participation between buyers and sellers as the asset attempts to build a stable accumulation floor. @Square-Creator-802fb679a0d9 #icp $ICP
{spot}(ICPUSDT)
#NvidiaBoardNotConsideringHuang’sReturnasCEO #WhatInvestmentSignalsDo13FFilingsReveal? #InvescoStablecoinReservesFundLaunchesOnEthereum #StablecoinMarketShrinksAtFastestPaceSinceTerraLuna
The 1-day (1D) chart for ICP/USDT Perpetual (Internet Computer) on Binance displays a corrective recovery phase following an extended macro downtrend. Currently trading at $2.468, the asset registers a solid 24-hour gain of +10.23%, supported by active market participation and recent ecosystem developments regarding the launch of MULTI/DEX.
Price Action & Trend Structure
The daily timeframe shows that the asset previously experienced heavy distribution from a swing high peak of $3.607, printing a sequence of lower lows and lower highs. Prices compressed downward before establishing a firm bottom base at a 24-hour low of $2.194 (with wicks reaching down to $2.101). From this support zone, buyers stepped in to initiate a corrective bounce, pushing the price up to a 24-hour peak of $2.564 before a mild retracement to the current level. Despite this positive intraday reaction, the broader macro structure remains cautious until key overhead resistance levels are breached.
Volume & Liquidity
Market turnover remains steady, recording a 24-hour trading volume of 23.10M ICP and 56.21M USDT. This volume activity highlights balanced participation between buyers and sellers as the asset attempts to build a stable accumulation floor. @icp #icp $ICP
#NvidiaBoardNotConsideringHuang’sReturnasCEO #WhatInvestmentSignalsDo13FFilingsReveal? #InvescoStablecoinReservesFundLaunchesOnEthereum #StablecoinMarketShrinksAtFastestPaceSinceTerraLuna
Price Action & Trend Structure
The daily timeframe shows that the asset previously experienced heavy distribution from a swing high peak of $3.607, printing a sequence of lower lows and lower highs. Prices compressed downward before establishing a firm bottom base at a 24-hour low of $2.194 (with wicks reaching down to $2.101). From this support zone, buyers stepped in to initiate a corrective bounce, pushing the price up to a 24-hour peak of $2.564 before a mild retracement to the current level. Despite this positive intraday reaction, the broader macro structure remains cautious until key overhead resistance levels are breached.
Volume & Liquidity
Market turnover remains steady, recording a 24-hour trading volume of 23.10M ICP and 56.21M USDT. This volume activity highlights balanced participation between buyers and sellers as the asset attempts to build a stable accumulation floor. @icp #icp $ICP
#NvidiaBoardNotConsideringHuang’sReturnasCEO #WhatInvestmentSignalsDo13FFilingsReveal? #InvescoStablecoinReservesFundLaunchesOnEthereum #StablecoinMarketShrinksAtFastestPaceSinceTerraLuna
1
3

👍🔺👍Balanced take. The key isn’t predicting which scenario wins, but staying flexible and managing risk while the market confirms its direction.
$BTC
{spot}(BTCUSDT)
#AnthropicIPOTestsInvestorAppetiteForAI #NvidiaBoardNotConsideringHuang’sReturnasCEO #WhatInvestmentSignalsDo13FFilingsReveal? #StablecoinMarketShrinksAtFastestPaceSinceTerraLuna #InvescoStablecoinReservesFundLaunchesOnEthereum
👍🔺👍Balanced take. The key isn’t predicting which scenario wins, but staying flexible and managing risk while the market confirms its direction.
$BTC
#AnthropicIPOTestsInvestorAppetiteForAI #NvidiaBoardNotConsideringHuang’sReturnasCEO #WhatInvestmentSignalsDo13FFilingsReveal? #StablecoinMarketShrinksAtFastestPaceSinceTerraLuna #InvescoStablecoinReservesFundLaunchesOnEthereum
$BTC
#AnthropicIPOTestsInvestorAppetiteForAI #NvidiaBoardNotConsideringHuang’sReturnasCEO #WhatInvestmentSignalsDo13FFilingsReveal? #StablecoinMarketShrinksAtFastestPaceSinceTerraLuna #InvescoStablecoinReservesFundLaunchesOnEthereum

Jessica Elizabeth
·
--
𝐒𝐓𝐎𝐏..... 𝐒𝐓𝐎𝐏..... 𝐒𝐓𝐎𝐏 🚨
$BTC BUY BTC — BUT STAY READY FOR ANYTHING!
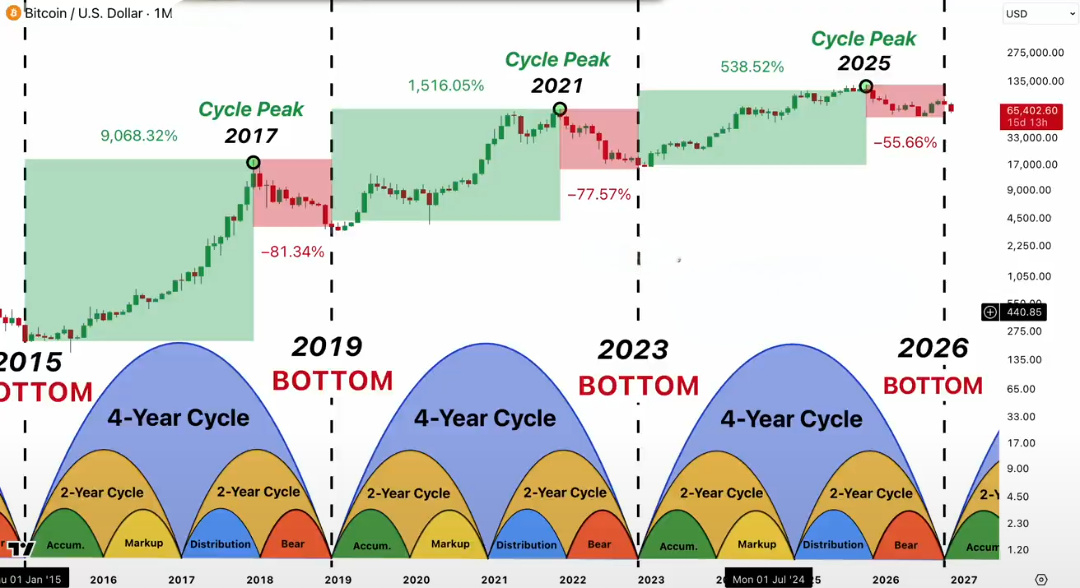
Just 6 weeks ago, everyone was calling for a cycle bottom. Now Bitcoin is facing another brutal correction.
I see two possible outcomes:
SCENARIO 1: BULL MARKET SURVIVES 📈
This is a major shakeout before BTC resumes its upward trend. The current dip could become a massive accumulation opportunity.
SCENARIO 2: THE 4-YEAR CYCLE BREAKS 📉
BTC fails to recover, breaks below the expected bottom, and enters a deeper bear market.
MY STRATEGY?
I'm accumulating gradually either way.
If the bull market survives, I'll be positioned for the next rally.
If the bear market deepens, I'll keep cash ready to buy at lower levels.
The next few weeks could define Bitcoin's direction.
Stay patient. Stay prepared. Never risk more than you can afford to lose.
#BitcoinActiveSupplyInProfitDropsBelow45%
#WhatWillDriveCryptoandStocks’NextRebound?
$BTC BUY BTC — BUT STAY READY FOR ANYTHING!
Just 6 weeks ago, everyone was calling for a cycle bottom. Now Bitcoin is facing another brutal correction.
I see two possible outcomes:
SCENARIO 1: BULL MARKET SURVIVES 📈
This is a major shakeout before BTC resumes its upward trend. The current dip could become a massive accumulation opportunity.
SCENARIO 2: THE 4-YEAR CYCLE BREAKS 📉
BTC fails to recover, breaks below the expected bottom, and enters a deeper bear market.
MY STRATEGY?
I'm accumulating gradually either way.
If the bull market survives, I'll be positioned for the next rally.
If the bear market deepens, I'll keep cash ready to buy at lower levels.
The next few weeks could define Bitcoin's direction.
Stay patient. Stay prepared. Never risk more than you can afford to lose.
#BitcoinActiveSupplyInProfitDropsBelow45%
#WhatWillDriveCryptoandStocks’NextRebound?
12
Войдите, чтобы посмотреть больше материала
Присоединяйтесь к пользователям криптовалют по всему миру на Binance Square
⚡️ Получайте новейшую и полезную информацию о криптоактивах.
💬 Нам доверяет крупнейшая в мире криптобиржа.
👍 Получите достоверные аналитические данные от верифицированных создателей контента.
Эл. почта/номер телефона
В тренде
1
#A Packed Week of Earnings and Data Tests Markets
Просмотров: 75,592
468 обсуждают
2
#AnthropicIPOTestsInvestorAppetiteForAI
Просмотров: 146,950
1,595 обсуждают
3
#NvidiaBoardNotConsideringHuang’sReturnasCEO
Просмотров: 7,865
141 обсуждают
4
#WhatInvestmentSignalsDo13FFilingsReveal?
Просмотров: 4,861
101 обсуждают
5
#InvescoStablecoinReservesFundLaunchesOnEthereum
Просмотров: 1,471
47 обсуждают
6
#CypherpunkReports$306MQ3NetProfit
Просмотров: 559
9 обсуждают
7
#OPTIMJACKAttackInfectsAtLeast186Websites
Просмотров: 3,587
74 обсуждают
8
#StrategySells2.09MMSTRSharesFor$244.7M
Просмотров: 1,790
17 обсуждают
9
#StablecoinMarketShrinksAtFastestPaceSinceTerraLuna
Просмотров: 5,039
53 обсуждают
10
#BitcoinExtendsLosingStreakToSixWeeks
Просмотров: 114,199
817 обсуждают