
#strategysells2.09mmstrsharesfor$244.7m
strategysells2.09mmstrsharesfor$244.7m
Популярные
Новые

·
--
Strategy bought 485 BTC. It spent 7x more on its own preferred shares.
The headline reads "Saylor buys the dip." The 8-K reads differently (week of Nov 9-15, per Cryptopolitan's summary of the filing):
• $33.4M went into 485 $BTC, at about $68,887 average
• $228.1M went to buying back STRC preferred stock
• All of it was funded by $244.7M of new MSTR share sales
Add MSCI dropping Strategy from its USA Index after the Nov 30 close, and that buyback looks like defending a funding channel more than an accumulation signal. Lookonchain data also shows public companies net sold 11,647 BTC in the week to Nov 8.
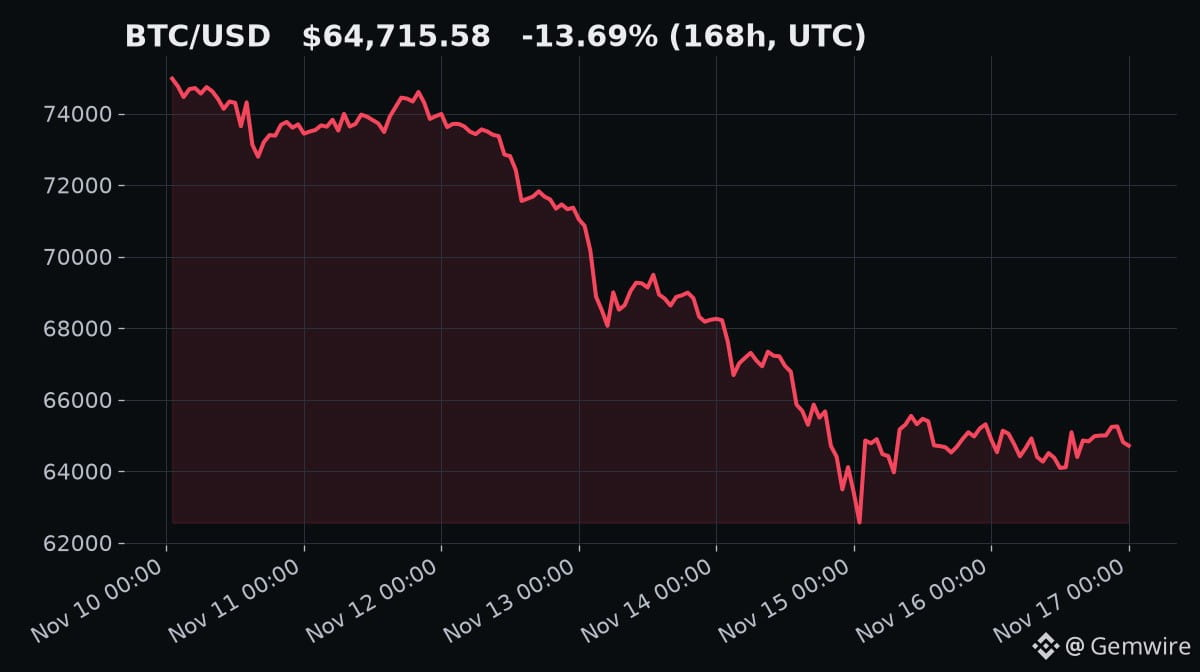
My read: the marginal corporate buyer is smaller than the headlines suggest. BTC is at $64,716, -13.69% over 7 days (Coinbase candles).
What would change my mind: STRC trading back near par, so share sales fund coins again. Do you read this as dip-buying or balance-sheet triage?
Not financial advice.
Disclosure: I may earn Write to Earn commissions if you trade via cashtags here.
#Bitcoin #Strategy #MSCI
Strategy bought 485 BTC. It spent 7x more on its own preferred shares.
The headline reads "Saylor buys the dip." The 8-K reads differently (week of Nov 9-15, per Cryptopolitan's summary of the filing):
• $33.4M went into 485 $BTC , at about $68,887 average
• $228.1M went to buying back STRC preferred stock
• All of it was funded by $244.7M of new MSTR share sales
Add MSCI dropping Strategy from its USA Index after the Nov 30 close, and that buyback looks like defending a funding channel more than an accumulation signal. Lookonchain data also shows public companies net sold 11,647 BTC in the week to Nov 8.
My read: the marginal corporate buyer is smaller than the headlines suggest. BTC is at $64,716, -13.69% over 7 days (Coinbase candles).
What would change my mind: STRC trading back near par, so share sales fund coins again. Do you read this as dip-buying or balance-sheet triage?
Not financial advice.
Disclosure: I may earn Write to Earn commissions if you trade via cashtags here.
#Bitcoin #Strategy #MSCI
The headline reads "Saylor buys the dip." The 8-K reads differently (week of Nov 9-15, per Cryptopolitan's summary of the filing):
• $33.4M went into 485 $BTC , at about $68,887 average
• $228.1M went to buying back STRC preferred stock
• All of it was funded by $244.7M of new MSTR share sales
Add MSCI dropping Strategy from its USA Index after the Nov 30 close, and that buyback looks like defending a funding channel more than an accumulation signal. Lookonchain data also shows public companies net sold 11,647 BTC in the week to Nov 8.
My read: the marginal corporate buyer is smaller than the headlines suggest. BTC is at $64,716, -13.69% over 7 days (Coinbase candles).
What would change my mind: STRC trading back near par, so share sales fund coins again. Do you read this as dip-buying or balance-sheet triage?
Not financial advice.
Disclosure: I may earn Write to Earn commissions if you trade via cashtags here.
#Bitcoin #Strategy #MSCI
1
2.9k

·
--

Статья
🟠📉 Strategy Bought 485 BTC but Spent 7x More on Its Own Preferred Shares: Dip-Buying or Balance-.#StrategySells2.09MMSTRSharesFor$244.7M
The headline reads "Saylor buys the dip." 🗞️ The filing tells a more complicated story. Strategy (MSTR), the world's largest corporate Bitcoin holder, reportedly added **485 BTC** last week but spent far more repurchasing its own preferred stock. 💸 Here is what the numbers say, why it matters, and what to watch next. 👀
## 📊 The Numbers From the Latest Filing
According to a summary of the 8-K for **November 9–15** (cited in the post you shared), the key figures were: 🧾
- 🪙 **$33.4 million** went into **485 BTC** at an average of about **$68,887** per coin.
- 🔁 **$228.1 million** went to buying back **STRC** preferred stock, nearly **7 times** the Bitcoin spend.
- 💵 **$244.7 million** of new **MSTR** common shares were sold to fund it all.
I couldn't independently confirm these exact figures from the filing itself, so check the 8-K before publishing. ⚠️ The pattern, however, matches what Strategy reported in earlier weeks. 📉
## 🔁 This Is Not a One-Week Pattern
- 📅 **Week of Oct 26–Nov 1:** Strategy bought 811 BTC for about $65.5M but repurchased **$208.2M of STRC**, more than triple its Bitcoin spend.
- 📅 **Week of Nov 2–8:** It bought 1,036 BTC (about $82M) while spending **$188.3M on STRC** repurchases.
- 📅 **Oct 1–25:** About **$664M** went to STRC buybacks versus roughly **$72M** in Bitcoin purchases.
Strategy has also sold some Bitcoin this year. One analysis counted about 6,948 BTC sold in 2026, mainly to fund preferred dividends and STRC buybacks. 🔄 Holdings were about **850,000 BTC** as of early November. 🏦
## 🧠 What Is STRC, and Why Does It Matter?
STRC is Strategy's **variable-rate perpetual preferred stock**, designed to trade near its **$100 par value**. 💳 The company has kept the dividend at **12%** to support that price. Strategy's policy is **not to issue new STRC below $100**, so when STRC trades under par, the company can't easily raise money by selling it. 🚧 STRC was about $99.22 in early November. 📉
That makes the buybacks significant. ⚖️ By repurchasing STRC, Strategy may be:
1. 🛡️ **Defending the price** so STRC can trade near par again.
2. 🔓 **Protecting a funding channel** that has helped pay for Bitcoin purchases and dividends.
3. 💸 **Reducing outstanding preferred obligations**, which carry heavy dividend costs.
## 🏛️ The MSCI Factor
Another big pressure point: **MSCI will remove Strategy from its USA Index at the close of November 30.** 📆 MSCI reportedly classified the company as a "non-operating" issuer under a new screen, which also takes it out of the MSCI World and ACWI indexes. Metaplanet was dropped from a Japan small-cap index in the same review. 🌍
- 🧮 JPMorgan estimated that exclusion could mean about **$2.8 billion** of passive selling, and up to **$8.8 billion more** if other index providers follow. These estimates were made earlier, so the real impact may differ.
- ✅ A removal does **not** delist the stock, and nothing forces Strategy to sell Bitcoin. The pressure lands on the shares and the premium the company uses to fund purchases. 📉
## 🏢 The Wider Market Backdrop
The post also cites Lookonchain data saying public companies **net sold 11,647 BTC** in the week to November 8. I couldn't verify that figure, so treat it as unconfirmed. 🕵️ Still, other treasury firms have also slowed purchases this year. 🐢
Meanwhile, Bitcoin itself is weak. 📉 The post notes BTC near **$64,716**, down about **13.7% over 7 days**. That is below Strategy's overall average purchase price of roughly **$75,450 per BTC**, so the company's Bitcoin stack is currently showing a paper loss. 😬
## ⚖️ Two Ways to Read It
**🐂 The "dip-buying" view**
- Strategy kept buying BTC even in a falling market.
- It bought 485 BTC at roughly $68,887, and holdings keep growing.
- Supporters see this as evidence of long-term conviction. 💎
**🐻 The "balance-sheet triage" view**
- The money spent on preferred buybacks dwarfed the Bitcoin purchase.
- New common shares were sold to fund the buybacks, which dilutes common shareholders.
- With the MSCI removal approaching, the buybacks look like protecting funding more than accumulating coins. 🚑
Both views can be partly true. The company may be buying Bitcoin while also managing a tricky capital structure. 🧩
## 🔭 What Would Change the Picture?
- 📈 **STRC returning near $100 par**, so new preferred sales can fund Bitcoin again, as the post suggests.
- 🗓️ **How MSTR trades around the November 30 MSCI deadline.**
- 🧾 **Whether weekly 8-K filings show Bitcoin purchases growing** compared with buybacks.
- 🌐 **Bitcoin's price**, since a rebound would ease pressure on the whole structure.
## ⚠️ Risks to Keep in Mind
- 🔗 MSTR trades like a leveraged bet on Bitcoin, so moves can be sharp in both directions.
- 🧱 Funding relies on capital markets staying open and share prices staying healthy.
- 💥 Dividend obligations on preferred stock are a recurring cash cost.
- 🌪️ Index removals can create temporary selling pressure and lower liquidity.
## 🎯 Final Thoughts
A weekly Bitcoin purchase makes a great headline, but the real story is where the money went. 💡 The "marginal corporate buyer" may be smaller than it looks, and the company's attention appears focused on defending its funding machine as much as stacking coins. 🏗️ Whether you see dip-buying or triage, watch the filings, STRC's price, and the MSCI deadline, and don't trade on headlines alone. 🧠💪
#StablecoinMarketShrinksAtFastestPaceSinceTerraLuna #BitcoinExtendsLosingStreakToSixWeeks #XRPFallsTo$0.89LowestSinceNovember2024 #A Packed Week of Earnings and Data Tests Markets
*⚠️
**** #Strategy #MSTR #Bitcoin #MichaelSaylor #STRC
🟠📉 Strategy Bought 485 BTC but Spent 7x More on Its Own Preferred Shares: Dip-Buying or Balance-.
#StrategySells2.09MMSTRSharesFor$244.7M
The headline reads "Saylor buys the dip." 🗞️ The filing tells a more complicated story. Strategy (MSTR), the world's largest corporate Bitcoin holder, reportedly added **485 BTC** last week but spent far more repurchasing its own preferred stock. 💸 Here is what the numbers say, why it matters, and what to watch next. 👀
## 📊 The Numbers From the Latest Filing
According to a summary of the 8-K for **November 9–15** (cited in the post you shared), the key figures were: 🧾
- 🪙 **$33.4 million** went into **485 BTC** at an average of about **$68,887** per coin.
- 🔁 **$228.1 million** went to buying back **STRC** preferred stock, nearly **7 times** the Bitcoin spend.
- 💵 **$244.7 million** of new **MSTR** common shares were sold to fund it all.
I couldn't independently confirm these exact figures from the filing itself, so check the 8-K before publishing. ⚠️ The pattern, however, matches what Strategy reported in earlier weeks. 📉
## 🔁 This Is Not a One-Week Pattern
- 📅 **Week of Oct 26–Nov 1:** Strategy bought 811 BTC for about $65.5M but repurchased **$208.2M of STRC**, more than triple its Bitcoin spend.
- 📅 **Week of Nov 2–8:** It bought 1,036 BTC (about $82M) while spending **$188.3M on STRC** repurchases.
- 📅 **Oct 1–25:** About **$664M** went to STRC buybacks versus roughly **$72M** in Bitcoin purchases.
Strategy has also sold some Bitcoin this year. One analysis counted about 6,948 BTC sold in 2026, mainly to fund preferred dividends and STRC buybacks. 🔄 Holdings were about **850,000 BTC** as of early November. 🏦
## 🧠 What Is STRC, and Why Does It Matter?
STRC is Strategy's **variable-rate perpetual preferred stock**, designed to trade near its **$100 par value**. 💳 The company has kept the dividend at **12%** to support that price. Strategy's policy is **not to issue new STRC below $100**, so when STRC trades under par, the company can't easily raise money by selling it. 🚧 STRC was about $99.22 in early November. 📉
That makes the buybacks significant. ⚖️ By repurchasing STRC, Strategy may be:
1. 🛡️ **Defending the price** so STRC can trade near par again.
2. 🔓 **Protecting a funding channel** that has helped pay for Bitcoin purchases and dividends.
3. 💸 **Reducing outstanding preferred obligations**, which carry heavy dividend costs.
## 🏛️ The MSCI Factor
Another big pressure point: **MSCI will remove Strategy from its USA Index at the close of November 30.** 📆 MSCI reportedly classified the company as a "non-operating" issuer under a new screen, which also takes it out of the MSCI World and ACWI indexes. Metaplanet was dropped from a Japan small-cap index in the same review. 🌍
- 🧮 JPMorgan estimated that exclusion could mean about **$2.8 billion** of passive selling, and up to **$8.8 billion more** if other index providers follow. These estimates were made earlier, so the real impact may differ.
- ✅ A removal does **not** delist the stock, and nothing forces Strategy to sell Bitcoin. The pressure lands on the shares and the premium the company uses to fund purchases. 📉
## 🏢 The Wider Market Backdrop
The post also cites Lookonchain data saying public companies **net sold 11,647 BTC** in the week to November 8. I couldn't verify that figure, so treat it as unconfirmed. 🕵️ Still, other treasury firms have also slowed purchases this year. 🐢
Meanwhile, Bitcoin itself is weak. 📉 The post notes BTC near **$64,716**, down about **13.7% over 7 days**. That is below Strategy's overall average purchase price of roughly **$75,450 per BTC**, so the company's Bitcoin stack is currently showing a paper loss. 😬
## ⚖️ Two Ways to Read It
**🐂 The "dip-buying" view**
- Strategy kept buying BTC even in a falling market.
- It bought 485 BTC at roughly $68,887, and holdings keep growing.
- Supporters see this as evidence of long-term conviction. 💎
**🐻 The "balance-sheet triage" view**
- The money spent on preferred buybacks dwarfed the Bitcoin purchase.
- New common shares were sold to fund the buybacks, which dilutes common shareholders.
- With the MSCI removal approaching, the buybacks look like protecting funding more than accumulating coins. 🚑
Both views can be partly true. The company may be buying Bitcoin while also managing a tricky capital structure. 🧩
## 🔭 What Would Change the Picture?
- 📈 **STRC returning near $100 par**, so new preferred sales can fund Bitcoin again, as the post suggests.
- 🗓️ **How MSTR trades around the November 30 MSCI deadline.**
- 🧾 **Whether weekly 8-K filings show Bitcoin purchases growing** compared with buybacks.
- 🌐 **Bitcoin's price**, since a rebound would ease pressure on the whole structure.
## ⚠️ Risks to Keep in Mind
- 🔗 MSTR trades like a leveraged bet on Bitcoin, so moves can be sharp in both directions.
- 🧱 Funding relies on capital markets staying open and share prices staying healthy.
- 💥 Dividend obligations on preferred stock are a recurring cash cost.
- 🌪️ Index removals can create temporary selling pressure and lower liquidity.
## 🎯 Final Thoughts
A weekly Bitcoin purchase makes a great headline, but the real story is where the money went. 💡 The "marginal corporate buyer" may be smaller than it looks, and the company's attention appears focused on defending its funding machine as much as stacking coins. 🏗️ Whether you see dip-buying or triage, watch the filings, STRC's price, and the MSCI deadline, and don't trade on headlines alone. 🧠💪
#StablecoinMarketShrinksAtFastestPaceSinceTerraLuna #BitcoinExtendsLosingStreakToSixWeeks #XRPFallsTo$0.89LowestSinceNovember2024 #A Packed Week of Earnings and Data Tests Markets
*⚠️
**** #Strategy #MSTR #Bitcoin #MichaelSaylor #STRC
The headline reads "Saylor buys the dip." 🗞️ The filing tells a more complicated story. Strategy (MSTR), the world's largest corporate Bitcoin holder, reportedly added **485 BTC** last week but spent far more repurchasing its own preferred stock. 💸 Here is what the numbers say, why it matters, and what to watch next. 👀
## 📊 The Numbers From the Latest Filing
According to a summary of the 8-K for **November 9–15** (cited in the post you shared), the key figures were: 🧾
- 🪙 **$33.4 million** went into **485 BTC** at an average of about **$68,887** per coin.
- 🔁 **$228.1 million** went to buying back **STRC** preferred stock, nearly **7 times** the Bitcoin spend.
- 💵 **$244.7 million** of new **MSTR** common shares were sold to fund it all.
I couldn't independently confirm these exact figures from the filing itself, so check the 8-K before publishing. ⚠️ The pattern, however, matches what Strategy reported in earlier weeks. 📉
## 🔁 This Is Not a One-Week Pattern
- 📅 **Week of Oct 26–Nov 1:** Strategy bought 811 BTC for about $65.5M but repurchased **$208.2M of STRC**, more than triple its Bitcoin spend.
- 📅 **Week of Nov 2–8:** It bought 1,036 BTC (about $82M) while spending **$188.3M on STRC** repurchases.
- 📅 **Oct 1–25:** About **$664M** went to STRC buybacks versus roughly **$72M** in Bitcoin purchases.
Strategy has also sold some Bitcoin this year. One analysis counted about 6,948 BTC sold in 2026, mainly to fund preferred dividends and STRC buybacks. 🔄 Holdings were about **850,000 BTC** as of early November. 🏦
## 🧠 What Is STRC, and Why Does It Matter?
STRC is Strategy's **variable-rate perpetual preferred stock**, designed to trade near its **$100 par value**. 💳 The company has kept the dividend at **12%** to support that price. Strategy's policy is **not to issue new STRC below $100**, so when STRC trades under par, the company can't easily raise money by selling it. 🚧 STRC was about $99.22 in early November. 📉
That makes the buybacks significant. ⚖️ By repurchasing STRC, Strategy may be:
1. 🛡️ **Defending the price** so STRC can trade near par again.
2. 🔓 **Protecting a funding channel** that has helped pay for Bitcoin purchases and dividends.
3. 💸 **Reducing outstanding preferred obligations**, which carry heavy dividend costs.
## 🏛️ The MSCI Factor
Another big pressure point: **MSCI will remove Strategy from its USA Index at the close of November 30.** 📆 MSCI reportedly classified the company as a "non-operating" issuer under a new screen, which also takes it out of the MSCI World and ACWI indexes. Metaplanet was dropped from a Japan small-cap index in the same review. 🌍
- 🧮 JPMorgan estimated that exclusion could mean about **$2.8 billion** of passive selling, and up to **$8.8 billion more** if other index providers follow. These estimates were made earlier, so the real impact may differ.
- ✅ A removal does **not** delist the stock, and nothing forces Strategy to sell Bitcoin. The pressure lands on the shares and the premium the company uses to fund purchases. 📉
## 🏢 The Wider Market Backdrop
The post also cites Lookonchain data saying public companies **net sold 11,647 BTC** in the week to November 8. I couldn't verify that figure, so treat it as unconfirmed. 🕵️ Still, other treasury firms have also slowed purchases this year. 🐢
Meanwhile, Bitcoin itself is weak. 📉 The post notes BTC near **$64,716**, down about **13.7% over 7 days**. That is below Strategy's overall average purchase price of roughly **$75,450 per BTC**, so the company's Bitcoin stack is currently showing a paper loss. 😬
## ⚖️ Two Ways to Read It
**🐂 The "dip-buying" view**
- Strategy kept buying BTC even in a falling market.
- It bought 485 BTC at roughly $68,887, and holdings keep growing.
- Supporters see this as evidence of long-term conviction. 💎
**🐻 The "balance-sheet triage" view**
- The money spent on preferred buybacks dwarfed the Bitcoin purchase.
- New common shares were sold to fund the buybacks, which dilutes common shareholders.
- With the MSCI removal approaching, the buybacks look like protecting funding more than accumulating coins. 🚑
Both views can be partly true. The company may be buying Bitcoin while also managing a tricky capital structure. 🧩
## 🔭 What Would Change the Picture?
- 📈 **STRC returning near $100 par**, so new preferred sales can fund Bitcoin again, as the post suggests.
- 🗓️ **How MSTR trades around the November 30 MSCI deadline.**
- 🧾 **Whether weekly 8-K filings show Bitcoin purchases growing** compared with buybacks.
- 🌐 **Bitcoin's price**, since a rebound would ease pressure on the whole structure.
## ⚠️ Risks to Keep in Mind
- 🔗 MSTR trades like a leveraged bet on Bitcoin, so moves can be sharp in both directions.
- 🧱 Funding relies on capital markets staying open and share prices staying healthy.
- 💥 Dividend obligations on preferred stock are a recurring cash cost.
- 🌪️ Index removals can create temporary selling pressure and lower liquidity.
## 🎯 Final Thoughts
A weekly Bitcoin purchase makes a great headline, but the real story is where the money went. 💡 The "marginal corporate buyer" may be smaller than it looks, and the company's attention appears focused on defending its funding machine as much as stacking coins. 🏗️ Whether you see dip-buying or triage, watch the filings, STRC's price, and the MSCI deadline, and don't trade on headlines alone. 🧠💪
#StablecoinMarketShrinksAtFastestPaceSinceTerraLuna #BitcoinExtendsLosingStreakToSixWeeks #XRPFallsTo$0.89LowestSinceNovember2024 #A Packed Week of Earnings and Data Tests Markets
*⚠️
**** #Strategy #MSTR #Bitcoin #MichaelSaylor #STRC
107

·
--
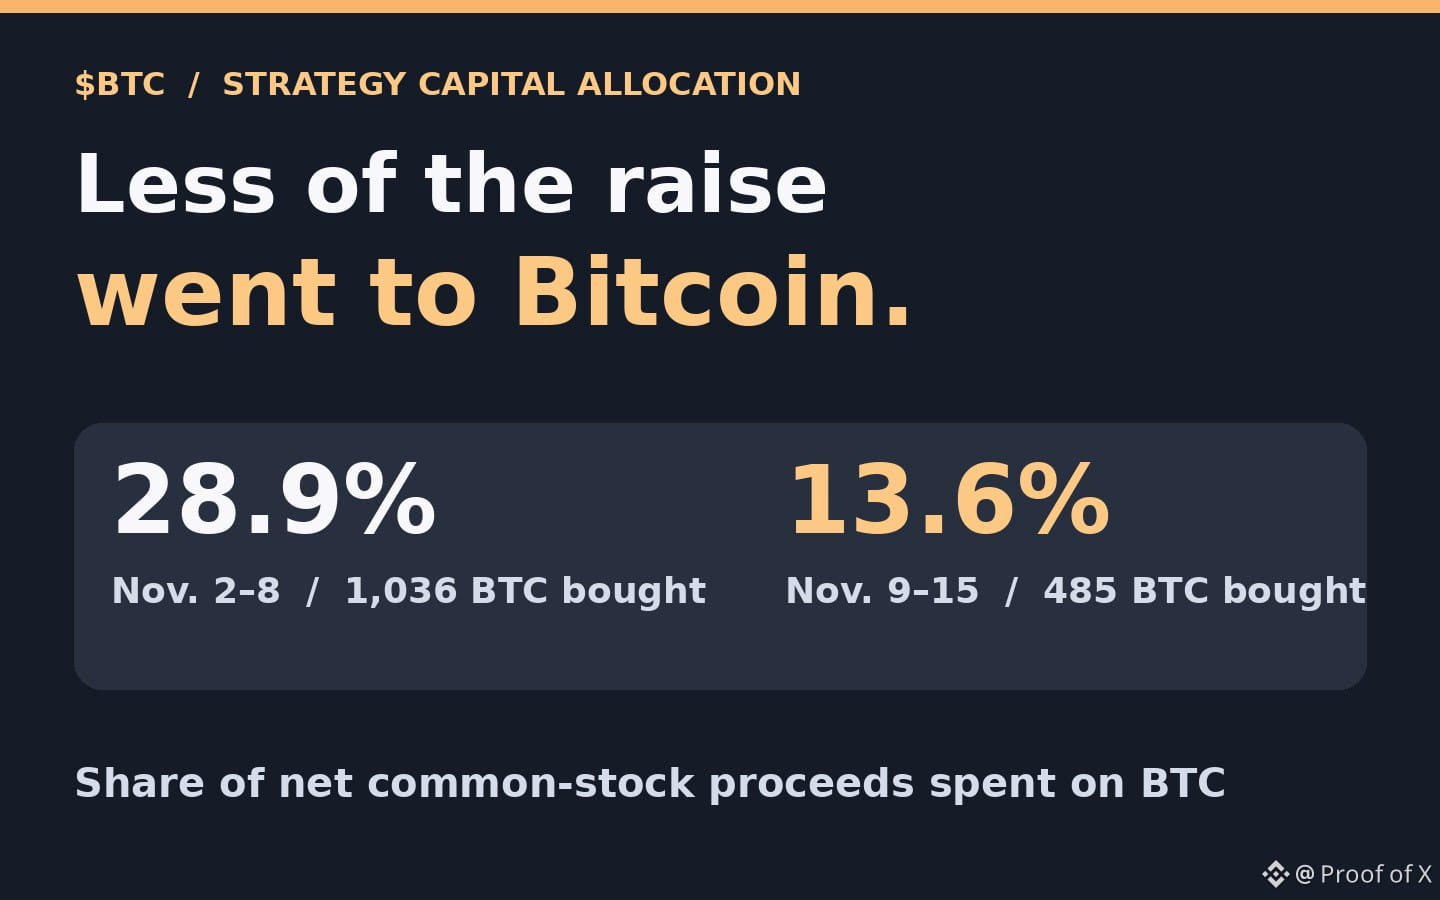
📉 TL;DR: Strategy put 13.6% of $244.7M in net common-stock proceeds into $BTC in Nov. 9–15, down from 28.9% a week earlier. It still bought 485 BTC, but that was a weaker demand contribution from this buyer.
Strategy’s Nov. 16 filing shows where its $244.7M in net common-stock proceeds went in Nov. 9–15: $33.4M bought 485 BTC, $206.3M went toward repurchasing STRC preferred stock, and $5M went to cash. The prior week, $81.9M of $283.8M went to Bitcoin, buying 1,036 BTC. So the Bitcoin allocation fell from 28.9% to 13.6%, and the number of coins bought fell 53%.
Investors bought newly issued MSTR common shares. Strategy spent most of the proceeds repurchasing a different security, its STRC preferred stock, rather than buying Bitcoin. The total STRC repurchase was $228.1M: in addition to the $206.3M from share sales, Strategy used $21.8M of interest earned on cash and short-term investments.
Strategy still added Bitcoin, taking disclosed holdings to 850,849 BTC as of Nov. 15. The preferred-stock repurchase does not itself indicate a Bitcoin sale. This is one company’s allocation over two weeks, so it says little about aggregate market demand or where price goes next.
My take: Cautious on this source of near-term demand. Track Bitcoin bought and Bitcoin spend as a share of net common-stock proceeds each week. I’d reweight the demand signal if both recover for several consecutive filings.
NFA. DYOR.
📉 TL;DR: Strategy put 13.6% of $244.7M in net common-stock proceeds into $BTC in Nov. 9–15, down from 28.9% a week earlier. It still bought 485 BTC, but that was a weaker demand contribution from this buyer.
Strategy’s Nov. 16 filing shows where its $244.7M in net common-stock proceeds went in Nov. 9–15: $33.4M bought 485 BTC, $206.3M went toward repurchasing STRC preferred stock, and $5M went to cash. The prior week, $81.9M of $283.8M went to Bitcoin, buying 1,036 BTC. So the Bitcoin allocation fell from 28.9% to 13.6%, and the number of coins bought fell 53%.
Investors bought newly issued MSTR common shares. Strategy spent most of the proceeds repurchasing a different security, its STRC preferred stock, rather than buying Bitcoin. The total STRC repurchase was $228.1M: in addition to the $206.3M from share sales, Strategy used $21.8M of interest earned on cash and short-term investments.
Strategy still added Bitcoin, taking disclosed holdings to 850,849 BTC as of Nov. 15. The preferred-stock repurchase does not itself indicate a Bitcoin sale. This is one company’s allocation over two weeks, so it says little about aggregate market demand or where price goes next.
My take: Cautious on this source of near-term demand. Track Bitcoin bought and Bitcoin spend as a share of net common-stock proceeds each week. I’d reweight the demand signal if both recover for several consecutive filings.
NFA. DYOR.
Strategy’s Nov. 16 filing shows where its $244.7M in net common-stock proceeds went in Nov. 9–15: $33.4M bought 485 BTC, $206.3M went toward repurchasing STRC preferred stock, and $5M went to cash. The prior week, $81.9M of $283.8M went to Bitcoin, buying 1,036 BTC. So the Bitcoin allocation fell from 28.9% to 13.6%, and the number of coins bought fell 53%.
Investors bought newly issued MSTR common shares. Strategy spent most of the proceeds repurchasing a different security, its STRC preferred stock, rather than buying Bitcoin. The total STRC repurchase was $228.1M: in addition to the $206.3M from share sales, Strategy used $21.8M of interest earned on cash and short-term investments.
Strategy still added Bitcoin, taking disclosed holdings to 850,849 BTC as of Nov. 15. The preferred-stock repurchase does not itself indicate a Bitcoin sale. This is one company’s allocation over two weeks, so it says little about aggregate market demand or where price goes next.
My take: Cautious on this source of near-term demand. Track Bitcoin bought and Bitcoin spend as a share of net common-stock proceeds each week. I’d reweight the demand signal if both recover for several consecutive filings.
NFA. DYOR.
1
221


> MSTR SELLS 2.09M CLASS A SHARES FOR $244.7M NET PROCEEDS AND BUYS 485 BITCOIN FOR $33.4M AT $68,887 AVG AND REPURCHASES $228.1M OF STRC STOCK: SEC FILING
> STRATEGY HOLDS 850,849 BITCOIN AND $4.75B USD RESERVE AND $151.2M USD CASH AS OF NOV. 15: SEC FILING
> $MSTR
#MSTR
> MSTR SELLS 2.09M CLASS A SHARES FOR $244.7M NET PROCEEDS AND BUYS 485 BITCOIN FOR $33.4M AT $68,887 AVG AND REPURCHASES $228.1M OF STRC STOCK: SEC FILING
> STRATEGY HOLDS 850,849 BITCOIN AND $4.75B USD RESERVE AND $151.2M USD CASH AS OF NOV. 15: SEC FILING
> $MSTR
#MSTR
> STRATEGY HOLDS 850,849 BITCOIN AND $4.75B USD RESERVE AND $151.2M USD CASH AS OF NOV. 15: SEC FILING
> $MSTR
#MSTR
1
6

·
--
Падение
Проверено
#StrategySells2.09MMSTRSharesFor$244.7M
Strategy đã bắt đầu xả MSTR trước ngày 30/11?
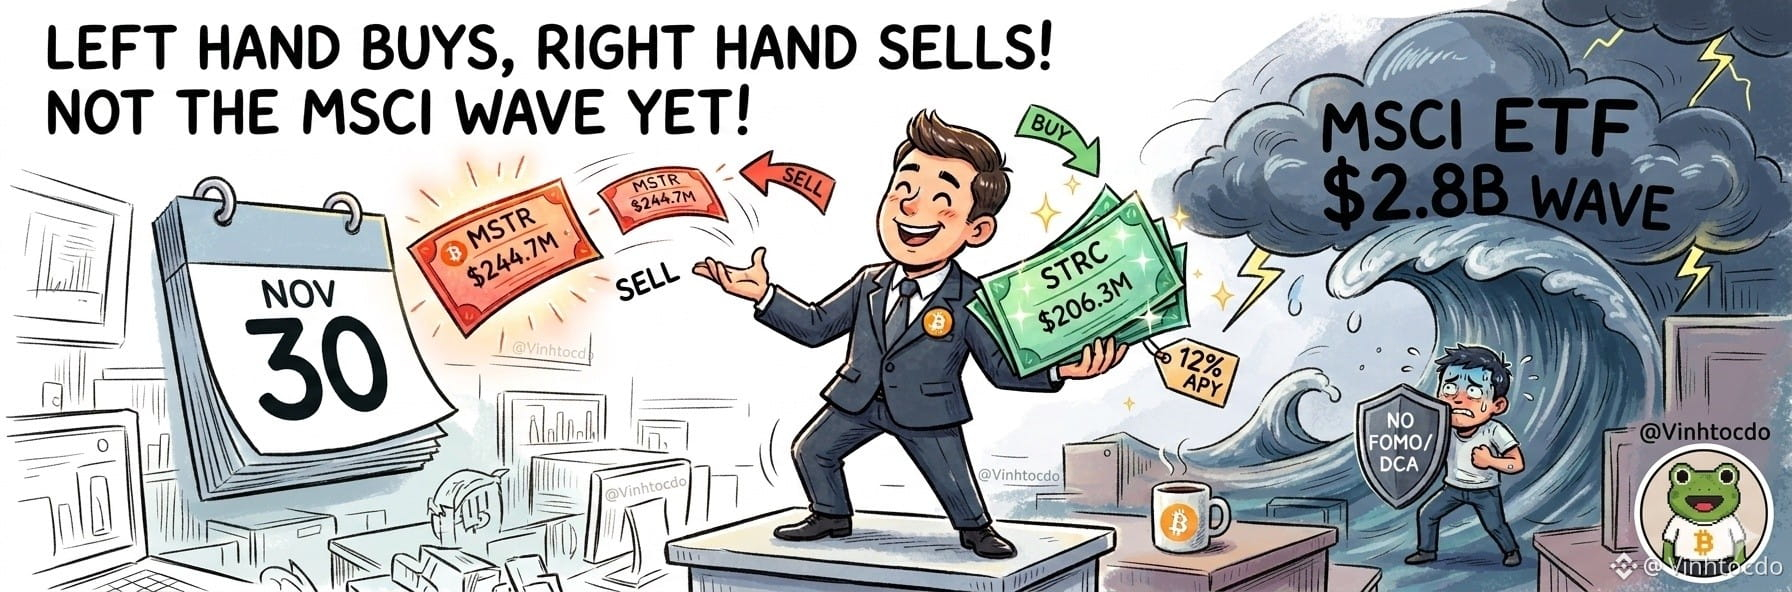
Anh em đừng nhầm nha! 😅 Vụ #Strategy bán 2,09 triệu cổ phiếu #MSTR thu 244,7 triệu USD KHÔNG PHẢI là quỹ ETF MSCI xả hàng trước hạn 30/11 (gói 2,8 tỷ đô) đâu!
Đây là chiêu "tay phải bán MSTR, tay trái gom STRC" (206,3 triệu USD) của Strategy để giữ giá cổ phiếu ưu đãi quanh $100 và duy trì cổ tức 12%/năm. Tóm lại là tự cơ cấu vốn nội bộ, chứ áp lực xả hàng từ #MSCI vẫn đang chờ phía trước đó!
Trader làm gì? Đừng vội FOMO bắt đáy kẻo dính sóng xả ETF cuối tháng. Cứ bình tĩnh quan sát, chia vốn DCA và quản lý rủi ro thật chặt nhé!
⚠️ Đây không phải lời khuyên tài chính.
Click giao dịch bên dưới để ủng hộ tôi:
$BTC
{spot}(BTCUSDT)
$ETH
{spot}(ETHUSDT)
$EVAA
{future}(EVAAUSDT)
#TradingTips #Altcoins #MarketAnalysis #VINHTOCDO
#StrategySells2.09MMSTRSharesFor$244.7M
Strategy đã bắt đầu xả MSTR trước ngày 30/11?
Anh em đừng nhầm nha! 😅 Vụ #Strategy bán 2,09 triệu cổ phiếu #MSTR thu 244,7 triệu USD KHÔNG PHẢI là quỹ ETF MSCI xả hàng trước hạn 30/11 (gói 2,8 tỷ đô) đâu!
Đây là chiêu "tay phải bán MSTR, tay trái gom STRC" (206,3 triệu USD) của Strategy để giữ giá cổ phiếu ưu đãi quanh $100 và duy trì cổ tức 12%/năm. Tóm lại là tự cơ cấu vốn nội bộ, chứ áp lực xả hàng từ #MSCI vẫn đang chờ phía trước đó!
Trader làm gì? Đừng vội FOMO bắt đáy kẻo dính sóng xả ETF cuối tháng. Cứ bình tĩnh quan sát, chia vốn DCA và quản lý rủi ro thật chặt nhé!
⚠️ Đây không phải lời khuyên tài chính.
Click giao dịch bên dưới để ủng hộ tôi:
$BTC
$ETH
$EVAA
#TradingTips #Altcoins #MarketAnalysis #VINHTOCDO
Strategy đã bắt đầu xả MSTR trước ngày 30/11?
Anh em đừng nhầm nha! 😅 Vụ #Strategy bán 2,09 triệu cổ phiếu #MSTR thu 244,7 triệu USD KHÔNG PHẢI là quỹ ETF MSCI xả hàng trước hạn 30/11 (gói 2,8 tỷ đô) đâu!
Đây là chiêu "tay phải bán MSTR, tay trái gom STRC" (206,3 triệu USD) của Strategy để giữ giá cổ phiếu ưu đãi quanh $100 và duy trì cổ tức 12%/năm. Tóm lại là tự cơ cấu vốn nội bộ, chứ áp lực xả hàng từ #MSCI vẫn đang chờ phía trước đó!
Trader làm gì? Đừng vội FOMO bắt đáy kẻo dính sóng xả ETF cuối tháng. Cứ bình tĩnh quan sát, chia vốn DCA và quản lý rủi ro thật chặt nhé!
⚠️ Đây không phải lời khuyên tài chính.
Click giao dịch bên dưới để ủng hộ tôi:
$BTC
$ETH
$EVAA
#TradingTips #Altcoins #MarketAnalysis #VINHTOCDO
5
981

·
--
Hello guys please like my posts and follow me🙈🌹✌🏻
$MSFTB $NVDAB $AMZNB #StablecoinMarketShrinksAtFastestPaceSinceTerraLuna #StrategySells2.09MMSTRSharesFor$244.7M #OPTIMJACKAttackInfectsAtLeast186Websites #CypherpunkReports$306MQ3NetProfit #InvescoStablecoinReservesFundLaunchesOnEthereum
Hello guys please like my posts and follow me🙈🌹✌🏻
$MSFTB $NVDAB $AMZNB #StablecoinMarketShrinksAtFastestPaceSinceTerraLuna #StrategySells2.09MMSTRSharesFor$244.7M #OPTIMJACKAttackInfectsAtLeast186Websites #CypherpunkReports$306MQ3NetProfit #InvescoStablecoinReservesFundLaunchesOnEthereum
$MSFTB $NVDAB $AMZNB #StablecoinMarketShrinksAtFastestPaceSinceTerraLuna #StrategySells2.09MMSTRSharesFor$244.7M #OPTIMJACKAttackInfectsAtLeast186Websites #CypherpunkReports$306MQ3NetProfit #InvescoStablecoinReservesFundLaunchesOnEthereum
10

·
--
CROSS/USDT Technical AnalysisThe 1-day (1D) chart for CROSS/USDT Perpetual on Binance illustrates a strong bullish breakout following a rounded bottom recovery base. Currently trading at $0.15238, the asset has posted an impressive intraday gain of +32.91%, backed by high momentum and strong buyer participation.
Price Action & Trend Structure
The daily timeframe shows that after dropping to a significant swing low of $0.09506, the asset established a solid accumulation base. From there, buyers stepped in aggressively, forming a series of higher lows that culminated in a powerful vertical expansion. The token recently touched a 24-hour high of $0.15310, while the 24-hour low is recorded at $0.11402. This aggressive upward movement reflects strong bullish conviction and a break past prior local resistance barriers.
Volume & Liquidity
Market activity has expanded rapidly during this push, registering a 24-hour trading volume of 324.12M CROSS and 44.54M USDT. The growing volume bars confirm that capital is actively flowing into the asset, supporting the continuation of the current bullish leg.
Momentum & Indicators
MACD: The Moving Average Convergence Divergence indicator reflects a strong bullish crossover and accelerating momentum. The DIF line at 0.00516 has crossed decisively above the DEA line at -0.00045, accompanied by expanding green histogram bars (MACD: 0.00561).
Support & Resistance: Immediate support is established near the $0.14323 and $0.13046 structural zones. If the price maintains momentum above these levels, it could target further price discovery beyond the $0.15601 resistance level.
Conclusion
CROSS is exhibiting strong bullish momentum on the daily chart. However, due to the steep vertical nature of the rally, traders should monitor key support levels closely and manage risk effectively to guard against potential short-term pullbacks.#cro
@Square-Creator-d3012cc964b11 #cross $CROSS #CROSSUSDT #WhatInvestmentSignalsDo13FFilingsReveal? #InvescoStablecoinReservesFundLaunchesOnEthereum #StrategySells2.09MMSTRSharesFor$244.7M
{future}(CROSSUSDT)
CROSS/USDT Technical Analysis
The 1-day (1D) chart for CROSS/USDT Perpetual on Binance illustrates a strong bullish breakout following a rounded bottom recovery base. Currently trading at $0.15238, the asset has posted an impressive intraday gain of +32.91%, backed by high momentum and strong buyer participation.
Price Action & Trend Structure
The daily timeframe shows that after dropping to a significant swing low of $0.09506, the asset established a solid accumulation base. From there, buyers stepped in aggressively, forming a series of higher lows that culminated in a powerful vertical expansion. The token recently touched a 24-hour high of $0.15310, while the 24-hour low is recorded at $0.11402. This aggressive upward movement reflects strong bullish conviction and a break past prior local resistance barriers.
Volume & Liquidity
Market activity has expanded rapidly during this push, registering a 24-hour trading volume of 324.12M CROSS and 44.54M USDT. The growing volume bars confirm that capital is actively flowing into the asset, supporting the continuation of the current bullish leg.
Momentum & Indicators
MACD: The Moving Average Convergence Divergence indicator reflects a strong bullish crossover and accelerating momentum. The DIF line at 0.00516 has crossed decisively above the DEA line at -0.00045, accompanied by expanding green histogram bars (MACD: 0.00561).
Support & Resistance: Immediate support is established near the $0.14323 and $0.13046 structural zones. If the price maintains momentum above these levels, it could target further price discovery beyond the $0.15601 resistance level.
Conclusion
CROSS is exhibiting strong bullish momentum on the daily chart. However, due to the steep vertical nature of the rally, traders should monitor key support levels closely and manage risk effectively to guard against potential short-term pullbacks.#cro
@CROSS #cross $CROSS #CROSSUSDT #WhatInvestmentSignalsDo13FFilingsReveal? #InvescoStablecoinReservesFundLaunchesOnEthereum #StrategySells2.09MMSTRSharesFor$244.7M
Price Action & Trend Structure
The daily timeframe shows that after dropping to a significant swing low of $0.09506, the asset established a solid accumulation base. From there, buyers stepped in aggressively, forming a series of higher lows that culminated in a powerful vertical expansion. The token recently touched a 24-hour high of $0.15310, while the 24-hour low is recorded at $0.11402. This aggressive upward movement reflects strong bullish conviction and a break past prior local resistance barriers.
Volume & Liquidity
Market activity has expanded rapidly during this push, registering a 24-hour trading volume of 324.12M CROSS and 44.54M USDT. The growing volume bars confirm that capital is actively flowing into the asset, supporting the continuation of the current bullish leg.
Momentum & Indicators
MACD: The Moving Average Convergence Divergence indicator reflects a strong bullish crossover and accelerating momentum. The DIF line at 0.00516 has crossed decisively above the DEA line at -0.00045, accompanied by expanding green histogram bars (MACD: 0.00561).
Support & Resistance: Immediate support is established near the $0.14323 and $0.13046 structural zones. If the price maintains momentum above these levels, it could target further price discovery beyond the $0.15601 resistance level.
Conclusion
CROSS is exhibiting strong bullish momentum on the daily chart. However, due to the steep vertical nature of the rally, traders should monitor key support levels closely and manage risk effectively to guard against potential short-term pullbacks.#cro
@CROSS #cross $CROSS #CROSSUSDT #WhatInvestmentSignalsDo13FFilingsReveal? #InvescoStablecoinReservesFundLaunchesOnEthereum #StrategySells2.09MMSTRSharesFor$244.7M
1
5
·
--
Статья
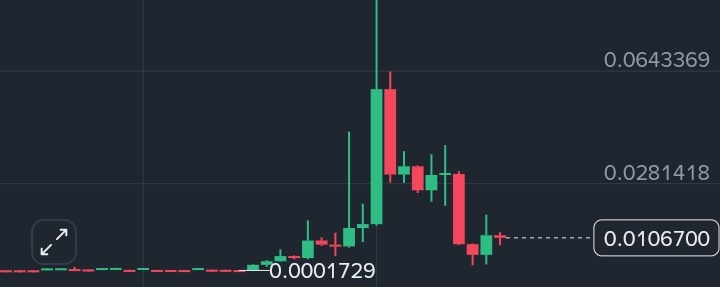
AKE/USDT Technical AnalysisThe 1-week (1W) chart for AKE/USDT Perpetual on Binance illustrates a significant macro correction following an explosive parabolic surge. Currently trading at $0.010670, the asset shows a modest 24-hour gain of +15.79%, reflecting a minor relief bounce from recent lows amid ongoing market developments regarding exchange transfers.
Price Action & Trend Structure
The weekly timeframe reveals a massive historical spike that peaked at $0.164960, originating from a deep base floor near $0.0001729. Following this parabolic expansion, the asset entered an extended distribution phase, forming consecutive lower highs and lower lows. Over the last 24 hours, the price recorded a high of $0.012479 and a low of $0.008306. The current weekly candlestick attempts to stabilize above the local support range, though the macro structure remains distinctly bearish after such a steep retracement.
Volume & Liquidity
Market turnover remains substantial, registering a 24-hour trading volume of 22.9B AKE and 175.40M USDT. While high volume accompanied the initial breakout phases, current trading activity largely reflects volatility as the market digests the heavy downside correction.
Momentum & Indicators
MACD: The Moving Average Convergence Divergence indicator shows persisting bearish momentum on the higher timeframe. The DIF line at 0.0029474 is positioned below the DEA line at 0.0050847, accompanied by a negative histogram reading of -0.0021373. This indicates that sellers still maintain control of the macro trend momentum.
Support & Resistance: Immediate downside support rests around the $0.008306 low and the broader structural floor near $0.0083870. On the upside, heavy overhead resistance is clustered near the $0.0281418 and $0.0643369 levels.
Conclusion
AKE is exhibiting low-level stabilization after a massive correction from its all-time highs. Traders should exercise caution, as macro downtrends require confirmed reversal structures and volume expansion before initiating long-term bullish positions. @Square-Creator-028daefdaa2a #ake #AKEUSDT $AKE
{future}(AKEUSDT)
#A Packed Week of Earnings and Data Tests Markets #NvidiaBoardNotConsideringHuang’sReturnasCEO #A Packed Week of Earnings and Data Tests Markets #StrategySells2.09MMSTRSharesFor$244.7M
AKE/USDT Technical Analysis
The 1-week (1W) chart for AKE/USDT Perpetual on Binance illustrates a significant macro correction following an explosive parabolic surge. Currently trading at $0.010670, the asset shows a modest 24-hour gain of +15.79%, reflecting a minor relief bounce from recent lows amid ongoing market developments regarding exchange transfers.
Price Action & Trend Structure
The weekly timeframe reveals a massive historical spike that peaked at $0.164960, originating from a deep base floor near $0.0001729. Following this parabolic expansion, the asset entered an extended distribution phase, forming consecutive lower highs and lower lows. Over the last 24 hours, the price recorded a high of $0.012479 and a low of $0.008306. The current weekly candlestick attempts to stabilize above the local support range, though the macro structure remains distinctly bearish after such a steep retracement.
Volume & Liquidity
Market turnover remains substantial, registering a 24-hour trading volume of 22.9B AKE and 175.40M USDT. While high volume accompanied the initial breakout phases, current trading activity largely reflects volatility as the market digests the heavy downside correction.
Momentum & Indicators
MACD: The Moving Average Convergence Divergence indicator shows persisting bearish momentum on the higher timeframe. The DIF line at 0.0029474 is positioned below the DEA line at 0.0050847, accompanied by a negative histogram reading of -0.0021373. This indicates that sellers still maintain control of the macro trend momentum.
Support & Resistance: Immediate downside support rests around the $0.008306 low and the broader structural floor near $0.0083870. On the upside, heavy overhead resistance is clustered near the $0.0281418 and $0.0643369 levels.
Conclusion
AKE is exhibiting low-level stabilization after a massive correction from its all-time highs. Traders should exercise caution, as macro downtrends require confirmed reversal structures and volume expansion before initiating long-term bullish positions. @Ake #ake #AKEUSDT $AKE
#A Packed Week of Earnings and Data Tests Markets #NvidiaBoardNotConsideringHuang’sReturnasCEO #A Packed Week of Earnings and Data Tests Markets #StrategySells2.09MMSTRSharesFor$244.7M
Price Action & Trend Structure
The weekly timeframe reveals a massive historical spike that peaked at $0.164960, originating from a deep base floor near $0.0001729. Following this parabolic expansion, the asset entered an extended distribution phase, forming consecutive lower highs and lower lows. Over the last 24 hours, the price recorded a high of $0.012479 and a low of $0.008306. The current weekly candlestick attempts to stabilize above the local support range, though the macro structure remains distinctly bearish after such a steep retracement.
Volume & Liquidity
Market turnover remains substantial, registering a 24-hour trading volume of 22.9B AKE and 175.40M USDT. While high volume accompanied the initial breakout phases, current trading activity largely reflects volatility as the market digests the heavy downside correction.
Momentum & Indicators
MACD: The Moving Average Convergence Divergence indicator shows persisting bearish momentum on the higher timeframe. The DIF line at 0.0029474 is positioned below the DEA line at 0.0050847, accompanied by a negative histogram reading of -0.0021373. This indicates that sellers still maintain control of the macro trend momentum.
Support & Resistance: Immediate downside support rests around the $0.008306 low and the broader structural floor near $0.0083870. On the upside, heavy overhead resistance is clustered near the $0.0281418 and $0.0643369 levels.
Conclusion
AKE is exhibiting low-level stabilization after a massive correction from its all-time highs. Traders should exercise caution, as macro downtrends require confirmed reversal structures and volume expansion before initiating long-term bullish positions. @Ake #ake #AKEUSDT $AKE
#A Packed Week of Earnings and Data Tests Markets #NvidiaBoardNotConsideringHuang’sReturnasCEO #A Packed Week of Earnings and Data Tests Markets #StrategySells2.09MMSTRSharesFor$244.7M
1
261

·
--

Статья
📊🔍 What Investment Signals Do 13F Filings Reveal? A Complete Guide for Smart Investors 💼#WhatInvestmentSignalsDo13FFilingsReveal?
Every quarter, investors around the world wait for one thing: a glimpse into what the biggest money managers are buying and selling. 👀 That glimpse comes from **Form 13F**. Filings for the latest quarter have just landed, so now is a good time to understand what they can and can't tell you. 🧠
## 📄 What Is a 13F Filing?
A 13F is a quarterly report filed with the US Securities and Exchange Commission (SEC). 🏛️ Institutional investment managers who oversee **$100 million or more** in qualifying securities must file one. That includes:
- 🏦 Hedge funds
- 🏢 Mutual fund companies
- 🛡️ Pension funds
- 🎓 University endowments
- 💎 Large asset managers
The report lists the manager's **long positions** in US-listed stocks, ETFs, certain options and some convertible securities as of the last day of the quarter. 📅 Filings are due within **45 days** after the quarter ends. Third-quarter reports therefore arrive around mid-November. ⏰
## 🔎 Signals a 13F Can Reveal
### 1️⃣ 🧭 Where Big Money Is Concentrated
Large positions show which companies and sectors institutions have conviction in. If many funds are heavily invested in AI, energy or healthcare, that tells you where professional capital is flowing. 🌊
### 2️⃣ 🔄 Changes From Quarter to Quarter
Often the change matters more than the holding. Comparing two filings shows whether a fund:
- ➕ Opened a new position
- 📈 Added to an existing one
- 📉 Trimmed its stake
- 🚪 Exited completely
A big new stake from a respected investor can signal fresh interest. A full exit can signal doubt. 🤔
### 3️⃣ 🤝 Crowded Trades
When dozens of funds hold the same stock, it becomes a "crowded trade." ⚠️ This can mean strong consensus, but it can also mean sharp selloffs if everyone heads for the exit at once.
### 4️⃣ 🎯 Conviction Level
Position size relative to the portfolio matters. A stock making up 10% of a fund's holdings shows far more conviction than one at 0.1%. 💪
### 5️⃣ 🌍 Sector Rotation
When many managers shift from growth to value, or from tech to defensives, it hints at changing views on rates, the economy or valuations. 🔁
### 6️⃣ 🧪 Interest in Smaller Stocks
When institutions start building positions in lesser-known companies, it can bring attention and liquidity to names retail investors haven't noticed yet. 🔦
## 🚧 Important Limitations of 13F Data
This is where many investors go wrong. A 13F is useful, but it is **not** a full picture. ⚠️
- ⏳ **It is delayed.** Data can be up to 45 days old when published, and the manager may have changed positions since.
- 📉 **It excludes short positions.** A fund that looks bullish may have bets against the stock.
- 🛡️ **It doesn't show hedges.** Derivatives and offsetting trades are mostly invisible.
- 🌏 **It covers mainly US-listed securities.** Foreign stocks, most bonds, cash and many other assets are missing.
- 💰 **It doesn't show cost or timing.** You don't know the entry price or why the manager bought.
- 🙈 **Confidential treatment exists.** Some positions can be temporarily withheld.
In short, it is a **snapshot of the past**, not a live trading signal. 📸
## 🛠️ How to Use 13F Data Wisely
1. **🔬 Treat it as a research starting point.** Use it to find ideas, then study the company's financials yourself.
2. **📚 Look for patterns, not single trades.** Several respected funds building the same position is more meaningful than one filing.
3. **🧮 Check position size.** A tiny stake may just be a small experiment.
4. **⏱️ Consider your time horizon.** Long-term investors can use 13Fs more easily than short-term traders.
5. **🧱 Do your own valuation work.** A famous investor owning a stock doesn't make it a good price today.
## 🚫 Common Mistakes to Avoid
- ❌ **Blindly copying famous investors.** You don't know their full strategy, risk limits or exit plan.
- ❌ **Ignoring the delay.** The price may already have moved a lot.
- ❌ **Assuming institutions are always right.** Professionals lose money too.
- ❌ **Overlooking risk management.** Position sizing and diversification still matter.
## 💡 Why 13F Season Matters
13F season gives markets a burst of fresh information. 🌟 It gets people talking about institutional sentiment, sector trends and conviction picks. It also reminds investors that "smart money" leaves a trail, but the trail is incomplete and old. 🧩
## 🎯 Final Thoughts
13F filings are a valuable tool for understanding how major investors are positioned. 🧰 They can reveal conviction, sector shifts, crowded trades and emerging ideas. But they are delayed and incomplete, so they work best as one piece of a larger research process, not a buy or sell button. Combine them with company fundamentals, valuation, macro conditions and strict risk control. 💪📈
#CypherpunkReports$306MQ3NetProfit #StrategySells2.09MMSTRSharesFor$244.7M #StablecoinMarketShrinksAtFastestPaceSinceTerraLuna #BitcoinExtendsLosingStreakToSixWeeks
*⚠️
**:** #13F #InvestmentSignals #SmartMoney #StockMarket #Investing
📊🔍 What Investment Signals Do 13F Filings Reveal? A Complete Guide for Smart Investors 💼
#WhatInvestmentSignalsDo13FFilingsReveal?
Every quarter, investors around the world wait for one thing: a glimpse into what the biggest money managers are buying and selling. 👀 That glimpse comes from **Form 13F**. Filings for the latest quarter have just landed, so now is a good time to understand what they can and can't tell you. 🧠
## 📄 What Is a 13F Filing?
A 13F is a quarterly report filed with the US Securities and Exchange Commission (SEC). 🏛️ Institutional investment managers who oversee **$100 million or more** in qualifying securities must file one. That includes:
- 🏦 Hedge funds
- 🏢 Mutual fund companies
- 🛡️ Pension funds
- 🎓 University endowments
- 💎 Large asset managers
The report lists the manager's **long positions** in US-listed stocks, ETFs, certain options and some convertible securities as of the last day of the quarter. 📅 Filings are due within **45 days** after the quarter ends. Third-quarter reports therefore arrive around mid-November. ⏰
## 🔎 Signals a 13F Can Reveal
### 1️⃣ 🧭 Where Big Money Is Concentrated
Large positions show which companies and sectors institutions have conviction in. If many funds are heavily invested in AI, energy or healthcare, that tells you where professional capital is flowing. 🌊
### 2️⃣ 🔄 Changes From Quarter to Quarter
Often the change matters more than the holding. Comparing two filings shows whether a fund:
- ➕ Opened a new position
- 📈 Added to an existing one
- 📉 Trimmed its stake
- 🚪 Exited completely
A big new stake from a respected investor can signal fresh interest. A full exit can signal doubt. 🤔
### 3️⃣ 🤝 Crowded Trades
When dozens of funds hold the same stock, it becomes a "crowded trade." ⚠️ This can mean strong consensus, but it can also mean sharp selloffs if everyone heads for the exit at once.
### 4️⃣ 🎯 Conviction Level
Position size relative to the portfolio matters. A stock making up 10% of a fund's holdings shows far more conviction than one at 0.1%. 💪
### 5️⃣ 🌍 Sector Rotation
When many managers shift from growth to value, or from tech to defensives, it hints at changing views on rates, the economy or valuations. 🔁
### 6️⃣ 🧪 Interest in Smaller Stocks
When institutions start building positions in lesser-known companies, it can bring attention and liquidity to names retail investors haven't noticed yet. 🔦
## 🚧 Important Limitations of 13F Data
This is where many investors go wrong. A 13F is useful, but it is **not** a full picture. ⚠️
- ⏳ **It is delayed.** Data can be up to 45 days old when published, and the manager may have changed positions since.
- 📉 **It excludes short positions.** A fund that looks bullish may have bets against the stock.
- 🛡️ **It doesn't show hedges.** Derivatives and offsetting trades are mostly invisible.
- 🌏 **It covers mainly US-listed securities.** Foreign stocks, most bonds, cash and many other assets are missing.
- 💰 **It doesn't show cost or timing.** You don't know the entry price or why the manager bought.
- 🙈 **Confidential treatment exists.** Some positions can be temporarily withheld.
In short, it is a **snapshot of the past**, not a live trading signal. 📸
## 🛠️ How to Use 13F Data Wisely
1. **🔬 Treat it as a research starting point.** Use it to find ideas, then study the company's financials yourself.
2. **📚 Look for patterns, not single trades.** Several respected funds building the same position is more meaningful than one filing.
3. **🧮 Check position size.** A tiny stake may just be a small experiment.
4. **⏱️ Consider your time horizon.** Long-term investors can use 13Fs more easily than short-term traders.
5. **🧱 Do your own valuation work.** A famous investor owning a stock doesn't make it a good price today.
## 🚫 Common Mistakes to Avoid
- ❌ **Blindly copying famous investors.** You don't know their full strategy, risk limits or exit plan.
- ❌ **Ignoring the delay.** The price may already have moved a lot.
- ❌ **Assuming institutions are always right.** Professionals lose money too.
- ❌ **Overlooking risk management.** Position sizing and diversification still matter.
## 💡 Why 13F Season Matters
13F season gives markets a burst of fresh information. 🌟 It gets people talking about institutional sentiment, sector trends and conviction picks. It also reminds investors that "smart money" leaves a trail, but the trail is incomplete and old. 🧩
## 🎯 Final Thoughts
13F filings are a valuable tool for understanding how major investors are positioned. 🧰 They can reveal conviction, sector shifts, crowded trades and emerging ideas. But they are delayed and incomplete, so they work best as one piece of a larger research process, not a buy or sell button. Combine them with company fundamentals, valuation, macro conditions and strict risk control. 💪📈
#CypherpunkReports$306MQ3NetProfit #StrategySells2.09MMSTRSharesFor$244.7M #StablecoinMarketShrinksAtFastestPaceSinceTerraLuna #BitcoinExtendsLosingStreakToSixWeeks
*⚠️
**:** #13F #InvestmentSignals #SmartMoney #StockMarket #Investing
Every quarter, investors around the world wait for one thing: a glimpse into what the biggest money managers are buying and selling. 👀 That glimpse comes from **Form 13F**. Filings for the latest quarter have just landed, so now is a good time to understand what they can and can't tell you. 🧠
## 📄 What Is a 13F Filing?
A 13F is a quarterly report filed with the US Securities and Exchange Commission (SEC). 🏛️ Institutional investment managers who oversee **$100 million or more** in qualifying securities must file one. That includes:
- 🏦 Hedge funds
- 🏢 Mutual fund companies
- 🛡️ Pension funds
- 🎓 University endowments
- 💎 Large asset managers
The report lists the manager's **long positions** in US-listed stocks, ETFs, certain options and some convertible securities as of the last day of the quarter. 📅 Filings are due within **45 days** after the quarter ends. Third-quarter reports therefore arrive around mid-November. ⏰
## 🔎 Signals a 13F Can Reveal
### 1️⃣ 🧭 Where Big Money Is Concentrated
Large positions show which companies and sectors institutions have conviction in. If many funds are heavily invested in AI, energy or healthcare, that tells you where professional capital is flowing. 🌊
### 2️⃣ 🔄 Changes From Quarter to Quarter
Often the change matters more than the holding. Comparing two filings shows whether a fund:
- ➕ Opened a new position
- 📈 Added to an existing one
- 📉 Trimmed its stake
- 🚪 Exited completely
A big new stake from a respected investor can signal fresh interest. A full exit can signal doubt. 🤔
### 3️⃣ 🤝 Crowded Trades
When dozens of funds hold the same stock, it becomes a "crowded trade." ⚠️ This can mean strong consensus, but it can also mean sharp selloffs if everyone heads for the exit at once.
### 4️⃣ 🎯 Conviction Level
Position size relative to the portfolio matters. A stock making up 10% of a fund's holdings shows far more conviction than one at 0.1%. 💪
### 5️⃣ 🌍 Sector Rotation
When many managers shift from growth to value, or from tech to defensives, it hints at changing views on rates, the economy or valuations. 🔁
### 6️⃣ 🧪 Interest in Smaller Stocks
When institutions start building positions in lesser-known companies, it can bring attention and liquidity to names retail investors haven't noticed yet. 🔦
## 🚧 Important Limitations of 13F Data
This is where many investors go wrong. A 13F is useful, but it is **not** a full picture. ⚠️
- ⏳ **It is delayed.** Data can be up to 45 days old when published, and the manager may have changed positions since.
- 📉 **It excludes short positions.** A fund that looks bullish may have bets against the stock.
- 🛡️ **It doesn't show hedges.** Derivatives and offsetting trades are mostly invisible.
- 🌏 **It covers mainly US-listed securities.** Foreign stocks, most bonds, cash and many other assets are missing.
- 💰 **It doesn't show cost or timing.** You don't know the entry price or why the manager bought.
- 🙈 **Confidential treatment exists.** Some positions can be temporarily withheld.
In short, it is a **snapshot of the past**, not a live trading signal. 📸
## 🛠️ How to Use 13F Data Wisely
1. **🔬 Treat it as a research starting point.** Use it to find ideas, then study the company's financials yourself.
2. **📚 Look for patterns, not single trades.** Several respected funds building the same position is more meaningful than one filing.
3. **🧮 Check position size.** A tiny stake may just be a small experiment.
4. **⏱️ Consider your time horizon.** Long-term investors can use 13Fs more easily than short-term traders.
5. **🧱 Do your own valuation work.** A famous investor owning a stock doesn't make it a good price today.
## 🚫 Common Mistakes to Avoid
- ❌ **Blindly copying famous investors.** You don't know their full strategy, risk limits or exit plan.
- ❌ **Ignoring the delay.** The price may already have moved a lot.
- ❌ **Assuming institutions are always right.** Professionals lose money too.
- ❌ **Overlooking risk management.** Position sizing and diversification still matter.
## 💡 Why 13F Season Matters
13F season gives markets a burst of fresh information. 🌟 It gets people talking about institutional sentiment, sector trends and conviction picks. It also reminds investors that "smart money" leaves a trail, but the trail is incomplete and old. 🧩
## 🎯 Final Thoughts
13F filings are a valuable tool for understanding how major investors are positioned. 🧰 They can reveal conviction, sector shifts, crowded trades and emerging ideas. But they are delayed and incomplete, so they work best as one piece of a larger research process, not a buy or sell button. Combine them with company fundamentals, valuation, macro conditions and strict risk control. 💪📈
#CypherpunkReports$306MQ3NetProfit #StrategySells2.09MMSTRSharesFor$244.7M #StablecoinMarketShrinksAtFastestPaceSinceTerraLuna #BitcoinExtendsLosingStreakToSixWeeks
*⚠️
**:** #13F #InvestmentSignals #SmartMoney #StockMarket #Investing
2
21
·
--

Статья
🤖📉 Does Anyone Still Care About Anthropic's IPO? Investor Confidence Under the Microscope 🔍#AnthropicIPOTestsInvestorAppetiteForAI
The AI boom has produced plenty of big headlines, but few topics are as hotly debated as the possible **Anthropic IPO**. 😅 Online, many traders and investors are asking whether market confidence has hit rock bottom, or whether the market is simply taking a breath. 💭
## 🗣️ What Was Said
According to the viral post, Anthropic CEO **Dario Amodei** said a couple of days ago: *"We're not particularly concerned about which month we go public or what market conditions look like."* 🎤
Reactions split into two camps:
- **😎 Supporters** see a founder who is focused on long-term growth instead of chasing a perfect listing window.
- **😒 Skeptics** read it as a leader trying to look unbothered while the market mood is uncertain. Some even call the tone arrogant.
Tone is subjective, and it is hard to judge a company's prospects from one sentence. 🧐
## 📊 Why Sentiment Matters So Much
An IPO is about more than the company. It is also about **timing, appetite and trust**. 💼 Investors usually ask:
1. **💰 Is the valuation realistic?** AI companies have been priced for huge growth, and any gap between hype and revenue can hurt.
2. **🌍 What is the macro backdrop?** Interest rates, inflation and Fed policy all affect appetite for risky assets.
3. **🏁 How crowded is the AI field?** Competition among major tech giants and startups keeps rising.
4. **⚖️ What are the risks?** Regulation, huge computing costs and fast-changing technology all weigh on the story.
## 🎭 The Meme Factor
The post also included a meme showing famous tech leaders gathered around a table in the style of a classic painting. 😂 It captures how the AI race feels to many people: a handful of powerful names competing for the future of the industry. Memes aren't analysis, but they show where public sentiment is heading. 📱
## 🧠 Is Confidence Really at Rock Bottom?
Honestly, it's hard to say. 🤔 Social media tends to amplify extreme opinions. A few negative posts don't mean the whole market has lost interest. Still, there are some real signals to watch:
- 📉 **Market volatility:** Uncertain conditions make investors cautious about new listings.
- 🏦 **Rate expectations:** Higher-for-longer rates can cool enthusiasm for growth stocks.
- 🔥 **AI fatigue:** After a long rally, some investors want proof of profits, not just promises.
- 🌟 **Long-term belief:** Many still think AI is one of the biggest trends of this decade.
## 🛡️ What Should Investors Do?
The author of the post says they "wouldn't touch it." That is one personal view, not a rule. 🙋 Smart investors usually:
- ✅ Read the official filings and financial disclosures carefully once they are available.
- ✅ Avoid decisions based on hype, fear or social media drama.
- ✅ Diversify and never put in more than they can afford to lose.
- ✅ Think about their time horizon, because IPOs can be very volatile in the early days.
## 🎯 Final Thoughts
The conversation around Anthropic's IPO shows how emotional the AI market has become. 🎢 Some see opportunity, others see risk, and a CEO's comments can be read as confidence or as bravado. What matters most are the fundamentals: revenue growth, costs, competition and the wider economy. 📈 Whether you are bullish, bearish or just watching, do your own research and stay disciplined. 💪
*⚠️ .*
#XRPFallsTo$0.89LowestSinceNovember2024 #BitcoinExtendsLosingStreakToSixWeeks #StablecoinMarketShrinksAtFastestPaceSinceTerraLuna #StrategySells2.09MMSTRSharesFor$244.7M
**:** #Anthropic #AIStocks #IPO #DarioAmodei #InvestorSentiment
🤖📉 Does Anyone Still Care About Anthropic's IPO? Investor Confidence Under the Microscope 🔍
#AnthropicIPOTestsInvestorAppetiteForAI
The AI boom has produced plenty of big headlines, but few topics are as hotly debated as the possible **Anthropic IPO**. 😅 Online, many traders and investors are asking whether market confidence has hit rock bottom, or whether the market is simply taking a breath. 💭
## 🗣️ What Was Said
According to the viral post, Anthropic CEO **Dario Amodei** said a couple of days ago: *"We're not particularly concerned about which month we go public or what market conditions look like."* 🎤
Reactions split into two camps:
- **😎 Supporters** see a founder who is focused on long-term growth instead of chasing a perfect listing window.
- **😒 Skeptics** read it as a leader trying to look unbothered while the market mood is uncertain. Some even call the tone arrogant.
Tone is subjective, and it is hard to judge a company's prospects from one sentence. 🧐
## 📊 Why Sentiment Matters So Much
An IPO is about more than the company. It is also about **timing, appetite and trust**. 💼 Investors usually ask:
1. **💰 Is the valuation realistic?** AI companies have been priced for huge growth, and any gap between hype and revenue can hurt.
2. **🌍 What is the macro backdrop?** Interest rates, inflation and Fed policy all affect appetite for risky assets.
3. **🏁 How crowded is the AI field?** Competition among major tech giants and startups keeps rising.
4. **⚖️ What are the risks?** Regulation, huge computing costs and fast-changing technology all weigh on the story.
## 🎭 The Meme Factor
The post also included a meme showing famous tech leaders gathered around a table in the style of a classic painting. 😂 It captures how the AI race feels to many people: a handful of powerful names competing for the future of the industry. Memes aren't analysis, but they show where public sentiment is heading. 📱
## 🧠 Is Confidence Really at Rock Bottom?
Honestly, it's hard to say. 🤔 Social media tends to amplify extreme opinions. A few negative posts don't mean the whole market has lost interest. Still, there are some real signals to watch:
- 📉 **Market volatility:** Uncertain conditions make investors cautious about new listings.
- 🏦 **Rate expectations:** Higher-for-longer rates can cool enthusiasm for growth stocks.
- 🔥 **AI fatigue:** After a long rally, some investors want proof of profits, not just promises.
- 🌟 **Long-term belief:** Many still think AI is one of the biggest trends of this decade.
## 🛡️ What Should Investors Do?
The author of the post says they "wouldn't touch it." That is one personal view, not a rule. 🙋 Smart investors usually:
- ✅ Read the official filings and financial disclosures carefully once they are available.
- ✅ Avoid decisions based on hype, fear or social media drama.
- ✅ Diversify and never put in more than they can afford to lose.
- ✅ Think about their time horizon, because IPOs can be very volatile in the early days.
## 🎯 Final Thoughts
The conversation around Anthropic's IPO shows how emotional the AI market has become. 🎢 Some see opportunity, others see risk, and a CEO's comments can be read as confidence or as bravado. What matters most are the fundamentals: revenue growth, costs, competition and the wider economy. 📈 Whether you are bullish, bearish or just watching, do your own research and stay disciplined. 💪
*⚠️ .*
#XRPFallsTo$0.89LowestSinceNovember2024 #BitcoinExtendsLosingStreakToSixWeeks #StablecoinMarketShrinksAtFastestPaceSinceTerraLuna #StrategySells2.09MMSTRSharesFor$244.7M
**:** #Anthropic #AIStocks #IPO #DarioAmodei #InvestorSentiment
The AI boom has produced plenty of big headlines, but few topics are as hotly debated as the possible **Anthropic IPO**. 😅 Online, many traders and investors are asking whether market confidence has hit rock bottom, or whether the market is simply taking a breath. 💭
## 🗣️ What Was Said
According to the viral post, Anthropic CEO **Dario Amodei** said a couple of days ago: *"We're not particularly concerned about which month we go public or what market conditions look like."* 🎤
Reactions split into two camps:
- **😎 Supporters** see a founder who is focused on long-term growth instead of chasing a perfect listing window.
- **😒 Skeptics** read it as a leader trying to look unbothered while the market mood is uncertain. Some even call the tone arrogant.
Tone is subjective, and it is hard to judge a company's prospects from one sentence. 🧐
## 📊 Why Sentiment Matters So Much
An IPO is about more than the company. It is also about **timing, appetite and trust**. 💼 Investors usually ask:
1. **💰 Is the valuation realistic?** AI companies have been priced for huge growth, and any gap between hype and revenue can hurt.
2. **🌍 What is the macro backdrop?** Interest rates, inflation and Fed policy all affect appetite for risky assets.
3. **🏁 How crowded is the AI field?** Competition among major tech giants and startups keeps rising.
4. **⚖️ What are the risks?** Regulation, huge computing costs and fast-changing technology all weigh on the story.
## 🎭 The Meme Factor
The post also included a meme showing famous tech leaders gathered around a table in the style of a classic painting. 😂 It captures how the AI race feels to many people: a handful of powerful names competing for the future of the industry. Memes aren't analysis, but they show where public sentiment is heading. 📱
## 🧠 Is Confidence Really at Rock Bottom?
Honestly, it's hard to say. 🤔 Social media tends to amplify extreme opinions. A few negative posts don't mean the whole market has lost interest. Still, there are some real signals to watch:
- 📉 **Market volatility:** Uncertain conditions make investors cautious about new listings.
- 🏦 **Rate expectations:** Higher-for-longer rates can cool enthusiasm for growth stocks.
- 🔥 **AI fatigue:** After a long rally, some investors want proof of profits, not just promises.
- 🌟 **Long-term belief:** Many still think AI is one of the biggest trends of this decade.
## 🛡️ What Should Investors Do?
The author of the post says they "wouldn't touch it." That is one personal view, not a rule. 🙋 Smart investors usually:
- ✅ Read the official filings and financial disclosures carefully once they are available.
- ✅ Avoid decisions based on hype, fear or social media drama.
- ✅ Diversify and never put in more than they can afford to lose.
- ✅ Think about their time horizon, because IPOs can be very volatile in the early days.
## 🎯 Final Thoughts
The conversation around Anthropic's IPO shows how emotional the AI market has become. 🎢 Some see opportunity, others see risk, and a CEO's comments can be read as confidence or as bravado. What matters most are the fundamentals: revenue growth, costs, competition and the wider economy. 📈 Whether you are bullish, bearish or just watching, do your own research and stay disciplined. 💪
*⚠️ .*
#XRPFallsTo$0.89LowestSinceNovember2024 #BitcoinExtendsLosingStreakToSixWeeks #StablecoinMarketShrinksAtFastestPaceSinceTerraLuna #StrategySells2.09MMSTRSharesFor$244.7M
**:** #Anthropic #AIStocks #IPO #DarioAmodei #InvestorSentiment
1
136

·
--
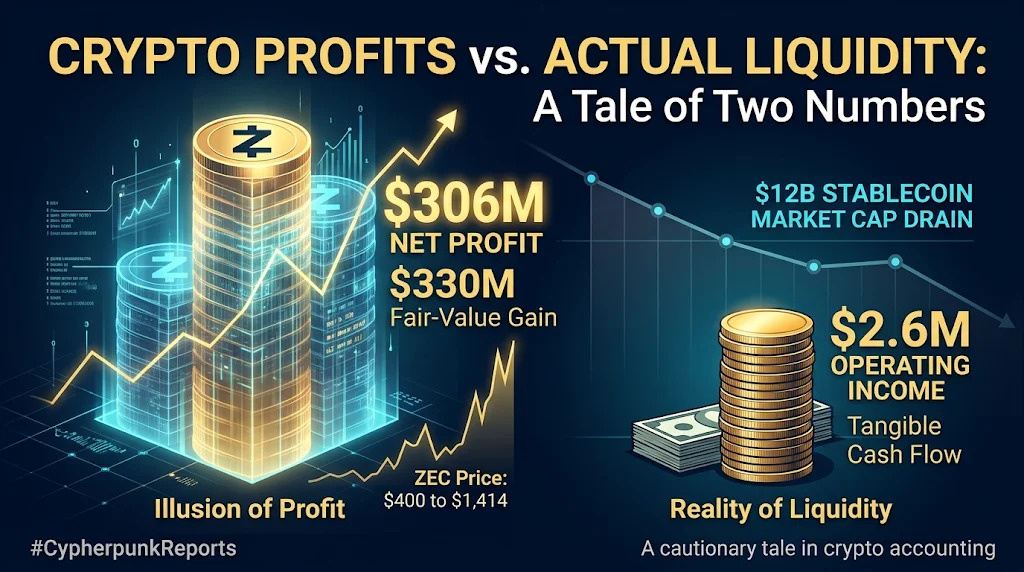
🚨Crypto profits versus actual liquidity...
#CypherpunkReports$306MQ3NetProfit
$306M of profit, but only $2.6M from operations. That's the distinction in Cypherpunk's ZEC bet.
Its Q3 SEC filing reports $306.005M net income, but a $330.846M non-cash fair-value gain on an embedded derivative drove the result as ZEC rose from $400.09 on June 30 to $1,414.56 on September 30. Operating income was $2.606M; mining revenue was $9.913M, received in ZEC and recorded at fair value.
By November 16, Cypherpunk reported 341,858.75 ZEC in its treasury, approximately 2.01% of circulating supply. Its mining share was 13.1% of network hashrate on November 13, with a longer-term target of 25%.
Meanwhile, Strategy sold 2.087M MSTR shares for $244.7M net. Only $33.4M went to Bitcoin; $206.3M funded STRC repurchases and $5M remained as cash.
At the same time, Kaiko data reported by Bloomberg showed stablecoin market capitalization shrinking approximately $12B in 30 days.
The distinction matters: accounting gains, equity-funded accumulation and on-chain dollar liquidity are three different things.
Not financial advice.
$BTC $ZEC
{future}(ZECUSDT)
{future}(BTCUSDT)
#StrategySells2.09MMSTRSharesFor$244.7M #SevenUSBanksDisclose$29.4MInXRPETFHoldings #OPTIMJACKAttackInfectsAtLeast186Websites #CryptoTreasuries #StablecoinLiquidity #zcash
🚨Crypto profits versus actual liquidity...
#CypherpunkReports$306MQ3NetProfit
$306M of profit, but only $2.6M from operations. That's the distinction in Cypherpunk's ZEC bet.
Its Q3 SEC filing reports $306.005M net income, but a $330.846M non-cash fair-value gain on an embedded derivative drove the result as ZEC rose from $400.09 on June 30 to $1,414.56 on September 30. Operating income was $2.606M; mining revenue was $9.913M, received in ZEC and recorded at fair value.
By November 16, Cypherpunk reported 341,858.75 ZEC in its treasury, approximately 2.01% of circulating supply. Its mining share was 13.1% of network hashrate on November 13, with a longer-term target of 25%.
Meanwhile, Strategy sold 2.087M MSTR shares for $244.7M net. Only $33.4M went to Bitcoin; $206.3M funded STRC repurchases and $5M remained as cash.
At the same time, Kaiko data reported by Bloomberg showed stablecoin market capitalization shrinking approximately $12B in 30 days.
The distinction matters: accounting gains, equity-funded accumulation and on-chain dollar liquidity are three different things.
Not financial advice.
$BTC $ZEC
#StrategySells2.09MMSTRSharesFor$244.7M #SevenUSBanksDisclose$29.4MInXRPETFHoldings #OPTIMJACKAttackInfectsAtLeast186Websites #CryptoTreasuries #StablecoinLiquidity #zcash
#CypherpunkReports$306MQ3NetProfit
$306M of profit, but only $2.6M from operations. That's the distinction in Cypherpunk's ZEC bet.
Its Q3 SEC filing reports $306.005M net income, but a $330.846M non-cash fair-value gain on an embedded derivative drove the result as ZEC rose from $400.09 on June 30 to $1,414.56 on September 30. Operating income was $2.606M; mining revenue was $9.913M, received in ZEC and recorded at fair value.
By November 16, Cypherpunk reported 341,858.75 ZEC in its treasury, approximately 2.01% of circulating supply. Its mining share was 13.1% of network hashrate on November 13, with a longer-term target of 25%.
Meanwhile, Strategy sold 2.087M MSTR shares for $244.7M net. Only $33.4M went to Bitcoin; $206.3M funded STRC repurchases and $5M remained as cash.
At the same time, Kaiko data reported by Bloomberg showed stablecoin market capitalization shrinking approximately $12B in 30 days.
The distinction matters: accounting gains, equity-funded accumulation and on-chain dollar liquidity are three different things.
Not financial advice.
$BTC $ZEC
#StrategySells2.09MMSTRSharesFor$244.7M #SevenUSBanksDisclose$29.4MInXRPETFHoldings #OPTIMJACKAttackInfectsAtLeast186Websites #CryptoTreasuries #StablecoinLiquidity #zcash
2
175
·
--
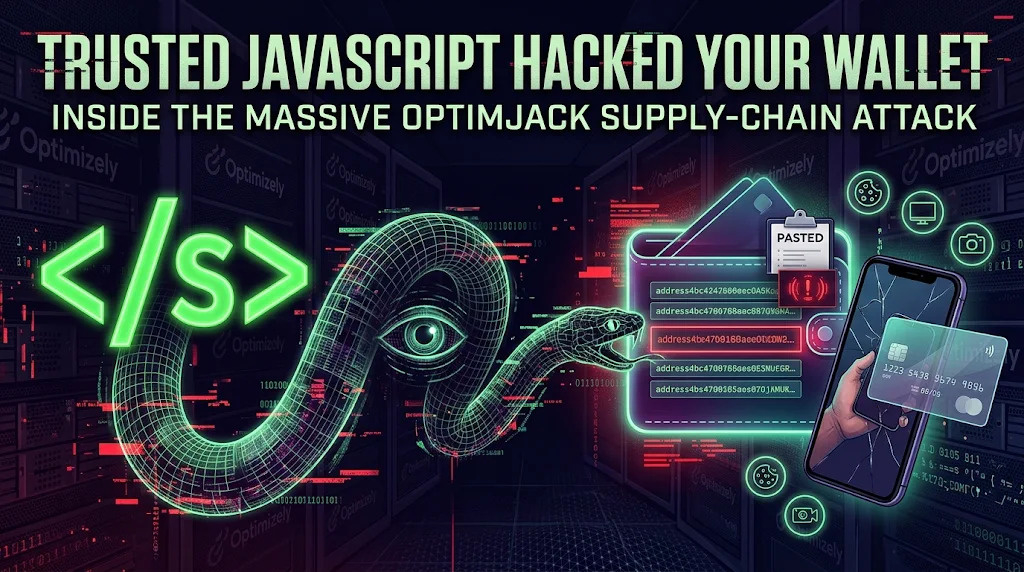
🚨The websites didn't need to be hacked...
#optimjackattackinfectsatleast186websites
Their trusted JavaScript did the damage.
On November 16, malicious code was served through Optimizely Web snippets to visitors of 178 organisations. Security researcher Scott Helme found 188 infected customer snippets; one scan caught 186 of 1,611 checked. StepSecurity independently reported 186 affected sites on November 17.
The crucial correction: this was not CDN cache poisoning. Attackers inserted code into customers' optional projectJS fields. How they obtained write access across so many unrelated projects remains unexplained.
The payload replaced copied wallet addresses across BTC, ETH/EVM, TRON, Solana, TON and other chains. It also skimmed payment-card details from certain website forms and targeted cookies, screenshots and iOS devices.
Known cryptocurrency receipts were approximately $7,040 in Report URI's November 16 snapshot. StepSecurity's later estimate was around $6,600. These are different investigation snapshots, not amounts to add together.
The bigger damage may extend beyond visible blockchain transactions: stolen payment details, cookies and potential device compromises cannot be measured through on-chain balances.
The real lesson: a secure blockchain cannot protect a transaction when malware silently replaces the address before it reaches the wallet.
Not financial advice.
$BTC $ETH $BNB
{future}(BNBUSDT)
{future}(ETHUSDT)
{future}(BTCUSDT)
#OPTIMJACKAttackInfectsAtLeast186Websites #StablecoinMarketShrinksAtFastestPaceSinceTerraLuna #OptimJack #Web3Security #SupplyChainAttack #StrategySells2.09MMSTRSharesFor$244.7M
🚨The websites didn't need to be hacked...
#optimjackattackinfectsatleast186websites
Their trusted JavaScript did the damage.
On November 16, malicious code was served through Optimizely Web snippets to visitors of 178 organisations. Security researcher Scott Helme found 188 infected customer snippets; one scan caught 186 of 1,611 checked. StepSecurity independently reported 186 affected sites on November 17.
The crucial correction: this was not CDN cache poisoning. Attackers inserted code into customers' optional projectJS fields. How they obtained write access across so many unrelated projects remains unexplained.
The payload replaced copied wallet addresses across BTC, ETH/EVM, TRON, Solana, TON and other chains. It also skimmed payment-card details from certain website forms and targeted cookies, screenshots and iOS devices.
Known cryptocurrency receipts were approximately $7,040 in Report URI's November 16 snapshot. StepSecurity's later estimate was around $6,600. These are different investigation snapshots, not amounts to add together.
The bigger damage may extend beyond visible blockchain transactions: stolen payment details, cookies and potential device compromises cannot be measured through on-chain balances.
The real lesson: a secure blockchain cannot protect a transaction when malware silently replaces the address before it reaches the wallet.
Not financial advice.
$BTC $ETH $BNB
#OPTIMJACKAttackInfectsAtLeast186Websites #StablecoinMarketShrinksAtFastestPaceSinceTerraLuna #OptimJack #Web3Security #SupplyChainAttack #StrategySells2.09MMSTRSharesFor$244.7M
#optimjackattackinfectsatleast186websites
Their trusted JavaScript did the damage.
On November 16, malicious code was served through Optimizely Web snippets to visitors of 178 organisations. Security researcher Scott Helme found 188 infected customer snippets; one scan caught 186 of 1,611 checked. StepSecurity independently reported 186 affected sites on November 17.
The crucial correction: this was not CDN cache poisoning. Attackers inserted code into customers' optional projectJS fields. How they obtained write access across so many unrelated projects remains unexplained.
The payload replaced copied wallet addresses across BTC, ETH/EVM, TRON, Solana, TON and other chains. It also skimmed payment-card details from certain website forms and targeted cookies, screenshots and iOS devices.
Known cryptocurrency receipts were approximately $7,040 in Report URI's November 16 snapshot. StepSecurity's later estimate was around $6,600. These are different investigation snapshots, not amounts to add together.
The bigger damage may extend beyond visible blockchain transactions: stolen payment details, cookies and potential device compromises cannot be measured through on-chain balances.
The real lesson: a secure blockchain cannot protect a transaction when malware silently replaces the address before it reaches the wallet.
Not financial advice.
$BTC $ETH $BNB
#OPTIMJACKAttackInfectsAtLeast186Websites #StablecoinMarketShrinksAtFastestPaceSinceTerraLuna #OptimJack #Web3Security #SupplyChainAttack #StrategySells2.09MMSTRSharesFor$244.7M
2
755
Войдите, чтобы посмотреть больше материала
Присоединяйтесь к пользователям криптовалют по всему миру на Binance Square
⚡️ Получайте новейшую и полезную информацию о криптоактивах.
💬 Нам доверяет крупнейшая в мире криптобиржа.
👍 Получите достоверные аналитические данные от верифицированных создателей контента.
Эл. почта/номер телефона
В тренде
1
#A Packed Week of Earnings and Data Tests Markets
Просмотров: 75,592
468 обсуждают
2
#AnthropicIPOTestsInvestorAppetiteForAI
Просмотров: 146,950
1,595 обсуждают
3
#NvidiaBoardNotConsideringHuang’sReturnasCEO
Просмотров: 7,865
141 обсуждают
4
#WhatInvestmentSignalsDo13FFilingsReveal?
Просмотров: 4,861
101 обсуждают
5
#InvescoStablecoinReservesFundLaunchesOnEthereum
Просмотров: 1,471
47 обсуждают
6
#CypherpunkReports$306MQ3NetProfit
Просмотров: 559
9 обсуждают
7
#OPTIMJACKAttackInfectsAtLeast186Websites
Просмотров: 3,587
74 обсуждают
8
#StrategySells2.09MMSTRSharesFor$244.7M
Просмотров: 1,790
17 обсуждают
9
#StablecoinMarketShrinksAtFastestPaceSinceTerraLuna
Просмотров: 5,039
53 обсуждают
10
#BitcoinExtendsLosingStreakToSixWeeks
Просмотров: 114,199
817 обсуждают