
#bitcoinetfssee$412mnetoutflows
bitcoinetfssee$412mnetoutflows
Популярные
Новые

Статья
Market Shift: Bitcoin ETFs Face $412M in Heavy Net OutflowsThe spot Bitcoin ETF market just recorded a massive liquidity shift. Is the smart money taking profits, or is this just a temporary shakeout before the next major surge?
Here is the direct breakdown of the latest market data:
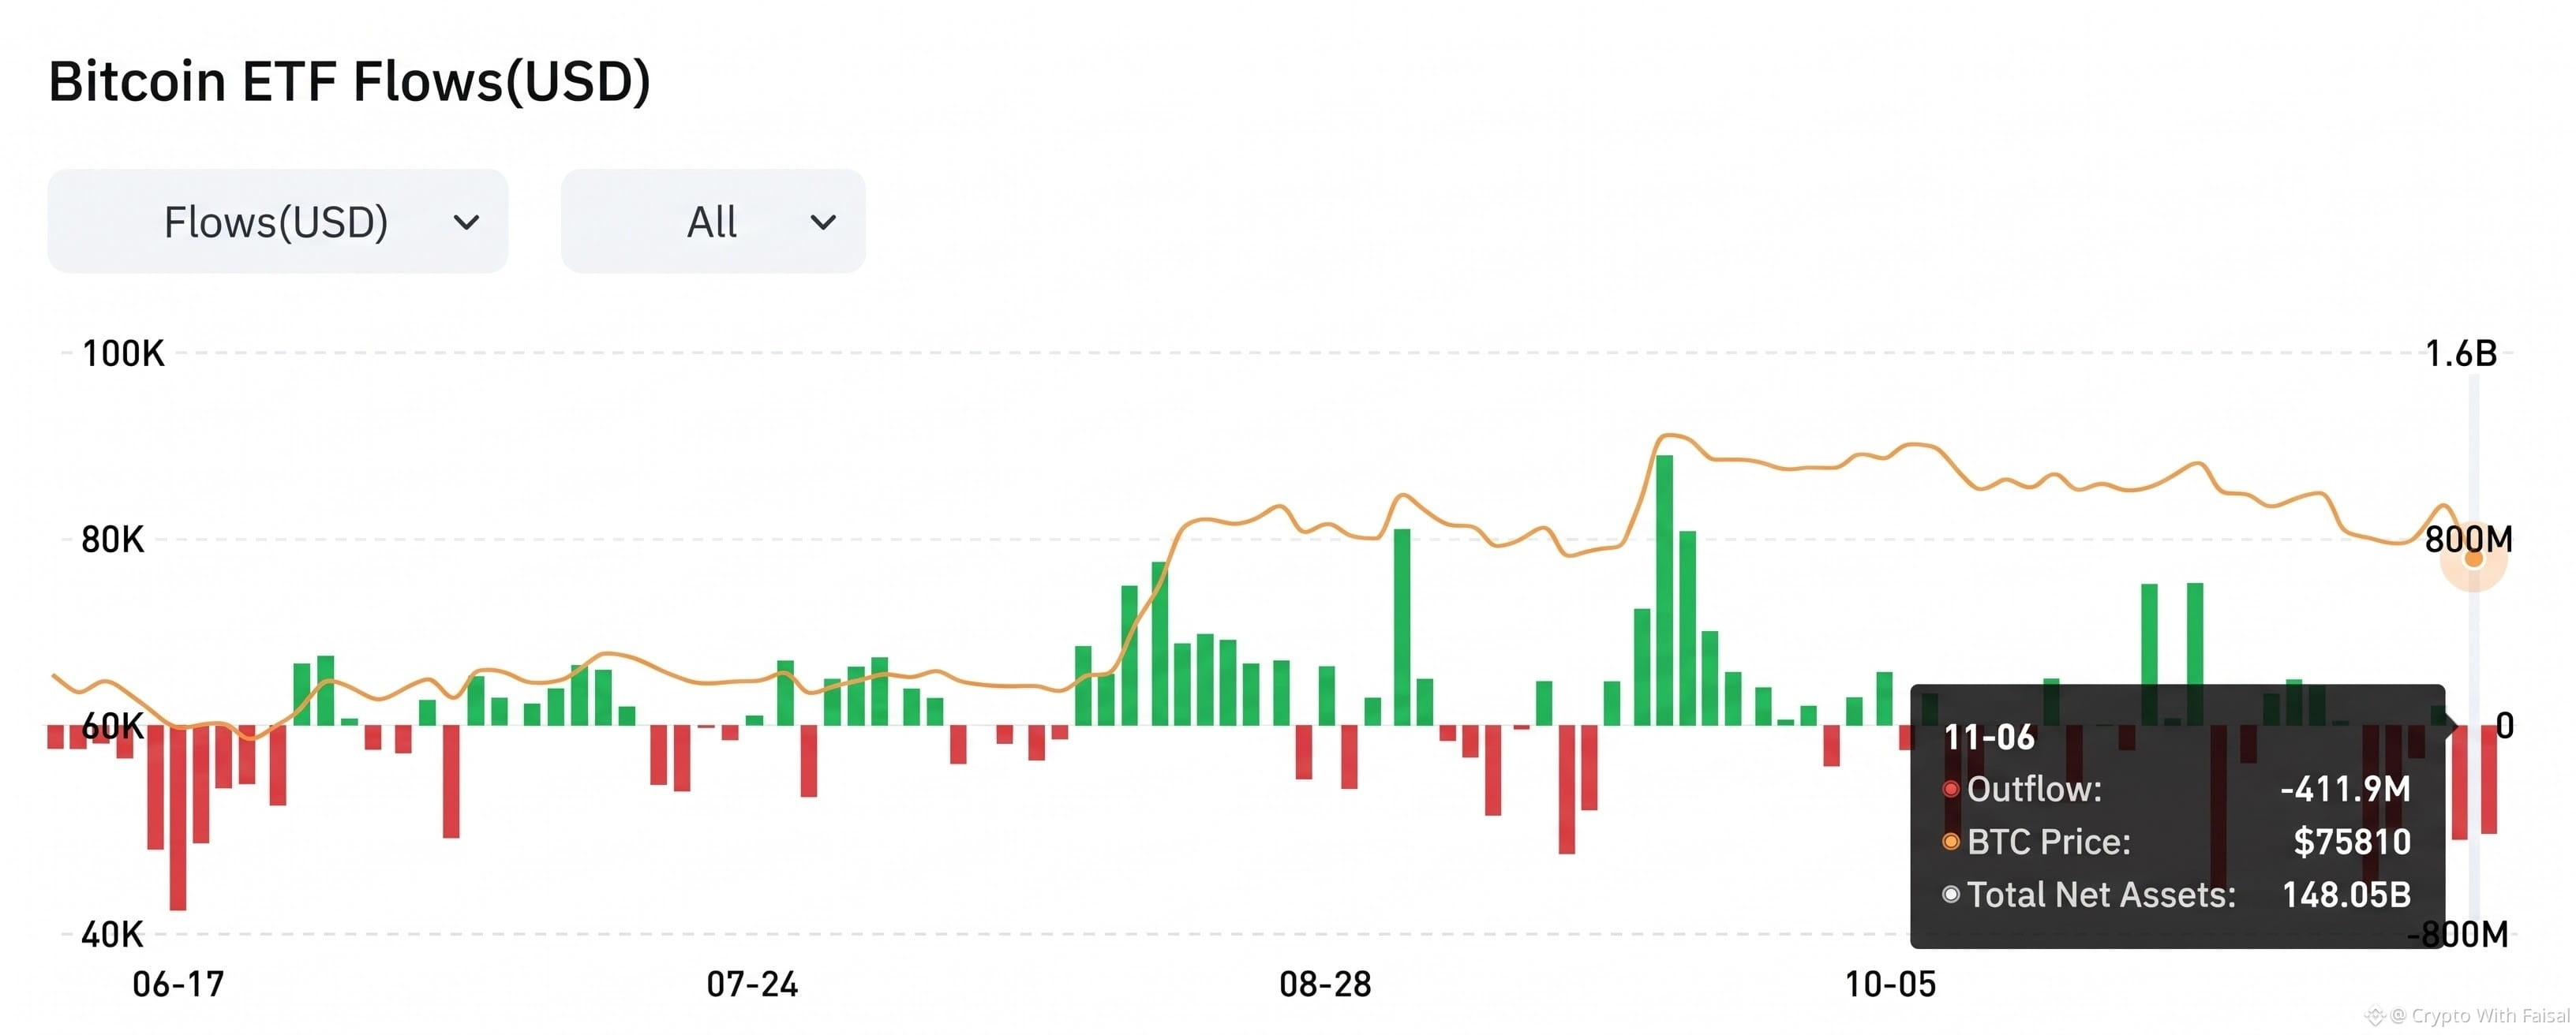
🚨 The Big Move: On November 6, Bitcoin spot ETFs recorded a staggering $411.9M in single-day net outflows.
🐋 Leading the Exit: BlackRock’s IBIT took the heaviest hit, accounting for the lion's share by shedding over $403 million in a single trading session.
📈 Resilient Price Action: Despite heavy institutional redemptions, Bitcoin's price showed immense strength, holding the line around $75,810.
As highlighted in the attached volume chart, total net assets remain incredibly healthy at $148.05B. This signals that while short-term outflows make for dramatic headlines, the macro foundation for BTC remains undeniably solid.
The Creator's Take:
Massive institutional outflows usually spook retail traders, but Bitcoin's ability to maintain the $75K level amidst this selling pressure shows incredible underlying market demand. Volatility is the price of admission.
What’s your strategy right now? Are you buying the dip or waiting for the dust to settle? Drop your thoughts below! 👇
$BTC $AIN $ICNT
{future}(ICNTUSDT)
{future}(AINUSDT)
{future}(BTCUSDT)
#bitcoinetfssee$412mnetoutflows #BTC #CryptoMarket #BTCETF
Market Shift: Bitcoin ETFs Face $412M in Heavy Net Outflows
The spot Bitcoin ETF market just recorded a massive liquidity shift. Is the smart money taking profits, or is this just a temporary shakeout before the next major surge?
Here is the direct breakdown of the latest market data:
🚨 The Big Move: On November 6, Bitcoin spot ETFs recorded a staggering $411.9M in single-day net outflows.
🐋 Leading the Exit: BlackRock’s IBIT took the heaviest hit, accounting for the lion's share by shedding over $403 million in a single trading session.
📈 Resilient Price Action: Despite heavy institutional redemptions, Bitcoin's price showed immense strength, holding the line around $75,810.
As highlighted in the attached volume chart, total net assets remain incredibly healthy at $148.05B. This signals that while short-term outflows make for dramatic headlines, the macro foundation for BTC remains undeniably solid.
The Creator's Take:
Massive institutional outflows usually spook retail traders, but Bitcoin's ability to maintain the $75K level amidst this selling pressure shows incredible underlying market demand. Volatility is the price of admission.
What’s your strategy right now? Are you buying the dip or waiting for the dust to settle? Drop your thoughts below! 👇
$BTC $AIN $ICNT
#bitcoinetfssee$412mnetoutflows #BTC #CryptoMarket #BTCETF
Here is the direct breakdown of the latest market data:
🚨 The Big Move: On November 6, Bitcoin spot ETFs recorded a staggering $411.9M in single-day net outflows.
🐋 Leading the Exit: BlackRock’s IBIT took the heaviest hit, accounting for the lion's share by shedding over $403 million in a single trading session.
📈 Resilient Price Action: Despite heavy institutional redemptions, Bitcoin's price showed immense strength, holding the line around $75,810.
As highlighted in the attached volume chart, total net assets remain incredibly healthy at $148.05B. This signals that while short-term outflows make for dramatic headlines, the macro foundation for BTC remains undeniably solid.
The Creator's Take:
Massive institutional outflows usually spook retail traders, but Bitcoin's ability to maintain the $75K level amidst this selling pressure shows incredible underlying market demand. Volatility is the price of admission.
What’s your strategy right now? Are you buying the dip or waiting for the dust to settle? Drop your thoughts below! 👇
$BTC $AIN $ICNT
#bitcoinetfssee$412mnetoutflows #BTC #CryptoMarket #BTCETF
DopamineGLOBAL:
etf outflows are heavy, but 75k holding is telling
2
2
2.4k
BITCOIN ETFs BLEED $411.9 MILLION — INSTITUTIONAL PRESSURE GROWS!#BitcoinETFsSee$412MNetOutflows
🔴U.S. Spot Bitcoin ETFs recorded another massive wave of withdrawals on November 6, raising concerns about institutional demand.
📊 KEY DATA:
- Total Net Outflows: **$411.9M**
- BlackRock IBIT: **-$403M**
- Fidelity FBTC: **+$42.8M**
- Two consecutive sessions of net outflows.
- November's first five sessions: **-$1.28 BILLION**
🔥 WHAT DOES THIS MEAN?
Institutional ETF demand is facing significant pressure. BlackRock's massive outflow outweighed Fidelity's positive inflows.
However, ETF outflows alone do not confirm a long-term Bitcoin bearish trend.
👀 **MARKET WATCH:**
Will Bitcoin recover, or are more downside moves ahead?
💬 **YOUR TAKE:**
🐻 More downside ahead?
🐂 Or a bullish reversal?
#Bitcoin #BTC #BitcoinETF #CryptoMarket
$ETHT.ETF $IBIT.ETF $FBTC.ETF
BITCOIN ETFs BLEED $411.9 MILLION — INSTITUTIONAL PRESSURE GROWS!
#BitcoinETFsSee$412MNetOutflows
🔴U.S. Spot Bitcoin ETFs recorded another massive wave of withdrawals on November 6, raising concerns about institutional demand.
📊 KEY DATA:
- Total Net Outflows: **$411.9M**
- BlackRock IBIT: **-$403M**
- Fidelity FBTC: **+$42.8M**
- Two consecutive sessions of net outflows.
- November's first five sessions: **-$1.28 BILLION**
🔥 WHAT DOES THIS MEAN?
Institutional ETF demand is facing significant pressure. BlackRock's massive outflow outweighed Fidelity's positive inflows.
However, ETF outflows alone do not confirm a long-term Bitcoin bearish trend.
👀 **MARKET WATCH:**
Will Bitcoin recover, or are more downside moves ahead?
💬 **YOUR TAKE:**
🐻 More downside ahead?
🐂 Or a bullish reversal?
#Bitcoin #BTC #BitcoinETF #CryptoMarket
$ETHT.ETF $IBIT.ETF $FBTC.ETF
🔴U.S. Spot Bitcoin ETFs recorded another massive wave of withdrawals on November 6, raising concerns about institutional demand.
📊 KEY DATA:
- Total Net Outflows: **$411.9M**
- BlackRock IBIT: **-$403M**
- Fidelity FBTC: **+$42.8M**
- Two consecutive sessions of net outflows.
- November's first five sessions: **-$1.28 BILLION**
🔥 WHAT DOES THIS MEAN?
Institutional ETF demand is facing significant pressure. BlackRock's massive outflow outweighed Fidelity's positive inflows.
However, ETF outflows alone do not confirm a long-term Bitcoin bearish trend.
👀 **MARKET WATCH:**
Will Bitcoin recover, or are more downside moves ahead?
💬 **YOUR TAKE:**
🐻 More downside ahead?
🐂 Or a bullish reversal?
#Bitcoin #BTC #BitcoinETF #CryptoMarket
$ETHT.ETF $IBIT.ETF $FBTC.ETF
2
6


·
--
Bitcoin ETF Outflows Raise Concerns: Are Institutional Investors Reducing Risk?#BitcoinETFsSee$412MNetOutflows
Bitcoin is facing another warning sign from traditional financial markets: money is flowing out of spot Bitcoin ETFs.
On November 5, US spot Bitcoin ETFs recorded $430.2 million in net outflows, according to Farside Investors data. Fidelity's FBTC led withdrawals with $199.9 million, followed by BlackRock's IBIT with $105 million. No fund recorded a positive net flow that day.
The pressure came as Bitcoin dropped below $76,000 and technology stocks suffered a sharp sell-off. Investors appeared to be reducing exposure to risk-sensitive assets.
Why does this matter?
Spot ETF flows are an important indicator of demand from investors using traditional brokerage accounts. Persistent outflows can weaken institutional buying support, particularly when market sentiment is already fragile.
However, ETF withdrawals do not automatically mean institutions have abandoned Bitcoin. Investors may also be reducing risk, rebalancing portfolios or taking profits.
My view: One session of outflows does not define Bitcoin's long-term direction, but repeated withdrawals deserve attention. I would look for sustained positive ETF flows alongside price strength before calling this a recovery in institutional demand.
Are these outflows a temporary reaction to market volatility, or a sign that institutional investors are becoming more cautious about Bitcoin?
#Bitcoin #BTC #BitcoinETF #CryptoMarket
Bitcoin ETF Outflows Raise Concerns: Are Institutional Investors Reducing Risk?
#BitcoinETFsSee$412MNetOutflows
Bitcoin is facing another warning sign from traditional financial markets: money is flowing out of spot Bitcoin ETFs.
On November 5, US spot Bitcoin ETFs recorded $430.2 million in net outflows, according to Farside Investors data. Fidelity's FBTC led withdrawals with $199.9 million, followed by BlackRock's IBIT with $105 million. No fund recorded a positive net flow that day.
The pressure came as Bitcoin dropped below $76,000 and technology stocks suffered a sharp sell-off. Investors appeared to be reducing exposure to risk-sensitive assets.
Why does this matter?
Spot ETF flows are an important indicator of demand from investors using traditional brokerage accounts. Persistent outflows can weaken institutional buying support, particularly when market sentiment is already fragile.
However, ETF withdrawals do not automatically mean institutions have abandoned Bitcoin. Investors may also be reducing risk, rebalancing portfolios or taking profits.
My view: One session of outflows does not define Bitcoin's long-term direction, but repeated withdrawals deserve attention. I would look for sustained positive ETF flows alongside price strength before calling this a recovery in institutional demand.
Are these outflows a temporary reaction to market volatility, or a sign that institutional investors are becoming more cautious about Bitcoin?
#Bitcoin #BTC #BitcoinETF #CryptoMarket
Bitcoin is facing another warning sign from traditional financial markets: money is flowing out of spot Bitcoin ETFs.
On November 5, US spot Bitcoin ETFs recorded $430.2 million in net outflows, according to Farside Investors data. Fidelity's FBTC led withdrawals with $199.9 million, followed by BlackRock's IBIT with $105 million. No fund recorded a positive net flow that day.
The pressure came as Bitcoin dropped below $76,000 and technology stocks suffered a sharp sell-off. Investors appeared to be reducing exposure to risk-sensitive assets.
Why does this matter?
Spot ETF flows are an important indicator of demand from investors using traditional brokerage accounts. Persistent outflows can weaken institutional buying support, particularly when market sentiment is already fragile.
However, ETF withdrawals do not automatically mean institutions have abandoned Bitcoin. Investors may also be reducing risk, rebalancing portfolios or taking profits.
My view: One session of outflows does not define Bitcoin's long-term direction, but repeated withdrawals deserve attention. I would look for sustained positive ETF flows alongside price strength before calling this a recovery in institutional demand.
Are these outflows a temporary reaction to market volatility, or a sign that institutional investors are becoming more cautious about Bitcoin?
#Bitcoin #BTC #BitcoinETF #CryptoMarket
Trader M08:
Agree that one session doesn't set the direction, and price backs that up so far. On Binance spot BTC dipped to 74,888 on Nov 6 but still closed at 75,844, and today it trades near 76,050. If outflows keep coming while price holds that low, the selling is being absorbed. A daily close under 74,888 would tell a different story.
1
2
108

·
--
Рост
#BitcoinETFsSee$412MNetOutflows
🚨 BITCOIN ETFs BLEED $412 MILLION — ARE INSTITUTIONS LOSING CONFIDENCE IN BTC?
Bitcoin is facing another important test as spot Bitcoin ETFs record approximately $412 million in net outflows.
Institutional investors are pulling money out, raising fresh questions about short-term market sentiment and where BTC could move next.
🔥 WHAT'S HAPPENING?
Spot Bitcoin ETFs recorded $412 million in net outflows.
Institutional demand is showing signs of weakness.
Selling pressure could create additional volatility.
Traders are closely watching whether Bitcoin can defend its key support levels.
📊 WHY IT MATTERS
ETF flows are an important indicator of institutional sentiment. When large amounts of capital leave these products, it can signal reduced demand and put additional pressure on Bitcoin.
However, one day of outflows does not necessarily mean institutions are abandoning BTC.
The bigger question is whether this is temporary profit-taking or the beginning of a larger shift in institutional positioning.
Can Bitcoin absorb the selling pressure and recover, or are more downside moves coming?$BTC
#Bitcoin❗ #BitcoinETF #CryptoMarket
#BitcoinETFsSee$412MNetOutflows
🚨 BITCOIN ETFs BLEED $412 MILLION — ARE INSTITUTIONS LOSING CONFIDENCE IN BTC?
Bitcoin is facing another important test as spot Bitcoin ETFs record approximately $412 million in net outflows.
Institutional investors are pulling money out, raising fresh questions about short-term market sentiment and where BTC could move next.
🔥 WHAT'S HAPPENING?
Spot Bitcoin ETFs recorded $412 million in net outflows.
Institutional demand is showing signs of weakness.
Selling pressure could create additional volatility.
Traders are closely watching whether Bitcoin can defend its key support levels.
📊 WHY IT MATTERS
ETF flows are an important indicator of institutional sentiment. When large amounts of capital leave these products, it can signal reduced demand and put additional pressure on Bitcoin.
However, one day of outflows does not necessarily mean institutions are abandoning BTC.
The bigger question is whether this is temporary profit-taking or the beginning of a larger shift in institutional positioning.
Can Bitcoin absorb the selling pressure and recover, or are more downside moves coming?$BTC
#Bitcoin❗ #BitcoinETF #CryptoMarket
🚨 BITCOIN ETFs BLEED $412 MILLION — ARE INSTITUTIONS LOSING CONFIDENCE IN BTC?
Bitcoin is facing another important test as spot Bitcoin ETFs record approximately $412 million in net outflows.
Institutional investors are pulling money out, raising fresh questions about short-term market sentiment and where BTC could move next.
🔥 WHAT'S HAPPENING?
Spot Bitcoin ETFs recorded $412 million in net outflows.
Institutional demand is showing signs of weakness.
Selling pressure could create additional volatility.
Traders are closely watching whether Bitcoin can defend its key support levels.
📊 WHY IT MATTERS
ETF flows are an important indicator of institutional sentiment. When large amounts of capital leave these products, it can signal reduced demand and put additional pressure on Bitcoin.
However, one day of outflows does not necessarily mean institutions are abandoning BTC.
The bigger question is whether this is temporary profit-taking or the beginning of a larger shift in institutional positioning.
Can Bitcoin absorb the selling pressure and recover, or are more downside moves coming?$BTC
#Bitcoin❗ #BitcoinETF #CryptoMarket
71

·
--
Падение
#BitcoinETFsSee$412MNetOutflows
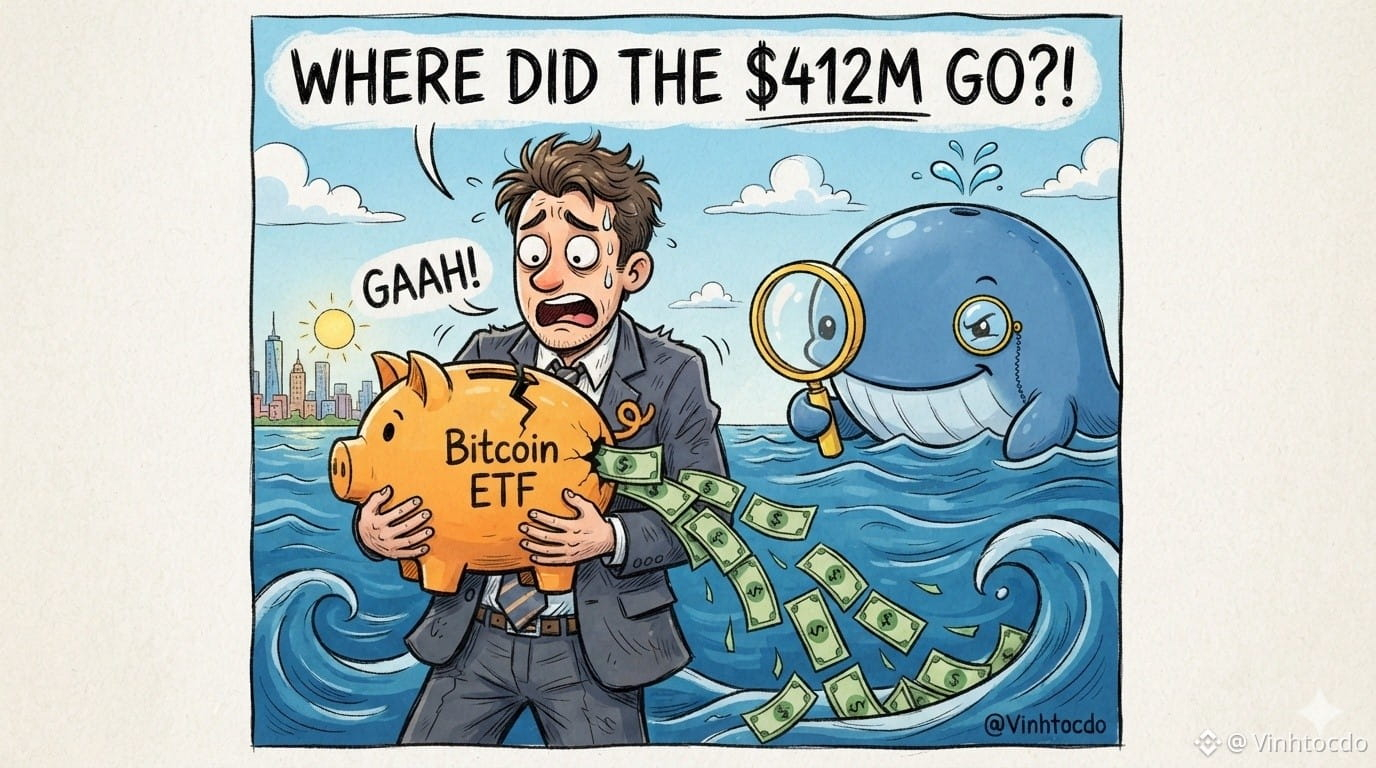
Tin chấn động! Các "vua lì đòn" phố Wall vừa rút ròng 412 triệu USD khỏi các quỹ Bitcoin ETF, riêng anh cả BlackRock gánh hết 403 triệu. Lạ kỳ là thợ đào Bitdeer đào được bao nhiêu cũng bán sạch, giữ ví về 0.
Phải chăng cá voi đang ngửi thấy mùi "biến" địa chính trị giữa Mỹ và Iran? Hay tại vì BTC đang dính chặt lấy chỉ số chứng khoán S&P 500 với độ tương quan tận 0.8 (cao nhất từ 2020), nên hễ kinh tế vĩ mô hắt hơi là crypto sổ mũi?
Trader làm gì lúc này? Thắt dây an toàn, ngồi im quan sát hoặc tranh thủ tạo tài khoản mới đua tốc độ với tôi qua link: [https://www.binance.com/register?ref=VINHTOCDO](https://www.binance.com/register?ref=VINHTOCDO) (Mã: VINHTOCDO).
Đây không phải lời khuyên tài chính.
Click giao dịch bên dưới để ủng hộ tôi:
$BTC
{spot}(BTCUSDT)
$SOL
{spot}(SOLUSDT)
$ONE
{future}(ONEUSDT)
#CryptoNews #Bitcoin #Whales #MacroEconomy #VINHTOCDO #ETFs
#BitcoinETFsSee$412MNetOutflows
Tin chấn động! Các "vua lì đòn" phố Wall vừa rút ròng 412 triệu USD khỏi các quỹ Bitcoin ETF, riêng anh cả BlackRock gánh hết 403 triệu. Lạ kỳ là thợ đào Bitdeer đào được bao nhiêu cũng bán sạch, giữ ví về 0.
Phải chăng cá voi đang ngửi thấy mùi "biến" địa chính trị giữa Mỹ và Iran? Hay tại vì BTC đang dính chặt lấy chỉ số chứng khoán S&P 500 với độ tương quan tận 0.8 (cao nhất từ 2020), nên hễ kinh tế vĩ mô hắt hơi là crypto sổ mũi?
Trader làm gì lúc này? Thắt dây an toàn, ngồi im quan sát hoặc tranh thủ tạo tài khoản mới đua tốc độ với tôi qua link: https://www.binance.com/register?ref=VINHTOCDO (Mã: VINHTOCDO).
Đây không phải lời khuyên tài chính.
Click giao dịch bên dưới để ủng hộ tôi:
$BTC
$SOL
$ONE
#CryptoNews #Bitcoin #Whales #MacroEconomy #VINHTOCDO #ETFs
Tin chấn động! Các "vua lì đòn" phố Wall vừa rút ròng 412 triệu USD khỏi các quỹ Bitcoin ETF, riêng anh cả BlackRock gánh hết 403 triệu. Lạ kỳ là thợ đào Bitdeer đào được bao nhiêu cũng bán sạch, giữ ví về 0.
Phải chăng cá voi đang ngửi thấy mùi "biến" địa chính trị giữa Mỹ và Iran? Hay tại vì BTC đang dính chặt lấy chỉ số chứng khoán S&P 500 với độ tương quan tận 0.8 (cao nhất từ 2020), nên hễ kinh tế vĩ mô hắt hơi là crypto sổ mũi?
Trader làm gì lúc này? Thắt dây an toàn, ngồi im quan sát hoặc tranh thủ tạo tài khoản mới đua tốc độ với tôi qua link: https://www.binance.com/register?ref=VINHTOCDO (Mã: VINHTOCDO).
Đây không phải lời khuyên tài chính.
Click giao dịch bên dưới để ủng hộ tôi:
$BTC
$SOL
$ONE
#CryptoNews #Bitcoin #Whales #MacroEconomy #VINHTOCDO #ETFs
Farzanahameed01:
I read your full post, this is really worrying. $412M outflows and BlackRock $403M alone is big, but Bitdeer miners selling everything and keeping wallets at zero is more scary for me. And that 0.8 correlation with S&P 500 - highest since 2020 - means we can't hide from macro now. Do you think it's US-Iran tension or just S&P following? I am buckle up and sitting tight for now. 🦋
2
1
4
424

·
--

Статья
RKLB$RKLB Rocket Lab (RKLB) – Latest Analysis
First, an important distinction: Rocket Lab (NASDAQ: RKLB) is a space-launch and aerospace company's stock, not a cryptocurrency coin.
Its investment outlook depends on launch activity, Neutron rocket development, government contracts, revenue growth, and cash flow.
Recent reported price: Around $54.73 on October 30.
Major concern: Neutron rocket's first flight has been delayed to 2027.
Upcoming catalyst: Q3 2026 earnings expected November 9.
Positive factor: Strong government and defense contracts, including a $397 million Space Force award.
Bullish vs bearish outlook
Factor Outlook
Space Systems business Bullish
Government contracts Bullish
Electron launches Bullish
Neutron delay Bearish
High valuation Bearish
November earnings Major catalyst
Short term: Cautious; volatility may remain high ahead of earnings.
Medium term: Recovery possible if revenue growth and contract execution remain strong.
Long term: Interesting space-sector growth opportunity, but Neutron execution is critical.
#BitcoinETFsSee$412MNetOutflows #AnthropicStillPlansPreThanksgivingIPO
{stock_us}(RKLB.US)
RKLB
$RKLB Rocket Lab (RKLB) – Latest Analysis
First, an important distinction: Rocket Lab (NASDAQ: RKLB) is a space-launch and aerospace company's stock, not a cryptocurrency coin.
Its investment outlook depends on launch activity, Neutron rocket development, government contracts, revenue growth, and cash flow.
Recent reported price: Around $54.73 on October 30.
Major concern: Neutron rocket's first flight has been delayed to 2027.
Upcoming catalyst: Q3 2026 earnings expected November 9.
Positive factor: Strong government and defense contracts, including a $397 million Space Force award.
Bullish vs bearish outlook
Factor Outlook
Space Systems business Bullish
Government contracts Bullish
Electron launches Bullish
Neutron delay Bearish
High valuation Bearish
November earnings Major catalyst
Short term: Cautious; volatility may remain high ahead of earnings.
Medium term: Recovery possible if revenue growth and contract execution remain strong.
Long term: Interesting space-sector growth opportunity, but Neutron execution is critical.
#BitcoinETFsSee$412MNetOutflows #AnthropicStillPlansPreThanksgivingIPO
First, an important distinction: Rocket Lab (NASDAQ: RKLB) is a space-launch and aerospace company's stock, not a cryptocurrency coin.
Its investment outlook depends on launch activity, Neutron rocket development, government contracts, revenue growth, and cash flow.
Recent reported price: Around $54.73 on October 30.
Major concern: Neutron rocket's first flight has been delayed to 2027.
Upcoming catalyst: Q3 2026 earnings expected November 9.
Positive factor: Strong government and defense contracts, including a $397 million Space Force award.
Bullish vs bearish outlook
Factor Outlook
Space Systems business Bullish
Government contracts Bullish
Electron launches Bullish
Neutron delay Bearish
High valuation Bearish
November earnings Major catalyst
Short term: Cautious; volatility may remain high ahead of earnings.
Medium term: Recovery possible if revenue growth and contract execution remain strong.
Long term: Interesting space-sector growth opportunity, but Neutron execution is critical.
#BitcoinETFsSee$412MNetOutflows #AnthropicStillPlansPreThanksgivingIPO
RKLB+13,58%
RKLBUS+16,81%
2
36

·
--
Статья
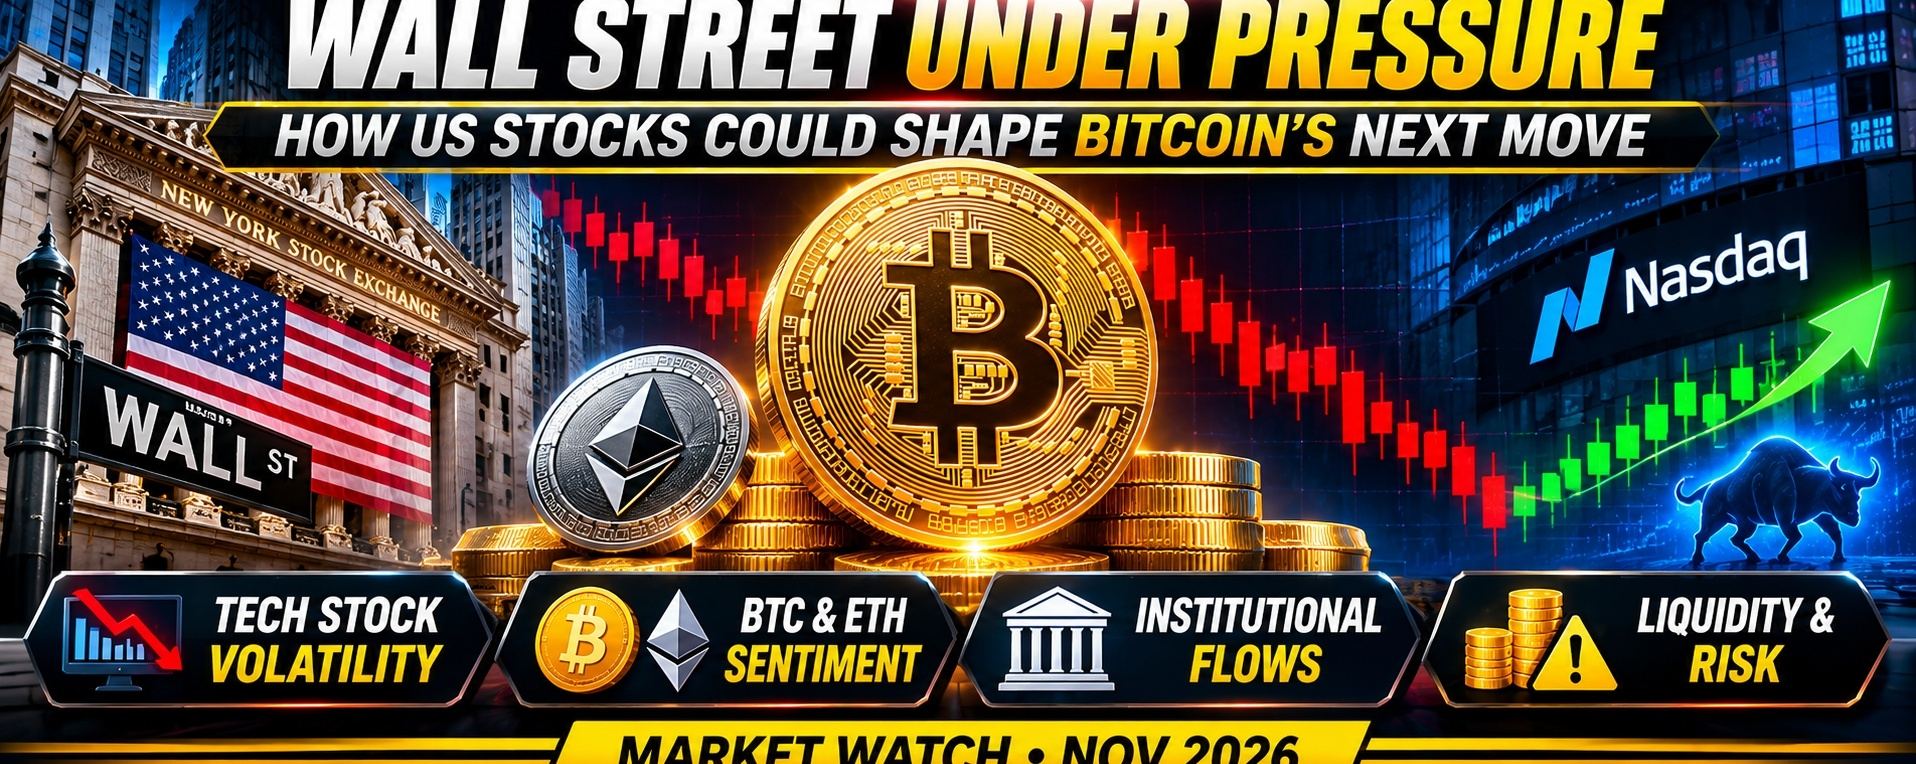
Wall Street Under Pressure: How the US Stock Market Could Shape Bitcoin's Next MoveThe next major crypto move may not begin inside the crypto market. It could start on Wall Street.
The relationship between traditional financial markets and digital assets is becoming increasingly important as investors navigate economic uncertainty, technology-sector volatility, and changing expectations around interest rates.
Recent weakness in US technology stocks has highlighted a critical question for cryptocurrency investors: Can Bitcoin maintain its strength when traditional risk assets face pressure?
The Technology Sell-Off Changes Market Sentiment
The US stock market has experienced significant volatility as investors reassess the sustainability of massive artificial intelligence investments.
Technology companies have attracted enormous capital through the AI boom, but concerns about spending, profitability, and future returns are creating uncertainty.
When investors become cautious about technology stocks, the impact can extend beyond equities.
Bitcoin, Ethereum, and other digital assets often respond to changes in global liquidity and investor appetite for risk. Although crypto has its own fundamentals, the broader financial environment can influence short-term price movements.
Bitcoin's Next Challenge
Bitcoin remains one of the most closely watched assets during periods of market uncertainty.
Institutional participation, ETF activity, and liquidity conditions are increasingly important factors in determining its direction.
However, a recovery in Bitcoin cannot be guaranteed simply because technology stocks stabilize.
Investors will also need to monitor demand for digital assets, market positioning, and whether buying pressure can overcome selling activity.
The key is understanding that Bitcoin's performance depends on several forces working together rather than one headline.
What About Ethereum and Altcoins?
Ethereum and the broader altcoin market may experience different levels of volatility depending on liquidity and investor confidence.
When risk appetite improves, traders often become more willing to explore assets beyond Bitcoin.
But when uncertainty increases, capital can move toward more established assets or remain on the sidelines.
This makes market conditions particularly important for altcoin investors.
Strong project fundamentals may create long-term opportunities, but they do not eliminate short-term market risk.
The Bigger Picture
The current market environment is highlighting a new reality.
Crypto is no longer operating independently from global financial markets. Institutional participation has increased the importance of macroeconomic developments, traditional market liquidity, and investor confidence.
The next major move could depend on whether Wall Street stabilizes, institutional capital returns, and economic conditions become more supportive.
The real opportunity is not predicting every market movement. It is understanding what drives the market before making a decision.
Bitcoin's next chapter will be shaped by more than price charts. It will depend on liquidity, confidence, institutional demand, and the broader financial environment.
For investors, patience and risk management remain essential.
The market is evolving. The smartest approach is to stay informed, remain disciplined, and focus on the signals that truly matter.
#US Data Center Rules May Constrain AI Expansion #BitcoinETFsSee$412MNetOutflows #Ethereum #StockSale
{spot}(NVDABUSDT)
{spot}(BTCUSDT)
{spot}(ETHUSDT)
Wall Street Under Pressure: How the US Stock Market Could Shape Bitcoin's Next Move
The next major crypto move may not begin inside the crypto market. It could start on Wall Street.
The relationship between traditional financial markets and digital assets is becoming increasingly important as investors navigate economic uncertainty, technology-sector volatility, and changing expectations around interest rates.
Recent weakness in US technology stocks has highlighted a critical question for cryptocurrency investors: Can Bitcoin maintain its strength when traditional risk assets face pressure?
The Technology Sell-Off Changes Market Sentiment
The US stock market has experienced significant volatility as investors reassess the sustainability of massive artificial intelligence investments.
Technology companies have attracted enormous capital through the AI boom, but concerns about spending, profitability, and future returns are creating uncertainty.
When investors become cautious about technology stocks, the impact can extend beyond equities.
Bitcoin, Ethereum, and other digital assets often respond to changes in global liquidity and investor appetite for risk. Although crypto has its own fundamentals, the broader financial environment can influence short-term price movements.
Bitcoin's Next Challenge
Bitcoin remains one of the most closely watched assets during periods of market uncertainty.
Institutional participation, ETF activity, and liquidity conditions are increasingly important factors in determining its direction.
However, a recovery in Bitcoin cannot be guaranteed simply because technology stocks stabilize.
Investors will also need to monitor demand for digital assets, market positioning, and whether buying pressure can overcome selling activity.
The key is understanding that Bitcoin's performance depends on several forces working together rather than one headline.
What About Ethereum and Altcoins?
Ethereum and the broader altcoin market may experience different levels of volatility depending on liquidity and investor confidence.
When risk appetite improves, traders often become more willing to explore assets beyond Bitcoin.
But when uncertainty increases, capital can move toward more established assets or remain on the sidelines.
This makes market conditions particularly important for altcoin investors.
Strong project fundamentals may create long-term opportunities, but they do not eliminate short-term market risk.
The Bigger Picture
The current market environment is highlighting a new reality.
Crypto is no longer operating independently from global financial markets. Institutional participation has increased the importance of macroeconomic developments, traditional market liquidity, and investor confidence.
The next major move could depend on whether Wall Street stabilizes, institutional capital returns, and economic conditions become more supportive.
The real opportunity is not predicting every market movement. It is understanding what drives the market before making a decision.
Bitcoin's next chapter will be shaped by more than price charts. It will depend on liquidity, confidence, institutional demand, and the broader financial environment.
For investors, patience and risk management remain essential.
The market is evolving. The smartest approach is to stay informed, remain disciplined, and focus on the signals that truly matter.
#US Data Center Rules May Constrain AI Expansion #BitcoinETFsSee$412MNetOutflows #Ethereum #StockSale
The relationship between traditional financial markets and digital assets is becoming increasingly important as investors navigate economic uncertainty, technology-sector volatility, and changing expectations around interest rates.
Recent weakness in US technology stocks has highlighted a critical question for cryptocurrency investors: Can Bitcoin maintain its strength when traditional risk assets face pressure?
The Technology Sell-Off Changes Market Sentiment
The US stock market has experienced significant volatility as investors reassess the sustainability of massive artificial intelligence investments.
Technology companies have attracted enormous capital through the AI boom, but concerns about spending, profitability, and future returns are creating uncertainty.
When investors become cautious about technology stocks, the impact can extend beyond equities.
Bitcoin, Ethereum, and other digital assets often respond to changes in global liquidity and investor appetite for risk. Although crypto has its own fundamentals, the broader financial environment can influence short-term price movements.
Bitcoin's Next Challenge
Bitcoin remains one of the most closely watched assets during periods of market uncertainty.
Institutional participation, ETF activity, and liquidity conditions are increasingly important factors in determining its direction.
However, a recovery in Bitcoin cannot be guaranteed simply because technology stocks stabilize.
Investors will also need to monitor demand for digital assets, market positioning, and whether buying pressure can overcome selling activity.
The key is understanding that Bitcoin's performance depends on several forces working together rather than one headline.
What About Ethereum and Altcoins?
Ethereum and the broader altcoin market may experience different levels of volatility depending on liquidity and investor confidence.
When risk appetite improves, traders often become more willing to explore assets beyond Bitcoin.
But when uncertainty increases, capital can move toward more established assets or remain on the sidelines.
This makes market conditions particularly important for altcoin investors.
Strong project fundamentals may create long-term opportunities, but they do not eliminate short-term market risk.
The Bigger Picture
The current market environment is highlighting a new reality.
Crypto is no longer operating independently from global financial markets. Institutional participation has increased the importance of macroeconomic developments, traditional market liquidity, and investor confidence.
The next major move could depend on whether Wall Street stabilizes, institutional capital returns, and economic conditions become more supportive.
The real opportunity is not predicting every market movement. It is understanding what drives the market before making a decision.
Bitcoin's next chapter will be shaped by more than price charts. It will depend on liquidity, confidence, institutional demand, and the broader financial environment.
For investors, patience and risk management remain essential.
The market is evolving. The smartest approach is to stay informed, remain disciplined, and focus on the signals that truly matter.
#US Data Center Rules May Constrain AI Expansion #BitcoinETFsSee$412MNetOutflows #Ethereum #StockSale
42

·
--
Рост
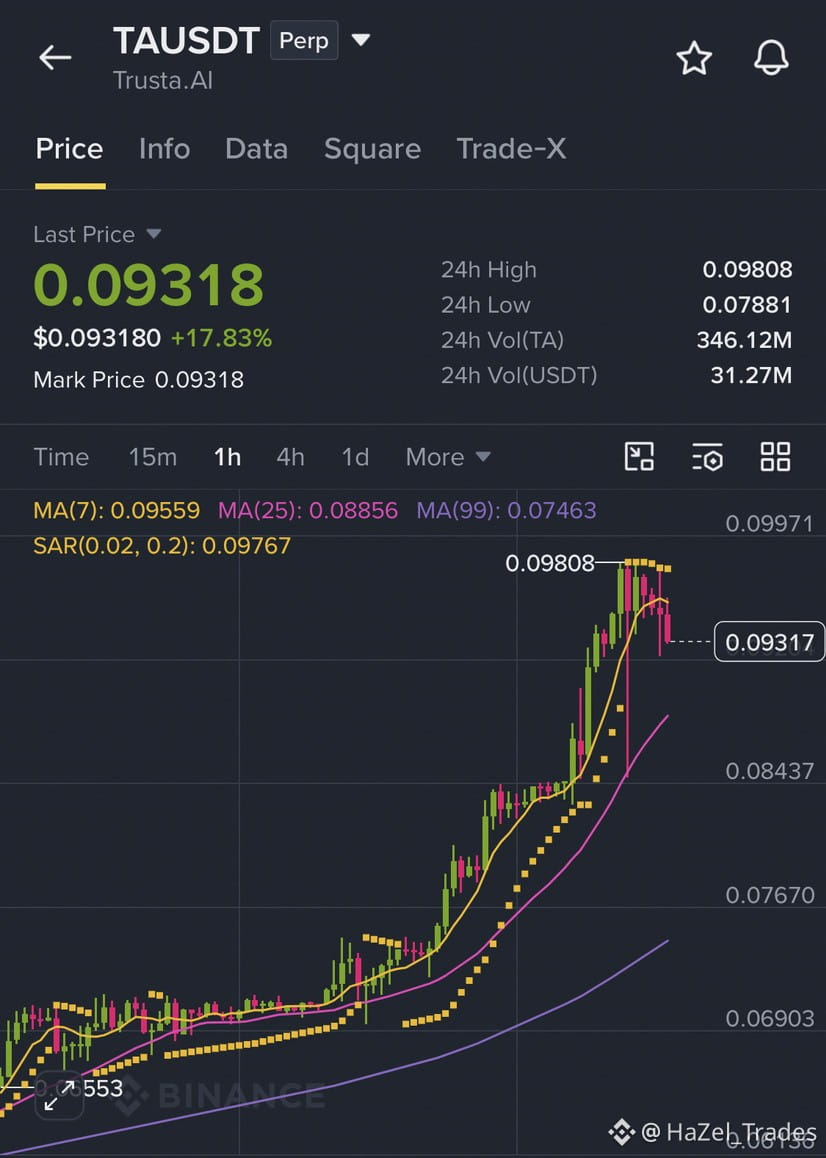
Bears are loading up for a swift downside sweep as price retests overhead supply under persistent selling pressure!
$TA – SHORT (Scalp Setup)
Trade Plan:
Bullet Entry: 0.09350 – 0.09500
Bullet SL: 0.09900
Bullet TP1: 0.09100
Bullet TP2: 0.08800
Bullet TP3: 0.08500
Why this setup?
Bullet Price action is facing localized rejection near the 0.0950 supply zone, favoring a short-side continuation down toward lower support levels.
Bullet Tighter swing targets allow for fast profit booking before any potential bullish reversal or liquidity sweep occurs.
Bullet Fixed stop loss above 0.0990 keeps risk strictly managed against any unexpected overhead momentum expansion.
— Hazel Trades 🌸$TA
{future}(TAUSDT)
#BitcoinRebounds$75KAsChipsLead #JobsReportRaisesHikeOdds #US Data Center Rules May Constrain AI Expansion #BitcoinETFsSee$412MNetOutflows
Bears are loading up for a swift downside sweep as price retests overhead supply under persistent selling pressure!
$TA – SHORT (Scalp Setup)
Trade Plan:
Bullet Entry: 0.09350 – 0.09500
Bullet SL: 0.09900
Bullet TP1: 0.09100
Bullet TP2: 0.08800
Bullet TP3: 0.08500
Why this setup?
Bullet Price action is facing localized rejection near the 0.0950 supply zone, favoring a short-side continuation down toward lower support levels.
Bullet Tighter swing targets allow for fast profit booking before any potential bullish reversal or liquidity sweep occurs.
Bullet Fixed stop loss above 0.0990 keeps risk strictly managed against any unexpected overhead momentum expansion.
— Hazel Trades 🌸$TA
#BitcoinRebounds$75KAsChipsLead #JobsReportRaisesHikeOdds #US Data Center Rules May Constrain AI Expansion #BitcoinETFsSee$412MNetOutflows
$TA – SHORT (Scalp Setup)
Trade Plan:
Bullet Entry: 0.09350 – 0.09500
Bullet SL: 0.09900
Bullet TP1: 0.09100
Bullet TP2: 0.08800
Bullet TP3: 0.08500
Why this setup?
Bullet Price action is facing localized rejection near the 0.0950 supply zone, favoring a short-side continuation down toward lower support levels.
Bullet Tighter swing targets allow for fast profit booking before any potential bullish reversal or liquidity sweep occurs.
Bullet Fixed stop loss above 0.0990 keeps risk strictly managed against any unexpected overhead momentum expansion.
— Hazel Trades 🌸$TA
#BitcoinRebounds$75KAsChipsLead #JobsReportRaisesHikeOdds #US Data Center Rules May Constrain AI Expansion #BitcoinETFsSee$412MNetOutflows
21

·
--
💀📉 $INTW FROM $37.40 TO $4.32 IN JUST TWO MONTHS?!
That's an insane 88% crash! 😭
How many traders got wiped out holding this Intel-related ticker?
Imagine buying at $37.40, thinking you've found the perfect entry… only to watch it collapse to $4.32.
THIS ISN'T A DIP. THIS IS A PORTFOLIO NIGHTMARE. 💀
🔥 The big question now:
Is $INTW finally cheap enough for a rebound, or is there still more pain ahead?
👇 WHO'S STILL HOLDING THE BAG? 😂
{future}(INTWUSDT)
#jobsreportraiseshikeodds #BitcoinRebounds$75KAsChipsLead #US Data Center Rules May Constrain AI Expansion #WillAnthropicListOnTime #BitcoinETFsSee$412MNetOutflows
💀📉 $INTW FROM $37.40 TO $4.32 IN JUST TWO MONTHS?!
That's an insane 88% crash! 😭
How many traders got wiped out holding this Intel-related ticker?
Imagine buying at $37.40, thinking you've found the perfect entry… only to watch it collapse to $4.32.
THIS ISN'T A DIP. THIS IS A PORTFOLIO NIGHTMARE. 💀
🔥 The big question now:
Is $INTW finally cheap enough for a rebound, or is there still more pain ahead?
👇 WHO'S STILL HOLDING THE BAG? 😂
#jobsreportraiseshikeodds #BitcoinRebounds$75KAsChipsLead #US Data Center Rules May Constrain AI Expansion #WillAnthropicListOnTime #BitcoinETFsSee$412MNetOutflows
That's an insane 88% crash! 😭
How many traders got wiped out holding this Intel-related ticker?
Imagine buying at $37.40, thinking you've found the perfect entry… only to watch it collapse to $4.32.
THIS ISN'T A DIP. THIS IS A PORTFOLIO NIGHTMARE. 💀
🔥 The big question now:
Is $INTW finally cheap enough for a rebound, or is there still more pain ahead?
👇 WHO'S STILL HOLDING THE BAG? 😂
#jobsreportraiseshikeodds #BitcoinRebounds$75KAsChipsLead #US Data Center Rules May Constrain AI Expansion #WillAnthropicListOnTime #BitcoinETFsSee$412MNetOutflows
143

Статья
QNTB Coin: Exploring the Future of Tokenized Stocks and Quantum ComputingThe cryptocurrency market continues to evolve as blockchain technology connects with traditional financial markets. One interesting asset attracting attention is QNTB, also known as Quantinuum Tokenized bStocks. This token brings together the concept of tokenized stocks and the growing interest in quantum computing technology.
QNTB is part of the tokenized asset (RWA) sector, which aims to represent traditional financial assets through blockchain-based products.
What Is QNTB Coin?
QNTB is a tokenized bStocks product designed to provide economic exposure to Quantinuum. It operates on blockchain infrastructure and allows eligible users to access tokenized stock exposure through supported trading platforms.
According to its product description, QNTB is backed by the corresponding underlying equity held by the issuer. However, investors should understand that owning a tokenized stock product is not necessarily the same as directly owning traditional shares.
This distinction is important when considering shareholder rights, redemption conditions, and regulatory protections.
Why Is QNTB Attracting Attention?
Several factors could influence interest in QNTB:
1. Quantum Computing Narrative
Quantum computing is an emerging technology with potential applications in scientific research, cybersecurity, and advanced computing. This sector may attract long-term investor interest.
2. Tokenized Real-World Assets
The RWA market is becoming an important blockchain trend. Tokenized stock products offer a bridge between conventional financial markets and digital asset trading.
3. Blockchain Accessibility
Tokenized products can offer eligible users flexible trading access through supported crypto platforms. Some products also enable trading outside conventional stock-market hours.
4. Market Sentiment
Trading volume, investor demand, broader crypto-market conditions, and developments related to the underlying company may affect QNTB's price.
QNTB Price Outlook
The future performance of QNTB depends on multiple factors, including the underlying equity's performance, liquidity, trading activity, and market sentiment.
A positive outlook for quantum computing could support investor interest. However, volatility, limited liquidity, regulatory changes, and changes in the underlying stock price may create significant risks.
#JobsReportRaisesHikeOdds #BitcoinETFsSee$412MNetOutflows #TradFiForBeginners
{future}(QNTUSDT)
{future}(QNTXUSDT)
{spot}(QCOMBUSDT)
QNTB Coin: Exploring the Future of Tokenized Stocks and Quantum Computing
The cryptocurrency market continues to evolve as blockchain technology connects with traditional financial markets. One interesting asset attracting attention is QNTB, also known as Quantinuum Tokenized bStocks. This token brings together the concept of tokenized stocks and the growing interest in quantum computing technology.
QNTB is part of the tokenized asset (RWA) sector, which aims to represent traditional financial assets through blockchain-based products.
What Is QNTB Coin?
QNTB is a tokenized bStocks product designed to provide economic exposure to Quantinuum. It operates on blockchain infrastructure and allows eligible users to access tokenized stock exposure through supported trading platforms.
According to its product description, QNTB is backed by the corresponding underlying equity held by the issuer. However, investors should understand that owning a tokenized stock product is not necessarily the same as directly owning traditional shares.
This distinction is important when considering shareholder rights, redemption conditions, and regulatory protections.
Why Is QNTB Attracting Attention?
Several factors could influence interest in QNTB:
1. Quantum Computing Narrative
Quantum computing is an emerging technology with potential applications in scientific research, cybersecurity, and advanced computing. This sector may attract long-term investor interest.
2. Tokenized Real-World Assets
The RWA market is becoming an important blockchain trend. Tokenized stock products offer a bridge between conventional financial markets and digital asset trading.
3. Blockchain Accessibility
Tokenized products can offer eligible users flexible trading access through supported crypto platforms. Some products also enable trading outside conventional stock-market hours.
4. Market Sentiment
Trading volume, investor demand, broader crypto-market conditions, and developments related to the underlying company may affect QNTB's price.
QNTB Price Outlook
The future performance of QNTB depends on multiple factors, including the underlying equity's performance, liquidity, trading activity, and market sentiment.
A positive outlook for quantum computing could support investor interest. However, volatility, limited liquidity, regulatory changes, and changes in the underlying stock price may create significant risks.
#JobsReportRaisesHikeOdds #BitcoinETFsSee$412MNetOutflows #TradFiForBeginners
QNTB is part of the tokenized asset (RWA) sector, which aims to represent traditional financial assets through blockchain-based products.
What Is QNTB Coin?
QNTB is a tokenized bStocks product designed to provide economic exposure to Quantinuum. It operates on blockchain infrastructure and allows eligible users to access tokenized stock exposure through supported trading platforms.
According to its product description, QNTB is backed by the corresponding underlying equity held by the issuer. However, investors should understand that owning a tokenized stock product is not necessarily the same as directly owning traditional shares.
This distinction is important when considering shareholder rights, redemption conditions, and regulatory protections.
Why Is QNTB Attracting Attention?
Several factors could influence interest in QNTB:
1. Quantum Computing Narrative
Quantum computing is an emerging technology with potential applications in scientific research, cybersecurity, and advanced computing. This sector may attract long-term investor interest.
2. Tokenized Real-World Assets
The RWA market is becoming an important blockchain trend. Tokenized stock products offer a bridge between conventional financial markets and digital asset trading.
3. Blockchain Accessibility
Tokenized products can offer eligible users flexible trading access through supported crypto platforms. Some products also enable trading outside conventional stock-market hours.
4. Market Sentiment
Trading volume, investor demand, broader crypto-market conditions, and developments related to the underlying company may affect QNTB's price.
QNTB Price Outlook
The future performance of QNTB depends on multiple factors, including the underlying equity's performance, liquidity, trading activity, and market sentiment.
A positive outlook for quantum computing could support investor interest. However, volatility, limited liquidity, regulatory changes, and changes in the underlying stock price may create significant risks.
#JobsReportRaisesHikeOdds #BitcoinETFsSee$412MNetOutflows #TradFiForBeginners
102

Статья
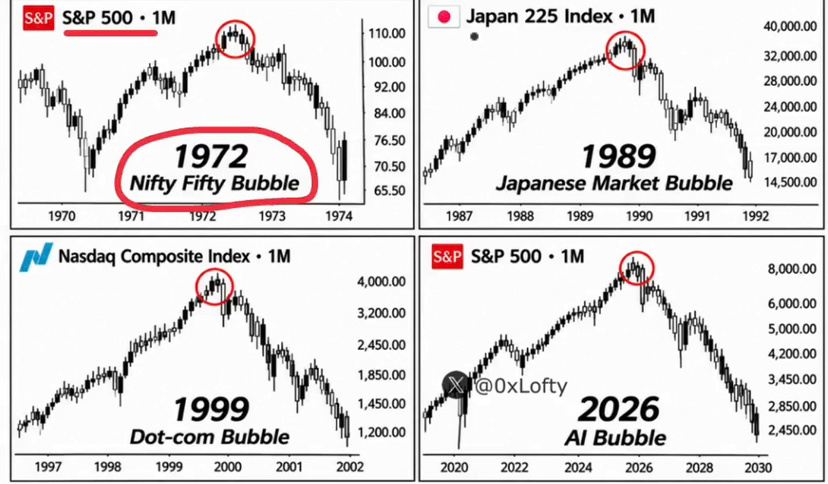
Nothing Goes Up Forever.🚨 WARNING: THE MARKET IS ENTERING A HISTORIC COLLAPSE
The warning signs are impossible to ignore.
The Nifty Fifty bubble.
The Japanese bubble.
The Dot-com bubble.
The AI bubble.
Four bubbles. One repeating pattern.
The market always teaches the same lesson:
Nothing goes up forever.
Don’t become exit liquidity.
#JobsReportRaisesHikeOdds #WillAnthropicListOnTime #BitcoinETFsSee$412MNetOutflows #HKSFCPlansToRestrictCryptoAndExchangeTerms #HKSFCPlansToRestrictCryptoAndExchangeTerms #AnthropicStillPlansPreThanksgivingIPO
Nothing Goes Up Forever.
🚨 WARNING: THE MARKET IS ENTERING A HISTORIC COLLAPSE
The warning signs are impossible to ignore.
The Nifty Fifty bubble.
The Japanese bubble.
The Dot-com bubble.
The AI bubble.
Four bubbles. One repeating pattern.
The market always teaches the same lesson:
Nothing goes up forever.
Don’t become exit liquidity.
#JobsReportRaisesHikeOdds #WillAnthropicListOnTime #BitcoinETFsSee$412MNetOutflows #HKSFCPlansToRestrictCryptoAndExchangeTerms #HKSFCPlansToRestrictCryptoAndExchangeTerms #AnthropicStillPlansPreThanksgivingIPO
The warning signs are impossible to ignore.
The Nifty Fifty bubble.
The Japanese bubble.
The Dot-com bubble.
The AI bubble.
Four bubbles. One repeating pattern.
The market always teaches the same lesson:
Nothing goes up forever.
Don’t become exit liquidity.
#JobsReportRaisesHikeOdds #WillAnthropicListOnTime #BitcoinETFsSee$412MNetOutflows #HKSFCPlansToRestrictCryptoAndExchangeTerms #HKSFCPlansToRestrictCryptoAndExchangeTerms #AnthropicStillPlansPreThanksgivingIPO
81

Статья
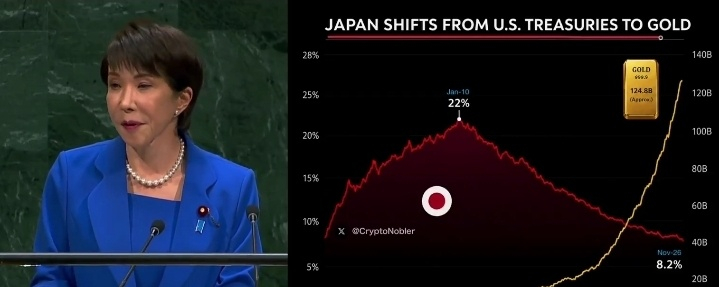
🚨 ALERT: SOMETHING UTTERLY AWFUL JUST HAPPENED MINUTES AGO!Japan dumped $160 BILLION in U.S. Treasury bonds after its stock market crashed 8% in just a few hours.
This is the largest Treasury sell-off seen in decades.
They've officially hit the PANIC button.
Japan is facing massive 30 TRILLION YEN losses on bonds.
And the situation is getting worse by the minute.
More than 21,000,000,000,000 YEN has been wiped out from Japan's stock market today.
This is NOT a normal market correction.
Something much bigger is happening in the background.
Japan is aggressively selling U.S. Treasuries to stabilize the yen and prevent a full collapse.
Meanwhile, gold reserves have hit an ALL-TIME HIGH.
Japan continues to stockpile gold while reducing its exposure to dollar-based assets.
And there's a clear reason behind it.
Japan is fighting to protect its currency.
The Bank of Japan is deploying its massive foreign exchange reserves.
And U.S. Treasuries remain one of the largest and most liquid assets available.
But Japan isn't alone.
China is pursuing a strikingly similar strategy.
China's gold reserves are reaching a new ALL-TIME HIGH while it continues to reduce its U.S. Treasury holdings.
The world's two largest economies are now moving in the same direction.
→ Japan is offloading U.S. Treasuries
→ Japan is expanding its gold reserves
→ China is offloading U.S. Treasuries
→ China is expanding its gold reserves
This is a major deviation from traditional dollar-based reserves.
And it's not necessarily because countries don't want the dollar.
It's because they HAVE NO OTHER CHOICES.
The AI bubble is bursting, and foreign markets are tanking every day.
China's AI stocks have crashed nearly 50% in just 3 months.
And this will extend beyond Japan and China.
Japan has no choice but to save its own market and defend the yen.
China wants to save its own market and achieve financial independence.
And GOLD is starting to take center stage in both strategies.
This is where things get extremely dangerous.
If Japan keeps selling Treasuries, it will create additional pressure across bond markets.
And China's sales will add even more pressure.
→ Rising Treasury liquidations
→ Growing pressure in U.S. bond markets
→ Aggressive currency intervention
→ Accelerating gold accumulation
→ Reduced dependence on the U.S. dollar
Japan isn't deliberately trying to destroy global markets.
They're trying to prevent a much larger financial crisis.
But these actions will have consequences throughout the global financial system.
And if other economies adopt the same strategy, the pressure on U.S. markets will intensify.
History's biggest market crash starts like this.
First, slowly.
Then, all at once.
And we're watching it all unfold in real time.
I've studied financial markets for decades and have accurately predicted nearly every market top and bottom.
And I'm warning you right now:
The 2026-2027 cycle will be life-changing for those who are prepared.
Make sure you're one of them.
Follow now and turn on notifications.
Because by the time everyone realizes what's happening, it'll already be too late.
$AAPLB
{spot}(AAPLBUSDT)
$NVDAB
{spot}(NVDABUSDT)
$BTC
{future}(BTCUSDT)
#BitcoinRebounds$75KAsChipsLead #JobsReportRaisesHikeOdds #AnthropicStillPlansPreThanksgivingIPO #US Data Center Rules May Constrain AI Expansion #BitcoinETFsSee$412MNetOutflows
🚨 ALERT: SOMETHING UTTERLY AWFUL JUST HAPPENED MINUTES AGO!
Japan dumped $160 BILLION in U.S. Treasury bonds after its stock market crashed 8% in just a few hours.
This is the largest Treasury sell-off seen in decades.
They've officially hit the PANIC button.
Japan is facing massive 30 TRILLION YEN losses on bonds.
And the situation is getting worse by the minute.
More than 21,000,000,000,000 YEN has been wiped out from Japan's stock market today.
This is NOT a normal market correction.
Something much bigger is happening in the background.
Japan is aggressively selling U.S. Treasuries to stabilize the yen and prevent a full collapse.
Meanwhile, gold reserves have hit an ALL-TIME HIGH.
Japan continues to stockpile gold while reducing its exposure to dollar-based assets.
And there's a clear reason behind it.
Japan is fighting to protect its currency.
The Bank of Japan is deploying its massive foreign exchange reserves.
And U.S. Treasuries remain one of the largest and most liquid assets available.
But Japan isn't alone.
China is pursuing a strikingly similar strategy.
China's gold reserves are reaching a new ALL-TIME HIGH while it continues to reduce its U.S. Treasury holdings.
The world's two largest economies are now moving in the same direction.
→ Japan is offloading U.S. Treasuries
→ Japan is expanding its gold reserves
→ China is offloading U.S. Treasuries
→ China is expanding its gold reserves
This is a major deviation from traditional dollar-based reserves.
And it's not necessarily because countries don't want the dollar.
It's because they HAVE NO OTHER CHOICES.
The AI bubble is bursting, and foreign markets are tanking every day.
China's AI stocks have crashed nearly 50% in just 3 months.
And this will extend beyond Japan and China.
Japan has no choice but to save its own market and defend the yen.
China wants to save its own market and achieve financial independence.
And GOLD is starting to take center stage in both strategies.
This is where things get extremely dangerous.
If Japan keeps selling Treasuries, it will create additional pressure across bond markets.
And China's sales will add even more pressure.
→ Rising Treasury liquidations
→ Growing pressure in U.S. bond markets
→ Aggressive currency intervention
→ Accelerating gold accumulation
→ Reduced dependence on the U.S. dollar
Japan isn't deliberately trying to destroy global markets.
They're trying to prevent a much larger financial crisis.
But these actions will have consequences throughout the global financial system.
And if other economies adopt the same strategy, the pressure on U.S. markets will intensify.
History's biggest market crash starts like this.
First, slowly.
Then, all at once.
And we're watching it all unfold in real time.
I've studied financial markets for decades and have accurately predicted nearly every market top and bottom.
And I'm warning you right now:
The 2026-2027 cycle will be life-changing for those who are prepared.
Make sure you're one of them.
Follow now and turn on notifications.
Because by the time everyone realizes what's happening, it'll already be too late.
$AAPLB
$NVDAB
$BTC
#BitcoinRebounds$75KAsChipsLead #JobsReportRaisesHikeOdds #AnthropicStillPlansPreThanksgivingIPO #US Data Center Rules May Constrain AI Expansion #BitcoinETFsSee$412MNetOutflows
This is the largest Treasury sell-off seen in decades.
They've officially hit the PANIC button.
Japan is facing massive 30 TRILLION YEN losses on bonds.
And the situation is getting worse by the minute.
More than 21,000,000,000,000 YEN has been wiped out from Japan's stock market today.
This is NOT a normal market correction.
Something much bigger is happening in the background.
Japan is aggressively selling U.S. Treasuries to stabilize the yen and prevent a full collapse.
Meanwhile, gold reserves have hit an ALL-TIME HIGH.
Japan continues to stockpile gold while reducing its exposure to dollar-based assets.
And there's a clear reason behind it.
Japan is fighting to protect its currency.
The Bank of Japan is deploying its massive foreign exchange reserves.
And U.S. Treasuries remain one of the largest and most liquid assets available.
But Japan isn't alone.
China is pursuing a strikingly similar strategy.
China's gold reserves are reaching a new ALL-TIME HIGH while it continues to reduce its U.S. Treasury holdings.
The world's two largest economies are now moving in the same direction.
→ Japan is offloading U.S. Treasuries
→ Japan is expanding its gold reserves
→ China is offloading U.S. Treasuries
→ China is expanding its gold reserves
This is a major deviation from traditional dollar-based reserves.
And it's not necessarily because countries don't want the dollar.
It's because they HAVE NO OTHER CHOICES.
The AI bubble is bursting, and foreign markets are tanking every day.
China's AI stocks have crashed nearly 50% in just 3 months.
And this will extend beyond Japan and China.
Japan has no choice but to save its own market and defend the yen.
China wants to save its own market and achieve financial independence.
And GOLD is starting to take center stage in both strategies.
This is where things get extremely dangerous.
If Japan keeps selling Treasuries, it will create additional pressure across bond markets.
And China's sales will add even more pressure.
→ Rising Treasury liquidations
→ Growing pressure in U.S. bond markets
→ Aggressive currency intervention
→ Accelerating gold accumulation
→ Reduced dependence on the U.S. dollar
Japan isn't deliberately trying to destroy global markets.
They're trying to prevent a much larger financial crisis.
But these actions will have consequences throughout the global financial system.
And if other economies adopt the same strategy, the pressure on U.S. markets will intensify.
History's biggest market crash starts like this.
First, slowly.
Then, all at once.
And we're watching it all unfold in real time.
I've studied financial markets for decades and have accurately predicted nearly every market top and bottom.
And I'm warning you right now:
The 2026-2027 cycle will be life-changing for those who are prepared.
Make sure you're one of them.
Follow now and turn on notifications.
Because by the time everyone realizes what's happening, it'll already be too late.
$AAPLB
$NVDAB
$BTC
#BitcoinRebounds$75KAsChipsLead #JobsReportRaisesHikeOdds #AnthropicStillPlansPreThanksgivingIPO #US Data Center Rules May Constrain AI Expansion #BitcoinETFsSee$412MNetOutflows
53

Статья
BTC at $75.9K: Pause Before the Next Move, or Just Another Trap?━━━━━━━━━━━━━━━━━━━━
Bitcoin has been quiet for a few hours, and after the week it just had, quiet feels strange.
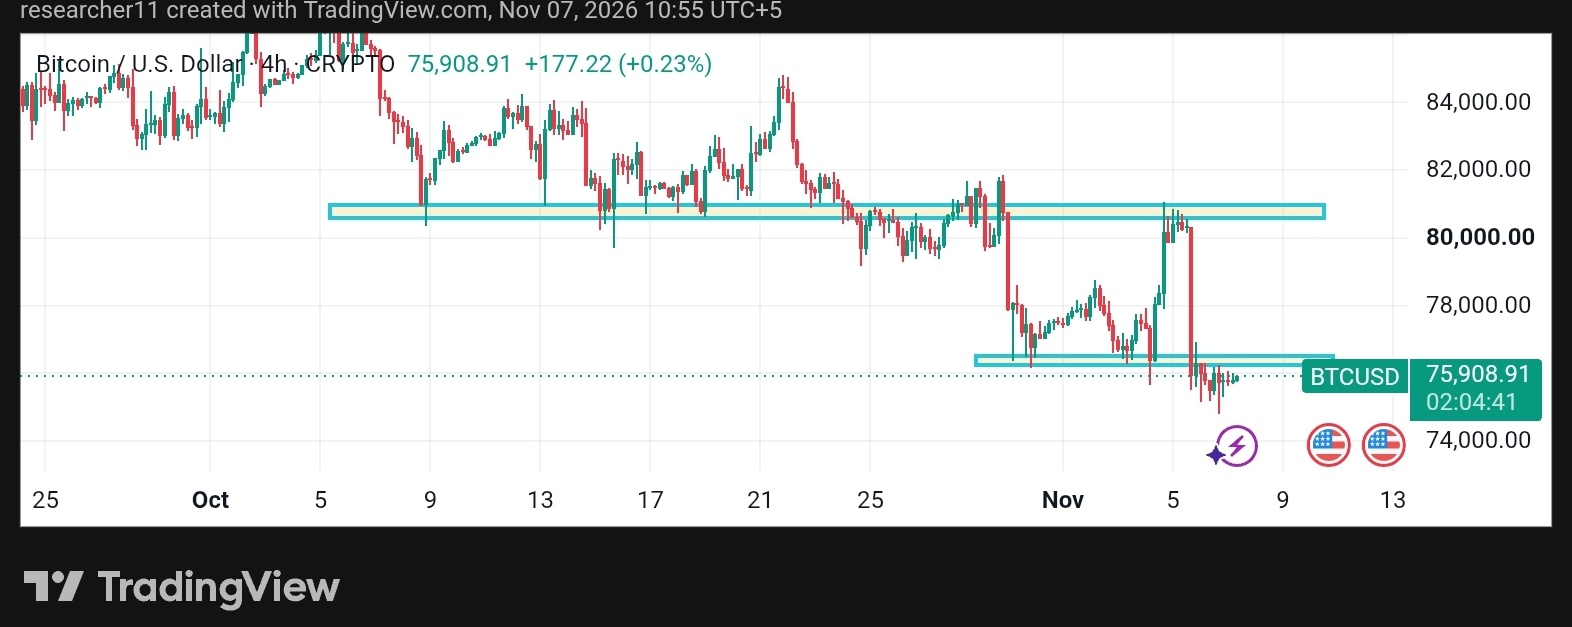
On Nov 5, BTC pushed up toward the $81K zone and got rejected hard. Within hours, price slid into the mid-$75Ks, and now it is moving sideways. The question is whether this is a base or just a breather.
Let's break it down step by step.
━━━━━━━━━━━━━━━━━━━━
◆ ① WHERE BTC STANDS RIGHT NOW
➤ BTC is trading around $75,900 on the 4H chart (+0.23% at the time of the snapshot).
➤ Fortune put Bitcoin at $76,023.87 on the morning of Nov 6, about $4,197 lower than the previous morning.
➤ The coin is down about 29% over the past year and about 10.9% year to date.
➤ ETH is also under pressure, trading near $2,240 per Fortune's Nov 6 data.
The trend has been lower highs and lower lows since late October. That is the reality of the chart right now.
━━━━━━━━━━━━━━━━━━━━
◆ ② WHAT IS PUSHING THE MARKET
Price does not move in a vacuum. Three forces stand out this week:
✔︎ ETF outflows. All spot Bitcoin ETFs saw outflows on Nov 5, with about $430M leaving. Less institutional demand means less support under price.
✔︎ Leverage getting flushed. Roughly $250M in positions were liquidated as BTC slipped under $76,000 on Nov 3-4. Forced selling makes moves faster and uglier.
✔︎ Risk-off mood. Weakness in global tech stocks added to the pressure. Bitcoin still trades a lot like a risk asset in stressed weeks.
━━━━━━━━━━━━━━━━━━━━
◆ ③ READING THE 4H CHART
① The $80K–$81K zone was a major pivot. BTC spent weeks around it in October, broke below it, then retested it from underneath on Nov 5. The rejection was sharp, a textbook example of old support turning into resistance.
② The drop from ~$81K to ~$75K was a single, fast, one-sided move. That kind of candle usually means stop-losses and liquidations, not slow, patient selling.
③ The candles since then are small and tight. That is compression. Compression often comes before expansion, but the chart does not tell us which direction.
④ The ~$76K–$76.6K area is the first overhead test. It was support a few days ago, so many traders will be watching how price behaves when it returns there.
━━━━━━━━━━━━━━━━━━━━
◆ ④ KEY LEVELS TO WATCH
➜ Resistance 2: ~$81,000 (the Nov 5 rejection zone)
➜ Resistance 1: ~$76,500 (former support, now a test)
➜ Support 1: ~$74,700 (recent swing low)
➜ Support 2: ~$74,000 (psychological round number)
Levels are zones, not exact lines. Wicks happen, so always leave room for noise.
━━━━━━━━━━━━━━━━━━━━
◆ ⑤ THREE SCENARIOS (EDUCATIONAL, NOT PREDICTIONS)
🟢 Constructive case: BTC reclaims and holds above ~$76.5K on strong volume. That would suggest sellers are getting tired, and the market could start revisiting higher zones.
🔴 Weak case: BTC loses ~$74.7K and fails to bounce back quickly. That would show buyers stepping aside, and $74K becomes the next area of interest.
🟡 Neutral case: price keeps chopping between ~$74.7K and ~$76.5K while the market waits for a catalyst. This is the most boring outcome, and often the most common one.
No one knows which one plays out. The edge is in being prepared for all three.
━━━━━━━━━━━━━━━━━━━━
◆ ⑥ THE MINDSET PART MOST PEOPLE SKIP
Weeks like this test patience more than skill.
✔︎ Chasing the first bounce often means buying someone else's exit.
✔︎ Panic after a big red candle usually means acting at the worst moment.
✔︎ Sitting out a choppy range is a legitimate decision, not a missed opportunity.
Plan your risk before you plan your profit. If you cannot say how much you are willing to lose on an idea, you do not have a plan yet.
━━━━━━━━━━━━━━━━━━━━
◆ FINAL THOUGHTS
Bitcoin is at a decision point, with ETF flows, leverage and the $76.5K and $74.7K levels all in play. Nobody has a crystal ball, but a calm trader with a clear process will always be better placed than an emotional one.
Watch the levels, respect the volatility and let the market show its hand.
━━━━━━━━━━━━━━━━━━━━
YOUR TURN
Which level are you watching more closely, $76.5K or $74.7K? Drop your view in the comments, and share this with a friend who is tracking BTC this week.
━━━━━━━━━━━━━━━━━━━━
⚠️ Risk Disclaimer: This article is for educational and informational purposes only and is not financial advice. Crypto assets are highly volatile and you can lose some or all of your capital. Always do your own research and only risk what you can afford to lose.
━━━━━━━━━━━━━━━━━━━━
#BTC #BitcoinRebounds$75KAsChipsLead #JobsReportRaisesHikeOdds #US Data Center Rules May Constrain AI Expansion #BitcoinETFsSee$412MNetOutflows $BTC
{future}(BTCUSDT)
BTC at $75.9K: Pause Before the Next Move, or Just Another Trap?
━━━━━━━━━━━━━━━━━━━━
Bitcoin has been quiet for a few hours, and after the week it just had, quiet feels strange.
On Nov 5, BTC pushed up toward the $81K zone and got rejected hard. Within hours, price slid into the mid-$75Ks, and now it is moving sideways. The question is whether this is a base or just a breather.
Let's break it down step by step.
━━━━━━━━━━━━━━━━━━━━
◆ ① WHERE BTC STANDS RIGHT NOW
➤ BTC is trading around $75,900 on the 4H chart (+0.23% at the time of the snapshot).
➤ Fortune put Bitcoin at $76,023.87 on the morning of Nov 6, about $4,197 lower than the previous morning.
➤ The coin is down about 29% over the past year and about 10.9% year to date.
➤ ETH is also under pressure, trading near $2,240 per Fortune's Nov 6 data.
The trend has been lower highs and lower lows since late October. That is the reality of the chart right now.
━━━━━━━━━━━━━━━━━━━━
◆ ② WHAT IS PUSHING THE MARKET
Price does not move in a vacuum. Three forces stand out this week:
✔︎ ETF outflows. All spot Bitcoin ETFs saw outflows on Nov 5, with about $430M leaving. Less institutional demand means less support under price.
✔︎ Leverage getting flushed. Roughly $250M in positions were liquidated as BTC slipped under $76,000 on Nov 3-4. Forced selling makes moves faster and uglier.
✔︎ Risk-off mood. Weakness in global tech stocks added to the pressure. Bitcoin still trades a lot like a risk asset in stressed weeks.
━━━━━━━━━━━━━━━━━━━━
◆ ③ READING THE 4H CHART
① The $80K–$81K zone was a major pivot. BTC spent weeks around it in October, broke below it, then retested it from underneath on Nov 5. The rejection was sharp, a textbook example of old support turning into resistance.
② The drop from ~$81K to ~$75K was a single, fast, one-sided move. That kind of candle usually means stop-losses and liquidations, not slow, patient selling.
③ The candles since then are small and tight. That is compression. Compression often comes before expansion, but the chart does not tell us which direction.
④ The ~$76K–$76.6K area is the first overhead test. It was support a few days ago, so many traders will be watching how price behaves when it returns there.
━━━━━━━━━━━━━━━━━━━━
◆ ④ KEY LEVELS TO WATCH
➜ Resistance 2: ~$81,000 (the Nov 5 rejection zone)
➜ Resistance 1: ~$76,500 (former support, now a test)
➜ Support 1: ~$74,700 (recent swing low)
➜ Support 2: ~$74,000 (psychological round number)
Levels are zones, not exact lines. Wicks happen, so always leave room for noise.
━━━━━━━━━━━━━━━━━━━━
◆ ⑤ THREE SCENARIOS (EDUCATIONAL, NOT PREDICTIONS)
🟢 Constructive case: BTC reclaims and holds above ~$76.5K on strong volume. That would suggest sellers are getting tired, and the market could start revisiting higher zones.
🔴 Weak case: BTC loses ~$74.7K and fails to bounce back quickly. That would show buyers stepping aside, and $74K becomes the next area of interest.
🟡 Neutral case: price keeps chopping between ~$74.7K and ~$76.5K while the market waits for a catalyst. This is the most boring outcome, and often the most common one.
No one knows which one plays out. The edge is in being prepared for all three.
━━━━━━━━━━━━━━━━━━━━
◆ ⑥ THE MINDSET PART MOST PEOPLE SKIP
Weeks like this test patience more than skill.
✔︎ Chasing the first bounce often means buying someone else's exit.
✔︎ Panic after a big red candle usually means acting at the worst moment.
✔︎ Sitting out a choppy range is a legitimate decision, not a missed opportunity.
Plan your risk before you plan your profit. If you cannot say how much you are willing to lose on an idea, you do not have a plan yet.
━━━━━━━━━━━━━━━━━━━━
◆ FINAL THOUGHTS
Bitcoin is at a decision point, with ETF flows, leverage and the $76.5K and $74.7K levels all in play. Nobody has a crystal ball, but a calm trader with a clear process will always be better placed than an emotional one.
Watch the levels, respect the volatility and let the market show its hand.
━━━━━━━━━━━━━━━━━━━━
YOUR TURN
Which level are you watching more closely, $76.5K or $74.7K? Drop your view in the comments, and share this with a friend who is tracking BTC this week.
━━━━━━━━━━━━━━━━━━━━
⚠️ Risk Disclaimer: This article is for educational and informational purposes only and is not financial advice. Crypto assets are highly volatile and you can lose some or all of your capital. Always do your own research and only risk what you can afford to lose.
━━━━━━━━━━━━━━━━━━━━
#BTC #BitcoinRebounds$75KAsChipsLead #JobsReportRaisesHikeOdds #US Data Center Rules May Constrain AI Expansion #BitcoinETFsSee$412MNetOutflows $BTC
Bitcoin has been quiet for a few hours, and after the week it just had, quiet feels strange.
On Nov 5, BTC pushed up toward the $81K zone and got rejected hard. Within hours, price slid into the mid-$75Ks, and now it is moving sideways. The question is whether this is a base or just a breather.
Let's break it down step by step.
━━━━━━━━━━━━━━━━━━━━
◆ ① WHERE BTC STANDS RIGHT NOW
➤ BTC is trading around $75,900 on the 4H chart (+0.23% at the time of the snapshot).
➤ Fortune put Bitcoin at $76,023.87 on the morning of Nov 6, about $4,197 lower than the previous morning.
➤ The coin is down about 29% over the past year and about 10.9% year to date.
➤ ETH is also under pressure, trading near $2,240 per Fortune's Nov 6 data.
The trend has been lower highs and lower lows since late October. That is the reality of the chart right now.
━━━━━━━━━━━━━━━━━━━━
◆ ② WHAT IS PUSHING THE MARKET
Price does not move in a vacuum. Three forces stand out this week:
✔︎ ETF outflows. All spot Bitcoin ETFs saw outflows on Nov 5, with about $430M leaving. Less institutional demand means less support under price.
✔︎ Leverage getting flushed. Roughly $250M in positions were liquidated as BTC slipped under $76,000 on Nov 3-4. Forced selling makes moves faster and uglier.
✔︎ Risk-off mood. Weakness in global tech stocks added to the pressure. Bitcoin still trades a lot like a risk asset in stressed weeks.
━━━━━━━━━━━━━━━━━━━━
◆ ③ READING THE 4H CHART
① The $80K–$81K zone was a major pivot. BTC spent weeks around it in October, broke below it, then retested it from underneath on Nov 5. The rejection was sharp, a textbook example of old support turning into resistance.
② The drop from ~$81K to ~$75K was a single, fast, one-sided move. That kind of candle usually means stop-losses and liquidations, not slow, patient selling.
③ The candles since then are small and tight. That is compression. Compression often comes before expansion, but the chart does not tell us which direction.
④ The ~$76K–$76.6K area is the first overhead test. It was support a few days ago, so many traders will be watching how price behaves when it returns there.
━━━━━━━━━━━━━━━━━━━━
◆ ④ KEY LEVELS TO WATCH
➜ Resistance 2: ~$81,000 (the Nov 5 rejection zone)
➜ Resistance 1: ~$76,500 (former support, now a test)
➜ Support 1: ~$74,700 (recent swing low)
➜ Support 2: ~$74,000 (psychological round number)
Levels are zones, not exact lines. Wicks happen, so always leave room for noise.
━━━━━━━━━━━━━━━━━━━━
◆ ⑤ THREE SCENARIOS (EDUCATIONAL, NOT PREDICTIONS)
🟢 Constructive case: BTC reclaims and holds above ~$76.5K on strong volume. That would suggest sellers are getting tired, and the market could start revisiting higher zones.
🔴 Weak case: BTC loses ~$74.7K and fails to bounce back quickly. That would show buyers stepping aside, and $74K becomes the next area of interest.
🟡 Neutral case: price keeps chopping between ~$74.7K and ~$76.5K while the market waits for a catalyst. This is the most boring outcome, and often the most common one.
No one knows which one plays out. The edge is in being prepared for all three.
━━━━━━━━━━━━━━━━━━━━
◆ ⑥ THE MINDSET PART MOST PEOPLE SKIP
Weeks like this test patience more than skill.
✔︎ Chasing the first bounce often means buying someone else's exit.
✔︎ Panic after a big red candle usually means acting at the worst moment.
✔︎ Sitting out a choppy range is a legitimate decision, not a missed opportunity.
Plan your risk before you plan your profit. If you cannot say how much you are willing to lose on an idea, you do not have a plan yet.
━━━━━━━━━━━━━━━━━━━━
◆ FINAL THOUGHTS
Bitcoin is at a decision point, with ETF flows, leverage and the $76.5K and $74.7K levels all in play. Nobody has a crystal ball, but a calm trader with a clear process will always be better placed than an emotional one.
Watch the levels, respect the volatility and let the market show its hand.
━━━━━━━━━━━━━━━━━━━━
YOUR TURN
Which level are you watching more closely, $76.5K or $74.7K? Drop your view in the comments, and share this with a friend who is tracking BTC this week.
━━━━━━━━━━━━━━━━━━━━
⚠️ Risk Disclaimer: This article is for educational and informational purposes only and is not financial advice. Crypto assets are highly volatile and you can lose some or all of your capital. Always do your own research and only risk what you can afford to lose.
━━━━━━━━━━━━━━━━━━━━
#BTC #BitcoinRebounds$75KAsChipsLead #JobsReportRaisesHikeOdds #US Data Center Rules May Constrain AI Expansion #BitcoinETFsSee$412MNetOutflows $BTC
73

·
--
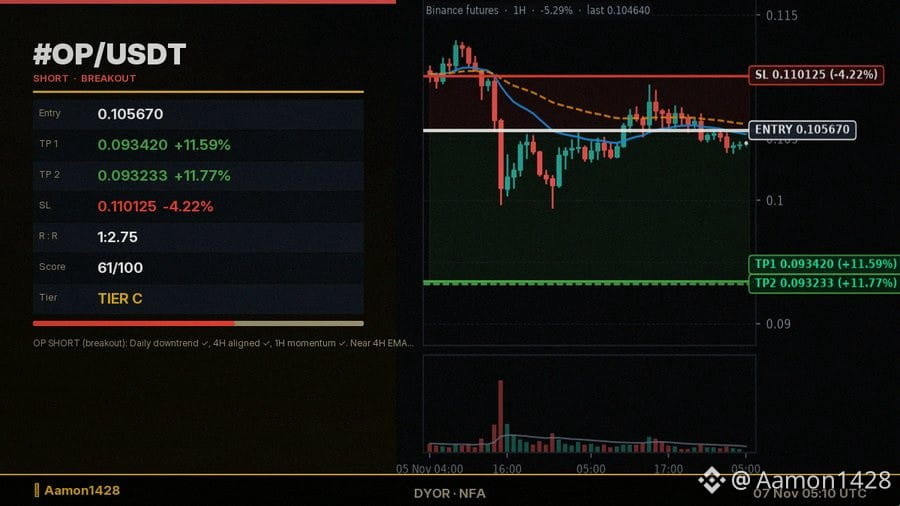
🚨 **#OP/USDT Short Setup Alert** 🔴
The market is showing weakness. We are looking at a Level Break setup on #OP/USDT.
**Levels to Watch:**
📌 Entry: 0.10567
🎯 Target 1: 0.09342 (+11.59%)
🎯 Target 2: 0.09323316 (+11.77%)
🛑 Stop Loss: 0.11012453 (-4.22%)
The case for this trade: Daily downtrend ✓, 4H aligned ✓, 1H momentum ✓. Near 4H EMA21, RSI 48 in sell zone ✓. Broke support 0.1053 ✓, Lower highs pattern ✓. Real participation ✓. MACD hist negative, accelerating ✓, BB squeeze release ✓. Funding 0.0021% neutral, OI rising ✓. R:R 2.8 >= 2.0 ✓, Optimal SL buffer (4.2%) ✓.
Score: 61/100
Always DYOR and manage risk.
#HKMALaunchesSAGEAgenticFinanceProject #BitcoinETFsSee$643MOutflowLargestSinceJune #Verify1to1BinanceReserves
📊 Follow to track our win rate over time.
🚨 **#OP/USDT Short Setup Alert** 🔴
The market is showing weakness. We are looking at a Level Break setup on #OP/USDT.
**Levels to Watch:**
📌 Entry: 0.10567
🎯 Target 1: 0.09342 (+11.59%)
🎯 Target 2: 0.09323316 (+11.77%)
🛑 Stop Loss: 0.11012453 (-4.22%)
The case for this trade: Daily downtrend ✓, 4H aligned ✓, 1H momentum ✓. Near 4H EMA21, RSI 48 in sell zone ✓. Broke support 0.1053 ✓, Lower highs pattern ✓. Real participation ✓. MACD hist negative, accelerating ✓, BB squeeze release ✓. Funding 0.0021% neutral, OI rising ✓. R:R 2.8 >= 2.0 ✓, Optimal SL buffer (4.2%) ✓.
Score: 61/100
Always DYOR and manage risk.
#HKMALaunchesSAGEAgenticFinanceProject #BitcoinETFsSee$643MOutflowLargestSinceJune #Verify1to1BinanceReserves
📊 Follow to track our win rate over time.
The market is showing weakness. We are looking at a Level Break setup on #OP/USDT.
**Levels to Watch:**
📌 Entry: 0.10567
🎯 Target 1: 0.09342 (+11.59%)
🎯 Target 2: 0.09323316 (+11.77%)
🛑 Stop Loss: 0.11012453 (-4.22%)
The case for this trade: Daily downtrend ✓, 4H aligned ✓, 1H momentum ✓. Near 4H EMA21, RSI 48 in sell zone ✓. Broke support 0.1053 ✓, Lower highs pattern ✓. Real participation ✓. MACD hist negative, accelerating ✓, BB squeeze release ✓. Funding 0.0021% neutral, OI rising ✓. R:R 2.8 >= 2.0 ✓, Optimal SL buffer (4.2%) ✓.
Score: 61/100
Always DYOR and manage risk.
#HKMALaunchesSAGEAgenticFinanceProject #BitcoinETFsSee$643MOutflowLargestSinceJune #Verify1to1BinanceReserves
📊 Follow to track our win rate over time.
16

Статья
Qeshm Island or Beginning of Something Big. ARE WE ON THE BRINK OF WORLD WAR III?
Friday, shortly after 10 p.m. German time. On the Iranian island of Qeshm, in the middle of the Strait of Hormuz, there are four loud blasts. An hour later, Iran's state media report two missile strikes near Suza.
According to initial reports, an Iranian air defense position had fired at a US fighter jet, and the jet fired back. It is the second US strike on Qeshm in five days. US officials confirmed the first one on Monday as defensive. On the second, an officer with US Central Command has so far said only that the situation is relatively calm.
Since then, the World War machine has been running on X. I spent the night looking into it and sorting out what is new today.
WHAT IS NEW TONIGHT
→ The second US strike on Qeshm, confirmed by Iran, not yet by Washington.
→ In the afternoon, the Revolutionary Guard reported shooting down a US MQ-1 drone over Qeshm. That has not been independently confirmed.
→ @HormuzLetter, a news account covering the Strait of Hormuz, reports that, according to initial reports, Code 100 has been issued for Iran's armed forces, the highest alert level, with evacuations in the south. I have not found an official confirmation.
→ According to Ynet, the US is warning its diplomats across the region to prepare for an escalation.
WHAT IS OLD OR HAS BEEN DENIED
The Revolutionary Guard's warning that its restraint toward its neighbors is over is making the rounds again. Infrastructure in the Emirates, Saudi Arabia, Kuwait, Bahrain and Qatar is supposed to be hit in such a way that America is left without the region's oil and gas for years. That line is from April 7.
The iodine tablets come from a report in the British Times, which quotes an unnamed official from the Ministry of Health. Hossein Kermanpour, the ministry's spokesperson, writes that no official spoke to the Times and that the quote is false. On X, that still turned into "Iran is preparing for a nuclear attack".
@GodsBurnt, an account that cites an insider in Washington, writes that Trump will attack Iran with nuclear weapons and that Thursday's crypto pullback was insiders getting the word out. No evidence is provided. It is still being shared like almost nothing else today.
WHAT IS GOING ON BEHIND THE SCENES
JD Vance, the US vice president, speaks almost daily with Qatar's prime minister, Mohammed bin Abdulrahman Al Thani, and Pakistan's army chief, Asim Munir. Mohsen Rezaei, Iran's security chief, has received a letter from him offering direct talks. Qatar's prime minister says there will be no perfect deal, and both sides should take a good one.
A week ago, Trump said the talks were going well and that he was in no hurry. He still wants to hit one or two targets, including the underground nuclear facility at Pickaxe Mountain near Natanz. The iodine tablet story is tied to that very facility.
On Tuesday, Trump lost the House of Representatives and the Senate over this. Vance himself cites frustration over the Iran war as one of the reasons. With Congress against him, every new round of war becomes more costly for Trump politically.
WHERE THE MONEY STANDS
On Polymarket, the bet on a US invasion of Iran by the end of the year stands at 11.5 percent. On Wednesday I still wrote 18.5 percent here.
The bet that the ceasefire holds until Sunday, by contrast, has fallen to around 21 percent. Anyone putting money on that is counting Qeshm as a real airstrike on Iranian soil.
I read it this way: the market expects pinpricks, not a wildfire.
#Bitcoin is at 75,878 dollars, half a percent below the level of 24 hours ago. In those 24 hours there was a drone, an airstrike and an alert level. Brent closed Friday just under 100 dollars; on October 24 it was over 117.
WHAT I MAKE OF IT
Are we on the brink of World War III? After this night I say no. I see a war that has been going on since February 28 and is currently simmering on a low flame, with two parties that are shooting and still talking to each other through Qatar.
What I find dangerous is something else. Over the weekend, Bitcoin is the only major market that is open. If the strike on Pickaxe Mountain comes on Saturday night, the first shock lands in crypto, and oil, gold and stocks only catch up on Monday.
Until Monday I am watching two things: whether Washington officially confirms the strike on Qeshm, and where Brent stands at the open. If both come together and Brent jumps above 110 dollars, I will talk about this situation differently.
Thanks for reading this far. If this helped you put the night in the right context, I'd appreciate a like.
#JobsReportRaisesHikeOdds #BitcoinRebounds$75KAsChipsLead #US Data Center Rules May Constrain AI Expansion #WillAnthropicListOnTime #BitcoinETFsSee$412MNetOutflows
Qeshm Island or Beginning of Something Big.
ARE WE ON THE BRINK OF WORLD WAR III?
Friday, shortly after 10 p.m. German time. On the Iranian island of Qeshm, in the middle of the Strait of Hormuz, there are four loud blasts. An hour later, Iran's state media report two missile strikes near Suza.
According to initial reports, an Iranian air defense position had fired at a US fighter jet, and the jet fired back. It is the second US strike on Qeshm in five days. US officials confirmed the first one on Monday as defensive. On the second, an officer with US Central Command has so far said only that the situation is relatively calm.
Since then, the World War machine has been running on X. I spent the night looking into it and sorting out what is new today.
WHAT IS NEW TONIGHT
→ The second US strike on Qeshm, confirmed by Iran, not yet by Washington.
→ In the afternoon, the Revolutionary Guard reported shooting down a US MQ-1 drone over Qeshm. That has not been independently confirmed.
→ @HormuzLetter, a news account covering the Strait of Hormuz, reports that, according to initial reports, Code 100 has been issued for Iran's armed forces, the highest alert level, with evacuations in the south. I have not found an official confirmation.
→ According to Ynet, the US is warning its diplomats across the region to prepare for an escalation.
WHAT IS OLD OR HAS BEEN DENIED
The Revolutionary Guard's warning that its restraint toward its neighbors is over is making the rounds again. Infrastructure in the Emirates, Saudi Arabia, Kuwait, Bahrain and Qatar is supposed to be hit in such a way that America is left without the region's oil and gas for years. That line is from April 7.
The iodine tablets come from a report in the British Times, which quotes an unnamed official from the Ministry of Health. Hossein Kermanpour, the ministry's spokesperson, writes that no official spoke to the Times and that the quote is false. On X, that still turned into "Iran is preparing for a nuclear attack".
@GodsBurnt, an account that cites an insider in Washington, writes that Trump will attack Iran with nuclear weapons and that Thursday's crypto pullback was insiders getting the word out. No evidence is provided. It is still being shared like almost nothing else today.
WHAT IS GOING ON BEHIND THE SCENES
JD Vance, the US vice president, speaks almost daily with Qatar's prime minister, Mohammed bin Abdulrahman Al Thani, and Pakistan's army chief, Asim Munir. Mohsen Rezaei, Iran's security chief, has received a letter from him offering direct talks. Qatar's prime minister says there will be no perfect deal, and both sides should take a good one.
A week ago, Trump said the talks were going well and that he was in no hurry. He still wants to hit one or two targets, including the underground nuclear facility at Pickaxe Mountain near Natanz. The iodine tablet story is tied to that very facility.
On Tuesday, Trump lost the House of Representatives and the Senate over this. Vance himself cites frustration over the Iran war as one of the reasons. With Congress against him, every new round of war becomes more costly for Trump politically.
WHERE THE MONEY STANDS
On Polymarket, the bet on a US invasion of Iran by the end of the year stands at 11.5 percent. On Wednesday I still wrote 18.5 percent here.
The bet that the ceasefire holds until Sunday, by contrast, has fallen to around 21 percent. Anyone putting money on that is counting Qeshm as a real airstrike on Iranian soil.
I read it this way: the market expects pinpricks, not a wildfire.
#Bitcoin is at 75,878 dollars, half a percent below the level of 24 hours ago. In those 24 hours there was a drone, an airstrike and an alert level. Brent closed Friday just under 100 dollars; on October 24 it was over 117.
WHAT I MAKE OF IT
Are we on the brink of World War III? After this night I say no. I see a war that has been going on since February 28 and is currently simmering on a low flame, with two parties that are shooting and still talking to each other through Qatar.
What I find dangerous is something else. Over the weekend, Bitcoin is the only major market that is open. If the strike on Pickaxe Mountain comes on Saturday night, the first shock lands in crypto, and oil, gold and stocks only catch up on Monday.
Until Monday I am watching two things: whether Washington officially confirms the strike on Qeshm, and where Brent stands at the open. If both come together and Brent jumps above 110 dollars, I will talk about this situation differently.
Thanks for reading this far. If this helped you put the night in the right context, I'd appreciate a like.
#JobsReportRaisesHikeOdds #BitcoinRebounds$75KAsChipsLead #US Data Center Rules May Constrain AI Expansion #WillAnthropicListOnTime #BitcoinETFsSee$412MNetOutflows
Friday, shortly after 10 p.m. German time. On the Iranian island of Qeshm, in the middle of the Strait of Hormuz, there are four loud blasts. An hour later, Iran's state media report two missile strikes near Suza.
According to initial reports, an Iranian air defense position had fired at a US fighter jet, and the jet fired back. It is the second US strike on Qeshm in five days. US officials confirmed the first one on Monday as defensive. On the second, an officer with US Central Command has so far said only that the situation is relatively calm.
Since then, the World War machine has been running on X. I spent the night looking into it and sorting out what is new today.
WHAT IS NEW TONIGHT
→ The second US strike on Qeshm, confirmed by Iran, not yet by Washington.
→ In the afternoon, the Revolutionary Guard reported shooting down a US MQ-1 drone over Qeshm. That has not been independently confirmed.
→ @HormuzLetter, a news account covering the Strait of Hormuz, reports that, according to initial reports, Code 100 has been issued for Iran's armed forces, the highest alert level, with evacuations in the south. I have not found an official confirmation.
→ According to Ynet, the US is warning its diplomats across the region to prepare for an escalation.
WHAT IS OLD OR HAS BEEN DENIED
The Revolutionary Guard's warning that its restraint toward its neighbors is over is making the rounds again. Infrastructure in the Emirates, Saudi Arabia, Kuwait, Bahrain and Qatar is supposed to be hit in such a way that America is left without the region's oil and gas for years. That line is from April 7.
The iodine tablets come from a report in the British Times, which quotes an unnamed official from the Ministry of Health. Hossein Kermanpour, the ministry's spokesperson, writes that no official spoke to the Times and that the quote is false. On X, that still turned into "Iran is preparing for a nuclear attack".
@GodsBurnt, an account that cites an insider in Washington, writes that Trump will attack Iran with nuclear weapons and that Thursday's crypto pullback was insiders getting the word out. No evidence is provided. It is still being shared like almost nothing else today.
WHAT IS GOING ON BEHIND THE SCENES
JD Vance, the US vice president, speaks almost daily with Qatar's prime minister, Mohammed bin Abdulrahman Al Thani, and Pakistan's army chief, Asim Munir. Mohsen Rezaei, Iran's security chief, has received a letter from him offering direct talks. Qatar's prime minister says there will be no perfect deal, and both sides should take a good one.
A week ago, Trump said the talks were going well and that he was in no hurry. He still wants to hit one or two targets, including the underground nuclear facility at Pickaxe Mountain near Natanz. The iodine tablet story is tied to that very facility.
On Tuesday, Trump lost the House of Representatives and the Senate over this. Vance himself cites frustration over the Iran war as one of the reasons. With Congress against him, every new round of war becomes more costly for Trump politically.
WHERE THE MONEY STANDS
On Polymarket, the bet on a US invasion of Iran by the end of the year stands at 11.5 percent. On Wednesday I still wrote 18.5 percent here.
The bet that the ceasefire holds until Sunday, by contrast, has fallen to around 21 percent. Anyone putting money on that is counting Qeshm as a real airstrike on Iranian soil.
I read it this way: the market expects pinpricks, not a wildfire.
#Bitcoin is at 75,878 dollars, half a percent below the level of 24 hours ago. In those 24 hours there was a drone, an airstrike and an alert level. Brent closed Friday just under 100 dollars; on October 24 it was over 117.
WHAT I MAKE OF IT
Are we on the brink of World War III? After this night I say no. I see a war that has been going on since February 28 and is currently simmering on a low flame, with two parties that are shooting and still talking to each other through Qatar.
What I find dangerous is something else. Over the weekend, Bitcoin is the only major market that is open. If the strike on Pickaxe Mountain comes on Saturday night, the first shock lands in crypto, and oil, gold and stocks only catch up on Monday.
Until Monday I am watching two things: whether Washington officially confirms the strike on Qeshm, and where Brent stands at the open. If both come together and Brent jumps above 110 dollars, I will talk about this situation differently.
Thanks for reading this far. If this helped you put the night in the right context, I'd appreciate a like.
#JobsReportRaisesHikeOdds #BitcoinRebounds$75KAsChipsLead #US Data Center Rules May Constrain AI Expansion #WillAnthropicListOnTime #BitcoinETFsSee$412MNetOutflows
70
·
--
🔴 **#ETH/USDT Alert** 🔴
We have a high conviction short setup here.
Entry Zone: 2237.13
Target: 2165.169492
Stop Loss: 2277.94806
R:R Ratio: 1:1.8
Daily below EMA50, 4H aligned ✓, 1H momentum ✓, ADX 28. Near 4H EMA21, RSI 44 in sell zone ✓, Bearish reversal candle ✓. At 4H resistance 2261 (1.1%), Broke support 2236 ✓. Rising volume ✓, Real participation ✓. BB squeeze release ✓. Funding 0.0100% neutral. R:R 1.8 >= 1.8, Optimal SL buffer (1.8%) ✓.
Always DYOR and manage risk.
#SouthKoreaPlans11%TaxOnUSStockPerpetualFutures #Verify1to1BinanceReserves #BitcoinETFsSee$643MOutflowLargestSinceJune
⭐ Save this post — we'll update near entry.
🔴 **#ETH/USDT Alert** 🔴
We have a high conviction short setup here.
Entry Zone: 2237.13
Target: 2165.169492
Stop Loss: 2277.94806
R:R Ratio: 1:1.8
Daily below EMA50, 4H aligned ✓, 1H momentum ✓, ADX 28. Near 4H EMA21, RSI 44 in sell zone ✓, Bearish reversal candle ✓. At 4H resistance 2261 (1.1%), Broke support 2236 ✓. Rising volume ✓, Real participation ✓. BB squeeze release ✓. Funding 0.0100% neutral. R:R 1.8 >= 1.8, Optimal SL buffer (1.8%) ✓.
Always DYOR and manage risk.
#SouthKoreaPlans11%TaxOnUSStockPerpetualFutures #Verify1to1BinanceReserves #BitcoinETFsSee$643MOutflowLargestSinceJune
⭐ Save this post — we'll update near entry.
We have a high conviction short setup here.
Entry Zone: 2237.13
Target: 2165.169492
Stop Loss: 2277.94806
R:R Ratio: 1:1.8
Daily below EMA50, 4H aligned ✓, 1H momentum ✓, ADX 28. Near 4H EMA21, RSI 44 in sell zone ✓, Bearish reversal candle ✓. At 4H resistance 2261 (1.1%), Broke support 2236 ✓. Rising volume ✓, Real participation ✓. BB squeeze release ✓. Funding 0.0100% neutral. R:R 1.8 >= 1.8, Optimal SL buffer (1.8%) ✓.
Always DYOR and manage risk.
#SouthKoreaPlans11%TaxOnUSStockPerpetualFutures #Verify1to1BinanceReserves #BitcoinETFsSee$643MOutflowLargestSinceJune
⭐ Save this post — we'll update near entry.
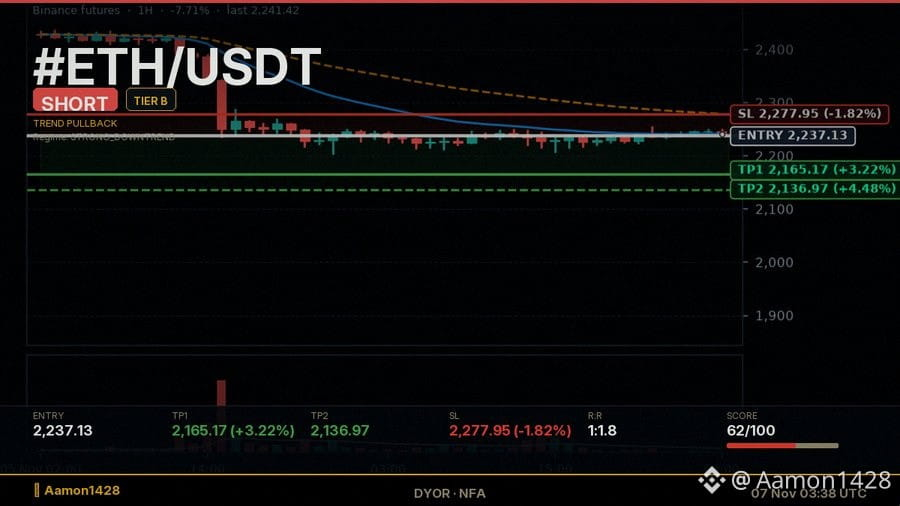
19
·
--
🚨 **#NATGAS/USDT Setup Alert** 🟢
The market is giving us a clear signal here. We are looking at a Breakout setup on #NATGAS/USDT.
**Levels to Watch:**
📌 Entry: 3.086
🎯 Target 1: 3.358 (++8.81%)
🎯 Target 2: 3.364716 (++9.03%)
🛑 Stop Loss: 2.97657 (--3.55%)
Key confluence: Daily uptrend ✓, 4H aligned ✓, 1H momentum ✓, ADX 29. Above EMAs (trend cont.), Bullish reversal candle ✓. At 4H support 3.062 (0.8%), Broke resistance 3.096 ✓. Real participation ✓. MACD hist positive, accelerating ✓, RSI bullish divergence ✓, BB squeeze release ✓. R:R 2.5 >= 2.0 ✓, Optimal SL buffer (3.5%) ✓.
Score: 66/100
Always DYOR and manage risk.
#BitcoinETFsSee$643MOutflowLargestSinceJune #AppleEarningsAhead-CanStockHitNewHigh #FATFLaunchesReviewOfCryptoHubsMoneyLaunderingControls
⭐ Save this post — we'll update near entry.
🚨 **#NATGAS/USDT Setup Alert** 🟢
The market is giving us a clear signal here. We are looking at a Breakout setup on #NATGAS/USDT.
**Levels to Watch:**
📌 Entry: 3.086
🎯 Target 1: 3.358 (++8.81%)
🎯 Target 2: 3.364716 (++9.03%)
🛑 Stop Loss: 2.97657 (--3.55%)
Key confluence: Daily uptrend ✓, 4H aligned ✓, 1H momentum ✓, ADX 29. Above EMAs (trend cont.), Bullish reversal candle ✓. At 4H support 3.062 (0.8%), Broke resistance 3.096 ✓. Real participation ✓. MACD hist positive, accelerating ✓, RSI bullish divergence ✓, BB squeeze release ✓. R:R 2.5 >= 2.0 ✓, Optimal SL buffer (3.5%) ✓.
Score: 66/100
Always DYOR and manage risk.
#BitcoinETFsSee$643MOutflowLargestSinceJune #AppleEarningsAhead-CanStockHitNewHigh #FATFLaunchesReviewOfCryptoHubsMoneyLaunderingControls
⭐ Save this post — we'll update near entry.
The market is giving us a clear signal here. We are looking at a Breakout setup on #NATGAS/USDT.
**Levels to Watch:**
📌 Entry: 3.086
🎯 Target 1: 3.358 (++8.81%)
🎯 Target 2: 3.364716 (++9.03%)
🛑 Stop Loss: 2.97657 (--3.55%)
Key confluence: Daily uptrend ✓, 4H aligned ✓, 1H momentum ✓, ADX 29. Above EMAs (trend cont.), Bullish reversal candle ✓. At 4H support 3.062 (0.8%), Broke resistance 3.096 ✓. Real participation ✓. MACD hist positive, accelerating ✓, RSI bullish divergence ✓, BB squeeze release ✓. R:R 2.5 >= 2.0 ✓, Optimal SL buffer (3.5%) ✓.
Score: 66/100
Always DYOR and manage risk.
#BitcoinETFsSee$643MOutflowLargestSinceJune #AppleEarningsAhead-CanStockHitNewHigh #FATFLaunchesReviewOfCryptoHubsMoneyLaunderingControls
⭐ Save this post — we'll update near entry.
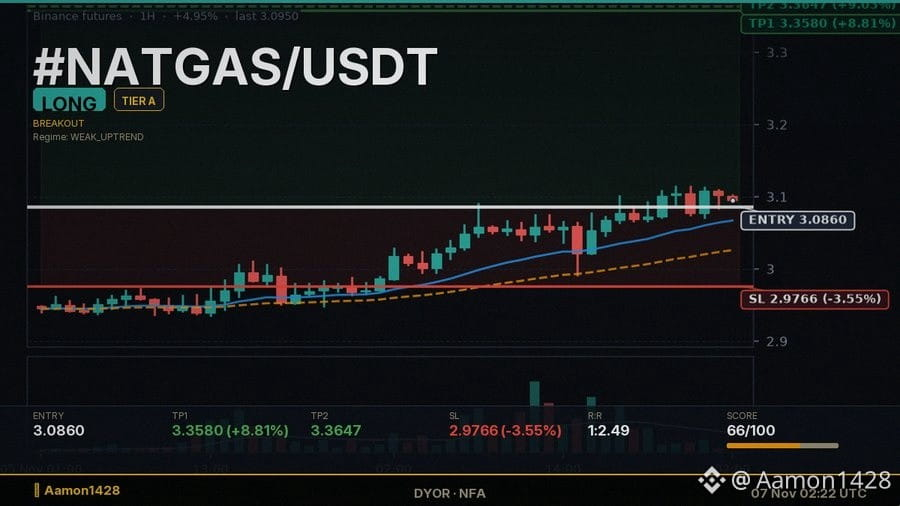
40
·
--
🔥 **#MOVR/USDT Short Opportunity** 🔥
Alert triggered for #MOVR/USDT. The setup is Pullback Entry.
📊 **Key Stats:**
- Entry Zone: 1.0361
- Main Target: 0.96 (+7.34%)
- Risk Control (SL): 1.07173352 (-3.44%)
- Setup Score: 63/100
Daily downtrend ✓, 4H aligned ✓, ADX 20. Rallied to 4H EMA21 ✓, RSI 49 in sell zone ✓, Red candle. Broke support 1.031 ✓. MACD hist negative, accelerating ✓, RSI bearish divergence ✓, BB squeeze release ✓. Funding 0.0050% neutral, OI rising ✓. R:R 2.1 >= 2.0 ✓, Optimal SL buffer (3.4%) ✓.
Always DYOR and manage risk.
#ETHFalls16.1%InOctober #BinanceProcesses$4.65BWithdrawals #BitcoinETFsSee$643MOutflowLargestSinceJune
⭐ Save this post — we'll update near entry.
🔥 **#MOVR/USDT Short Opportunity** 🔥
Alert triggered for #MOVR/USDT. The setup is Pullback Entry.
📊 **Key Stats:**
- Entry Zone: 1.0361
- Main Target: 0.96 (+7.34%)
- Risk Control (SL): 1.07173352 (-3.44%)
- Setup Score: 63/100
Daily downtrend ✓, 4H aligned ✓, ADX 20. Rallied to 4H EMA21 ✓, RSI 49 in sell zone ✓, Red candle. Broke support 1.031 ✓. MACD hist negative, accelerating ✓, RSI bearish divergence ✓, BB squeeze release ✓. Funding 0.0050% neutral, OI rising ✓. R:R 2.1 >= 2.0 ✓, Optimal SL buffer (3.4%) ✓.
Always DYOR and manage risk.
#ETHFalls16.1%InOctober #BinanceProcesses$4.65BWithdrawals #BitcoinETFsSee$643MOutflowLargestSinceJune
⭐ Save this post — we'll update near entry.
Alert triggered for #MOVR/USDT. The setup is Pullback Entry.
📊 **Key Stats:**
- Entry Zone: 1.0361
- Main Target: 0.96 (+7.34%)
- Risk Control (SL): 1.07173352 (-3.44%)
- Setup Score: 63/100
Daily downtrend ✓, 4H aligned ✓, ADX 20. Rallied to 4H EMA21 ✓, RSI 49 in sell zone ✓, Red candle. Broke support 1.031 ✓. MACD hist negative, accelerating ✓, RSI bearish divergence ✓, BB squeeze release ✓. Funding 0.0050% neutral, OI rising ✓. R:R 2.1 >= 2.0 ✓, Optimal SL buffer (3.4%) ✓.
Always DYOR and manage risk.
#ETHFalls16.1%InOctober #BinanceProcesses$4.65BWithdrawals #BitcoinETFsSee$643MOutflowLargestSinceJune
⭐ Save this post — we'll update near entry.
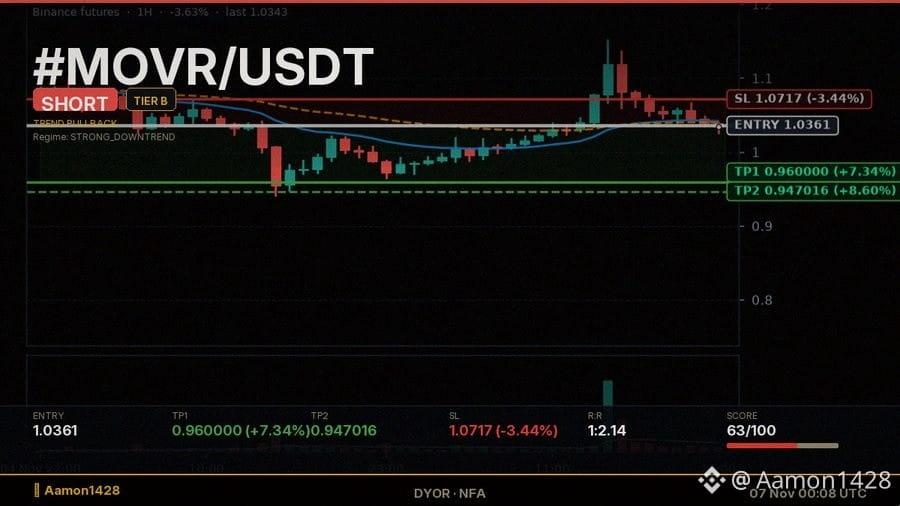
88
·
--
🔴 **#ETC/USDT Alert** 🔴
We have a high conviction short setup here.
Entry Zone: 7.094
Target: 6.819
Stop Loss: 7.221692
R:R Ratio: 1:2.15
Daily downtrend ✓, 4H aligned ✓, 1H momentum ✓, ADX 25. Rallied to 4H EMA21 ✓, RSI 53 in sell zone ✓. At 4H resistance 7.197 (1.5%), Broke support 7.067 ✓. Stoch crossed down (76). Funding 0.0100% neutral. R:R 2.1 >= 2.0 ✓, Optimal SL buffer (1.8%) ✓.
Always DYOR and manage risk.
#BitcoinETFsSee$643MOutflowLargestSinceJune #ETHFalls16.1%InOctober #BinanceRestores28FiatWithdrawals
🔔 Follow for daily setups — we post the good ones, not all of them.
🔴 **#ETC/USDT Alert** 🔴
We have a high conviction short setup here.
Entry Zone: 7.094
Target: 6.819
Stop Loss: 7.221692
R:R Ratio: 1:2.15
Daily downtrend ✓, 4H aligned ✓, 1H momentum ✓, ADX 25. Rallied to 4H EMA21 ✓, RSI 53 in sell zone ✓. At 4H resistance 7.197 (1.5%), Broke support 7.067 ✓. Stoch crossed down (76). Funding 0.0100% neutral. R:R 2.1 >= 2.0 ✓, Optimal SL buffer (1.8%) ✓.
Always DYOR and manage risk.
#BitcoinETFsSee$643MOutflowLargestSinceJune #ETHFalls16.1%InOctober #BinanceRestores28FiatWithdrawals
🔔 Follow for daily setups — we post the good ones, not all of them.
We have a high conviction short setup here.
Entry Zone: 7.094
Target: 6.819
Stop Loss: 7.221692
R:R Ratio: 1:2.15
Daily downtrend ✓, 4H aligned ✓, 1H momentum ✓, ADX 25. Rallied to 4H EMA21 ✓, RSI 53 in sell zone ✓. At 4H resistance 7.197 (1.5%), Broke support 7.067 ✓. Stoch crossed down (76). Funding 0.0100% neutral. R:R 2.1 >= 2.0 ✓, Optimal SL buffer (1.8%) ✓.
Always DYOR and manage risk.
#BitcoinETFsSee$643MOutflowLargestSinceJune #ETHFalls16.1%InOctober #BinanceRestores28FiatWithdrawals
🔔 Follow for daily setups — we post the good ones, not all of them.
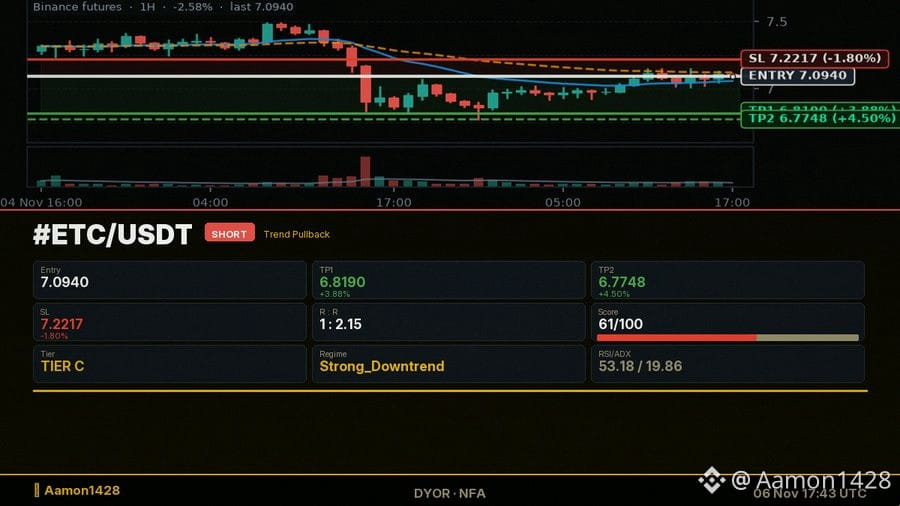
1
13
·
--
**#CC/USDT Setup** 🔴
We're watching Counter-Trend on #CC/USDT.
Entry @ 0.09595
Target @ 0.09055 (+5.63%)
Stop @ 0.09883731 (-3.01%)
Daily downtrend ✓, 4H aligned ✓, 1H momentum ✓. Near 4H EMA21, RSI 43 in sell zone ✓, Red candle. Near 4H resistance 0.09794, Broke support 0.09562 ✓. MACD hist negative, accelerating ✓, RSI bearish divergence ✓. Funding 0.0009% neutral, OI rising ✓. R:R 1.9 >= 1.8, Optimal SL buffer (3.0%) ✓.
Always DYOR and manage risk.
#HKMALaunchesSAGEAgenticFinanceProject #BitcoinETFsSee$643MOutflowLargestSinceJune #AppleEarningsAhead-CanStockHitNewHigh
⭐ Save this post — we'll update near entry.
**#CC/USDT Setup** 🔴
We're watching Counter-Trend on #CC/USDT.
Entry @ 0.09595
Target @ 0.09055 (+5.63%)
Stop @ 0.09883731 (-3.01%)
Daily downtrend ✓, 4H aligned ✓, 1H momentum ✓. Near 4H EMA21, RSI 43 in sell zone ✓, Red candle. Near 4H resistance 0.09794, Broke support 0.09562 ✓. MACD hist negative, accelerating ✓, RSI bearish divergence ✓. Funding 0.0009% neutral, OI rising ✓. R:R 1.9 >= 1.8, Optimal SL buffer (3.0%) ✓.
Always DYOR and manage risk.
#HKMALaunchesSAGEAgenticFinanceProject #BitcoinETFsSee$643MOutflowLargestSinceJune #AppleEarningsAhead-CanStockHitNewHigh
⭐ Save this post — we'll update near entry.
We're watching Counter-Trend on #CC/USDT.
Entry @ 0.09595
Target @ 0.09055 (+5.63%)
Stop @ 0.09883731 (-3.01%)
Daily downtrend ✓, 4H aligned ✓, 1H momentum ✓. Near 4H EMA21, RSI 43 in sell zone ✓, Red candle. Near 4H resistance 0.09794, Broke support 0.09562 ✓. MACD hist negative, accelerating ✓, RSI bearish divergence ✓. Funding 0.0009% neutral, OI rising ✓. R:R 1.9 >= 1.8, Optimal SL buffer (3.0%) ✓.
Always DYOR and manage risk.
#HKMALaunchesSAGEAgenticFinanceProject #BitcoinETFsSee$643MOutflowLargestSinceJune #AppleEarningsAhead-CanStockHitNewHigh
⭐ Save this post — we'll update near entry.
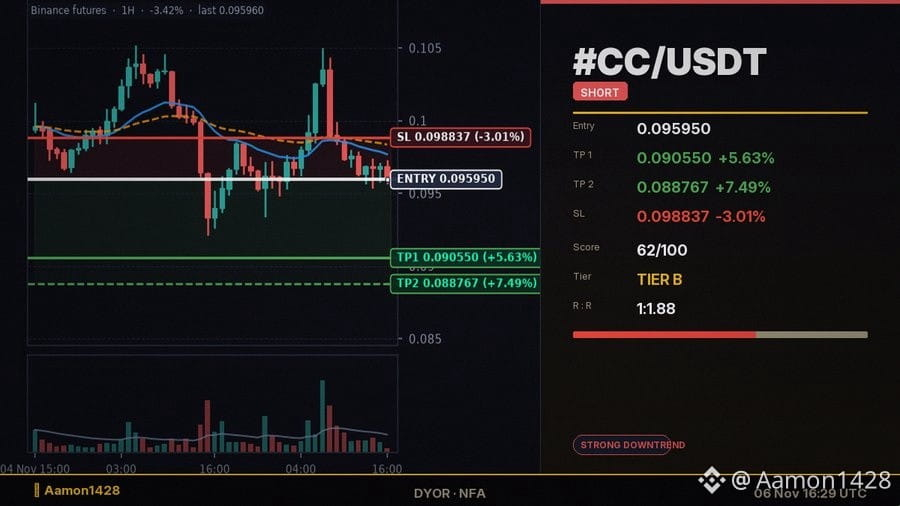
11
Войдите, чтобы посмотреть больше материала
Присоединяйтесь к пользователям криптовалют по всему миру на Binance Square
⚡️ Получайте новейшую и полезную информацию о криптоактивах.
💬 Нам доверяет крупнейшая в мире криптобиржа.
👍 Получите достоверные аналитические данные от верифицированных создателей контента.
Эл. почта/номер телефона
В тренде
1
#JobsReportRaisesHikeOdds
Просмотров: 198,358
1,623 обсуждают
2
#CPITestsDecemberRateOutlook
Просмотров: 4,657
81 обсуждают
3
#BitcoinRebounds$75KAsChipsLead
Просмотров: 18,067
191 обсуждают
4
#US Data Center Rules May Constrain AI Expansion
Просмотров: 32,575
140 обсуждают
5
#WillAnthropicListOnTime
Просмотров: 45,662
604 обсуждают
6
#WillUS-IranTensionsBoostSafe-HavenDemand?
Просмотров: 831
11 обсуждают
7
#BitcoinETFsSee$412MNetOutflows
Просмотров: 1,142
35 обсуждают
8
#HKSFCPlansToRestrictCryptoAndExchangeTerms
Просмотров: 6,782
150 обсуждают
9
#FinCENAndFedWithdraw$250CryptoTransferProposal
Просмотров: 6,008
14 обсуждают
10
#TradFiForBeginners
Просмотров: 31,231
504 обсуждают