
Nadeemabbas 786
326 Публикации

Nadeemabbas 786
Отправить жалобу
Заблокировать пользователя
Crypto Content Creator | News, Articles & Price Insights | Bitcoin & Altcoins Focus | Binance Square Contributor.
Открытая сделка
2.1 г
10 подписок(и/а)
66 подписчиков(а)
129 понравилось
Посты
Портфель
Все
Цитирования
Видео
·
--
Рост
$ETH at a Key Le lookvel: Bounce or Trap? Here Is the Honest View
ETH is sitting near the $1,720 support zone, and a small bounce is showing up. That is encouraging. But a bounce is not a reversal.
Here is how I read it.
The good case: if buyers keep defending $1,720, ETH has room to recover toward $1,980. If that level breaks with strong volume, $2,300 becomes a realistic next target.
The bad case: if $1,720 fails, the next move can be fast. When price falls through a support level, many traders get liquidated at once, and that selling pushes the price down even more. This is why support zones can turn into traps.
Something many people ignore: large holders are also under pressure. Many whales bought higher, and price still has to climb back to their cost level before sellers calm down. Until then, every rally can meet selling.
So what is my plan?
One, I do not buy because a post says bulls must step in. Hope is not a signal.
Two, I wait for confirmation. A daily close above the nearby resistance tells me more than a single green candle.
Three, I decide my exit before I enter. If $1,720 breaks, I know exactly what I will do, instead of freezing.
Four, I keep my position small enough to sleep well. If a 10% move scares you, the position is too big.
Five, I keep some cash. A falling market always offers a second chance, but only to people who still have funds.
I am not saying ETH will go up, and I am not saying it will crash. I am saying the level is important, the risk is real, and a plan matters more than a prediction.
What is your plan if $1,720 breaks? Tell me in the comments.
This is not financial advice. Crypto is highly volatile, so do your own research and never invest more than you can afford to lose.
#ETH #Ethereum #CryptoMarket #BinanceSquare #WriteToEarn
{spot}(ETHUSDT)
$ETH at a Key Le lookvel: Bounce or Trap? Here Is the Honest View
ETH is sitting near the $1,720 support zone, and a small bounce is showing up. That is encouraging. But a bounce is not a reversal.
Here is how I read it.
The good case: if buyers keep defending $1,720, ETH has room to recover toward $1,980. If that level breaks with strong volume, $2,300 becomes a realistic next target.
The bad case: if $1,720 fails, the next move can be fast. When price falls through a support level, many traders get liquidated at once, and that selling pushes the price down even more. This is why support zones can turn into traps.
Something many people ignore: large holders are also under pressure. Many whales bought higher, and price still has to climb back to their cost level before sellers calm down. Until then, every rally can meet selling.
So what is my plan?
One, I do not buy because a post says bulls must step in. Hope is not a signal.
Two, I wait for confirmation. A daily close above the nearby resistance tells me more than a single green candle.
Three, I decide my exit before I enter. If $1,720 breaks, I know exactly what I will do, instead of freezing.
Four, I keep my position small enough to sleep well. If a 10% move scares you, the position is too big.
Five, I keep some cash. A falling market always offers a second chance, but only to people who still have funds.
I am not saying ETH will go up, and I am not saying it will crash. I am saying the level is important, the risk is real, and a plan matters more than a prediction.
What is your plan if $1,720 breaks? Tell me in the comments.
This is not financial advice. Crypto is highly volatile, so do your own research and never invest more than you can afford to lose.
#ETH #Ethereum #CryptoMarket #BinanceSquare #WriteToEarn
ETH is sitting near the $1,720 support zone, and a small bounce is showing up. That is encouraging. But a bounce is not a reversal.
Here is how I read it.
The good case: if buyers keep defending $1,720, ETH has room to recover toward $1,980. If that level breaks with strong volume, $2,300 becomes a realistic next target.
The bad case: if $1,720 fails, the next move can be fast. When price falls through a support level, many traders get liquidated at once, and that selling pushes the price down even more. This is why support zones can turn into traps.
Something many people ignore: large holders are also under pressure. Many whales bought higher, and price still has to climb back to their cost level before sellers calm down. Until then, every rally can meet selling.
So what is my plan?
One, I do not buy because a post says bulls must step in. Hope is not a signal.
Two, I wait for confirmation. A daily close above the nearby resistance tells me more than a single green candle.
Three, I decide my exit before I enter. If $1,720 breaks, I know exactly what I will do, instead of freezing.
Four, I keep my position small enough to sleep well. If a 10% move scares you, the position is too big.
Five, I keep some cash. A falling market always offers a second chance, but only to people who still have funds.
I am not saying ETH will go up, and I am not saying it will crash. I am saying the level is important, the risk is real, and a plan matters more than a prediction.
What is your plan if $1,720 breaks? Tell me in the comments.
This is not financial advice. Crypto is highly volatile, so do your own research and never invest more than you can afford to lose.
#ETH #Ethereum #CryptoMarket #BinanceSquare #WriteToEarn
143
·
--
Падение
Red Day Across the Market. Here Is the Honest Picture.
Look at the screen today. $SOL is down 10.08%. $XRP is at 0.9214, down 8.93%. $BTC is down 5.73%.
That is not a small pullback. That is a painful day.
Let me say what I will not say. I will not tell you this is a guaranteed bottom. I will not say "buy now before it pumps." Nobody knows where this ends, and anyone who sounds 100% sure is guessing.
Here is what the numbers actually tell us.
First, the smaller coins are hit harder. SOL fell almost double what BTC did. In a falling market, risk goes up as you move away from the biggest coin. That is the pattern again and again.
Second, XRP slipping under 1 dollar matters for psychology. Round numbers act like support. When they break, many traders sell at the same time, and that makes the drop faster.
Third, a lower price is not the same as a discount. A coin can look cheap and still become cheaper.
So what can you do on a day like this?
One, do not make decisions while you are angry or scared. Close the app for an hour. Seriously.
Two, check your position size. If a 10% drop makes you lose sleep, you invested too much.
That is useful information, not a failure.
Three, if you want to buy, buy in small parts. Never all at once. Keep cash ready in case the price drops further.
Four, never use money you need for rent, fees, or bills. If you buy through peer-to-peer trading in Pakistan, set your amount before you open the chat with a seller, not during a panic.
Five, write your reason down. "It is down, so it must go up" is not a reason.
Red days feel like the end of the world while you are inside them. But they also separate people with a plan from people with only excitement.
I am not predicting a rebound, and I am not predicting a crash. I am watching, staying calm, and protecting my capital first.
How are you handling today? Holding, buying small, or staying out? Tell me honestly in the comments.
#BTC #XRP #SOL
{spot}(BTCUSDT)
{spot}(XRPUSDT)
{spot}(SOLUSDT)
Red Day Across the Market. Here Is the Honest Picture.
Look at the screen today. $SOL is down 10.08%. $XRP is at 0.9214, down 8.93%. $BTC is down 5.73%.
That is not a small pullback. That is a painful day.
Let me say what I will not say. I will not tell you this is a guaranteed bottom. I will not say "buy now before it pumps." Nobody knows where this ends, and anyone who sounds 100% sure is guessing.
Here is what the numbers actually tell us.
First, the smaller coins are hit harder. SOL fell almost double what BTC did. In a falling market, risk goes up as you move away from the biggest coin. That is the pattern again and again.
Second, XRP slipping under 1 dollar matters for psychology. Round numbers act like support. When they break, many traders sell at the same time, and that makes the drop faster.
Third, a lower price is not the same as a discount. A coin can look cheap and still become cheaper.
So what can you do on a day like this?
One, do not make decisions while you are angry or scared. Close the app for an hour. Seriously.
Two, check your position size. If a 10% drop makes you lose sleep, you invested too much.
That is useful information, not a failure.
Three, if you want to buy, buy in small parts. Never all at once. Keep cash ready in case the price drops further.
Four, never use money you need for rent, fees, or bills. If you buy through peer-to-peer trading in Pakistan, set your amount before you open the chat with a seller, not during a panic.
Five, write your reason down. "It is down, so it must go up" is not a reason.
Red days feel like the end of the world while you are inside them. But they also separate people with a plan from people with only excitement.
I am not predicting a rebound, and I am not predicting a crash. I am watching, staying calm, and protecting my capital first.
How are you handling today? Holding, buying small, or staying out? Tell me honestly in the comments.
#BTC #XRP #SOL
Look at the screen today. $SOL is down 10.08%. $XRP is at 0.9214, down 8.93%. $BTC is down 5.73%.
That is not a small pullback. That is a painful day.
Let me say what I will not say. I will not tell you this is a guaranteed bottom. I will not say "buy now before it pumps." Nobody knows where this ends, and anyone who sounds 100% sure is guessing.
Here is what the numbers actually tell us.
First, the smaller coins are hit harder. SOL fell almost double what BTC did. In a falling market, risk goes up as you move away from the biggest coin. That is the pattern again and again.
Second, XRP slipping under 1 dollar matters for psychology. Round numbers act like support. When they break, many traders sell at the same time, and that makes the drop faster.
Third, a lower price is not the same as a discount. A coin can look cheap and still become cheaper.
So what can you do on a day like this?
One, do not make decisions while you are angry or scared. Close the app for an hour. Seriously.
Two, check your position size. If a 10% drop makes you lose sleep, you invested too much.
That is useful information, not a failure.
Three, if you want to buy, buy in small parts. Never all at once. Keep cash ready in case the price drops further.
Four, never use money you need for rent, fees, or bills. If you buy through peer-to-peer trading in Pakistan, set your amount before you open the chat with a seller, not during a panic.
Five, write your reason down. "It is down, so it must go up" is not a reason.
Red days feel like the end of the world while you are inside them. But they also separate people with a plan from people with only excitement.
I am not predicting a rebound, and I am not predicting a crash. I am watching, staying calm, and protecting my capital first.
How are you handling today? Holding, buying small, or staying out? Tell me honestly in the comments.
#BTC #XRP #SOL
2
722
·
--
Падение
Write It Down, History! Why $XRP Hype Posts Can Cost You Money
You have seen this kind of post. A big coin name, a few exclamation marks, and a line like "Write it down, history!" It sounds like something huge is about to happen.
Now look at the chart. XRP just slipped below the $1 mark and is trading near $0.98, close to its lowest levels in months. Selling pressure has been steady, even though some indicators say the coin is oversold.
So which one is telling the truth, the post or the chart?
Usually, the chart. Hype posts describe a feeling. Charts describe what people actually did with their money.
Let me share a pattern I see again and again. Someone scrolls through social media at night and finds ten posts shouting about a coin. Everyone sounds sure. The person feels like the last one to find out, so they buy quickly. A week later the price is lower, and the same accounts have moved on to a new coin.
The mistake was not buying XRP. The mistake was buying a mood.
Here is a simple way to test any hype post before you act on it.
First, ask what the post actually proves. Does it show a number, a date, or a real event? "History will remember this" proves nothing. If there is no fact inside the post, it is advertising.
Second, check the price yourself. Open the chart and look at one week, one month, and one year. If the post says "moon" while the monthly chart is red, trust your own eyes.
Third, ask who benefits. Someone who already holds a coin wants more buyers. That does not make them dishonest, but it does mean their excitement is not neutral.
Fourth, decide your amount before you decide your coin. Pick a number you can lose without hurting rent, school fees, or family savings. In Pakistan, many people buy crypto through peer-to-peer trading, which means paying a seller directly in rupees. It is fast and easy, which is exactly why it is easy to overspend when emotions are high. Set your limit in daylight,
#XRP #Crypto #BinanceSquare #CryptoEducation
{spot}(XRPUSDT)
Write It Down, History! Why $XRP Hype Posts Can Cost You Money
You have seen this kind of post. A big coin name, a few exclamation marks, and a line like "Write it down, history!" It sounds like something huge is about to happen.
Now look at the chart. XRP just slipped below the $1 mark and is trading near $0.98, close to its lowest levels in months. Selling pressure has been steady, even though some indicators say the coin is oversold.
So which one is telling the truth, the post or the chart?
Usually, the chart. Hype posts describe a feeling. Charts describe what people actually did with their money.
Let me share a pattern I see again and again. Someone scrolls through social media at night and finds ten posts shouting about a coin. Everyone sounds sure. The person feels like the last one to find out, so they buy quickly. A week later the price is lower, and the same accounts have moved on to a new coin.
The mistake was not buying XRP. The mistake was buying a mood.
Here is a simple way to test any hype post before you act on it.
First, ask what the post actually proves. Does it show a number, a date, or a real event? "History will remember this" proves nothing. If there is no fact inside the post, it is advertising.
Second, check the price yourself. Open the chart and look at one week, one month, and one year. If the post says "moon" while the monthly chart is red, trust your own eyes.
Third, ask who benefits. Someone who already holds a coin wants more buyers. That does not make them dishonest, but it does mean their excitement is not neutral.
Fourth, decide your amount before you decide your coin. Pick a number you can lose without hurting rent, school fees, or family savings. In Pakistan, many people buy crypto through peer-to-peer trading, which means paying a seller directly in rupees. It is fast and easy, which is exactly why it is easy to overspend when emotions are high. Set your limit in daylight,
#XRP #Crypto #BinanceSquare #CryptoEducation
You have seen this kind of post. A big coin name, a few exclamation marks, and a line like "Write it down, history!" It sounds like something huge is about to happen.
Now look at the chart. XRP just slipped below the $1 mark and is trading near $0.98, close to its lowest levels in months. Selling pressure has been steady, even though some indicators say the coin is oversold.
So which one is telling the truth, the post or the chart?
Usually, the chart. Hype posts describe a feeling. Charts describe what people actually did with their money.
Let me share a pattern I see again and again. Someone scrolls through social media at night and finds ten posts shouting about a coin. Everyone sounds sure. The person feels like the last one to find out, so they buy quickly. A week later the price is lower, and the same accounts have moved on to a new coin.
The mistake was not buying XRP. The mistake was buying a mood.
Here is a simple way to test any hype post before you act on it.
First, ask what the post actually proves. Does it show a number, a date, or a real event? "History will remember this" proves nothing. If there is no fact inside the post, it is advertising.
Second, check the price yourself. Open the chart and look at one week, one month, and one year. If the post says "moon" while the monthly chart is red, trust your own eyes.
Third, ask who benefits. Someone who already holds a coin wants more buyers. That does not make them dishonest, but it does mean their excitement is not neutral.
Fourth, decide your amount before you decide your coin. Pick a number you can lose without hurting rent, school fees, or family savings. In Pakistan, many people buy crypto through peer-to-peer trading, which means paying a seller directly in rupees. It is fast and easy, which is exactly why it is easy to overspend when emotions are high. Set your limit in daylight,
#XRP #Crypto #BinanceSquare #CryptoEducation
612
·
--
Падение
SOLUSDT Market Update: Solana Drops 6.48% Is a Recovery Coming? 📉🚀
Solana is showing weakness today, but the latest chart is giving traders something interesting to watch.
According to the Binance screenshot, $SOL is trading around $89.76, down approximately 6.48% over the past 24 hours.
The market has reached a high of $97.08 and a low of $88.30.
That means sellers have been putting significant pressure on the price.
But there is another detail worth watching.
SOL has started recovering from its session low, and the price is now slightly above the MA60 level shown on the chart at $89.44.
This does not confirm a bullish reversal, but it gives traders an important short-term level to monitor.
WHAT DOES THE VOLUME TELL US?
The screenshot shows approximately 2.70 million SOL in 24-hour trading volume, with around $246.61 million in USDT volume.
This indicates active trading during the current market movement.
However, high volume during a decline does not automatically mean whales are buying.
It can represent selling activity, buying activity, or both.
The next move will depend on whether buyers can maintain the recovery or sellers return with stronger pressure.
IMPORTANT LEVELS TO WATCH
Resistance: $89.84–$90.00
If SOL can hold above this area and continue building momentum, traders may start watching for a recovery toward higher resistance levels.
Support: $88.30
This is the reported 24-hour low.
If the price breaks below this level with strong selling pressure, the downside risk could increase.
MA60: $89.44
SOL is currently trading slightly above this moving average.
Holding above it may support short-term recovery attempts, while losing it could bring renewed weakness.
MY MARKET VIEW
Solana is still facing short-term selling pressure.
The recovery from $88.30 is worth watching, but I would not call it a confirmed bullish reversal yet.
The market needs stronger buying activity and a sustained move above resistance before the bullish case becomes more convincing.
{future}(SOLUSDT)
For traders, patience is important.
#solana
SOLUSDT Market Update: Solana Drops 6.48% Is a Recovery Coming? 📉🚀
Solana is showing weakness today, but the latest chart is giving traders something interesting to watch.
According to the Binance screenshot, $SOL is trading around $89.76, down approximately 6.48% over the past 24 hours.
The market has reached a high of $97.08 and a low of $88.30.
That means sellers have been putting significant pressure on the price.
But there is another detail worth watching.
SOL has started recovering from its session low, and the price is now slightly above the MA60 level shown on the chart at $89.44.
This does not confirm a bullish reversal, but it gives traders an important short-term level to monitor.
WHAT DOES THE VOLUME TELL US?
The screenshot shows approximately 2.70 million SOL in 24-hour trading volume, with around $246.61 million in USDT volume.
This indicates active trading during the current market movement.
However, high volume during a decline does not automatically mean whales are buying.
It can represent selling activity, buying activity, or both.
The next move will depend on whether buyers can maintain the recovery or sellers return with stronger pressure.
IMPORTANT LEVELS TO WATCH
Resistance: $89.84–$90.00
If SOL can hold above this area and continue building momentum, traders may start watching for a recovery toward higher resistance levels.
Support: $88.30
This is the reported 24-hour low.
If the price breaks below this level with strong selling pressure, the downside risk could increase.
MA60: $89.44
SOL is currently trading slightly above this moving average.
Holding above it may support short-term recovery attempts, while losing it could bring renewed weakness.
MY MARKET VIEW
Solana is still facing short-term selling pressure.
The recovery from $88.30 is worth watching, but I would not call it a confirmed bullish reversal yet.
The market needs stronger buying activity and a sustained move above resistance before the bullish case becomes more convincing.
For traders, patience is important.
#solana
Solana is showing weakness today, but the latest chart is giving traders something interesting to watch.
According to the Binance screenshot, $SOL is trading around $89.76, down approximately 6.48% over the past 24 hours.
The market has reached a high of $97.08 and a low of $88.30.
That means sellers have been putting significant pressure on the price.
But there is another detail worth watching.
SOL has started recovering from its session low, and the price is now slightly above the MA60 level shown on the chart at $89.44.
This does not confirm a bullish reversal, but it gives traders an important short-term level to monitor.
WHAT DOES THE VOLUME TELL US?
The screenshot shows approximately 2.70 million SOL in 24-hour trading volume, with around $246.61 million in USDT volume.
This indicates active trading during the current market movement.
However, high volume during a decline does not automatically mean whales are buying.
It can represent selling activity, buying activity, or both.
The next move will depend on whether buyers can maintain the recovery or sellers return with stronger pressure.
IMPORTANT LEVELS TO WATCH
Resistance: $89.84–$90.00
If SOL can hold above this area and continue building momentum, traders may start watching for a recovery toward higher resistance levels.
Support: $88.30
This is the reported 24-hour low.
If the price breaks below this level with strong selling pressure, the downside risk could increase.
MA60: $89.44
SOL is currently trading slightly above this moving average.
Holding above it may support short-term recovery attempts, while losing it could bring renewed weakness.
MY MARKET VIEW
Solana is still facing short-term selling pressure.
The recovery from $88.30 is worth watching, but I would not call it a confirmed bullish reversal yet.
The market needs stronger buying activity and a sustained move above resistance before the bullish case becomes more convincing.
For traders, patience is important.
#solana
1
607
·
--
Рост
SOXSUSDT: SHORT SQUEEZE OR JUST ANOTHER TRAP? 🚨📈
$SOXS
But if my alarm goes off, wake me up and tell me what happened to my SOXS short! 😂
SOXSUSDT is showing some serious momentum.
According to the screenshot, the price is trading around 60.23 USDT, up approximately 9.94%.
And the most interesting part?
A 25X leveraged short position is already feeling the pressure.
The reported entry price was 56.24 USDT, while the latest price shown was around 60.06 USDT.
The position is showing an unrealized loss of approximately 94.43 USDT.
This is a perfect reminder of how quickly leveraged trading can turn against you.
When a trader opens a short position, they expect the price to move lower.
But when the market suddenly moves higher, losses can grow quickly, especially with high leverage.
WHAT SHOULD TRADERS WATCH NOW?
First, watch whether SOXSUSDT can maintain its current momentum.
Second, pay attention to the resistance levels and whether buyers continue pushing the price higher.
Third, remember that a strong green candle does not automatically mean the market will continue rising.
The next move depends on whether buyers can sustain the momentum or sellers manage to regain control.
MY TAKE
The biggest lesson here is simple:
Never let a short position become a fight against the market.
A trading setup can be wrong. That is normal.
But using excessive leverage and refusing to manage risk can turn a small mistake into a serious loss.
Sometimes the smartest trade is not entering at all.
{future}(SOXSUSDT)
And sometimes the best alarm clock is your liquidation warning! 😂
What do you think?
Will SOXSUSDT continue its upward momentum, or could sellers finally step back in?
#SOXS #SOXSUSDT #CryptoTrading #BinanceSquare
SOXSUSDT: SHORT SQUEEZE OR JUST ANOTHER TRAP? 🚨📈
$SOXS
But if my alarm goes off, wake me up and tell me what happened to my SOXS short! 😂
SOXSUSDT is showing some serious momentum.
According to the screenshot, the price is trading around 60.23 USDT, up approximately 9.94%.
And the most interesting part?
A 25X leveraged short position is already feeling the pressure.
The reported entry price was 56.24 USDT, while the latest price shown was around 60.06 USDT.
The position is showing an unrealized loss of approximately 94.43 USDT.
This is a perfect reminder of how quickly leveraged trading can turn against you.
When a trader opens a short position, they expect the price to move lower.
But when the market suddenly moves higher, losses can grow quickly, especially with high leverage.
WHAT SHOULD TRADERS WATCH NOW?
First, watch whether SOXSUSDT can maintain its current momentum.
Second, pay attention to the resistance levels and whether buyers continue pushing the price higher.
Third, remember that a strong green candle does not automatically mean the market will continue rising.
The next move depends on whether buyers can sustain the momentum or sellers manage to regain control.
MY TAKE
The biggest lesson here is simple:
Never let a short position become a fight against the market.
A trading setup can be wrong. That is normal.
But using excessive leverage and refusing to manage risk can turn a small mistake into a serious loss.
Sometimes the smartest trade is not entering at all.
And sometimes the best alarm clock is your liquidation warning! 😂
What do you think?
Will SOXSUSDT continue its upward momentum, or could sellers finally step back in?
#SOXS #SOXSUSDT #CryptoTrading #BinanceSquare
$SOXS
But if my alarm goes off, wake me up and tell me what happened to my SOXS short! 😂
SOXSUSDT is showing some serious momentum.
According to the screenshot, the price is trading around 60.23 USDT, up approximately 9.94%.
And the most interesting part?
A 25X leveraged short position is already feeling the pressure.
The reported entry price was 56.24 USDT, while the latest price shown was around 60.06 USDT.
The position is showing an unrealized loss of approximately 94.43 USDT.
This is a perfect reminder of how quickly leveraged trading can turn against you.
When a trader opens a short position, they expect the price to move lower.
But when the market suddenly moves higher, losses can grow quickly, especially with high leverage.
WHAT SHOULD TRADERS WATCH NOW?
First, watch whether SOXSUSDT can maintain its current momentum.
Second, pay attention to the resistance levels and whether buyers continue pushing the price higher.
Third, remember that a strong green candle does not automatically mean the market will continue rising.
The next move depends on whether buyers can sustain the momentum or sellers manage to regain control.
MY TAKE
The biggest lesson here is simple:
Never let a short position become a fight against the market.
A trading setup can be wrong. That is normal.
But using excessive leverage and refusing to manage risk can turn a small mistake into a serious loss.
Sometimes the smartest trade is not entering at all.
And sometimes the best alarm clock is your liquidation warning! 😂
What do you think?
Will SOXSUSDT continue its upward momentum, or could sellers finally step back in?
#SOXS #SOXSUSDT #CryptoTrading #BinanceSquare
428
Bitcoin Is Up Today, But Here Is What Most People MissBitcoin is trading near $78,500 this morning. That is about 2% higher than yesterday, when it sat close to $77,000.
If you only look at the green candle, it feels like good news. Now zoom out.
One month ago, Bitcoin was around $84,700. That means it is still down more than 7% over the month. One year ago, it was above $101,000. So even after today's bounce, it is roughly 22% lower than this time last year.
Same coin, same day, three different stories. And this is exactly where most beginners get tricked.
A friend of mine bought Bitcoin during a sharp green day a while back. His reasoning was simple: it is going up, so I should get in before it leaves. Two days later the price slipped back, and he sold in panic. He had not made a bad choice because of Bitcoin. He made it because he only looked at one day.
Short-term moves are noisy. A 2% jump can be gone by tomorrow. It tells you how traders feel right now, not where the market is heading.
So how do you read a day like today? Here is a simple three-step check I use before I make any decision.
First, check the timeframe. Open the chart and look at one day, one month, and one year. If all three tell the same story, the trend is clear. If they disagree, like today, be careful. Today is a small bounce inside a bigger pullback.
Second, know your reason. Are you buying because you believe in Bitcoin for the next few years, or because you saw a green number and felt left out? Only the first reason survives a bad week.
Third, decide your amount before you click buy. Never put in money you will need for rent, school fees, or bills. In Pakistan, many people buy crypto through peer-to-peer trading, where you pay a seller directly in rupees. It is convenient, but it also makes it easy to act on emotion at midnight. Set your amount in the daytime, when you are calm.
Now let me talk about the number everyone is watching: $78,000. When a price bounces around a round level, traders treat it like a floor. If Bitcoin stays above it, confidence slowly returns. If it falls through, many people will rush to sell at the same time. That is why you will see so much talk about this level today.
But a floor is not a promise. Nobody can guarantee it will hold, and anyone who says they can is guessing.
What I would do on a day like this is simple. I would not chase the price. I would not panic either. I would check my plan, look at the bigger chart, and ask one honest question: would I still be comfortable with this decision if Bitcoin dropped 10% next week?
If the answer is yes, you are probably investing. If the answer is no, you are probably gambling.
One more habit worth building is writing down your entry price and your reason in a note on your phone. Three months later, you will learn more from reading that note than from any video or tweet.
Bitcoin has been through many cycles of excitement and fear, and it will go through more. The people who do well are usually not the ones with the best predictions. They are the ones with a plan and the patience to follow it.
{spot}(BTCUSDT)
So today, enjoy the green candle. Just remember it is one page of a very long book.
What is your rule before you buy during a pump? Share it in the comments, because I would love to learn from you too.
This article is for educational purposes only and is not financial advice. Crypto is highly volatile, so always do your own research and never invest more than you can afford to lose.
$BTC
#Bitcoin #BTC #BinanceSquare #cryptoeducation
Bitcoin Is Up Today, But Here Is What Most People Miss
Bitcoin is trading near $78,500 this morning. That is about 2% higher than yesterday, when it sat close to $77,000.
If you only look at the green candle, it feels like good news. Now zoom out.
One month ago, Bitcoin was around $84,700. That means it is still down more than 7% over the month. One year ago, it was above $101,000. So even after today's bounce, it is roughly 22% lower than this time last year.
Same coin, same day, three different stories. And this is exactly where most beginners get tricked.
A friend of mine bought Bitcoin during a sharp green day a while back. His reasoning was simple: it is going up, so I should get in before it leaves. Two days later the price slipped back, and he sold in panic. He had not made a bad choice because of Bitcoin. He made it because he only looked at one day.
Short-term moves are noisy. A 2% jump can be gone by tomorrow. It tells you how traders feel right now, not where the market is heading.
So how do you read a day like today? Here is a simple three-step check I use before I make any decision.
First, check the timeframe. Open the chart and look at one day, one month, and one year. If all three tell the same story, the trend is clear. If they disagree, like today, be careful. Today is a small bounce inside a bigger pullback.
Second, know your reason. Are you buying because you believe in Bitcoin for the next few years, or because you saw a green number and felt left out? Only the first reason survives a bad week.
Third, decide your amount before you click buy. Never put in money you will need for rent, school fees, or bills. In Pakistan, many people buy crypto through peer-to-peer trading, where you pay a seller directly in rupees. It is convenient, but it also makes it easy to act on emotion at midnight. Set your amount in the daytime, when you are calm.
Now let me talk about the number everyone is watching: $78,000. When a price bounces around a round level, traders treat it like a floor. If Bitcoin stays above it, confidence slowly returns. If it falls through, many people will rush to sell at the same time. That is why you will see so much talk about this level today.
But a floor is not a promise. Nobody can guarantee it will hold, and anyone who says they can is guessing.
What I would do on a day like this is simple. I would not chase the price. I would not panic either. I would check my plan, look at the bigger chart, and ask one honest question: would I still be comfortable with this decision if Bitcoin dropped 10% next week?
If the answer is yes, you are probably investing. If the answer is no, you are probably gambling.
One more habit worth building is writing down your entry price and your reason in a note on your phone. Three months later, you will learn more from reading that note than from any video or tweet.
Bitcoin has been through many cycles of excitement and fear, and it will go through more. The people who do well are usually not the ones with the best predictions. They are the ones with a plan and the patience to follow it.
So today, enjoy the green candle. Just remember it is one page of a very long book.
What is your rule before you buy during a pump? Share it in the comments, because I would love to learn from you too.
This article is for educational purposes only and is not financial advice. Crypto is highly volatile, so always do your own research and never invest more than you can afford to lose.
$BTC
#Bitcoin #BTC #BinanceSquare #cryptoeducation
If you only look at the green candle, it feels like good news. Now zoom out.
One month ago, Bitcoin was around $84,700. That means it is still down more than 7% over the month. One year ago, it was above $101,000. So even after today's bounce, it is roughly 22% lower than this time last year.
Same coin, same day, three different stories. And this is exactly where most beginners get tricked.
A friend of mine bought Bitcoin during a sharp green day a while back. His reasoning was simple: it is going up, so I should get in before it leaves. Two days later the price slipped back, and he sold in panic. He had not made a bad choice because of Bitcoin. He made it because he only looked at one day.
Short-term moves are noisy. A 2% jump can be gone by tomorrow. It tells you how traders feel right now, not where the market is heading.
So how do you read a day like today? Here is a simple three-step check I use before I make any decision.
First, check the timeframe. Open the chart and look at one day, one month, and one year. If all three tell the same story, the trend is clear. If they disagree, like today, be careful. Today is a small bounce inside a bigger pullback.
Second, know your reason. Are you buying because you believe in Bitcoin for the next few years, or because you saw a green number and felt left out? Only the first reason survives a bad week.
Third, decide your amount before you click buy. Never put in money you will need for rent, school fees, or bills. In Pakistan, many people buy crypto through peer-to-peer trading, where you pay a seller directly in rupees. It is convenient, but it also makes it easy to act on emotion at midnight. Set your amount in the daytime, when you are calm.
Now let me talk about the number everyone is watching: $78,000. When a price bounces around a round level, traders treat it like a floor. If Bitcoin stays above it, confidence slowly returns. If it falls through, many people will rush to sell at the same time. That is why you will see so much talk about this level today.
But a floor is not a promise. Nobody can guarantee it will hold, and anyone who says they can is guessing.
What I would do on a day like this is simple. I would not chase the price. I would not panic either. I would check my plan, look at the bigger chart, and ask one honest question: would I still be comfortable with this decision if Bitcoin dropped 10% next week?
If the answer is yes, you are probably investing. If the answer is no, you are probably gambling.
One more habit worth building is writing down your entry price and your reason in a note on your phone. Three months later, you will learn more from reading that note than from any video or tweet.
Bitcoin has been through many cycles of excitement and fear, and it will go through more. The people who do well are usually not the ones with the best predictions. They are the ones with a plan and the patience to follow it.
So today, enjoy the green candle. Just remember it is one page of a very long book.
What is your rule before you buy during a pump? Share it in the comments, because I would love to learn from you too.
This article is for educational purposes only and is not financial advice. Crypto is highly volatile, so always do your own research and never invest more than you can afford to lose.
$BTC
#Bitcoin #BTC #BinanceSquare #cryptoeducation
5
1.6k
·
--
Падение
Can $TRUMP Really Hit $79.70 Again? 👀🚀
The question is simple: Is another move toward $79.70 possible for $TRUMP ?
After all the market volatility, some traders are still watching for a major comeback.
But let's be realistic. Reaching $79.70 again would require strong buying pressure, renewed momentum, and a favorable market environment.
Bitcoin's direction will also matter. If BTC starts recovering and market sentiment improves, meme coins could get another opportunity to move higher.
Still, don't confuse hope with confirmation.
Watch the volume, momentum, and resistance levels before making a decision. A strong breakout could change the picture, but a rejection could bring more downside.
{spot}(TRUMPUSDT)
I'm curious about your opinion.
Do you believe $TRUMP can reach $79.70 again, or is that target too ambitious?
Let's hear your thoughts! 👇
#TRUMP #Crypto #Bitcoin #MemeCoins #BinanceSquare
Can $TRUMP Really Hit $79.70 Again? 👀🚀
The question is simple: Is another move toward $79.70 possible for $TRUMP ?
After all the market volatility, some traders are still watching for a major comeback.
But let's be realistic. Reaching $79.70 again would require strong buying pressure, renewed momentum, and a favorable market environment.
Bitcoin's direction will also matter. If BTC starts recovering and market sentiment improves, meme coins could get another opportunity to move higher.
Still, don't confuse hope with confirmation.
Watch the volume, momentum, and resistance levels before making a decision. A strong breakout could change the picture, but a rejection could bring more downside.
I'm curious about your opinion.
Do you believe $TRUMP can reach $79.70 again, or is that target too ambitious?
Let's hear your thoughts! 👇
#TRUMP #Crypto #Bitcoin #MemeCoins #BinanceSquare
The question is simple: Is another move toward $79.70 possible for $TRUMP ?
After all the market volatility, some traders are still watching for a major comeback.
But let's be realistic. Reaching $79.70 again would require strong buying pressure, renewed momentum, and a favorable market environment.
Bitcoin's direction will also matter. If BTC starts recovering and market sentiment improves, meme coins could get another opportunity to move higher.
Still, don't confuse hope with confirmation.
Watch the volume, momentum, and resistance levels before making a decision. A strong breakout could change the picture, but a rejection could bring more downside.
I'm curious about your opinion.
Do you believe $TRUMP can reach $79.70 again, or is that target too ambitious?
Let's hear your thoughts! 👇
#TRUMP #Crypto #Bitcoin #MemeCoins #BinanceSquare
2
3
1.5k
·
--
Падение
🚨 Binance Under Pressure… But Is It Really Losing Its Crown? 👀
After the massive $6.3 billion security incident, Binance faced a wave of customer withdrawals.
But here's something interesting…
📊 Binance reported approximately $4.72 billion in net withdrawals, while the exchange says customer outflows are stabilizing and deposits are returning.
Despite the shock, Binance says it has replenished most of the affected assets and will cover the remaining losses.
💰 Does this mean Binance is losing its dominance?
Not necessarily.
The crypto market is watching closely, and this incident reminds us that even the biggest exchanges face serious security risks.
🏆 Binance remains one of the biggest names in crypto, but trust and security matter more than rankings.
And what about $BNB ? 🚀
Could this recovery create new opportunities for BNB, or will market uncertainty continue?
One thing is clear: Nobody can guarantee a price explosion.
⚠️ Always do your own research. Never keep all your assets on a single exchange, and never invest more than you can afford to lose.
{spot}(BNBUSDT)
What do you think? Is Binance still the king of crypto exchanges? 👑
#Binance #BNB #Crypto #Bitcoin #CryptoNews
🚨 Binance Under Pressure… But Is It Really Losing Its Crown? 👀
After the massive $6.3 billion security incident, Binance faced a wave of customer withdrawals.
But here's something interesting…
📊 Binance reported approximately $4.72 billion in net withdrawals, while the exchange says customer outflows are stabilizing and deposits are returning.
Despite the shock, Binance says it has replenished most of the affected assets and will cover the remaining losses.
💰 Does this mean Binance is losing its dominance?
Not necessarily.
The crypto market is watching closely, and this incident reminds us that even the biggest exchanges face serious security risks.
🏆 Binance remains one of the biggest names in crypto, but trust and security matter more than rankings.
And what about $BNB ? 🚀
Could this recovery create new opportunities for BNB, or will market uncertainty continue?
One thing is clear: Nobody can guarantee a price explosion.
⚠️ Always do your own research. Never keep all your assets on a single exchange, and never invest more than you can afford to lose.
What do you think? Is Binance still the king of crypto exchanges? 👑
#Binance #BNB #Crypto #Bitcoin #CryptoNews
After the massive $6.3 billion security incident, Binance faced a wave of customer withdrawals.
But here's something interesting…
📊 Binance reported approximately $4.72 billion in net withdrawals, while the exchange says customer outflows are stabilizing and deposits are returning.
Despite the shock, Binance says it has replenished most of the affected assets and will cover the remaining losses.
💰 Does this mean Binance is losing its dominance?
Not necessarily.
The crypto market is watching closely, and this incident reminds us that even the biggest exchanges face serious security risks.
🏆 Binance remains one of the biggest names in crypto, but trust and security matter more than rankings.
And what about $BNB ? 🚀
Could this recovery create new opportunities for BNB, or will market uncertainty continue?
One thing is clear: Nobody can guarantee a price explosion.
⚠️ Always do your own research. Never keep all your assets on a single exchange, and never invest more than you can afford to lose.
What do you think? Is Binance still the king of crypto exchanges? 👑
#Binance #BNB #Crypto #Bitcoin #CryptoNews
·
--
Падение
Bitcoin Spot Market Update: $866 Million in Trading Volume — What Is Happening to BTC?
Bitcoin is showing some weakness today, but the trading activity is worth watching.
According to the latest Binance market figures provided $BTC is trading around $77,030, down approximately 1.36% over the past 24 hours.
The market has been moving between $77,000 and $78,878.01, showing that sellers have managed to push the price lower from the session's high.
One number stands out: Binance BTCUSDT trading volume has reached 11,103.56 BTC, representing approximately $866.41 million in quote volume.
That is significant trading activity, but volume alone does not tell us whether money is entering or leaving Bitcoin.
Here is what traders should understand.
High volume during a price decline can indicate strong selling activity. However, it can also include buyers stepping in to absorb that selling pressure. The next price movement will help reveal which side is gaining control.
For now, $77,000 is an important level to watch because it is close to the reported session low.
If BTC continues holding above this area and buyers return with stronger volume, a recovery toward the upper part of the session range could become possible.
On the other hand, if Bitcoin loses $77,000 with strong selling pressure, traders may need to prepare for further downside.
There is also an important lesson for beginners: never confuse trading volume with actual capital inflow.
A market can record hundreds of millions of dollars in trading volume while its price is falling. Volume measures trading activity, not the net amount of money entering the asset.
My view is simple: Bitcoin is showing short-term weakness, and $77,000 deserves close attention. A clear recovery with strong buying activity would improve the picture, while a breakdown could increase selling pressure.
Don't rush into a trade just because the market is moving. Watch the levels, confirm the direction, and manage your risk.
What do you think? Will BTC defend $77,000, or are sellers preparing for another move lower?
Bitcoin Spot Market Update: $866 Million in Trading Volume — What Is Happening to BTC?
Bitcoin is showing some weakness today, but the trading activity is worth watching.
According to the latest Binance market figures provided $BTC is trading around $77,030, down approximately 1.36% over the past 24 hours.
The market has been moving between $77,000 and $78,878.01, showing that sellers have managed to push the price lower from the session's high.
One number stands out: Binance BTCUSDT trading volume has reached 11,103.56 BTC, representing approximately $866.41 million in quote volume.
That is significant trading activity, but volume alone does not tell us whether money is entering or leaving Bitcoin.
Here is what traders should understand.
High volume during a price decline can indicate strong selling activity. However, it can also include buyers stepping in to absorb that selling pressure. The next price movement will help reveal which side is gaining control.
For now, $77,000 is an important level to watch because it is close to the reported session low.
If BTC continues holding above this area and buyers return with stronger volume, a recovery toward the upper part of the session range could become possible.
On the other hand, if Bitcoin loses $77,000 with strong selling pressure, traders may need to prepare for further downside.
There is also an important lesson for beginners: never confuse trading volume with actual capital inflow.
A market can record hundreds of millions of dollars in trading volume while its price is falling. Volume measures trading activity, not the net amount of money entering the asset.
My view is simple: Bitcoin is showing short-term weakness, and $77,000 deserves close attention. A clear recovery with strong buying activity would improve the picture, while a breakdown could increase selling pressure.
Don't rush into a trade just because the market is moving. Watch the levels, confirm the direction, and manage your risk.
What do you think? Will BTC defend $77,000, or are sellers preparing for another move lower?
Bitcoin is showing some weakness today, but the trading activity is worth watching.
According to the latest Binance market figures provided $BTC is trading around $77,030, down approximately 1.36% over the past 24 hours.
The market has been moving between $77,000 and $78,878.01, showing that sellers have managed to push the price lower from the session's high.
One number stands out: Binance BTCUSDT trading volume has reached 11,103.56 BTC, representing approximately $866.41 million in quote volume.
That is significant trading activity, but volume alone does not tell us whether money is entering or leaving Bitcoin.
Here is what traders should understand.
High volume during a price decline can indicate strong selling activity. However, it can also include buyers stepping in to absorb that selling pressure. The next price movement will help reveal which side is gaining control.
For now, $77,000 is an important level to watch because it is close to the reported session low.
If BTC continues holding above this area and buyers return with stronger volume, a recovery toward the upper part of the session range could become possible.
On the other hand, if Bitcoin loses $77,000 with strong selling pressure, traders may need to prepare for further downside.
There is also an important lesson for beginners: never confuse trading volume with actual capital inflow.
A market can record hundreds of millions of dollars in trading volume while its price is falling. Volume measures trading activity, not the net amount of money entering the asset.
My view is simple: Bitcoin is showing short-term weakness, and $77,000 deserves close attention. A clear recovery with strong buying activity would improve the picture, while a breakdown could increase selling pressure.
Don't rush into a trade just because the market is moving. Watch the levels, confirm the direction, and manage your risk.
What do you think? Will BTC defend $77,000, or are sellers preparing for another move lower?
65
·
--
Рост
Проверено
SOXL Is Finally Moving Higher — Is This the Start of a Bigger Rally?
$SOXL is catching attention again.
The Binance screenshot shows SOXLUSDT Perpetual trading around 81.59 USDT, up approximately 3.79%. The price chart is also showing a short-term move higher.
After a difficult period, even a move like this can bring buyers back into the market. But one green move does not automatically mean a new uptrend has started.
There is something important about SOXL that every trader should understand.
SOXL is the Direxion Daily Semiconductor Bull 3X ETF. Its objective is to deliver three times the daily performance of its semiconductor index, before fees and expenses. That means gains can be powerful when semiconductor stocks rise, but losses can also become much larger when the sector moves in the opposite direction.
And when trading SOXLUSDT perpetual futures, there is another risk: futures leverage. Your chosen futures leverage can amplify both profits and losses even further.
So, how should traders approach this move?
First, watch whether buyers can maintain the upward momentum. A temporary price jump is less meaningful if the market quickly gives back its gains.
Second, pay attention to trading volume. A stronger move supported by increasing volume may carry more weight than a price increase with weak participation.
Third, avoid chasing the green candle. Entering after a sharp move without a clear plan can leave traders exposed if the price suddenly reverses.
One common mistake is seeing a token or stock rise by 3–4% and immediately assuming that the next move will be even bigger. Experienced traders know that confirmation matters more than excitement.
For now, the screenshot shows a positive short-term move, not proof of a confirmed long-term reversal.
SOXL
{etf_us}(SOXL.ETF)
may have more room to move if semiconductor momentum continues, but traders should remain disciplined and define their risk before entering.
The real question is not simply how high SOXL can go. It is whether buyers can sustain this move.
Watch the momentum, respect the.
SOXL Is Finally Moving Higher — Is This the Start of a Bigger Rally?
$SOXL is catching attention again.
The Binance screenshot shows SOXLUSDT Perpetual trading around 81.59 USDT, up approximately 3.79%. The price chart is also showing a short-term move higher.
After a difficult period, even a move like this can bring buyers back into the market. But one green move does not automatically mean a new uptrend has started.
There is something important about SOXL that every trader should understand.
SOXL is the Direxion Daily Semiconductor Bull 3X ETF. Its objective is to deliver three times the daily performance of its semiconductor index, before fees and expenses. That means gains can be powerful when semiconductor stocks rise, but losses can also become much larger when the sector moves in the opposite direction.
And when trading SOXLUSDT perpetual futures, there is another risk: futures leverage. Your chosen futures leverage can amplify both profits and losses even further.
So, how should traders approach this move?
First, watch whether buyers can maintain the upward momentum. A temporary price jump is less meaningful if the market quickly gives back its gains.
Second, pay attention to trading volume. A stronger move supported by increasing volume may carry more weight than a price increase with weak participation.
Third, avoid chasing the green candle. Entering after a sharp move without a clear plan can leave traders exposed if the price suddenly reverses.
One common mistake is seeing a token or stock rise by 3–4% and immediately assuming that the next move will be even bigger. Experienced traders know that confirmation matters more than excitement.
For now, the screenshot shows a positive short-term move, not proof of a confirmed long-term reversal.
SOXL
may have more room to move if semiconductor momentum continues, but traders should remain disciplined and define their risk before entering.
The real question is not simply how high SOXL can go. It is whether buyers can sustain this move.
Watch the momentum, respect the.
$SOXL is catching attention again.
The Binance screenshot shows SOXLUSDT Perpetual trading around 81.59 USDT, up approximately 3.79%. The price chart is also showing a short-term move higher.
After a difficult period, even a move like this can bring buyers back into the market. But one green move does not automatically mean a new uptrend has started.
There is something important about SOXL that every trader should understand.
SOXL is the Direxion Daily Semiconductor Bull 3X ETF. Its objective is to deliver three times the daily performance of its semiconductor index, before fees and expenses. That means gains can be powerful when semiconductor stocks rise, but losses can also become much larger when the sector moves in the opposite direction.
And when trading SOXLUSDT perpetual futures, there is another risk: futures leverage. Your chosen futures leverage can amplify both profits and losses even further.
So, how should traders approach this move?
First, watch whether buyers can maintain the upward momentum. A temporary price jump is less meaningful if the market quickly gives back its gains.
Second, pay attention to trading volume. A stronger move supported by increasing volume may carry more weight than a price increase with weak participation.
Third, avoid chasing the green candle. Entering after a sharp move without a clear plan can leave traders exposed if the price suddenly reverses.
One common mistake is seeing a token or stock rise by 3–4% and immediately assuming that the next move will be even bigger. Experienced traders know that confirmation matters more than excitement.
For now, the screenshot shows a positive short-term move, not proof of a confirmed long-term reversal.
SOXL
may have more room to move if semiconductor momentum continues, but traders should remain disciplined and define their risk before entering.
The real question is not simply how high SOXL can go. It is whether buyers can sustain this move.
Watch the momentum, respect the.
SOXL-1,46%
SOXLETF-16,62%
1.9k
·
--
Рост
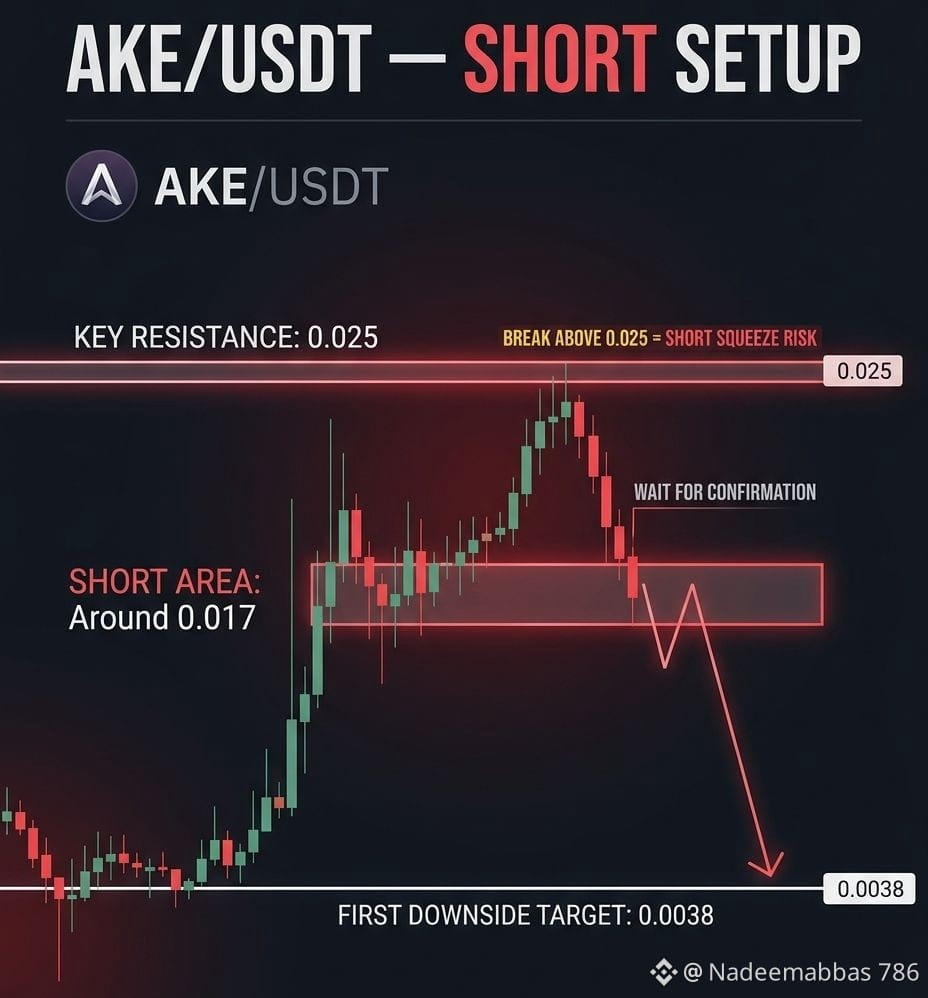
$AKE is giving traders an interesting setup right now but this is not a place to enter blindly
I had a short limit order around 0.017, but price missed the order by a very small margin. That does not change the setup for me. Sometimes the best trade is the one you do not force.
If AKE comes back into the short area I would rather build the position carefully than chase the price. A DCA approach can be considered but only with strict risk management and a clearly defined stop loss.
The most important level I am watching is 0.025.
If AKE makes another strong move upward and breaks above 0.025 with strength and volume, the short idea becomes much more dangerous. A breakout above that area could trigger a short squeeze and force overleveraged traders to close their positions.
But if AKE fails to break that resistance and sellers start taking control again the downside could become interesting.
The chart setup points toward 0.0038 as a possible first downside target, although traders should verify this level on their own chart before taking any position.
For me, the key lesson here is simple: do not chase a missed entry. Wait for the market to come to your level, manage the risk, and always have an invalidation point before opening a trade.
Crypto can move extremely fast especially with smaller tokens like $AKE A setup can look perfect and still fail.
DYOR and never trade with money you cannot afford to lose.
What do you think? Will AKE reject the resistance again, or will 0.025 finally break and trigger another short squeeze?
{future}(AKEUSDT)
$AKE is giving traders an interesting setup right now but this is not a place to enter blindly
I had a short limit order around 0.017, but price missed the order by a very small margin. That does not change the setup for me. Sometimes the best trade is the one you do not force.
If AKE comes back into the short area I would rather build the position carefully than chase the price. A DCA approach can be considered but only with strict risk management and a clearly defined stop loss.
The most important level I am watching is 0.025.
If AKE makes another strong move upward and breaks above 0.025 with strength and volume, the short idea becomes much more dangerous. A breakout above that area could trigger a short squeeze and force overleveraged traders to close their positions.
But if AKE fails to break that resistance and sellers start taking control again the downside could become interesting.
The chart setup points toward 0.0038 as a possible first downside target, although traders should verify this level on their own chart before taking any position.
For me, the key lesson here is simple: do not chase a missed entry. Wait for the market to come to your level, manage the risk, and always have an invalidation point before opening a trade.
Crypto can move extremely fast especially with smaller tokens like $AKE A setup can look perfect and still fail.
DYOR and never trade with money you cannot afford to lose.
What do you think? Will AKE reject the resistance again, or will 0.025 finally break and trigger another short squeeze?
I had a short limit order around 0.017, but price missed the order by a very small margin. That does not change the setup for me. Sometimes the best trade is the one you do not force.
If AKE comes back into the short area I would rather build the position carefully than chase the price. A DCA approach can be considered but only with strict risk management and a clearly defined stop loss.
The most important level I am watching is 0.025.
If AKE makes another strong move upward and breaks above 0.025 with strength and volume, the short idea becomes much more dangerous. A breakout above that area could trigger a short squeeze and force overleveraged traders to close their positions.
But if AKE fails to break that resistance and sellers start taking control again the downside could become interesting.
The chart setup points toward 0.0038 as a possible first downside target, although traders should verify this level on their own chart before taking any position.
For me, the key lesson here is simple: do not chase a missed entry. Wait for the market to come to your level, manage the risk, and always have an invalidation point before opening a trade.
Crypto can move extremely fast especially with smaller tokens like $AKE A setup can look perfect and still fail.
DYOR and never trade with money you cannot afford to lose.
What do you think? Will AKE reject the resistance again, or will 0.025 finally break and trigger another short squeeze?
228
·
--
Рост
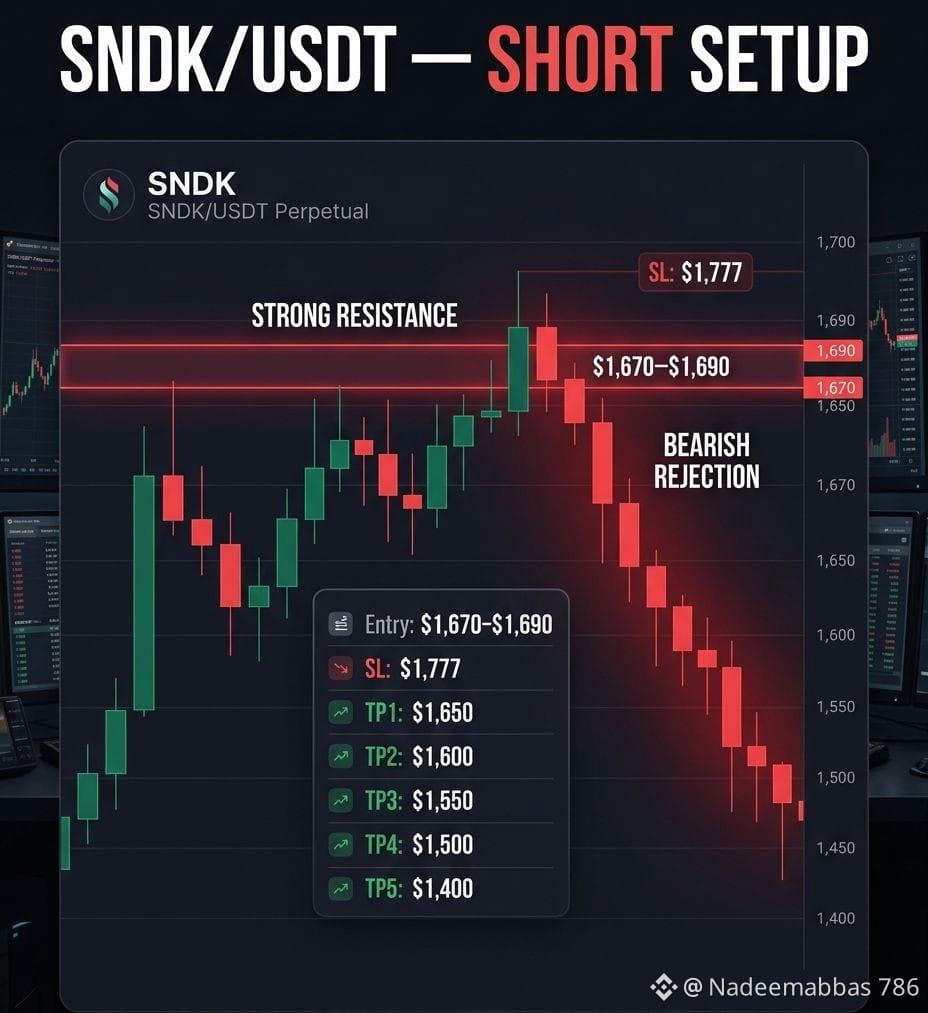
$SNDK is sitting right around a key resistance zone, and this is where I would be watching the reaction very carefully.
The current setup shows SNDK/USDT around $1,672.93, with the proposed short entry zone between $1,670 and $1,690. Price is pushing into resistance, but the real confirmation should come from how sellers react in this area
The short idea is straightforward.
Entry: $1,670–$1,690
Stop Loss: $1,777
Targets: $1,650, $1,600, $1,550, $1,500 and finally $1,400.
I would not blindly short just because price has reached resistance. If SNDK breaks above the resistance zone with strong volume and holds there, the bearish setup can fail.
That is exactly why the $1,777 invalidation level matters.
On the other hand, if price gets rejected from the $1,670–$1,690 area and selling volume starts increasing, the lower targets become much more interesting.
For me, the key thing to watch is confirmation rather than prediction.
A strong rejection can give shorts an opportunity, while a clean breakout would be a warning to stay away from the short.
If you are trading this setup, manage your position size carefully. High-volatility coins can move much faster than expected, especially on perpetual contracts.
What do you think? Will $SNDK
{future}(SNDKUSDT)
K reject this resistance zone, or are the bulls preparing for another breakout?
DYOR and never risk more than you can afford to lose.
$SNDK is sitting right around a key resistance zone, and this is where I would be watching the reaction very carefully.
The current setup shows SNDK/USDT around $1,672.93, with the proposed short entry zone between $1,670 and $1,690. Price is pushing into resistance, but the real confirmation should come from how sellers react in this area
The short idea is straightforward.
Entry: $1,670–$1,690
Stop Loss: $1,777
Targets: $1,650, $1,600, $1,550, $1,500 and finally $1,400.
I would not blindly short just because price has reached resistance. If SNDK breaks above the resistance zone with strong volume and holds there, the bearish setup can fail.
That is exactly why the $1,777 invalidation level matters.
On the other hand, if price gets rejected from the $1,670–$1,690 area and selling volume starts increasing, the lower targets become much more interesting.
For me, the key thing to watch is confirmation rather than prediction.
A strong rejection can give shorts an opportunity, while a clean breakout would be a warning to stay away from the short.
If you are trading this setup, manage your position size carefully. High-volatility coins can move much faster than expected, especially on perpetual contracts.
What do you think? Will $SNDK
K reject this resistance zone, or are the bulls preparing for another breakout?
DYOR and never risk more than you can afford to lose.
The current setup shows SNDK/USDT around $1,672.93, with the proposed short entry zone between $1,670 and $1,690. Price is pushing into resistance, but the real confirmation should come from how sellers react in this area
The short idea is straightforward.
Entry: $1,670–$1,690
Stop Loss: $1,777
Targets: $1,650, $1,600, $1,550, $1,500 and finally $1,400.
I would not blindly short just because price has reached resistance. If SNDK breaks above the resistance zone with strong volume and holds there, the bearish setup can fail.
That is exactly why the $1,777 invalidation level matters.
On the other hand, if price gets rejected from the $1,670–$1,690 area and selling volume starts increasing, the lower targets become much more interesting.
For me, the key thing to watch is confirmation rather than prediction.
A strong rejection can give shorts an opportunity, while a clean breakout would be a warning to stay away from the short.
If you are trading this setup, manage your position size carefully. High-volatility coins can move much faster than expected, especially on perpetual contracts.
What do you think? Will $SNDK
K reject this resistance zone, or are the bulls preparing for another breakout?
DYOR and never risk more than you can afford to lose.
402
·
--
Падение
$BTC SHORT: A $51M Position Is Sitting Very Close to Liquidation
Bitcoin is trading around $64K, but one large leveraged short is getting very interesting
A wallet reportedly opened a BTC short of around 780 BTC near $64,212 using high leverage, with liquidation around $65,451
That means $BTC does not need a massive move higher to put serious pressure on this position
The interesting part is the location
BTC is currently around $64K, while the chart shows the market still moving inside a tight range.
If price pushes above the nearby resistance and starts attracting buyers, short sellers could quickly find themselves trapped
On the other hand, if BTC gets rejected and loses the nearby support area sellers could regain control
For me, the key levels to watch are simple:
Above $64.6K → short squeeze risk increases.
Around $65.4K → major liquidation pressure for the highlighted position.
Below $63.8K → bearish momentum could strengthen.
I would not blindly copy a whale trade here. Large leverage can create opportunities but it can also destroy a position very quickly
The real question is:
Will BTC squeeze these shorts first, or will sellers take control before the liquidation zone is reached?
What are you watching $65K first or $63K next?
DYOR. Use proper risk management and never trade with leverage you cannot afford to lose.
{future}(BTCUSDT)
$BTC SHORT: A $51M Position Is Sitting Very Close to Liquidation
Bitcoin is trading around $64K, but one large leveraged short is getting very interesting
A wallet reportedly opened a BTC short of around 780 BTC near $64,212 using high leverage, with liquidation around $65,451
That means $BTC does not need a massive move higher to put serious pressure on this position
The interesting part is the location
BTC is currently around $64K, while the chart shows the market still moving inside a tight range.
If price pushes above the nearby resistance and starts attracting buyers, short sellers could quickly find themselves trapped
On the other hand, if BTC gets rejected and loses the nearby support area sellers could regain control
For me, the key levels to watch are simple:
Above $64.6K → short squeeze risk increases.
Around $65.4K → major liquidation pressure for the highlighted position.
Below $63.8K → bearish momentum could strengthen.
I would not blindly copy a whale trade here. Large leverage can create opportunities but it can also destroy a position very quickly
The real question is:
Will BTC squeeze these shorts first, or will sellers take control before the liquidation zone is reached?
What are you watching $65K first or $63K next?
DYOR. Use proper risk management and never trade with leverage you cannot afford to lose.
Bitcoin is trading around $64K, but one large leveraged short is getting very interesting
A wallet reportedly opened a BTC short of around 780 BTC near $64,212 using high leverage, with liquidation around $65,451
That means $BTC does not need a massive move higher to put serious pressure on this position
The interesting part is the location
BTC is currently around $64K, while the chart shows the market still moving inside a tight range.
If price pushes above the nearby resistance and starts attracting buyers, short sellers could quickly find themselves trapped
On the other hand, if BTC gets rejected and loses the nearby support area sellers could regain control
For me, the key levels to watch are simple:
Above $64.6K → short squeeze risk increases.
Around $65.4K → major liquidation pressure for the highlighted position.
Below $63.8K → bearish momentum could strengthen.
I would not blindly copy a whale trade here. Large leverage can create opportunities but it can also destroy a position very quickly
The real question is:
Will BTC squeeze these shorts first, or will sellers take control before the liquidation zone is reached?
What are you watching $65K first or $63K next?
DYOR. Use proper risk management and never trade with leverage you cannot afford to lose.
76
·
--
Рост
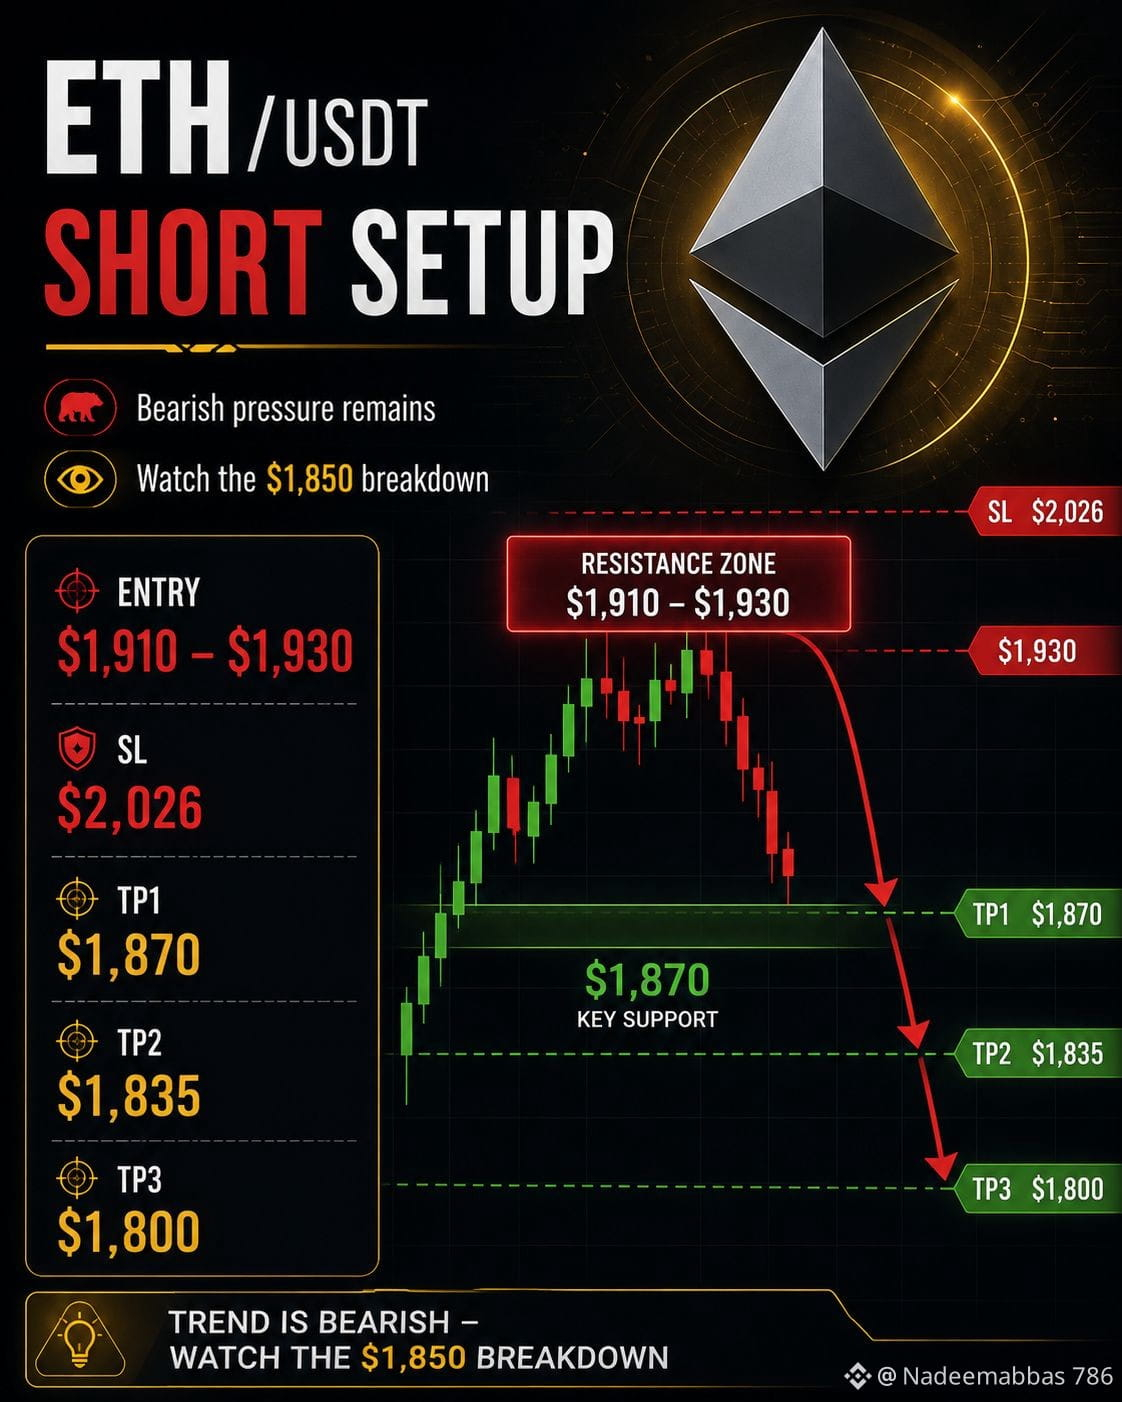
$ETH is showing a bounce but I’m still watching the downside carefully.
ETH/USDT is trading around $1,925, and this area could become important if sellers step back in.
My short-term short setup:
Entry: $1,910 $1,930
Stop Loss: $2,026
TP1: $1,870 TP2: $1,835 TP3: $1,800
The main idea is simple:
$ETH is approaching a resistance zone and if buyers fail to push through it another downside move could start.
A clean rejection from the $1,910 $1,930 area would make the short setup more interesting. If ETH loses $1,870 with strong selling volume the next levels I’m watching are $1,835 and $1,800.
But I’m not calling this a guaranteed dump Crypto can move fast in both directions and a strong breakout above the resistance zone could invalidate the setup.
For me the key level is $1,930. Above that, I would become much more cautious with shorts. Below $1,870, the bearish scenario becomes stronger.
What do you think?
Will ETH reject the $1,910 $1,930 zone, or are the bulls preparing for another breakout?
Always DYOR and manage your risk. Never risk more than you can afford to lose.
{future}(ETHUSDT)
$ETH is showing a bounce but I’m still watching the downside carefully.
ETH/USDT is trading around $1,925, and this area could become important if sellers step back in.
My short-term short setup:
Entry: $1,910 $1,930
Stop Loss: $2,026
TP1: $1,870 TP2: $1,835 TP3: $1,800
The main idea is simple:
$ETH is approaching a resistance zone and if buyers fail to push through it another downside move could start.
A clean rejection from the $1,910 $1,930 area would make the short setup more interesting. If ETH loses $1,870 with strong selling volume the next levels I’m watching are $1,835 and $1,800.
But I’m not calling this a guaranteed dump Crypto can move fast in both directions and a strong breakout above the resistance zone could invalidate the setup.
For me the key level is $1,930. Above that, I would become much more cautious with shorts. Below $1,870, the bearish scenario becomes stronger.
What do you think?
Will ETH reject the $1,910 $1,930 zone, or are the bulls preparing for another breakout?
Always DYOR and manage your risk. Never risk more than you can afford to lose.
ETH/USDT is trading around $1,925, and this area could become important if sellers step back in.
My short-term short setup:
Entry: $1,910 $1,930
Stop Loss: $2,026
TP1: $1,870 TP2: $1,835 TP3: $1,800
The main idea is simple:
$ETH is approaching a resistance zone and if buyers fail to push through it another downside move could start.
A clean rejection from the $1,910 $1,930 area would make the short setup more interesting. If ETH loses $1,870 with strong selling volume the next levels I’m watching are $1,835 and $1,800.
But I’m not calling this a guaranteed dump Crypto can move fast in both directions and a strong breakout above the resistance zone could invalidate the setup.
For me the key level is $1,930. Above that, I would become much more cautious with shorts. Below $1,870, the bearish scenario becomes stronger.
What do you think?
Will ETH reject the $1,910 $1,930 zone, or are the bulls preparing for another breakout?
Always DYOR and manage your risk. Never risk more than you can afford to lose.
92
·
--
Рост
Everyone is focused on Bitcoin but one of the more interesting setups is quietly developing on US/ $USDT
While BTC is grabbing all the headlines, US has been building strength on the 4 hour chart instead of making emotional moves.
These are often the setups that catch traders by surprise because they don't attract much attention until the breakout is already underway.
The daily trend remains bullish, and price is holding above the key support zone around 0.0554.
Momentum is also improving with the RSI sitting near the mid range instead of overbought territory.
That suggests buyers still have room to push higher if trading volume continues to increase.
Another reason I'm watching this pair is the current volatility. The 1-hour ATR remains relatively low, which usually means the market is compressing before a stronger directional move.
If buyers step in with higher volume the next leg higher could arrive quickly.
Trade Plan
Entry: 0.0552569 – 0.0556051
Stop Loss: 0.0505809
Take Profit 1: 0.0590686
Take Profit 2: 0.0614936
Take Profit 3: 0.0651311
The first target offers a solid move while TP3 could deliver nearly a 17% gain from the entry zone if momentum continues.
However a break below the stop loss level would invalidate the bullish setup making disciplined risk management essential.
{alpha}(CT_7840xee962a61432231c2ede6946515beb02290cb516ad087bb06a731e922b2a5f57a::us::US)
Markets reward patience more often than excitement. Let the chart confirm the move manage your risk carefully, and always do your own research before entering any position.
#US #CryptoTrading
$US
Everyone is focused on Bitcoin but one of the more interesting setups is quietly developing on US/ $USDT
While BTC is grabbing all the headlines, US has been building strength on the 4 hour chart instead of making emotional moves.
These are often the setups that catch traders by surprise because they don't attract much attention until the breakout is already underway.
The daily trend remains bullish, and price is holding above the key support zone around 0.0554.
Momentum is also improving with the RSI sitting near the mid range instead of overbought territory.
That suggests buyers still have room to push higher if trading volume continues to increase.
Another reason I'm watching this pair is the current volatility. The 1-hour ATR remains relatively low, which usually means the market is compressing before a stronger directional move.
If buyers step in with higher volume the next leg higher could arrive quickly.
Trade Plan
Entry: 0.0552569 – 0.0556051
Stop Loss: 0.0505809
Take Profit 1: 0.0590686
Take Profit 2: 0.0614936
Take Profit 3: 0.0651311
The first target offers a solid move while TP3 could deliver nearly a 17% gain from the entry zone if momentum continues.
However a break below the stop loss level would invalidate the bullish setup making disciplined risk management essential.
Markets reward patience more often than excitement. Let the chart confirm the move manage your risk carefully, and always do your own research before entering any position.
#US #CryptoTrading
$US
While BTC is grabbing all the headlines, US has been building strength on the 4 hour chart instead of making emotional moves.
These are often the setups that catch traders by surprise because they don't attract much attention until the breakout is already underway.
The daily trend remains bullish, and price is holding above the key support zone around 0.0554.
Momentum is also improving with the RSI sitting near the mid range instead of overbought territory.
That suggests buyers still have room to push higher if trading volume continues to increase.
Another reason I'm watching this pair is the current volatility. The 1-hour ATR remains relatively low, which usually means the market is compressing before a stronger directional move.
If buyers step in with higher volume the next leg higher could arrive quickly.
Trade Plan
Entry: 0.0552569 – 0.0556051
Stop Loss: 0.0505809
Take Profit 1: 0.0590686
Take Profit 2: 0.0614936
Take Profit 3: 0.0651311
The first target offers a solid move while TP3 could deliver nearly a 17% gain from the entry zone if momentum continues.
However a break below the stop loss level would invalidate the bullish setup making disciplined risk management essential.
Markets reward patience more often than excitement. Let the chart confirm the move manage your risk carefully, and always do your own research before entering any position.
#US #CryptoTrading
$US
310
·
--
Падение
$BEAT has been under heavy selling pressure, and today's price action reflects that clearly. After dropping more than 14% in a single session buyers have not shown enough strength to reclaim key resistance levels.
The price is now hovering just above the psychological $2.00 support making this one of the most important levels to watch.
A lot of traders make the mistake of buying simply because a coin has fallen sharply. A strong downtrend can stay bearish much longer than expected. Until BEAT starts printing higher highs and stronger buying volume returns, every bounce could simply be a temporary relief rally.
For short term traders, the $2.15–$2.20 area looks like a potential short entry zone if price gets rejected there. As long as the price remains below $2.41, bears still have the advantage.
Trade Setup
Entry: $2.15 – $2.20
Stop Loss: $2.41
Take Profit 1: $2.00
Take Profit 2: $1.80
Take Profit 3: $1.40
Final Target: $1.00
The biggest level to watch now is $2.00. If BEAT loses this support with strong selling volume panic selling could accelerate and open the door toward lower targets. On the other hand, if buyers defend this level and volume starts increasing a short term bounce cannot be ruled out.
Risk management is more important than predicting the market. Never risk more than you can afford to lose, and always do your own research before entering any trade.
$BEAT
{future}(BEATUSDT)
$BEAT has been under heavy selling pressure, and today's price action reflects that clearly. After dropping more than 14% in a single session buyers have not shown enough strength to reclaim key resistance levels.
The price is now hovering just above the psychological $2.00 support making this one of the most important levels to watch.
A lot of traders make the mistake of buying simply because a coin has fallen sharply. A strong downtrend can stay bearish much longer than expected. Until BEAT starts printing higher highs and stronger buying volume returns, every bounce could simply be a temporary relief rally.
For short term traders, the $2.15–$2.20 area looks like a potential short entry zone if price gets rejected there. As long as the price remains below $2.41, bears still have the advantage.
Trade Setup
Entry: $2.15 – $2.20
Stop Loss: $2.41
Take Profit 1: $2.00
Take Profit 2: $1.80
Take Profit 3: $1.40
Final Target: $1.00
The biggest level to watch now is $2.00. If BEAT loses this support with strong selling volume panic selling could accelerate and open the door toward lower targets. On the other hand, if buyers defend this level and volume starts increasing a short term bounce cannot be ruled out.
Risk management is more important than predicting the market. Never risk more than you can afford to lose, and always do your own research before entering any trade.
$BEAT
The price is now hovering just above the psychological $2.00 support making this one of the most important levels to watch.
A lot of traders make the mistake of buying simply because a coin has fallen sharply. A strong downtrend can stay bearish much longer than expected. Until BEAT starts printing higher highs and stronger buying volume returns, every bounce could simply be a temporary relief rally.
For short term traders, the $2.15–$2.20 area looks like a potential short entry zone if price gets rejected there. As long as the price remains below $2.41, bears still have the advantage.
Trade Setup
Entry: $2.15 – $2.20
Stop Loss: $2.41
Take Profit 1: $2.00
Take Profit 2: $1.80
Take Profit 3: $1.40
Final Target: $1.00
The biggest level to watch now is $2.00. If BEAT loses this support with strong selling volume panic selling could accelerate and open the door toward lower targets. On the other hand, if buyers defend this level and volume starts increasing a short term bounce cannot be ruled out.
Risk management is more important than predicting the market. Never risk more than you can afford to lose, and always do your own research before entering any trade.
$BEAT
253
$DEXE Is Quietly Building Strength Is This the Start of a Bigger Move?
While most traders are focused on Bitcoin DEXE is showing signs of steady accumulation.
The price is trading around $2.29 after bouncing from the daily low near $2.22. More importantly buyers have managed to push the price back above the short term moving average suggesting that momentum is slowly shifting in favor of the bulls.
What catches my attention isn't the small green candle it's the structure.
Instead of making lower lows, DEXE is printing higher lows on the lower timeframes That's often an early sign that buyers are absorbing selling pressure rather than chasing the price.
If volume continues to improve, the next resistance around the recent high near $2.50 becomes an important level to watch.
A clean breakout above that area could attract fresh momentum traders.
On the other hand if buyers fail to defend the $2.22 support zone, we could see another healthy pullback before the next attempt higher.
For me, this isn't a coin to FOMO into.
It's a coin to watch patiently while monitoring volume market sentiment and Bitcoin's overall direction.
Strong altcoin rallies usually become more sustainable when BTC remains stable.
Risk management always comes first.
Never risk more than you can afford to lose, and always wait for confirmation instead of chasing candles.
Are you accumulating $DEXE
{future}(DEXEUSDT)
here or waiting for a confirmed breakout above resistance?
#dexe #defi #Crypto #Trading #dyor
$DEXE Is Quietly Building Strength Is This the Start of a Bigger Move?
While most traders are focused on Bitcoin DEXE is showing signs of steady accumulation.
The price is trading around $2.29 after bouncing from the daily low near $2.22. More importantly buyers have managed to push the price back above the short term moving average suggesting that momentum is slowly shifting in favor of the bulls.
What catches my attention isn't the small green candle it's the structure.
Instead of making lower lows, DEXE is printing higher lows on the lower timeframes That's often an early sign that buyers are absorbing selling pressure rather than chasing the price.
If volume continues to improve, the next resistance around the recent high near $2.50 becomes an important level to watch.
A clean breakout above that area could attract fresh momentum traders.
On the other hand if buyers fail to defend the $2.22 support zone, we could see another healthy pullback before the next attempt higher.
For me, this isn't a coin to FOMO into.
It's a coin to watch patiently while monitoring volume market sentiment and Bitcoin's overall direction.
Strong altcoin rallies usually become more sustainable when BTC remains stable.
Risk management always comes first.
Never risk more than you can afford to lose, and always wait for confirmation instead of chasing candles.
Are you accumulating $DEXE
here or waiting for a confirmed breakout above resistance?
#dexe #defi #Crypto #Trading #dyor
While most traders are focused on Bitcoin DEXE is showing signs of steady accumulation.
The price is trading around $2.29 after bouncing from the daily low near $2.22. More importantly buyers have managed to push the price back above the short term moving average suggesting that momentum is slowly shifting in favor of the bulls.
What catches my attention isn't the small green candle it's the structure.
Instead of making lower lows, DEXE is printing higher lows on the lower timeframes That's often an early sign that buyers are absorbing selling pressure rather than chasing the price.
If volume continues to improve, the next resistance around the recent high near $2.50 becomes an important level to watch.
A clean breakout above that area could attract fresh momentum traders.
On the other hand if buyers fail to defend the $2.22 support zone, we could see another healthy pullback before the next attempt higher.
For me, this isn't a coin to FOMO into.
It's a coin to watch patiently while monitoring volume market sentiment and Bitcoin's overall direction.
Strong altcoin rallies usually become more sustainable when BTC remains stable.
Risk management always comes first.
Never risk more than you can afford to lose, and always wait for confirmation instead of chasing candles.
Are you accumulating $DEXE
here or waiting for a confirmed breakout above resistance?
#dexe #defi #Crypto #Trading #dyor
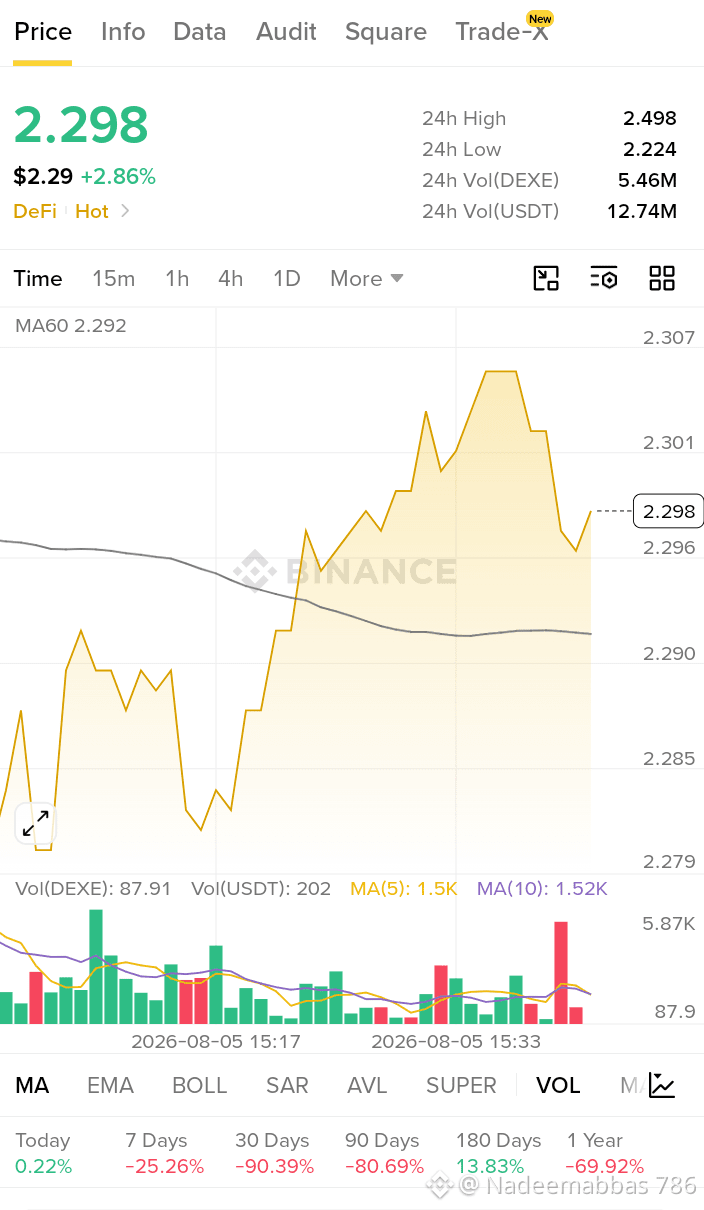
222
·
--
Рост
$BTC Is Approaching a Decision Zone Here's What I'm Watching.
Bitcoin is trading around the $64K region and this area could decide the next short term move.
Looking at the current price action I'm watching the liquidity sitting between $64.35K and $64.65K.
If BTC pushes into that zone and gets rejected with strong selling pressure we could see another move lower before the market finds a stronger base.
My short term trade idea:
Short Entry: $64,000 $64,600
Stop Loss: $65,800
Targets: TP1: $63 450 TP2: $62,850 TP3 $62,250
What makes this level interesting is the uncertainty surrounding upcoming U.S. crypto regulation discussions.
Many traders are waiting for more clarity before making aggressive moves which is keeping volatility compressed.
For spot investors I'm not chasing green candles Instead, I'm watching the $62K $62.5K zone for potential accumulation if price reaches it.
Buying during fear has often worked better than buying after a breakout.
From a bigger picture perspective I still believe Bitcoin's long term trend remains constructive.
If BTC eventually reclaims and holds above the $67K $67.6K resistance area it could signal renewed bullish momentum.
Of course markets can always surprise us so it's important to stay flexible rather than assume any outcome is guaranteed.
Risk management always comes first
Never invest your entire capital in a single trade use a stop loss, and always do your own research before entering any position.
What's your strategy? $BTC
{future}(BTCUSDT)
Are you shorting this resistance, waiting for the dip or already accumulating Bitcoin?
#BTC #crypto #Trading #cryptotrading #dyor
$BTC Is Approaching a Decision Zone Here's What I'm Watching.
Bitcoin is trading around the $64K region and this area could decide the next short term move.
Looking at the current price action I'm watching the liquidity sitting between $64.35K and $64.65K.
If BTC pushes into that zone and gets rejected with strong selling pressure we could see another move lower before the market finds a stronger base.
My short term trade idea:
Short Entry: $64,000 $64,600
Stop Loss: $65,800
Targets: TP1: $63 450 TP2: $62,850 TP3 $62,250
What makes this level interesting is the uncertainty surrounding upcoming U.S. crypto regulation discussions.
Many traders are waiting for more clarity before making aggressive moves which is keeping volatility compressed.
For spot investors I'm not chasing green candles Instead, I'm watching the $62K $62.5K zone for potential accumulation if price reaches it.
Buying during fear has often worked better than buying after a breakout.
From a bigger picture perspective I still believe Bitcoin's long term trend remains constructive.
If BTC eventually reclaims and holds above the $67K $67.6K resistance area it could signal renewed bullish momentum.
Of course markets can always surprise us so it's important to stay flexible rather than assume any outcome is guaranteed.
Risk management always comes first
Never invest your entire capital in a single trade use a stop loss, and always do your own research before entering any position.
What's your strategy? $BTC
Are you shorting this resistance, waiting for the dip or already accumulating Bitcoin?
#BTC #crypto #Trading #cryptotrading #dyor
Bitcoin is trading around the $64K region and this area could decide the next short term move.
Looking at the current price action I'm watching the liquidity sitting between $64.35K and $64.65K.
If BTC pushes into that zone and gets rejected with strong selling pressure we could see another move lower before the market finds a stronger base.
My short term trade idea:
Short Entry: $64,000 $64,600
Stop Loss: $65,800
Targets: TP1: $63 450 TP2: $62,850 TP3 $62,250
What makes this level interesting is the uncertainty surrounding upcoming U.S. crypto regulation discussions.
Many traders are waiting for more clarity before making aggressive moves which is keeping volatility compressed.
For spot investors I'm not chasing green candles Instead, I'm watching the $62K $62.5K zone for potential accumulation if price reaches it.
Buying during fear has often worked better than buying after a breakout.
From a bigger picture perspective I still believe Bitcoin's long term trend remains constructive.
If BTC eventually reclaims and holds above the $67K $67.6K resistance area it could signal renewed bullish momentum.
Of course markets can always surprise us so it's important to stay flexible rather than assume any outcome is guaranteed.
Risk management always comes first
Never invest your entire capital in a single trade use a stop loss, and always do your own research before entering any position.
What's your strategy? $BTC
Are you shorting this resistance, waiting for the dip or already accumulating Bitcoin?
#BTC #crypto #Trading #cryptotrading #dyor
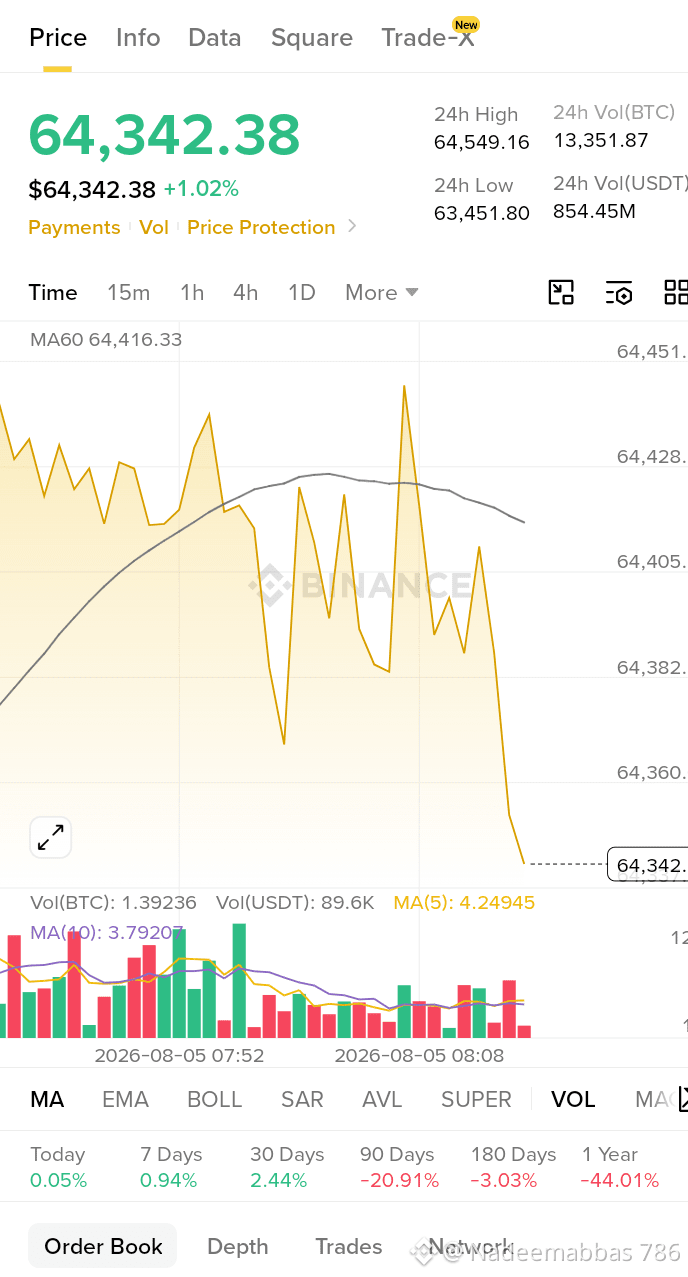
80
·
--
Рост
$DYM is starting to catch traders' attention again and the latest setup is interesting for anyone watching short term momentum.
The current strategy suggests looking for entries around 0.0132 and 0.0124 while keeping risk under control with a stop loss below 0.011 on the 4 hour timeframe. That support zone is important because losing it could completely change the bullish outlook.
What makes this setup attractive isn't just the price targets. It's the risk to reward ratio. If buyers successfully defend the current range the upside targets at 0.0148, 0.0162, 0.0180, 0.0190 and even 0.0220 become realistic levels to watch one by one.
Still chasing green candles is rarely the best strategy. Experienced traders usually wait for confirmation through strong volume and a clean bullish candle before increasing their position A breakout without volume often fails.
For me the key question is simple: Can DYM hold above its support while attracting fresh buying pressure? If the answer is yes momentum could build quickly If not patience may be the better trade.
Always manage your risk, use a stop loss, and never invest based on hype alone.
What's your view on $DYM
{future}(DYMUSDT)
Will it reach 0.022, or is another pullback coming first?
$DYM is starting to catch traders' attention again and the latest setup is interesting for anyone watching short term momentum.
The current strategy suggests looking for entries around 0.0132 and 0.0124 while keeping risk under control with a stop loss below 0.011 on the 4 hour timeframe. That support zone is important because losing it could completely change the bullish outlook.
What makes this setup attractive isn't just the price targets. It's the risk to reward ratio. If buyers successfully defend the current range the upside targets at 0.0148, 0.0162, 0.0180, 0.0190 and even 0.0220 become realistic levels to watch one by one.
Still chasing green candles is rarely the best strategy. Experienced traders usually wait for confirmation through strong volume and a clean bullish candle before increasing their position A breakout without volume often fails.
For me the key question is simple: Can DYM hold above its support while attracting fresh buying pressure? If the answer is yes momentum could build quickly If not patience may be the better trade.
Always manage your risk, use a stop loss, and never invest based on hype alone.
What's your view on $DYM
Will it reach 0.022, or is another pullback coming first?
The current strategy suggests looking for entries around 0.0132 and 0.0124 while keeping risk under control with a stop loss below 0.011 on the 4 hour timeframe. That support zone is important because losing it could completely change the bullish outlook.
What makes this setup attractive isn't just the price targets. It's the risk to reward ratio. If buyers successfully defend the current range the upside targets at 0.0148, 0.0162, 0.0180, 0.0190 and even 0.0220 become realistic levels to watch one by one.
Still chasing green candles is rarely the best strategy. Experienced traders usually wait for confirmation through strong volume and a clean bullish candle before increasing their position A breakout without volume often fails.
For me the key question is simple: Can DYM hold above its support while attracting fresh buying pressure? If the answer is yes momentum could build quickly If not patience may be the better trade.
Always manage your risk, use a stop loss, and never invest based on hype alone.
What's your view on $DYM
Will it reach 0.022, or is another pullback coming first?
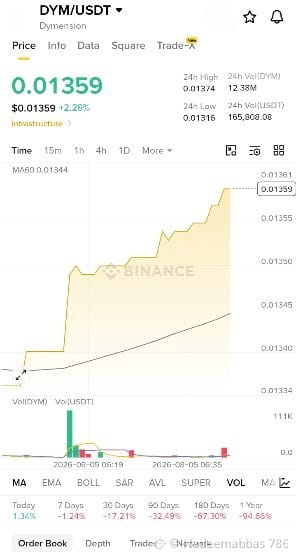
187
·
--
Рост
$AKE has suddenly become one of the hottest tokens on Binance and there is a reason everyone is watching it.
Massive trading volume strong community attention and aggressive price movement have pushed AKE into the trending list.
Whenever a smaller cap token starts attracting this much liquidity traders know volatility is coming.
Some traders are chasing quick profits while others are waiting for a healthy pullback before entering.
The biggest mistake is buying only because the price is going up.
Smart traders always watch volume support levels and whether buyers can maintain momentum.
If $AKE
{alpha}(560x2c3a8ee94ddd97244a93bc48298f97d2c412f7db)
continues attracting fresh liquidity the rally could extend
But if volume starts fading profit taking may trigger a sharp correction
In fast moving markets, patience is often more profitable than FOMO.
Always manage your risk and never invest more than you can afford to lose
$AKE has suddenly become one of the hottest tokens on Binance and there is a reason everyone is watching it.
Massive trading volume strong community attention and aggressive price movement have pushed AKE into the trending list.
Whenever a smaller cap token starts attracting this much liquidity traders know volatility is coming.
Some traders are chasing quick profits while others are waiting for a healthy pullback before entering.
The biggest mistake is buying only because the price is going up.
Smart traders always watch volume support levels and whether buyers can maintain momentum.
If $AKE
continues attracting fresh liquidity the rally could extend
But if volume starts fading profit taking may trigger a sharp correction
In fast moving markets, patience is often more profitable than FOMO.
Always manage your risk and never invest more than you can afford to lose
Massive trading volume strong community attention and aggressive price movement have pushed AKE into the trending list.
Whenever a smaller cap token starts attracting this much liquidity traders know volatility is coming.
Some traders are chasing quick profits while others are waiting for a healthy pullback before entering.
The biggest mistake is buying only because the price is going up.
Smart traders always watch volume support levels and whether buyers can maintain momentum.
If $AKE
continues attracting fresh liquidity the rally could extend
But if volume starts fading profit taking may trigger a sharp correction
In fast moving markets, patience is often more profitable than FOMO.
Always manage your risk and never invest more than you can afford to lose

160
Войдите, чтобы посмотреть больше материала
Присоединяйтесь к пользователям криптовалют по всему миру на Binance Square
⚡️ Получайте новейшую и полезную информацию о криптоактивах.
💬 Нам доверяет крупнейшая в мире криптобиржа.
👍 Получите достоверные аналитические данные от верифицированных создателей контента.
Эл. почта/номер телефона
В тренде
CryptoSelloffTriggersMultipleWhaleLiquidations
Просмотров: 246,621
2,123 обсуждают
Crypto Liquidations Top $2B in 24 Hours as 329,000 Traders Are Wiped Out
Binance News
·Лайков: 40
·Просмотров: 60.8k
HuangReportedlyConsidersReturnToNvidia
Просмотров: 4,081
100 обсуждают
BitcoinSpotETFsPost$1.065BOutflowsForThirdStraightWeek
Просмотров: 0
2 обсуждают