

#bitcoinslipsbelow$84000
bitcoinslipsbelow$84000
Популярные
Новые

·
--
9.30大饼
$BTC
反弹摸到84000-84300区间,直接做箜
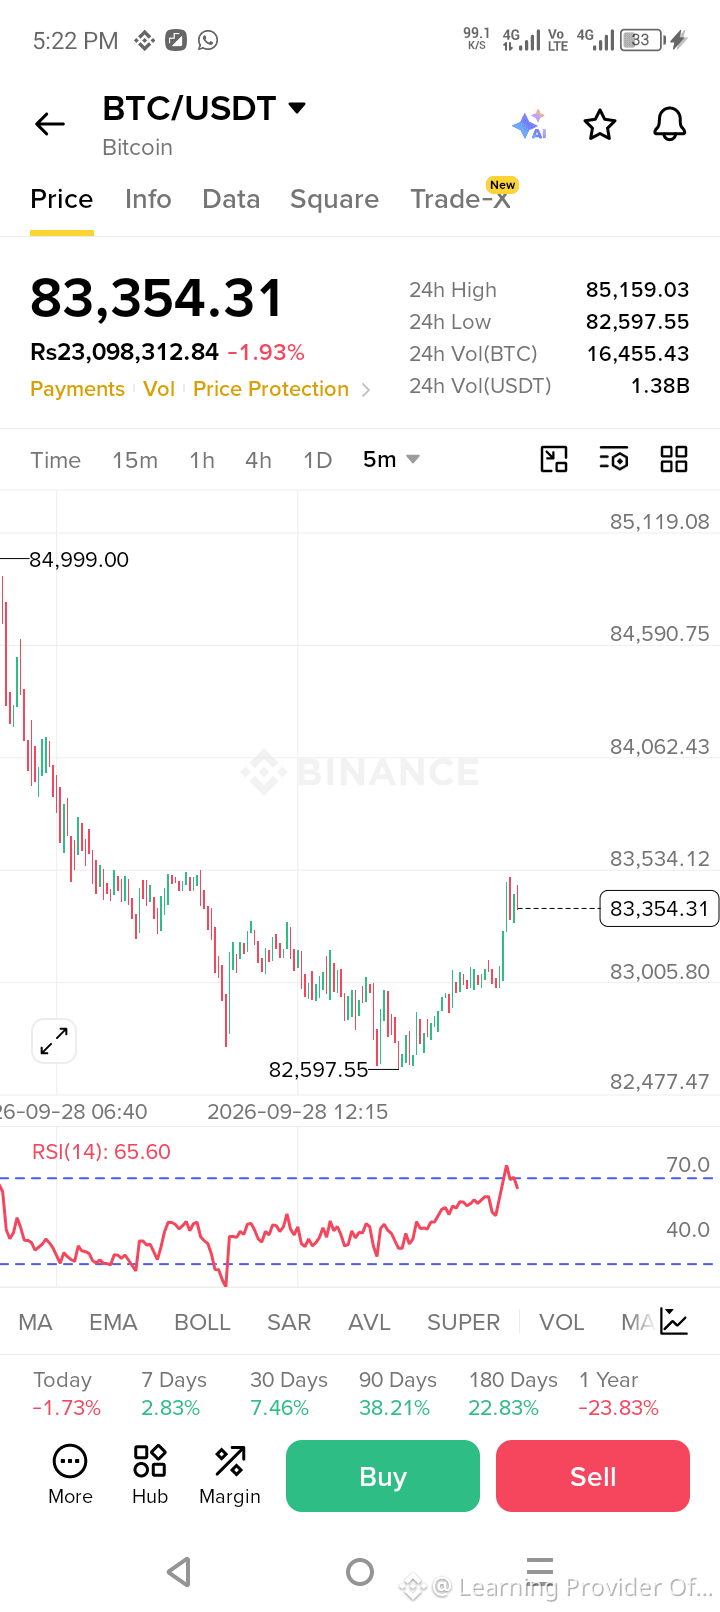
昨晚砸到82800附近砸出低点,今天早盘缓过来开始反弹,整体还是箜头说了算。
上面84000-84300这一带刚好被均线压着,反弹到这儿全是抛压,根本冲不上去。下面先盯83000-82800的支撑,守不住就得接着往下探底。
操作上,价格反弹到84000-84300就分批进箜单,笋位放84500上面防着点,芷楹先看83100-82900。#股票财报季
9.30大饼
$BTC
反弹摸到84000-84300区间,直接做箜
昨晚砸到82800附近砸出低点,今天早盘缓过来开始反弹,整体还是箜头说了算。
上面84000-84300这一带刚好被均线压着,反弹到这儿全是抛压,根本冲不上去。下面先盯83000-82800的支撑,守不住就得接着往下探底。
操作上,价格反弹到84000-84300就分批进箜单,笋位放84500上面防着点,芷楹先看83100-82900。#股票财报季
$BTC
反弹摸到84000-84300区间,直接做箜
昨晚砸到82800附近砸出低点,今天早盘缓过来开始反弹,整体还是箜头说了算。
上面84000-84300这一带刚好被均线压着,反弹到这儿全是抛压,根本冲不上去。下面先盯83000-82800的支撑,守不住就得接着往下探底。
操作上,价格反弹到84000-84300就分批进箜单,笋位放84500上面防着点,芷楹先看83100-82900。#股票财报季
730

Статья
#BitcoinSlipsBelow$84000#BitcoinSlipsBelow$84000
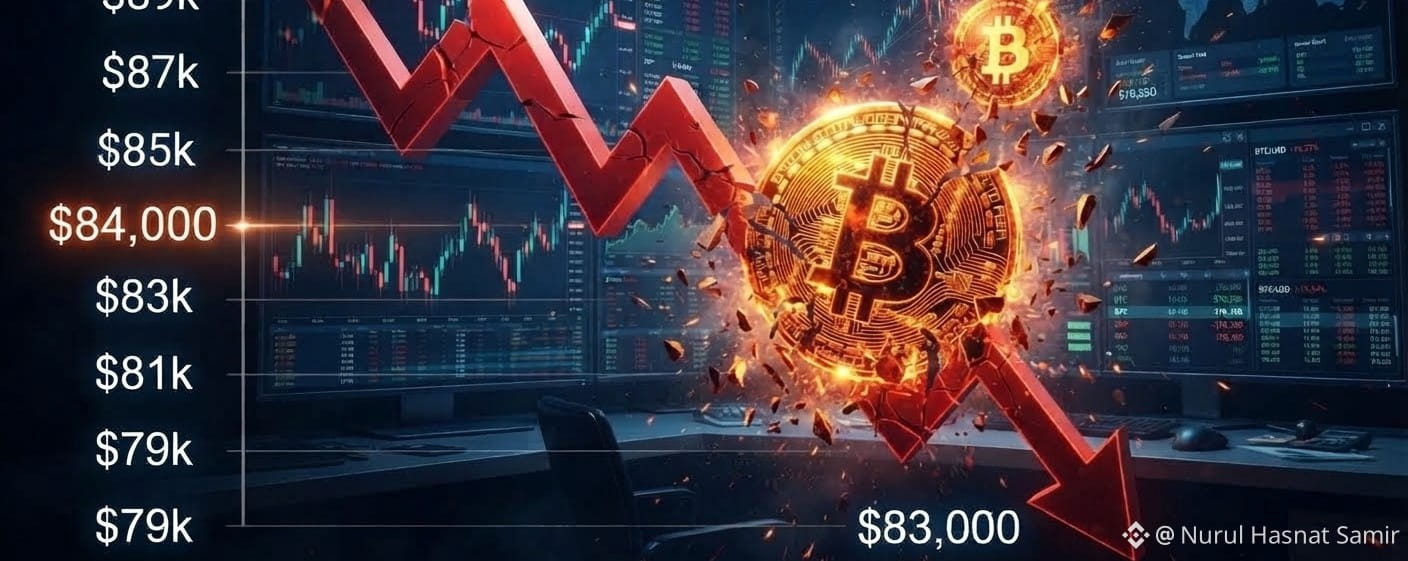
🚨 BREAKING UPDATE: $BTC SLIPS BELOW $84K!
Bitcoin is facing renewed selling pressure, slipping under the key $84,000 threshold and currently trading around the $83,000 zone.
⚡ What's next?
Is this merely a healthy market pullback, or should we prepare for a test of the $82,000 support level? Keep a close eye on the charts! 👀📉
#bitcoin #Crypto #BTC #MarketUpdate #trading
{spot}(BTCUSDT)
#BitcoinSlipsBelow$84000
#BitcoinSlipsBelow$84000
🚨 BREAKING UPDATE: $BTC SLIPS BELOW $84K!
Bitcoin is facing renewed selling pressure, slipping under the key $84,000 threshold and currently trading around the $83,000 zone.
⚡ What's next?
Is this merely a healthy market pullback, or should we prepare for a test of the $82,000 support level? Keep a close eye on the charts! 👀📉
#bitcoin #Crypto #BTC #MarketUpdate #trading
🚨 BREAKING UPDATE: $BTC SLIPS BELOW $84K!
Bitcoin is facing renewed selling pressure, slipping under the key $84,000 threshold and currently trading around the $83,000 zone.
⚡ What's next?
Is this merely a healthy market pullback, or should we prepare for a test of the $82,000 support level? Keep a close eye on the charts! 👀📉
#bitcoin #Crypto #BTC #MarketUpdate #trading
1
58

·
--
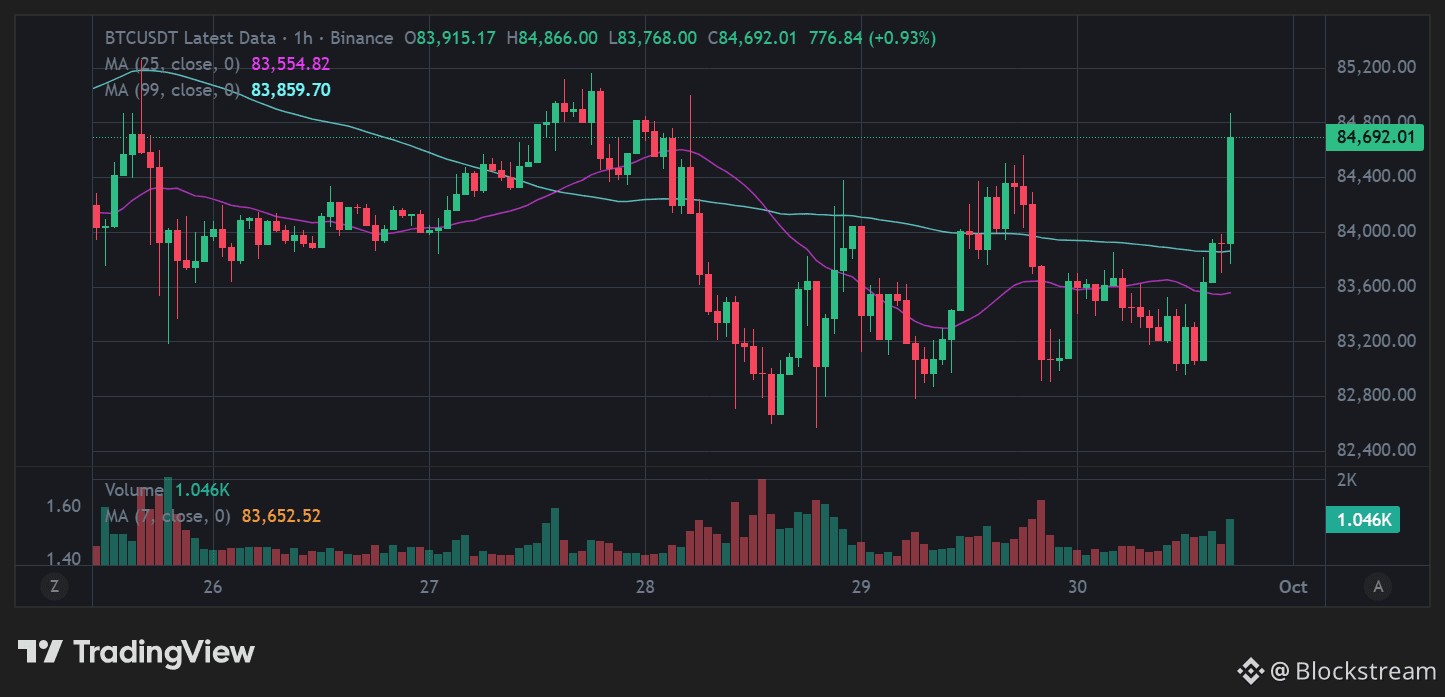
Don't get tricked by this sudden green spike guys. $BTC just reclaimed $84,690 right where short liquidity was sitting, but the trap isn't fully cleared yet.
Everyone was panicking when Bitcoin dumped toward $82,600 yesterday. I warned you that whales were building a massive liquidity sweep to liquidate late shorts before taking control. Now that the weak hands are shaken out, the market is showing a temporary bounce, but don't rush into high-leverage positions right now.
If we don't close the next 4-hour candle firmly above $85,200, the market will rotate back down to test the key $83,800 baseline support. Whales love mid-week fakeouts when retail gets overly confident. Keep your capital protected and don't chase these isolated green candles without confirmation.
Follow Block Stream Analytics if you want to protect your portfolio and profit in this cycle. We track the real institutional liquidity while others trade the noise.
#BTC #BlockStreamAnalytics #BitcoinSlipsBelow$84000
⚡ Trade Execution: Tap $BTC right here to monitor real-time order book liquidity and execute your trades instantly! 📈⚔️
{spot}(BTCUSDT)
Don't get tricked by this sudden green spike guys. $BTC just reclaimed $84,690 right where short liquidity was sitting, but the trap isn't fully cleared yet.
Everyone was panicking when Bitcoin dumped toward $82,600 yesterday. I warned you that whales were building a massive liquidity sweep to liquidate late shorts before taking control. Now that the weak hands are shaken out, the market is showing a temporary bounce, but don't rush into high-leverage positions right now.
If we don't close the next 4-hour candle firmly above $85,200, the market will rotate back down to test the key $83,800 baseline support. Whales love mid-week fakeouts when retail gets overly confident. Keep your capital protected and don't chase these isolated green candles without confirmation.
Follow Block Stream Analytics if you want to protect your portfolio and profit in this cycle. We track the real institutional liquidity while others trade the noise.
#BTC #BlockStreamAnalytics #BitcoinSlipsBelow$84000
⚡ Trade Execution: Tap $BTC right here to monitor real-time order book liquidity and execute your trades instantly! 📈⚔️
Everyone was panicking when Bitcoin dumped toward $82,600 yesterday. I warned you that whales were building a massive liquidity sweep to liquidate late shorts before taking control. Now that the weak hands are shaken out, the market is showing a temporary bounce, but don't rush into high-leverage positions right now.
If we don't close the next 4-hour candle firmly above $85,200, the market will rotate back down to test the key $83,800 baseline support. Whales love mid-week fakeouts when retail gets overly confident. Keep your capital protected and don't chase these isolated green candles without confirmation.
Follow Block Stream Analytics if you want to protect your portfolio and profit in this cycle. We track the real institutional liquidity while others trade the noise.
#BTC #BlockStreamAnalytics #BitcoinSlipsBelow$84000
⚡ Trade Execution: Tap $BTC right here to monitor real-time order book liquidity and execute your trades instantly! 📈⚔️
1
1
110
·
--
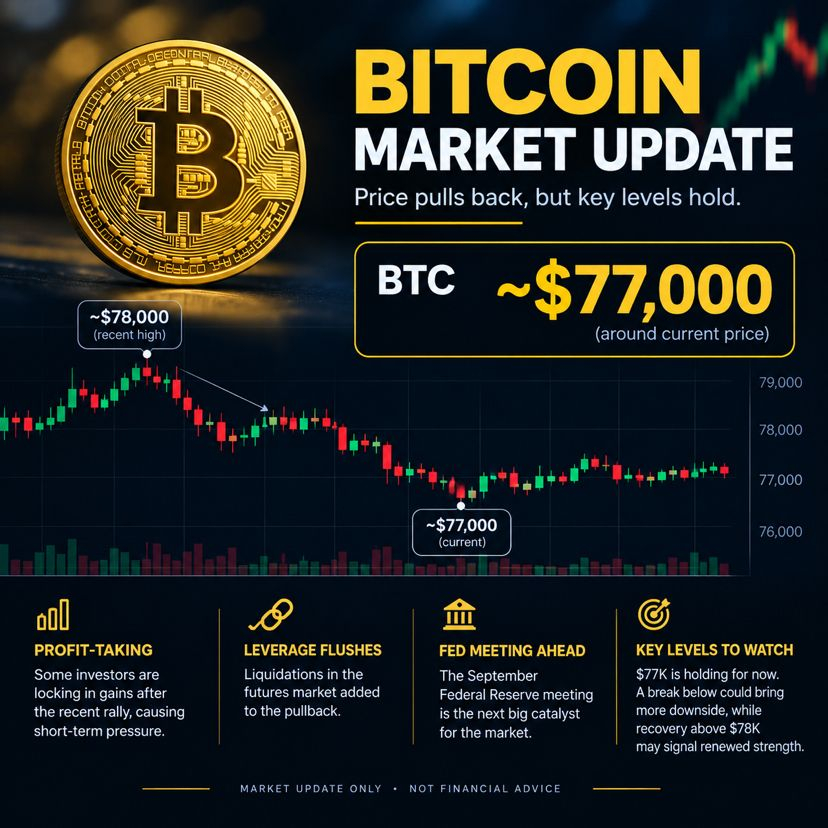
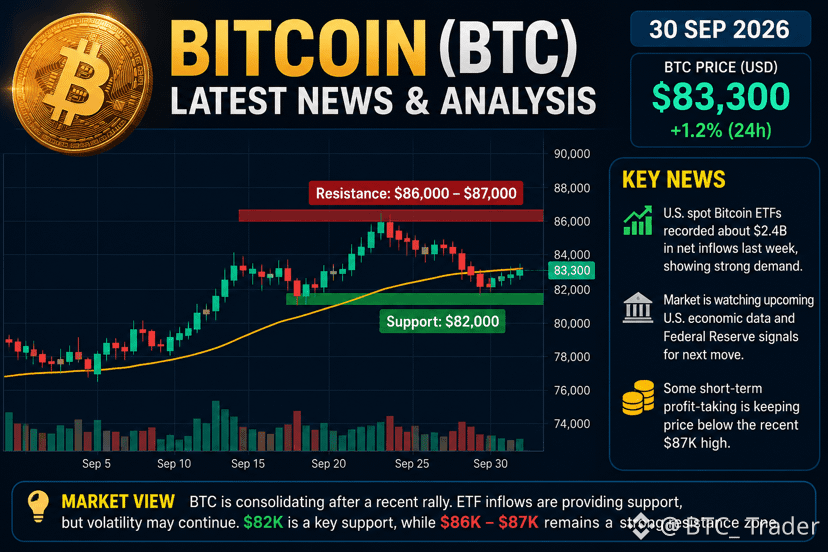
$BTC Bitcoin is trading around $83.3K on September 30, 2026. BTC remains below the recent ~$87.4K high, while U.S. spot Bitcoin ETFs have recorded strong inflows, including about $2.4B last week.
Market view: ETF demand is supporting BTC, but slowing spot demand and profit-taking could keep volatility high. The $82K area is an important near-term support, while ~$86K–$87K remains a key resistance zone. $BTC #BitcoinSlipsBelow$84000 #SECToClarifyOnChainFundraisingRules #UKFCAOpensCryptoFirmAuthorization #JapanMOFStudyGroupOnTokenizedGovtBonds
$BTC Bitcoin is trading around $83.3K on September 30, 2026. BTC remains below the recent ~$87.4K high, while U.S. spot Bitcoin ETFs have recorded strong inflows, including about $2.4B last week.
Market view: ETF demand is supporting BTC, but slowing spot demand and profit-taking could keep volatility high. The $82K area is an important near-term support, while ~$86K–$87K remains a key resistance zone. $BTC #BitcoinSlipsBelow$84000 #SECToClarifyOnChainFundraisingRules #UKFCAOpensCryptoFirmAuthorization #JapanMOFStudyGroupOnTokenizedGovtBonds
Market view: ETF demand is supporting BTC, but slowing spot demand and profit-taking could keep volatility high. The $82K area is an important near-term support, while ~$86K–$87K remains a key resistance zone. $BTC #BitcoinSlipsBelow$84000 #SECToClarifyOnChainFundraisingRules #UKFCAOpensCryptoFirmAuthorization #JapanMOFStudyGroupOnTokenizedGovtBonds
40

·
--
Падение
#BitcoinSlipsBelow$84000
🚨 BITCOIN SLIPS BELOW $84,000! 📉
$BTC is trading around $83.7K, falling below the key $84K level as traders await fresh U.S. inflation data.
⚠️ Bulls losing short-term momentum
📉 $84K now in focus
🎯 ~$82K is a key support zone
🔥 Volatility could increase with upcoming macro data
WHAT’S NEXT FOR BTC? 👀
🟢 $86K+ 🚀
🟡 $84K recovery 📈
🔴 $82K test 📉
💥 Below $80K
👇 VOTE YOUR NEXT $BTC TARGET!
#Bitcoin #BTC #Crypto
#BitcoinSlipsBelow$84000
🚨 BITCOIN SLIPS BELOW $84,000! 📉
$BTC is trading around $83.7K, falling below the key $84K level as traders await fresh U.S. inflation data.
⚠️ Bulls losing short-term momentum
📉 $84K now in focus
🎯 ~$82K is a key support zone
🔥 Volatility could increase with upcoming macro data
WHAT’S NEXT FOR BTC? 👀
🟢 $86K+ 🚀
🟡 $84K recovery 📈
🔴 $82K test 📉
💥 Below $80K
👇 VOTE YOUR NEXT $BTC TARGET!
#Bitcoin #BTC #Crypto
🚨 BITCOIN SLIPS BELOW $84,000! 📉
$BTC is trading around $83.7K, falling below the key $84K level as traders await fresh U.S. inflation data.
⚠️ Bulls losing short-term momentum
📉 $84K now in focus
🎯 ~$82K is a key support zone
🔥 Volatility could increase with upcoming macro data
WHAT’S NEXT FOR BTC? 👀
🟢 $86K+ 🚀
🟡 $84K recovery 📈
🔴 $82K test 📉
💥 Below $80K
👇 VOTE YOUR NEXT $BTC TARGET!
#Bitcoin #BTC #Crypto
27

·
--

Статья
Bitcoin Stays Cautious Ahead of U.S. Inflation Data$BTC is trading near $83,766, showing a small decline of around 0.64%. The market is currently waiting for important U.S. inflation data, which could bring more movement in crypto prices.
$ETH is also under pressure, trading near $2,693 and down around 1.56%.
For now, Bitcoin is moving in a narrow range as traders wait for the upcoming economic data. A stronger-than-expected inflation report could increase market pressure, while softer data may support risk assets.
What do you think — will $BTC move above $84,000 after the inflation data?#BitcoinSlipsBelow$84000 #SECToClarifyOnChainFundraisingRules #UKFCAOpensCryptoFirmAuthorization #JapanMOFStudyGroupOnTokenizedGovtBonds #QNTRises287%
{spot}(ETHUSDT)
{spot}(BTCUSDT)
Bitcoin Stays Cautious Ahead of U.S. Inflation Data
$BTC is trading near $83,766, showing a small decline of around 0.64%. The market is currently waiting for important U.S. inflation data, which could bring more movement in crypto prices.
$ETH is also under pressure, trading near $2,693 and down around 1.56%.
For now, Bitcoin is moving in a narrow range as traders wait for the upcoming economic data. A stronger-than-expected inflation report could increase market pressure, while softer data may support risk assets.
What do you think — will $BTC move above $84,000 after the inflation data?#BitcoinSlipsBelow$84000 #SECToClarifyOnChainFundraisingRules #UKFCAOpensCryptoFirmAuthorization #JapanMOFStudyGroupOnTokenizedGovtBonds #QNTRises287%
$ETH is also under pressure, trading near $2,693 and down around 1.56%.
For now, Bitcoin is moving in a narrow range as traders wait for the upcoming economic data. A stronger-than-expected inflation report could increase market pressure, while softer data may support risk assets.
What do you think — will $BTC move above $84,000 after the inflation data?#BitcoinSlipsBelow$84000 #SECToClarifyOnChainFundraisingRules #UKFCAOpensCryptoFirmAuthorization #JapanMOFStudyGroupOnTokenizedGovtBonds #QNTRises287%
51

·
--
Падение
$BTC Bitcoin Slipped Below $84K Again… It's Basically Doing a Bit at This Point 😂
BTC keeps testing $84K like it's checking if the floor is still there. It is. For now.
🔹 Rejected at $87K resistance, again
🔹 $84K–$85K has flipped into the market's favorite ping-pong table
🔹 Meanwhile, ETFs pulled in $2.39B+ in inflows the same week, so someone's still buying the dip
{spot}(BTCUSDT)
Bitcoin: "I'm not falling, I'm just gravity-testing."
💬 Buying this dip, or waiting for it to finish its comedy routine? 👇
⚠️ Not financial advice. DYOR.
#Bitcoin #BTC #BitcoinSlipsBelow$84000 #BinanceSquare
$BTC Bitcoin Slipped Below $84K Again… It's Basically Doing a Bit at This Point 😂
BTC keeps testing $84K like it's checking if the floor is still there. It is. For now.
🔹 Rejected at $87K resistance, again
🔹 $84K–$85K has flipped into the market's favorite ping-pong table
🔹 Meanwhile, ETFs pulled in $2.39B+ in inflows the same week, so someone's still buying the dip
Bitcoin: "I'm not falling, I'm just gravity-testing."
💬 Buying this dip, or waiting for it to finish its comedy routine? 👇
⚠️ Not financial advice. DYOR.
#Bitcoin #BTC #BitcoinSlipsBelow$84000 #BinanceSquare
BTC keeps testing $84K like it's checking if the floor is still there. It is. For now.
🔹 Rejected at $87K resistance, again
🔹 $84K–$85K has flipped into the market's favorite ping-pong table
🔹 Meanwhile, ETFs pulled in $2.39B+ in inflows the same week, so someone's still buying the dip
Bitcoin: "I'm not falling, I'm just gravity-testing."
💬 Buying this dip, or waiting for it to finish its comedy routine? 👇
⚠️ Not financial advice. DYOR.
#Bitcoin #BTC #BitcoinSlipsBelow$84000 #BinanceSquare

61

·
--
22 sep $BTC price was $87000
22 Sep $ETH price was almost $2700
Today BTC price is $84000 and ETH price is $2700+ ??? 😁
What's logic or secret behind?
If anyone knows reply must!
{future}(ETHUSDT)
{future}(BTCUSDT)
22 sep $BTC price was $87000
22 Sep $ETH price was almost $2700
Today BTC price is $84000 and ETH price is $2700+ ??? 😁
What's logic or secret behind?
If anyone knows reply must!
22 Sep $ETH price was almost $2700
Today BTC price is $84000 and ETH price is $2700+ ??? 😁
What's logic or secret behind?
If anyone knows reply must!
75


·
--

Статья
Bitcoin at $83K: Why Rising Yields, Weak Spot Demand and Jobs Report Matter More Than HeadlinesBitcoin is entering the final days of September with a very different market structure than the one that powered its move toward the $126,000 record earlier this year.
On Wednesday, September 30, Bitcoin was trading around $83,700–$83,800, down modestly on the day and still consolidating after its failed breakout toward $87,300 on September 21. At first glance, the market looks relatively calm. But underneath the price, several important forces are moving in opposite directions.
The biggest question is no longer simply whether Treasury yields are rising.
It is why they are rising.
That distinction could determine whether Bitcoin's current consolidation becomes another accumulation phase or develops into a deeper risk-off move.
Rising Yields Are Not Automatically Bearish for Bitcoin
The U.S. 10-year Treasury yield has climbed sharply, recently reaching around 5.23%, its highest level since 2007. The 30-year yield has moved above 5.6%, reaching levels not seen since 2002.
Some analysts now see a potential path toward 6% on the 10-year.
Markus Thielen of 10x Research argues that the driver behind the move matters more than the absolute yield level.
The 2022 experience provides the clearest bearish comparison. That year, the 10-year yield more than doubled to approximately 3.88% while the Federal Reserve aggressively tightened monetary policy, including several 50 and 75 basis-point rate increases. Bitcoin subsequently fell roughly 64%.
But the current environment is not identical.
Since the end of 2023, the 10-year yield has risen by approximately 135 basis points to 5.23%, while Bitcoin has roughly doubled over the same broad period.
That divergence suggests the market is dealing with a different type of yield increase.
Instead of being driven entirely by expectations of aggressive Fed tightening, part of the pressure appears connected to fiscal deficits, government borrowing, inflation uncertainty and a higher term premium.
In simple terms, investors may be demanding more compensation to hold long-duration government debt.
That creates a very different relationship with Bitcoin.
If yields rise because the Fed is rapidly tightening financial conditions, liquidity becomes the problem for Bitcoin.
If yields rise because investors are demanding a higher premium for fiscal and inflation risk, the relationship becomes much less straightforward.
That is why the 6% Treasury scenario cannot automatically be translated into a bearish Bitcoin forecast.
Bitcoin's Bigger Problem Is Happening Inside the Crypto Market
While the bond market is sending a warning, Bitcoin's own demand data is also becoming harder to ignore.
CryptoQuant estimates that Bitcoin's spot demand has declined by approximately 170,000 BTC over the past 30 days.
The deterioration is particularly interesting because Bitcoin still managed to rally from roughly $76,000 to $87,300 during this period.
On September 11, the same spot-demand metric showed a deficit of approximately 145,000 BTC. Since then, the figure has deteriorated by another 25,000 BTC even as price moved higher.
That creates an important distinction:
Bitcoin's price rose, but underlying spot demand did not strengthen alongside it.
A large part of the move appears to have been supported by positioning and forced buying rather than a broad expansion in spot accumulation.
On September 22 alone, crypto markets experienced approximately $844 million in liquidations, with hourly liquidation activity at one point exceeding $300 million before collapsing below $11 million.
Once that forced buying disappeared, Bitcoin struggled to maintain its momentum.
Spot Bitcoin ETFs provide another piece of the puzzle. On September 21, U.S. spot Bitcoin ETFs recorded nearly $1 billion of inflows, their largest single-day inflow since October 2025.
That was significant, but one strong day of ETF demand has not been enough to reverse the broader 30-day deterioration in spot-demand metrics.
This is why Bitcoin's current range deserves attention.
The market is not experiencing a complete breakdown in demand, but neither is it showing the kind of broad spot accumulation that would normally make a breakout above $87,300 easier to sustain.
Altcoins Are Showing a Different Picture
Interestingly, the broader crypto market is not behaving like a market waiting for Bitcoin to collapse.
CoinMarketCap's Altcoin Season Index reached 61/100, remaining above 60 for five consecutive days. That is important because the index measures the breadth of tokens outperforming Bitcoin rather than simply tracking the performance of one asset.
Bitcoin's dominance has also declined from approximately 59.2% earlier in September to around 57% on September 22.
That suggests capital has been rotating toward parts of the altcoin market even while Bitcoin remains stuck near $83,000.
The derivatives market provides additional context.
Crypto liquidations have fallen from roughly $389 million to $196 million, while total open interest declined from nearly $150 billion to around $147 billion. Bitcoin futures open interest fell to approximately 625,000 BTC, the lowest level since January 1.
This is significant because Bitcoin has climbed from around $57,000 to above $80,000 while futures positioning has generally declined.
That can indicate that the rally was less dependent on excessive leverage.
But there is an important caveat.
Falling futures open interest does not automatically mean healthy spot accumulation. The declining 170,000 BTC spot-demand figure shows why both datasets need to be considered together.
The market may have less leverage than before, but it also needs stronger spot demand to support the next sustained leg higher.
Positioning Is Becoming More Bullish, But Not Yet Extremely Crowded
Binance positioning data has also shifted.
Retail long/short positioning increased to approximately 1.42, compared with 1.24 the previous day. Whale positioning rose to around 1.49 from 1.31, while whale positions edged higher to 1.90 from 1.88.
However, these numbers remain below the 2.3+ readings seen earlier in September.
That means positioning has become more bullish, but it has not yet reached the same level of crowding.
The difference between individual tokens is even more interesting.
PUMP recently recorded a sharp move while futures open interest increased alongside price. Historically, when speculative tokens attract fresh leveraged positioning during an already extended move, the setup can become fragile.
HBAR showed almost the opposite structure. The token fell around 16% in 24 hours while futures open interest climbed to new highs and funding turned negative.
That could represent traders hedging existing spot exposure rather than simply opening outright shorts.
The data cannot fully distinguish between those two behaviours, but it shows how uneven the current crypto market has become.
The Next Major Catalyst Is the U.S. Jobs Report
The macro market is now waiting for the September employment report, and the disagreement between forecasts is unusually wide.
Kalshi data has shown nearly 60% probability of more than 90,000 new nonfarm jobs, with roughly 50% odds of a number above 100,000.
Goldman Sachs expects approximately 80,000 jobs with unemployment holding at 4.1%.
Bank of America is considerably more cautious at 60,000, including approximately 50,000 private-sector jobs.
The difference matters because Federal Reserve expectations are already finely balanced.
The Fed raised rates by 25 basis points to 3.75%-4.00% on September 16, its first increase since July 2023. Its September dot plot pointed toward approximately one additional rate move in 2026.
But expectations for another hike in October changed sharply after New York Fed President John Williams pushed back against the urgency of further tightening.
October hike odds fell from around 71% to approximately 50%.
That essentially leaves the market at a crossroads.
A stronger-than-expected employment number could revive expectations for another hike.
A weaker number could reinforce the argument that the Fed does not need to continue tightening.
Unemployment may be even more important than the headline payroll figure because it provides a clearer signal about labour-market slack.
This is why a jobs number around 80,000 could potentially leave the debate unresolved, while a result above 100,000 or closer to 60,000 would create a much clearer signal.
PCE Inflation Adds Another Layer
Before the jobs report, markets are also watching the Personal Consumption Expenditures price index, the Federal Reserve's preferred inflation gauge.
The timing matters because Bitcoin, gold and equities are entering the data release with the bond market already under pressure.
A stronger inflation reading could reinforce concerns about persistent inflation and higher-for-longer rates.
A softer reading could reduce pressure on the Fed and potentially ease the long-duration selloff.
This makes the next few sessions unusually important.
Bitcoin is sitting near $83,000, the 10-year Treasury is near 5.3%, the 30-year is above 5.6%, and October Fed hike expectations are close to a coin flip.
The market does not need a huge surprise for volatility to increase.
It simply needs one data point to resolve the current disagreement.
Gold and Oil Are Sending Their Own Signals
Gold has also weakened sharply.
After reaching much higher levels earlier in the year, gold fell to approximately $4,144 on September 28 before recovering toward the $4,200 area.
Analysts have identified $4,200 as an important level for determining whether the recent decline is simply a pullback or something deeper.
Gold and Bitcoin do not respond identically to interest rates. Over the measured period, gold's 90-day correlation with the 10-year Treasury has been approximately -0.41, compared with around -0.17 for Bitcoin.
That means gold has been more sensitive to Treasury-yield movements.
Their relationship with each other has also weakened. Their correlation fell toward 0.28 from approximately 0.69 over 30 days.
Oil is adding another complication.
Brent recently traded around $96.43, after moving above $103 earlier in September and gaining roughly 14% during the month.
The important question is why oil remains elevated while some Middle Eastern supply flows are returning toward normal levels.
If supply disruptions are easing but crude remains expensive, the market may be pricing demand, positioning or a persistent geopolitical risk premium rather than a simple physical shortage.
That matters for inflation because the oil rally has been one of the factors behind renewed rate-hike expectations.
Micron Could Become an Unexpected Crypto Signal
Another major event arrives outside the crypto market.
Micron Technology reports earnings after the U.S. market close, with consensus expectations around $31.83 earnings per share and $51.49 billion in revenue.
A year earlier, Micron reported approximately $3.03 EPS and $11.31 billion in revenue.
That represents an extraordinary expected increase of approximately 950% in EPS and 355% in revenue.
But the headline numbers may not be what moves the stock.
Micron has already risen approximately 279% year to date and 587% over the past 12 months, meaning expectations are extremely high.
The more important question is the future memory cycle.
DRAM is expected to generate around $38.22 billion, approximately 76% of quarterly revenue, making DRAM pricing and supply discipline particularly important.
If DRAM prices remain firm into the first half of 2027, the AI infrastructure demand story remains supported.
If management signals pricing pressure, the market could start questioning whether the current memory cycle has already peaked.
NAND is another area to watch, with approximately $12.29 billion expected revenue. Unlike DRAM, NAND has greater exposure to consumer electronics, making it a useful indicator of demand from smartphones and PCs.
South Korea's market has already provided a warning.
On September 28, the Kospi fell approximately 2.7%, while Samsung Electronics and SK Hynix both dropped more than 5%.
That does not prove investors expect weak Micron results, but it shows how sensitive the memory complex has become.
The AI Connection Reaches Crypto Through Bitcoin Miners
Micron's results also matter to crypto through the companies that have shifted from Bitcoin mining toward AI infrastructure.
Companies including IREN, Hut 8, HIVE, Core Scientific and TeraWulf have increasingly positioned themselves around AI compute.
During September, the top-10 mining median gained only around 1.8%, compared with approximately 22% for Bitcoin.
That divergence is important.
These companies once offered leveraged exposure to Bitcoin. Their AI pivot has changed the equation.
Now they depend partly on AI infrastructure demand, power economics, data-centre contracts and technology spending.
Strong memory guidance would support the broader AI infrastructure demand narrative.
Weak guidance could pressure the same companies because they carry AI-related capital expenditure and valuation risk without directly benefiting from stronger memory prices.
At the same time, JPMorgan's recent observation that neocloud contract pricing has increased to approximately $15-$20 per megawatt from $10-$15 suggests that demand for compute remains strong.
So the AI trade itself is not necessarily weakening. The question is whether valuations and capital spending can continue expanding at the same pace.
What the Market Is Really Waiting For
The current environment is unusual because several signals are pointing in different directions.
Bitcoin: around $83,700, consolidating after failing to break $87,300.Bitcoin spot demand: approximately 170,000 BTC weaker over 30 days.Bitcoin futures open interest: around 625,000 BTC, the lowest since January 1.Altcoin Season Index: 61/100, above 60 for five consecutive days.Bitcoin dominance: around 57%, down from 59.2% earlier in September.10-year Treasury: around 5.23%, the highest since 2007.30-year Treasury: above 5.6%, the highest since 2002.October Fed hike odds: around 50%, down from roughly 71%.Gold: around the $4,200 recovery area after falling to $4,144.Brent crude: around $96, after exceeding $103 earlier in September.September jobs expectations: roughly 60,000 from Bank of America, 80,000 from Goldman Sachs and above 90,000 according to the Kalshi threshold.
This is why the next move may not be determined by Bitcoin's chart alone.
The market is effectively waiting to find out whether rising yields are primarily a monetary-policy problem or a fiscal/term-premium problem.
At the same time, traders need to see whether Bitcoin can generate genuine spot demand rather than relying on liquidations and positioning.
For now, the most interesting signal is not that Bitcoin is weak.
It is that Bitcoin is holding around $83,000 despite higher long-term yields, weaker measured spot demand and a stronger dollar, while altcoin breadth is quietly improving.
That creates a market with conflicting signals rather than a clean directional trend.
The next major test comes from the combination of PCE inflation, the September jobs report, Treasury yields and Micron's guidance.
If the data keeps the Fed from tightening aggressively while long-term yields remain elevated for fiscal reasons, the 2022 playbook may not fully apply.
But if inflation and employment force the Fed toward faster tightening, the relationship changes quickly.
For Bitcoin, the key question is therefore not simply:
“Can it reach $90,000?”
The more important question is:
“Can Bitcoin attract enough real spot demand to break higher while the cost of capital continues rising?”
That is the data point I would watch most closely as September comes to an end.
$XAU $BTC $ETH
#LearnWithFatima #BitcoinSlipsBelow$84000 #SECToClarifyOnChainFundraisingRules #UKFCAOpensCryptoFirmAuthorization #JapanMOFStudyGroupOnTokenizedGovtBonds
Bitcoin at $83K: Why Rising Yields, Weak Spot Demand and Jobs Report Matter More Than Headlines
Bitcoin is entering the final days of September with a very different market structure than the one that powered its move toward the $126,000 record earlier this year.
On Wednesday, September 30, Bitcoin was trading around $83,700–$83,800, down modestly on the day and still consolidating after its failed breakout toward $87,300 on September 21. At first glance, the market looks relatively calm. But underneath the price, several important forces are moving in opposite directions.
The biggest question is no longer simply whether Treasury yields are rising.
It is why they are rising.
That distinction could determine whether Bitcoin's current consolidation becomes another accumulation phase or develops into a deeper risk-off move.
Rising Yields Are Not Automatically Bearish for Bitcoin
The U.S. 10-year Treasury yield has climbed sharply, recently reaching around 5.23%, its highest level since 2007. The 30-year yield has moved above 5.6%, reaching levels not seen since 2002.
Some analysts now see a potential path toward 6% on the 10-year.
Markus Thielen of 10x Research argues that the driver behind the move matters more than the absolute yield level.
The 2022 experience provides the clearest bearish comparison. That year, the 10-year yield more than doubled to approximately 3.88% while the Federal Reserve aggressively tightened monetary policy, including several 50 and 75 basis-point rate increases. Bitcoin subsequently fell roughly 64%.
But the current environment is not identical.
Since the end of 2023, the 10-year yield has risen by approximately 135 basis points to 5.23%, while Bitcoin has roughly doubled over the same broad period.
That divergence suggests the market is dealing with a different type of yield increase.
Instead of being driven entirely by expectations of aggressive Fed tightening, part of the pressure appears connected to fiscal deficits, government borrowing, inflation uncertainty and a higher term premium.
In simple terms, investors may be demanding more compensation to hold long-duration government debt.
That creates a very different relationship with Bitcoin.
If yields rise because the Fed is rapidly tightening financial conditions, liquidity becomes the problem for Bitcoin.
If yields rise because investors are demanding a higher premium for fiscal and inflation risk, the relationship becomes much less straightforward.
That is why the 6% Treasury scenario cannot automatically be translated into a bearish Bitcoin forecast.
Bitcoin's Bigger Problem Is Happening Inside the Crypto Market
While the bond market is sending a warning, Bitcoin's own demand data is also becoming harder to ignore.
CryptoQuant estimates that Bitcoin's spot demand has declined by approximately 170,000 BTC over the past 30 days.
The deterioration is particularly interesting because Bitcoin still managed to rally from roughly $76,000 to $87,300 during this period.
On September 11, the same spot-demand metric showed a deficit of approximately 145,000 BTC. Since then, the figure has deteriorated by another 25,000 BTC even as price moved higher.
That creates an important distinction:
Bitcoin's price rose, but underlying spot demand did not strengthen alongside it.
A large part of the move appears to have been supported by positioning and forced buying rather than a broad expansion in spot accumulation.
On September 22 alone, crypto markets experienced approximately $844 million in liquidations, with hourly liquidation activity at one point exceeding $300 million before collapsing below $11 million.
Once that forced buying disappeared, Bitcoin struggled to maintain its momentum.
Spot Bitcoin ETFs provide another piece of the puzzle. On September 21, U.S. spot Bitcoin ETFs recorded nearly $1 billion of inflows, their largest single-day inflow since October 2025.
That was significant, but one strong day of ETF demand has not been enough to reverse the broader 30-day deterioration in spot-demand metrics.
This is why Bitcoin's current range deserves attention.
The market is not experiencing a complete breakdown in demand, but neither is it showing the kind of broad spot accumulation that would normally make a breakout above $87,300 easier to sustain.
Altcoins Are Showing a Different Picture
Interestingly, the broader crypto market is not behaving like a market waiting for Bitcoin to collapse.
CoinMarketCap's Altcoin Season Index reached 61/100, remaining above 60 for five consecutive days. That is important because the index measures the breadth of tokens outperforming Bitcoin rather than simply tracking the performance of one asset.
Bitcoin's dominance has also declined from approximately 59.2% earlier in September to around 57% on September 22.
That suggests capital has been rotating toward parts of the altcoin market even while Bitcoin remains stuck near $83,000.
The derivatives market provides additional context.
Crypto liquidations have fallen from roughly $389 million to $196 million, while total open interest declined from nearly $150 billion to around $147 billion. Bitcoin futures open interest fell to approximately 625,000 BTC, the lowest level since January 1.
This is significant because Bitcoin has climbed from around $57,000 to above $80,000 while futures positioning has generally declined.
That can indicate that the rally was less dependent on excessive leverage.
But there is an important caveat.
Falling futures open interest does not automatically mean healthy spot accumulation. The declining 170,000 BTC spot-demand figure shows why both datasets need to be considered together.
The market may have less leverage than before, but it also needs stronger spot demand to support the next sustained leg higher.
Positioning Is Becoming More Bullish, But Not Yet Extremely Crowded
Binance positioning data has also shifted.
Retail long/short positioning increased to approximately 1.42, compared with 1.24 the previous day. Whale positioning rose to around 1.49 from 1.31, while whale positions edged higher to 1.90 from 1.88.
However, these numbers remain below the 2.3+ readings seen earlier in September.
That means positioning has become more bullish, but it has not yet reached the same level of crowding.
The difference between individual tokens is even more interesting.
PUMP recently recorded a sharp move while futures open interest increased alongside price. Historically, when speculative tokens attract fresh leveraged positioning during an already extended move, the setup can become fragile.
HBAR showed almost the opposite structure. The token fell around 16% in 24 hours while futures open interest climbed to new highs and funding turned negative.
That could represent traders hedging existing spot exposure rather than simply opening outright shorts.
The data cannot fully distinguish between those two behaviours, but it shows how uneven the current crypto market has become.
The Next Major Catalyst Is the U.S. Jobs Report
The macro market is now waiting for the September employment report, and the disagreement between forecasts is unusually wide.
Kalshi data has shown nearly 60% probability of more than 90,000 new nonfarm jobs, with roughly 50% odds of a number above 100,000.
Goldman Sachs expects approximately 80,000 jobs with unemployment holding at 4.1%.
Bank of America is considerably more cautious at 60,000, including approximately 50,000 private-sector jobs.
The difference matters because Federal Reserve expectations are already finely balanced.
The Fed raised rates by 25 basis points to 3.75%-4.00% on September 16, its first increase since July 2023. Its September dot plot pointed toward approximately one additional rate move in 2026.
But expectations for another hike in October changed sharply after New York Fed President John Williams pushed back against the urgency of further tightening.
October hike odds fell from around 71% to approximately 50%.
That essentially leaves the market at a crossroads.
A stronger-than-expected employment number could revive expectations for another hike.
A weaker number could reinforce the argument that the Fed does not need to continue tightening.
Unemployment may be even more important than the headline payroll figure because it provides a clearer signal about labour-market slack.
This is why a jobs number around 80,000 could potentially leave the debate unresolved, while a result above 100,000 or closer to 60,000 would create a much clearer signal.
PCE Inflation Adds Another Layer
Before the jobs report, markets are also watching the Personal Consumption Expenditures price index, the Federal Reserve's preferred inflation gauge.
The timing matters because Bitcoin, gold and equities are entering the data release with the bond market already under pressure.
A stronger inflation reading could reinforce concerns about persistent inflation and higher-for-longer rates.
A softer reading could reduce pressure on the Fed and potentially ease the long-duration selloff.
This makes the next few sessions unusually important.
Bitcoin is sitting near $83,000, the 10-year Treasury is near 5.3%, the 30-year is above 5.6%, and October Fed hike expectations are close to a coin flip.
The market does not need a huge surprise for volatility to increase.
It simply needs one data point to resolve the current disagreement.
Gold and Oil Are Sending Their Own Signals
Gold has also weakened sharply.
After reaching much higher levels earlier in the year, gold fell to approximately $4,144 on September 28 before recovering toward the $4,200 area.
Analysts have identified $4,200 as an important level for determining whether the recent decline is simply a pullback or something deeper.
Gold and Bitcoin do not respond identically to interest rates. Over the measured period, gold's 90-day correlation with the 10-year Treasury has been approximately -0.41, compared with around -0.17 for Bitcoin.
That means gold has been more sensitive to Treasury-yield movements.
Their relationship with each other has also weakened. Their correlation fell toward 0.28 from approximately 0.69 over 30 days.
Oil is adding another complication.
Brent recently traded around $96.43, after moving above $103 earlier in September and gaining roughly 14% during the month.
The important question is why oil remains elevated while some Middle Eastern supply flows are returning toward normal levels.
If supply disruptions are easing but crude remains expensive, the market may be pricing demand, positioning or a persistent geopolitical risk premium rather than a simple physical shortage.
That matters for inflation because the oil rally has been one of the factors behind renewed rate-hike expectations.
Micron Could Become an Unexpected Crypto Signal
Another major event arrives outside the crypto market.
Micron Technology reports earnings after the U.S. market close, with consensus expectations around $31.83 earnings per share and $51.49 billion in revenue.
A year earlier, Micron reported approximately $3.03 EPS and $11.31 billion in revenue.
That represents an extraordinary expected increase of approximately 950% in EPS and 355% in revenue.
But the headline numbers may not be what moves the stock.
Micron has already risen approximately 279% year to date and 587% over the past 12 months, meaning expectations are extremely high.
The more important question is the future memory cycle.
DRAM is expected to generate around $38.22 billion, approximately 76% of quarterly revenue, making DRAM pricing and supply discipline particularly important.
If DRAM prices remain firm into the first half of 2027, the AI infrastructure demand story remains supported.
If management signals pricing pressure, the market could start questioning whether the current memory cycle has already peaked.
NAND is another area to watch, with approximately $12.29 billion expected revenue. Unlike DRAM, NAND has greater exposure to consumer electronics, making it a useful indicator of demand from smartphones and PCs.
South Korea's market has already provided a warning.
On September 28, the Kospi fell approximately 2.7%, while Samsung Electronics and SK Hynix both dropped more than 5%.
That does not prove investors expect weak Micron results, but it shows how sensitive the memory complex has become.
The AI Connection Reaches Crypto Through Bitcoin Miners
Micron's results also matter to crypto through the companies that have shifted from Bitcoin mining toward AI infrastructure.
Companies including IREN, Hut 8, HIVE, Core Scientific and TeraWulf have increasingly positioned themselves around AI compute.
During September, the top-10 mining median gained only around 1.8%, compared with approximately 22% for Bitcoin.
That divergence is important.
These companies once offered leveraged exposure to Bitcoin. Their AI pivot has changed the equation.
Now they depend partly on AI infrastructure demand, power economics, data-centre contracts and technology spending.
Strong memory guidance would support the broader AI infrastructure demand narrative.
Weak guidance could pressure the same companies because they carry AI-related capital expenditure and valuation risk without directly benefiting from stronger memory prices.
At the same time, JPMorgan's recent observation that neocloud contract pricing has increased to approximately $15-$20 per megawatt from $10-$15 suggests that demand for compute remains strong.
So the AI trade itself is not necessarily weakening. The question is whether valuations and capital spending can continue expanding at the same pace.
What the Market Is Really Waiting For
The current environment is unusual because several signals are pointing in different directions.
Bitcoin: around $83,700, consolidating after failing to break $87,300.Bitcoin spot demand: approximately 170,000 BTC weaker over 30 days.Bitcoin futures open interest: around 625,000 BTC, the lowest since January 1.Altcoin Season Index: 61/100, above 60 for five consecutive days.Bitcoin dominance: around 57%, down from 59.2% earlier in September.10-year Treasury: around 5.23%, the highest since 2007.30-year Treasury: above 5.6%, the highest since 2002.October Fed hike odds: around 50%, down from roughly 71%.Gold: around the $4,200 recovery area after falling to $4,144.Brent crude: around $96, after exceeding $103 earlier in September.September jobs expectations: roughly 60,000 from Bank of America, 80,000 from Goldman Sachs and above 90,000 according to the Kalshi threshold.
This is why the next move may not be determined by Bitcoin's chart alone.
The market is effectively waiting to find out whether rising yields are primarily a monetary-policy problem or a fiscal/term-premium problem.
At the same time, traders need to see whether Bitcoin can generate genuine spot demand rather than relying on liquidations and positioning.
For now, the most interesting signal is not that Bitcoin is weak.
It is that Bitcoin is holding around $83,000 despite higher long-term yields, weaker measured spot demand and a stronger dollar, while altcoin breadth is quietly improving.
That creates a market with conflicting signals rather than a clean directional trend.
The next major test comes from the combination of PCE inflation, the September jobs report, Treasury yields and Micron's guidance.
If the data keeps the Fed from tightening aggressively while long-term yields remain elevated for fiscal reasons, the 2022 playbook may not fully apply.
But if inflation and employment force the Fed toward faster tightening, the relationship changes quickly.
For Bitcoin, the key question is therefore not simply:
“Can it reach $90,000?”
The more important question is:
“Can Bitcoin attract enough real spot demand to break higher while the cost of capital continues rising?”
That is the data point I would watch most closely as September comes to an end.
$XAU $BTC $ETH
#LearnWithFatima #BitcoinSlipsBelow$84000 #SECToClarifyOnChainFundraisingRules #UKFCAOpensCryptoFirmAuthorization #JapanMOFStudyGroupOnTokenizedGovtBonds
On Wednesday, September 30, Bitcoin was trading around $83,700–$83,800, down modestly on the day and still consolidating after its failed breakout toward $87,300 on September 21. At first glance, the market looks relatively calm. But underneath the price, several important forces are moving in opposite directions.
The biggest question is no longer simply whether Treasury yields are rising.
It is why they are rising.
That distinction could determine whether Bitcoin's current consolidation becomes another accumulation phase or develops into a deeper risk-off move.
Rising Yields Are Not Automatically Bearish for Bitcoin
The U.S. 10-year Treasury yield has climbed sharply, recently reaching around 5.23%, its highest level since 2007. The 30-year yield has moved above 5.6%, reaching levels not seen since 2002.
Some analysts now see a potential path toward 6% on the 10-year.
Markus Thielen of 10x Research argues that the driver behind the move matters more than the absolute yield level.
The 2022 experience provides the clearest bearish comparison. That year, the 10-year yield more than doubled to approximately 3.88% while the Federal Reserve aggressively tightened monetary policy, including several 50 and 75 basis-point rate increases. Bitcoin subsequently fell roughly 64%.
But the current environment is not identical.
Since the end of 2023, the 10-year yield has risen by approximately 135 basis points to 5.23%, while Bitcoin has roughly doubled over the same broad period.
That divergence suggests the market is dealing with a different type of yield increase.
Instead of being driven entirely by expectations of aggressive Fed tightening, part of the pressure appears connected to fiscal deficits, government borrowing, inflation uncertainty and a higher term premium.
In simple terms, investors may be demanding more compensation to hold long-duration government debt.
That creates a very different relationship with Bitcoin.
If yields rise because the Fed is rapidly tightening financial conditions, liquidity becomes the problem for Bitcoin.
If yields rise because investors are demanding a higher premium for fiscal and inflation risk, the relationship becomes much less straightforward.
That is why the 6% Treasury scenario cannot automatically be translated into a bearish Bitcoin forecast.
Bitcoin's Bigger Problem Is Happening Inside the Crypto Market
While the bond market is sending a warning, Bitcoin's own demand data is also becoming harder to ignore.
CryptoQuant estimates that Bitcoin's spot demand has declined by approximately 170,000 BTC over the past 30 days.
The deterioration is particularly interesting because Bitcoin still managed to rally from roughly $76,000 to $87,300 during this period.
On September 11, the same spot-demand metric showed a deficit of approximately 145,000 BTC. Since then, the figure has deteriorated by another 25,000 BTC even as price moved higher.
That creates an important distinction:
Bitcoin's price rose, but underlying spot demand did not strengthen alongside it.
A large part of the move appears to have been supported by positioning and forced buying rather than a broad expansion in spot accumulation.
On September 22 alone, crypto markets experienced approximately $844 million in liquidations, with hourly liquidation activity at one point exceeding $300 million before collapsing below $11 million.
Once that forced buying disappeared, Bitcoin struggled to maintain its momentum.
Spot Bitcoin ETFs provide another piece of the puzzle. On September 21, U.S. spot Bitcoin ETFs recorded nearly $1 billion of inflows, their largest single-day inflow since October 2025.
That was significant, but one strong day of ETF demand has not been enough to reverse the broader 30-day deterioration in spot-demand metrics.
This is why Bitcoin's current range deserves attention.
The market is not experiencing a complete breakdown in demand, but neither is it showing the kind of broad spot accumulation that would normally make a breakout above $87,300 easier to sustain.
Altcoins Are Showing a Different Picture
Interestingly, the broader crypto market is not behaving like a market waiting for Bitcoin to collapse.
CoinMarketCap's Altcoin Season Index reached 61/100, remaining above 60 for five consecutive days. That is important because the index measures the breadth of tokens outperforming Bitcoin rather than simply tracking the performance of one asset.
Bitcoin's dominance has also declined from approximately 59.2% earlier in September to around 57% on September 22.
That suggests capital has been rotating toward parts of the altcoin market even while Bitcoin remains stuck near $83,000.
The derivatives market provides additional context.
Crypto liquidations have fallen from roughly $389 million to $196 million, while total open interest declined from nearly $150 billion to around $147 billion. Bitcoin futures open interest fell to approximately 625,000 BTC, the lowest level since January 1.
This is significant because Bitcoin has climbed from around $57,000 to above $80,000 while futures positioning has generally declined.
That can indicate that the rally was less dependent on excessive leverage.
But there is an important caveat.
Falling futures open interest does not automatically mean healthy spot accumulation. The declining 170,000 BTC spot-demand figure shows why both datasets need to be considered together.
The market may have less leverage than before, but it also needs stronger spot demand to support the next sustained leg higher.
Positioning Is Becoming More Bullish, But Not Yet Extremely Crowded
Binance positioning data has also shifted.
Retail long/short positioning increased to approximately 1.42, compared with 1.24 the previous day. Whale positioning rose to around 1.49 from 1.31, while whale positions edged higher to 1.90 from 1.88.
However, these numbers remain below the 2.3+ readings seen earlier in September.
That means positioning has become more bullish, but it has not yet reached the same level of crowding.
The difference between individual tokens is even more interesting.
PUMP recently recorded a sharp move while futures open interest increased alongside price. Historically, when speculative tokens attract fresh leveraged positioning during an already extended move, the setup can become fragile.
HBAR showed almost the opposite structure. The token fell around 16% in 24 hours while futures open interest climbed to new highs and funding turned negative.
That could represent traders hedging existing spot exposure rather than simply opening outright shorts.
The data cannot fully distinguish between those two behaviours, but it shows how uneven the current crypto market has become.
The Next Major Catalyst Is the U.S. Jobs Report
The macro market is now waiting for the September employment report, and the disagreement between forecasts is unusually wide.
Kalshi data has shown nearly 60% probability of more than 90,000 new nonfarm jobs, with roughly 50% odds of a number above 100,000.
Goldman Sachs expects approximately 80,000 jobs with unemployment holding at 4.1%.
Bank of America is considerably more cautious at 60,000, including approximately 50,000 private-sector jobs.
The difference matters because Federal Reserve expectations are already finely balanced.
The Fed raised rates by 25 basis points to 3.75%-4.00% on September 16, its first increase since July 2023. Its September dot plot pointed toward approximately one additional rate move in 2026.
But expectations for another hike in October changed sharply after New York Fed President John Williams pushed back against the urgency of further tightening.
October hike odds fell from around 71% to approximately 50%.
That essentially leaves the market at a crossroads.
A stronger-than-expected employment number could revive expectations for another hike.
A weaker number could reinforce the argument that the Fed does not need to continue tightening.
Unemployment may be even more important than the headline payroll figure because it provides a clearer signal about labour-market slack.
This is why a jobs number around 80,000 could potentially leave the debate unresolved, while a result above 100,000 or closer to 60,000 would create a much clearer signal.
PCE Inflation Adds Another Layer
Before the jobs report, markets are also watching the Personal Consumption Expenditures price index, the Federal Reserve's preferred inflation gauge.
The timing matters because Bitcoin, gold and equities are entering the data release with the bond market already under pressure.
A stronger inflation reading could reinforce concerns about persistent inflation and higher-for-longer rates.
A softer reading could reduce pressure on the Fed and potentially ease the long-duration selloff.
This makes the next few sessions unusually important.
Bitcoin is sitting near $83,000, the 10-year Treasury is near 5.3%, the 30-year is above 5.6%, and October Fed hike expectations are close to a coin flip.
The market does not need a huge surprise for volatility to increase.
It simply needs one data point to resolve the current disagreement.
Gold and Oil Are Sending Their Own Signals
Gold has also weakened sharply.
After reaching much higher levels earlier in the year, gold fell to approximately $4,144 on September 28 before recovering toward the $4,200 area.
Analysts have identified $4,200 as an important level for determining whether the recent decline is simply a pullback or something deeper.
Gold and Bitcoin do not respond identically to interest rates. Over the measured period, gold's 90-day correlation with the 10-year Treasury has been approximately -0.41, compared with around -0.17 for Bitcoin.
That means gold has been more sensitive to Treasury-yield movements.
Their relationship with each other has also weakened. Their correlation fell toward 0.28 from approximately 0.69 over 30 days.
Oil is adding another complication.
Brent recently traded around $96.43, after moving above $103 earlier in September and gaining roughly 14% during the month.
The important question is why oil remains elevated while some Middle Eastern supply flows are returning toward normal levels.
If supply disruptions are easing but crude remains expensive, the market may be pricing demand, positioning or a persistent geopolitical risk premium rather than a simple physical shortage.
That matters for inflation because the oil rally has been one of the factors behind renewed rate-hike expectations.
Micron Could Become an Unexpected Crypto Signal
Another major event arrives outside the crypto market.
Micron Technology reports earnings after the U.S. market close, with consensus expectations around $31.83 earnings per share and $51.49 billion in revenue.
A year earlier, Micron reported approximately $3.03 EPS and $11.31 billion in revenue.
That represents an extraordinary expected increase of approximately 950% in EPS and 355% in revenue.
But the headline numbers may not be what moves the stock.
Micron has already risen approximately 279% year to date and 587% over the past 12 months, meaning expectations are extremely high.
The more important question is the future memory cycle.
DRAM is expected to generate around $38.22 billion, approximately 76% of quarterly revenue, making DRAM pricing and supply discipline particularly important.
If DRAM prices remain firm into the first half of 2027, the AI infrastructure demand story remains supported.
If management signals pricing pressure, the market could start questioning whether the current memory cycle has already peaked.
NAND is another area to watch, with approximately $12.29 billion expected revenue. Unlike DRAM, NAND has greater exposure to consumer electronics, making it a useful indicator of demand from smartphones and PCs.
South Korea's market has already provided a warning.
On September 28, the Kospi fell approximately 2.7%, while Samsung Electronics and SK Hynix both dropped more than 5%.
That does not prove investors expect weak Micron results, but it shows how sensitive the memory complex has become.
The AI Connection Reaches Crypto Through Bitcoin Miners
Micron's results also matter to crypto through the companies that have shifted from Bitcoin mining toward AI infrastructure.
Companies including IREN, Hut 8, HIVE, Core Scientific and TeraWulf have increasingly positioned themselves around AI compute.
During September, the top-10 mining median gained only around 1.8%, compared with approximately 22% for Bitcoin.
That divergence is important.
These companies once offered leveraged exposure to Bitcoin. Their AI pivot has changed the equation.
Now they depend partly on AI infrastructure demand, power economics, data-centre contracts and technology spending.
Strong memory guidance would support the broader AI infrastructure demand narrative.
Weak guidance could pressure the same companies because they carry AI-related capital expenditure and valuation risk without directly benefiting from stronger memory prices.
At the same time, JPMorgan's recent observation that neocloud contract pricing has increased to approximately $15-$20 per megawatt from $10-$15 suggests that demand for compute remains strong.
So the AI trade itself is not necessarily weakening. The question is whether valuations and capital spending can continue expanding at the same pace.
What the Market Is Really Waiting For
The current environment is unusual because several signals are pointing in different directions.
Bitcoin: around $83,700, consolidating after failing to break $87,300.Bitcoin spot demand: approximately 170,000 BTC weaker over 30 days.Bitcoin futures open interest: around 625,000 BTC, the lowest since January 1.Altcoin Season Index: 61/100, above 60 for five consecutive days.Bitcoin dominance: around 57%, down from 59.2% earlier in September.10-year Treasury: around 5.23%, the highest since 2007.30-year Treasury: above 5.6%, the highest since 2002.October Fed hike odds: around 50%, down from roughly 71%.Gold: around the $4,200 recovery area after falling to $4,144.Brent crude: around $96, after exceeding $103 earlier in September.September jobs expectations: roughly 60,000 from Bank of America, 80,000 from Goldman Sachs and above 90,000 according to the Kalshi threshold.
This is why the next move may not be determined by Bitcoin's chart alone.
The market is effectively waiting to find out whether rising yields are primarily a monetary-policy problem or a fiscal/term-premium problem.
At the same time, traders need to see whether Bitcoin can generate genuine spot demand rather than relying on liquidations and positioning.
For now, the most interesting signal is not that Bitcoin is weak.
It is that Bitcoin is holding around $83,000 despite higher long-term yields, weaker measured spot demand and a stronger dollar, while altcoin breadth is quietly improving.
That creates a market with conflicting signals rather than a clean directional trend.
The next major test comes from the combination of PCE inflation, the September jobs report, Treasury yields and Micron's guidance.
If the data keeps the Fed from tightening aggressively while long-term yields remain elevated for fiscal reasons, the 2022 playbook may not fully apply.
But if inflation and employment force the Fed toward faster tightening, the relationship changes quickly.
For Bitcoin, the key question is therefore not simply:
“Can it reach $90,000?”
The more important question is:
“Can Bitcoin attract enough real spot demand to break higher while the cost of capital continues rising?”
That is the data point I would watch most closely as September comes to an end.
$XAU $BTC $ETH
#LearnWithFatima #BitcoinSlipsBelow$84000 #SECToClarifyOnChainFundraisingRules #UKFCAOpensCryptoFirmAuthorization #JapanMOFStudyGroupOnTokenizedGovtBonds
2
412

·
--
Рост
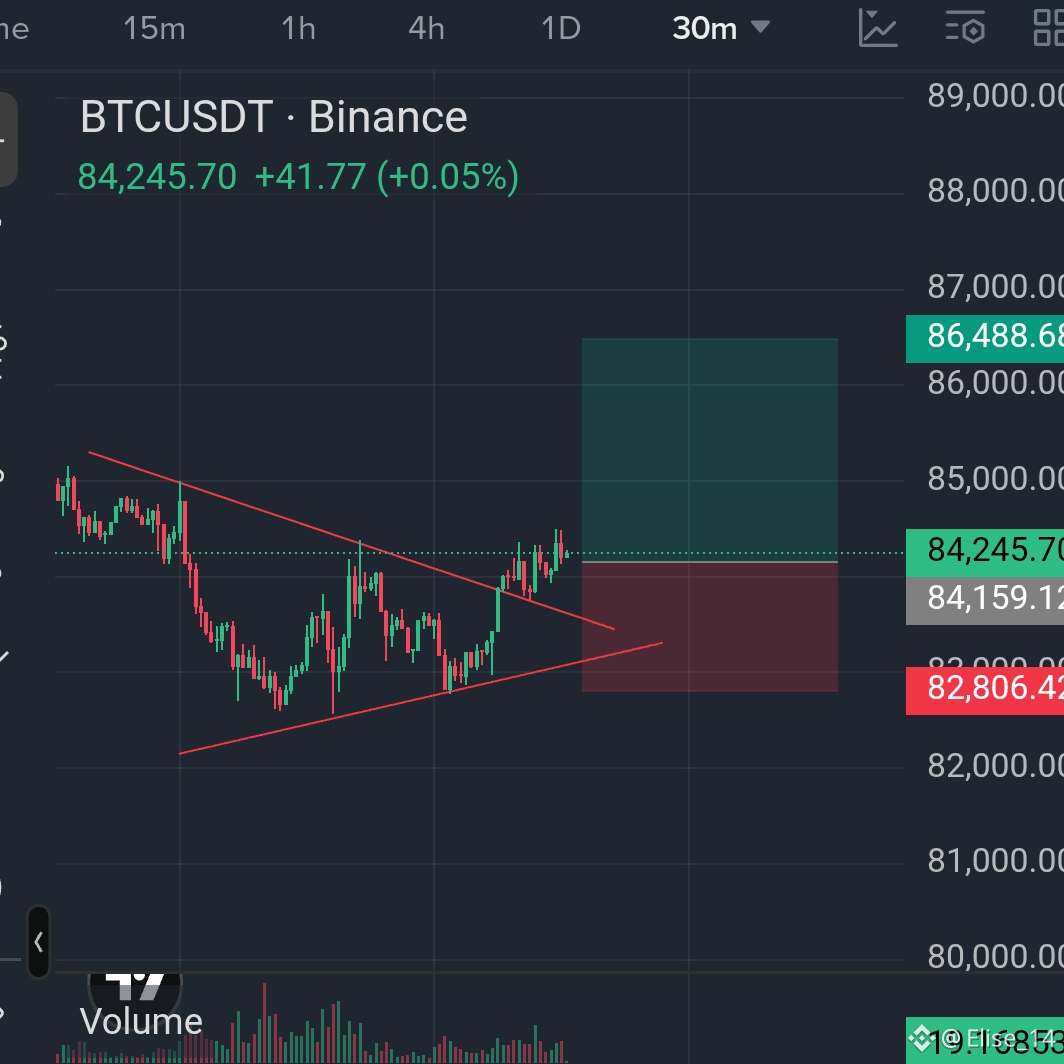
$BTC
{future}(BTCUSDT)
long
leverage : 30x
entry : 84000 - 84200
target
84500
85000
86100
stop loss : 82800
$BTC
long
leverage : 30x
entry : 84000 - 84200
target
84500
85000
86100
stop loss : 82800
long
leverage : 30x
entry : 84000 - 84200
target
84500
85000
86100
stop loss : 82800
72

·
--
Рост
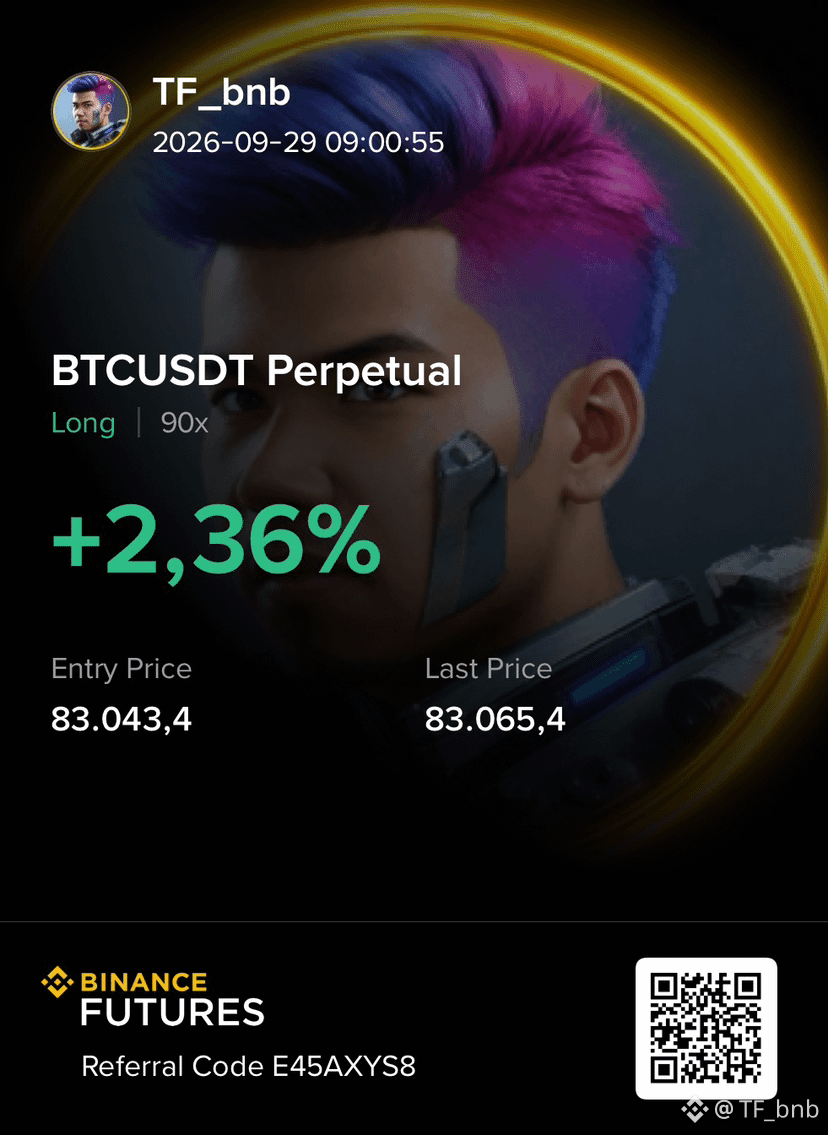
$BTC dumped from $85,100 to $82,500 today liquidating $400M in just a few hours!!! Now time to pump strong with max volume.
Big long $BTC setup again, print money later.
Stoploss : 82000
Take profit : 84000 - 85000 - 86000
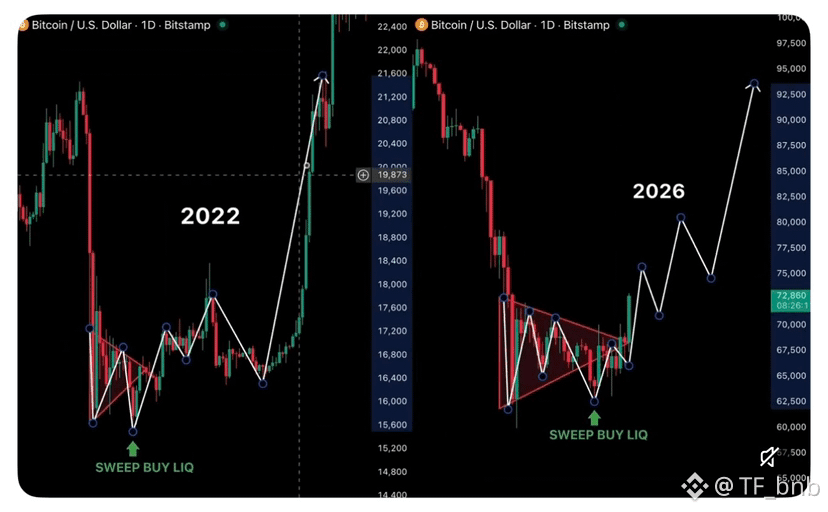
Bitcoin is repeating the same range structure as 2022.
A huge Pump is coming for $BTC 🚀
{future}(BTCUSDT)
$BTC dumped from $85,100 to $82,500 today liquidating $400M in just a few hours!!! Now time to pump strong with max volume.
Big long $BTC setup again, print money later.
Stoploss : 82000
Take profit : 84000 - 85000 - 86000
Bitcoin is repeating the same range structure as 2022.
A huge Pump is coming for $BTC 🚀
Big long $BTC setup again, print money later.
Stoploss : 82000
Take profit : 84000 - 85000 - 86000
Bitcoin is repeating the same range structure as 2022.
A huge Pump is coming for $BTC 🚀
Lisa Bitcoin:
trust you legend open big long
1
1
10
2.1k

·
--
$BTC 9.29 晚间分析
比特币冲高至84000一线后未能站稳,随即承压回落,短线抛压释放后虽走出反弹修复,但上行力度明显衰减,价格再度触及前高附近却迟迟无法形成有效突破,晚间转入横盘震荡格局。整体来看,高位追涨动能不足,反弹更像是对下跌的修正而非趋势反转,上方84000附近已初步显现阻力压制,若多头始终无法放量突破,后市大概率维持震荡偏空节奏,需警惕二次下探风险。
晚间建议:84000-83500做空,目标看
82500
$BTC 9.29 晚间分析
比特币冲高至84000一线后未能站稳,随即承压回落,短线抛压释放后虽走出反弹修复,但上行力度明显衰减,价格再度触及前高附近却迟迟无法形成有效突破,晚间转入横盘震荡格局。整体来看,高位追涨动能不足,反弹更像是对下跌的修正而非趋势反转,上方84000附近已初步显现阻力压制,若多头始终无法放量突破,后市大概率维持震荡偏空节奏,需警惕二次下探风险。
晚间建议:84000-83500做空,目标看
82500
比特币冲高至84000一线后未能站稳,随即承压回落,短线抛压释放后虽走出反弹修复,但上行力度明显衰减,价格再度触及前高附近却迟迟无法形成有效突破,晚间转入横盘震荡格局。整体来看,高位追涨动能不足,反弹更像是对下跌的修正而非趋势反转,上方84000附近已初步显现阻力压制,若多头始终无法放量突破,后市大概率维持震荡偏空节奏,需警惕二次下探风险。
晚间建议:84000-83500做空,目标看
82500
32

·
--

Статья
26年9月29日 BTC日报(包含行情推演)1. 近处短期阻力:84000附近(24h高点84622),也就是81700-80200供应墙,属于短期小关卡;
2. 核心中期强阻力:89500~90000(MA99周线),是前期下跌起点,堆积大量历史套牢筹码,是本轮反弹最大的坎;
3. 终极长期阻力:126199历史高点,套牢盘最重。
• 近端防线:76,000-76,500
• 关键防线:74,000-75,200
• 下方支撑:70,000;62,000-65,000(今年新增筹码密集区)
• 上方第一阻力:84000附近(短期供应)
• 上方中期强阻力:89500-90000(周线MA99,重大套牢区)
• 历史终极阻力:126199
更新情景推演
1. 乐观情景:放量站稳84000,且成交量持续放大,才有资格去试探89500这道周线级别的强阻力;但是,即便摸到89500,巨大历史套牢盘会带来极强抛压,一次性直接突破难度极高,大概率遇阻回落。
2. 中性情景:80000–84000区间来回震荡洗杠杆,反复冲击84000但无法持续放量,多头力量慢慢消耗,在区间内来回波动。
3. 悲观情景:冲击84000失败,多头动能衰竭,转头向下,依次测试76000近端防线;若76000失守,继续下探74000-75200关键防线。多重利空共振才会到70000;极端黑天鹅才会到62000-65000,跌到5万概率极低。
三个核心问题(更新后)
1. 是否还会下跌:当前靠近短期阻力区(84000),叠加上方89500巨大套牢盘,短期存在冲高回落、阶段性回调的概率。
2. 是否会跌到65000或5万:跌到65000属于深度回调,需要多重宏观利空共振,当前概率偏低;跌到5万属于极端黑天鹅行情,目前看概率极低。
3. 当前是否熊市,能否回到次高点(约82300):当前属于熊市反弹后的高位震荡,不是标准牛市;82300已经被突破,但再往上84000、89500两层阻力重重,就算继续上行,越靠近89500,回调风险会指数级上升。
26年9月29日 BTC日报(包含行情推演)
1. 近处短期阻力:84000附近(24h高点84622),也就是81700-80200供应墙,属于短期小关卡;
2. 核心中期强阻力:89500~90000(MA99周线),是前期下跌起点,堆积大量历史套牢筹码,是本轮反弹最大的坎;
3. 终极长期阻力:126199历史高点,套牢盘最重。
• 近端防线:76,000-76,500
• 关键防线:74,000-75,200
• 下方支撑:70,000;62,000-65,000(今年新增筹码密集区)
• 上方第一阻力:84000附近(短期供应)
• 上方中期强阻力:89500-90000(周线MA99,重大套牢区)
• 历史终极阻力:126199
更新情景推演
1. 乐观情景:放量站稳84000,且成交量持续放大,才有资格去试探89500这道周线级别的强阻力;但是,即便摸到89500,巨大历史套牢盘会带来极强抛压,一次性直接突破难度极高,大概率遇阻回落。
2. 中性情景:80000–84000区间来回震荡洗杠杆,反复冲击84000但无法持续放量,多头力量慢慢消耗,在区间内来回波动。
3. 悲观情景:冲击84000失败,多头动能衰竭,转头向下,依次测试76000近端防线;若76000失守,继续下探74000-75200关键防线。多重利空共振才会到70000;极端黑天鹅才会到62000-65000,跌到5万概率极低。
三个核心问题(更新后)
1. 是否还会下跌:当前靠近短期阻力区(84000),叠加上方89500巨大套牢盘,短期存在冲高回落、阶段性回调的概率。
2. 是否会跌到65000或5万:跌到65000属于深度回调,需要多重宏观利空共振,当前概率偏低;跌到5万属于极端黑天鹅行情,目前看概率极低。
3. 当前是否熊市,能否回到次高点(约82300):当前属于熊市反弹后的高位震荡,不是标准牛市;82300已经被突破,但再往上84000、89500两层阻力重重,就算继续上行,越靠近89500,回调风险会指数级上升。
2. 核心中期强阻力:89500~90000(MA99周线),是前期下跌起点,堆积大量历史套牢筹码,是本轮反弹最大的坎;
3. 终极长期阻力:126199历史高点,套牢盘最重。
• 近端防线:76,000-76,500
• 关键防线:74,000-75,200
• 下方支撑:70,000;62,000-65,000(今年新增筹码密集区)
• 上方第一阻力:84000附近(短期供应)
• 上方中期强阻力:89500-90000(周线MA99,重大套牢区)
• 历史终极阻力:126199
更新情景推演
1. 乐观情景:放量站稳84000,且成交量持续放大,才有资格去试探89500这道周线级别的强阻力;但是,即便摸到89500,巨大历史套牢盘会带来极强抛压,一次性直接突破难度极高,大概率遇阻回落。
2. 中性情景:80000–84000区间来回震荡洗杠杆,反复冲击84000但无法持续放量,多头力量慢慢消耗,在区间内来回波动。
3. 悲观情景:冲击84000失败,多头动能衰竭,转头向下,依次测试76000近端防线;若76000失守,继续下探74000-75200关键防线。多重利空共振才会到70000;极端黑天鹅才会到62000-65000,跌到5万概率极低。
三个核心问题(更新后)
1. 是否还会下跌:当前靠近短期阻力区(84000),叠加上方89500巨大套牢盘,短期存在冲高回落、阶段性回调的概率。
2. 是否会跌到65000或5万:跌到65000属于深度回调,需要多重宏观利空共振,当前概率偏低;跌到5万属于极端黑天鹅行情,目前看概率极低。
3. 当前是否熊市,能否回到次高点(约82300):当前属于熊市反弹后的高位震荡,不是标准牛市;82300已经被突破,但再往上84000、89500两层阻力重重,就算继续上行,越靠近89500,回调风险会指数级上升。
213

·
--
Рост
$BTC BULLISH TRADE SETUP
CMP 83300
KEEP BUYING UPTO 82500
TARGETS
84000
85500
87000
88000
89000
TIME FRAME SHORT TERM TRADE TARGET 🎯
{future}(BTCUSDT)
#BTCUSDT
$BTC BULLISH TRADE SETUP
CMP 83300
KEEP BUYING UPTO 82500
TARGETS
84000
85500
87000
88000
89000
TIME FRAME SHORT TERM TRADE TARGET 🎯
#BTCUSDT
CMP 83300
KEEP BUYING UPTO 82500
TARGETS
84000
85500
87000
88000
89000
TIME FRAME SHORT TERM TRADE TARGET 🎯
#BTCUSDT
2
1
1
126

🚨 BREAKING: $BTC SLIPS BELOW $84K!
Bitcoin is losing the $84,000 level as selling pressure returns, with BTC trading around the $83K area.
⚡ Is this just a pullback — or is $82K the next level to watch? 👀 #BitcoinSlipsBelow$84000
🚨 BREAKING: $BTC SLIPS BELOW $84K!
Bitcoin is losing the $84,000 level as selling pressure returns, with BTC trading around the $83K area.
⚡ Is this just a pullback — or is $82K the next level to watch? 👀 #BitcoinSlipsBelow$84000
Bitcoin is losing the $84,000 level as selling pressure returns, with BTC trading around the $83K area.
⚡ Is this just a pullback — or is $82K the next level to watch? 👀 #BitcoinSlipsBelow$84000
8


·
--
SELL BTC NOW!
SL 84000
TP 80000
Close the Buy trades I gave!
Let's go✌
SELL BTC NOW!
SL 84000
TP 80000
Close the Buy trades I gave!
Let's go✌
SL 84000
TP 80000
Close the Buy trades I gave!
Let's go✌
Nouman_9347:
SL 🙄😁
1
2
458


·
--
Падение
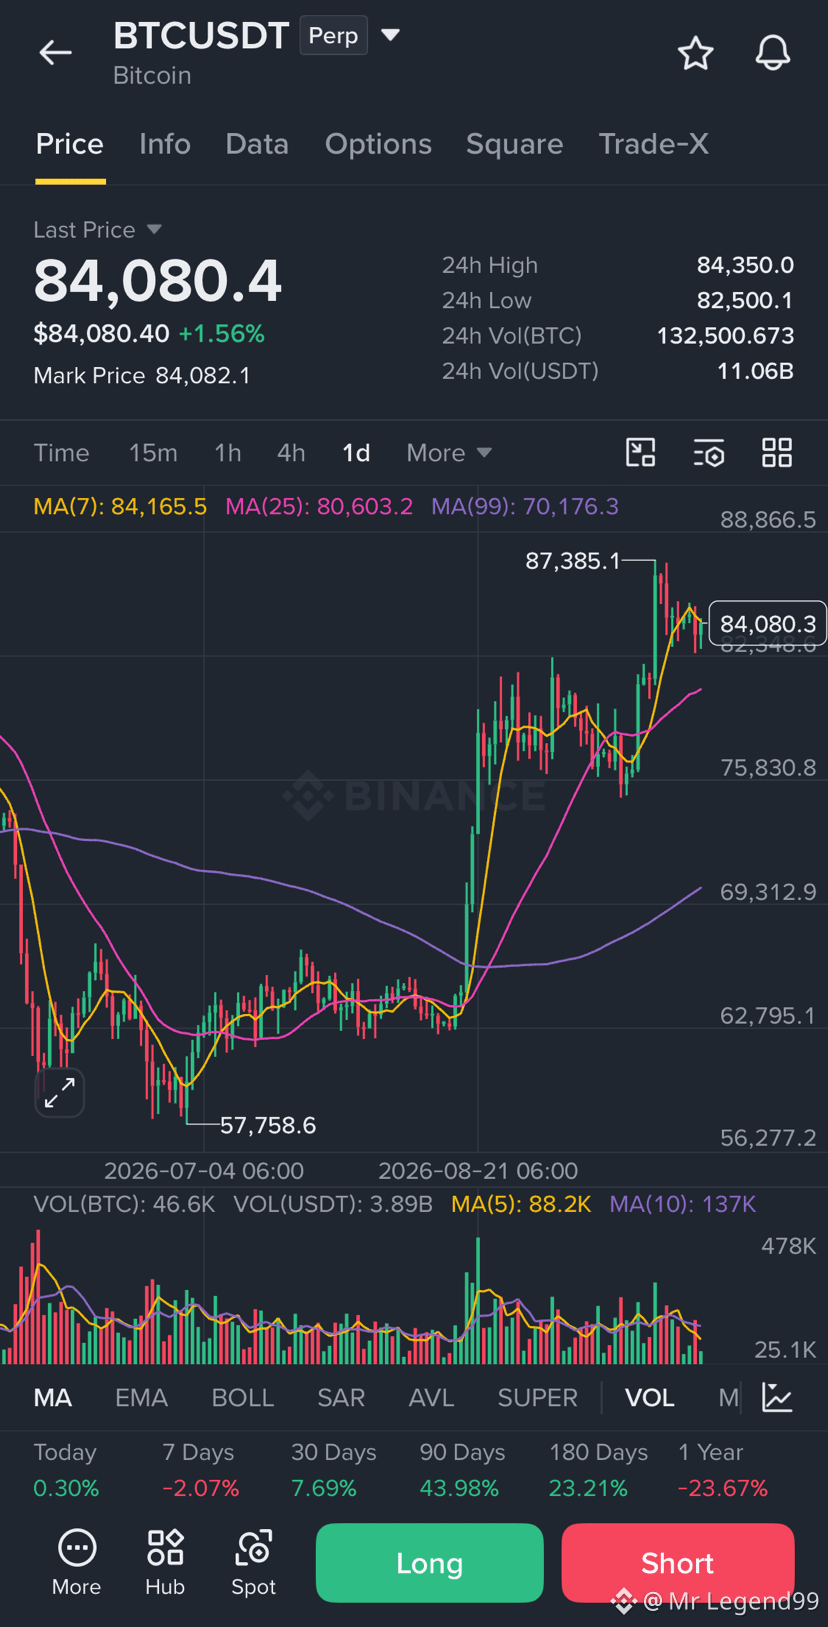
entry 84000-85200
sl 85500
tp 83000-81800
Short $BTC 👇
{future}(BTCUSDT)
entry 84000-85200
sl 85500
tp 83000-81800
Short $BTC 👇
sl 85500
tp 83000-81800
Short $BTC 👇
8

Войдите, чтобы посмотреть больше материала
Присоединяйтесь к пользователям криптовалют по всему миру на Binance Square
⚡️ Получайте новейшую и полезную информацию о криптоактивах.
💬 Нам доверяет крупнейшая в мире криптобиржа.
👍 Получите достоверные аналитические данные от верифицированных создателей контента.
Эл. почта/номер телефона
В тренде
1
#BinanceKZ
Просмотров: 16,471
69 обсуждают
2
#AltcoinSeasonIndexHoldsAbove60For5Days
Просмотров: 0
34 обсуждают
3
#BitcoinSlipsBelow$84000
Просмотров: 408
44 обсуждают
4
#KospiPostsWorstQuarterSince2020
Просмотров: 0
21 обсуждают
5
#SECToClarifyOnChainFundraisingRules
Просмотров: 3,754
189 обсуждают
6
#UKFCAOpensCryptoFirmAuthorization
Просмотров: 6,636
208 обсуждают
7
#JapanMOFStudyGroupOnTokenizedGovtBonds
Просмотров: 6,139
205 обсуждают
8
#QNTRises287%
Просмотров: 37,894
546 обсуждают
9
#TrumpRejectsAIRulesForVoluntaryAudits
Просмотров: 26,631
575 обсуждают
10
#BitgetHotWalletBreachTiedToThirdPartySecurityFlaw
Просмотров: 15,402
378 обсуждают