
#marketdata
marketdata
115,905 ຄັ້ງທີ່ເບິ່ງ
766 ກຳລັງສົນທະນາ
ມາແຮງ
ຫຼ້າສຸດ

☀️ WPO DAILY MARKET — Mon 09 Nov 08:30 (GMT+4)
Total mcap: $2.50T (-1.57% 24h)
BTC dom: 60.2% | ETH: 10.5%
Fear & Greed: 29 Fear 🟥▫️▫️▫️▫️
🟠 $BTC $74,876 -1.27% | $ETH $2,140 -4.24%
Breadth: 🟢 44 (28%) 🔴 111 (70%) avg +0.43% (158 assets)
🚀 Top gainers (liquid 24h)
🟢 $JCT +225.8% $0.008380
🟢 RITUAL +41.4% $0.0433
🟢 HOT +26.4% $0.0004515
🟢 AIOT +23.3% $0.1530
🟢 RSR +14.1% $0.001764
📉 Top losers
🔴 STONK -29.5% $0.0502
🔴 CASHCAT -13.9% $0.0731
🔴 RAIN -12.3% $0.004939
🔴 HUMA -11.2% $0.0107
🔴 AKE -10.7% $0.004702
🧩 Zones (24h, mcap-weighted)
🟢 BNB CHAIN +1.68%
🔴 SOLANA -2.90%
🔴 DEFI -2.25%
🔴 LAYER 1 -1.70%
WPO Read: Selling is broad rather than isolated. Stabilization needs fewer declining assets and firmer BTC/ETH participation before risk improves.
Sources: CoinMarketCap, Alternative.me
#wpo_report #CryptoMarket #MarketData
☀️ WPO DAILY MARKET — Mon 09 Nov 08:30 (GMT+4)
Total mcap: $2.50T (-1.57% 24h)
BTC dom: 60.2% | ETH: 10.5%
Fear & Greed: 29 Fear 🟥▫️▫️▫️▫️
🟠 $BTC $74,876 -1.27% | $ETH $2,140 -4.24%
Breadth: 🟢 44 (28%) 🔴 111 (70%) avg +0.43% (158 assets)
🚀 Top gainers (liquid 24h)
🟢 $JCT +225.8% $0.008380
🟢 RITUAL +41.4% $0.0433
🟢 HOT +26.4% $0.0004515
🟢 AIOT +23.3% $0.1530
🟢 RSR +14.1% $0.001764
📉 Top losers
🔴 STONK -29.5% $0.0502
🔴 CASHCAT -13.9% $0.0731
🔴 RAIN -12.3% $0.004939
🔴 HUMA -11.2% $0.0107
🔴 AKE -10.7% $0.004702
🧩 Zones (24h, mcap-weighted)
🟢 BNB CHAIN +1.68%
🔴 SOLANA -2.90%
🔴 DEFI -2.25%
🔴 LAYER 1 -1.70%
WPO Read: Selling is broad rather than isolated. Stabilization needs fewer declining assets and firmer BTC/ETH participation before risk improves.
Sources: CoinMarketCap, Alternative.me
#wpo_report #CryptoMarket #MarketData
Total mcap: $2.50T (-1.57% 24h)
BTC dom: 60.2% | ETH: 10.5%
Fear & Greed: 29 Fear 🟥▫️▫️▫️▫️
🟠 $BTC $74,876 -1.27% | $ETH $2,140 -4.24%
Breadth: 🟢 44 (28%) 🔴 111 (70%) avg +0.43% (158 assets)
🚀 Top gainers (liquid 24h)
🟢 $JCT +225.8% $0.008380
🟢 RITUAL +41.4% $0.0433
🟢 HOT +26.4% $0.0004515
🟢 AIOT +23.3% $0.1530
🟢 RSR +14.1% $0.001764
📉 Top losers
🔴 STONK -29.5% $0.0502
🔴 CASHCAT -13.9% $0.0731
🔴 RAIN -12.3% $0.004939
🔴 HUMA -11.2% $0.0107
🔴 AKE -10.7% $0.004702
🧩 Zones (24h, mcap-weighted)
🟢 BNB CHAIN +1.68%
🔴 SOLANA -2.90%
🔴 DEFI -2.25%
🔴 LAYER 1 -1.70%
WPO Read: Selling is broad rather than isolated. Stabilization needs fewer declining assets and firmer BTC/ETH participation before risk improves.
Sources: CoinMarketCap, Alternative.me
#wpo_report #CryptoMarket #MarketData
1
408

·
--
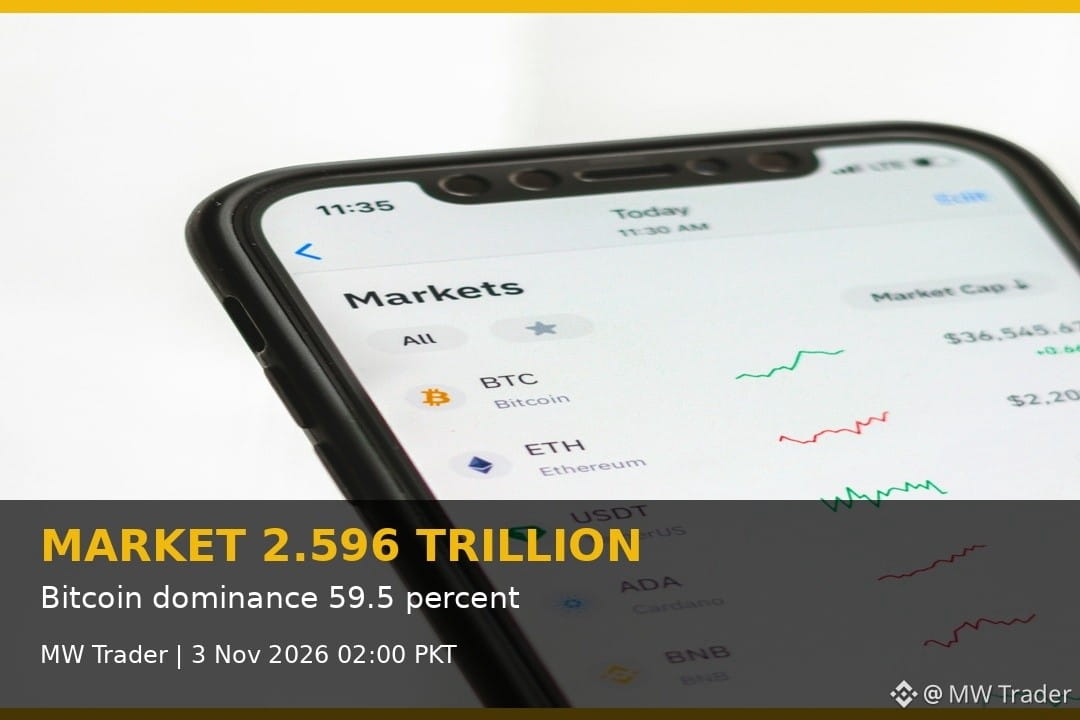
The whole market is worth 2.596 trillion dollars at 02:00 PKT, and almost every major coin is red. 📊
CoinGecko data checked at 02:00 PKT on 3 November puts total market capitalisation at 2.596 trillion dollars, with Bitcoin dominance near 59.5 percent and Ethereum near 10.6 percent. Bitcoin trades near 76,924 dollars, down 1.4 percent in 24 hours, Ethereum near 2,249 dollars, down 0.6 percent, Solana down 2.9 percent, and Tron is the rare green major, up 1.7 percent. Fear sits at 37 on Alternative.me, still in Fear, unchanged. 😨 My reading is that a falling market with dominance near 59.5 percent is still a Bitcoin led slide, so altcoin longs are fighting both Bitcoin and sentiment at the same time.
Is Tron holding green a real rotation, or just one coin refusing to fall tonight? 🤔
Follow for more trades.
#Crypto #Bitcoin #FuturesTrading #TradingSignals #MarketData
The whole market is worth 2.596 trillion dollars at 02:00 PKT, and almost every major coin is red. 📊
CoinGecko data checked at 02:00 PKT on 3 November puts total market capitalisation at 2.596 trillion dollars, with Bitcoin dominance near 59.5 percent and Ethereum near 10.6 percent. Bitcoin trades near 76,924 dollars, down 1.4 percent in 24 hours, Ethereum near 2,249 dollars, down 0.6 percent, Solana down 2.9 percent, and Tron is the rare green major, up 1.7 percent. Fear sits at 37 on Alternative.me, still in Fear, unchanged. 😨 My reading is that a falling market with dominance near 59.5 percent is still a Bitcoin led slide, so altcoin longs are fighting both Bitcoin and sentiment at the same time.
Is Tron holding green a real rotation, or just one coin refusing to fall tonight? 🤔
Follow for more trades.
#Crypto #Bitcoin #FuturesTrading #TradingSignals #MarketData
CoinGecko data checked at 02:00 PKT on 3 November puts total market capitalisation at 2.596 trillion dollars, with Bitcoin dominance near 59.5 percent and Ethereum near 10.6 percent. Bitcoin trades near 76,924 dollars, down 1.4 percent in 24 hours, Ethereum near 2,249 dollars, down 0.6 percent, Solana down 2.9 percent, and Tron is the rare green major, up 1.7 percent. Fear sits at 37 on Alternative.me, still in Fear, unchanged. 😨 My reading is that a falling market with dominance near 59.5 percent is still a Bitcoin led slide, so altcoin longs are fighting both Bitcoin and sentiment at the same time.
Is Tron holding green a real rotation, or just one coin refusing to fall tonight? 🤔
Follow for more trades.
#Crypto #Bitcoin #FuturesTrading #TradingSignals #MarketData
2

ARB’s four-week slide is real—but the “new low” headline needs a venue check.
The Defiant published a report at 16:50 UTC saying ARB touched a four-week low. Binance Spot 1-minute closes at 16:50 UTC, compared with 28 days earlier, show ARB down 26.6% ($0.2267 to $0.1663), versus ETH down 14.0% and BTC down 4.7%. But Binance daily candles show the 28-day low was $0.1621 on Oct. 8; Oct. 24’s low was $0.1635, so the “new four-week low” wording is not confirmed on this venue. ARB was $0.1653 at 17:10:03 UTC. This is a timestamped comparison, not a forecast; prices and windows can differ by source. What market data do you use to track ARB?
Source: [The Defiant](https://thedefiant.io/news/markets/arb-touches-four-week-low-as-losses-outpace-bitcoin-and-ether)
Conclusion: $ARB. Binance Spot snapshot as of 17:10:03 UTC; this is not a trade signal. Official Binance ARB/USDT chart: https://www.binance.com/en/trade/ARB_USDT?type=spot. Check the chart for yourself, do your own research, and trade responsibly.
#Arbitrum #ARB #CryptoMarkets #MarketData
ARB’s four-week slide is real—but the “new low” headline needs a venue check.
The Defiant published a report at 16:50 UTC saying ARB touched a four-week low. Binance Spot 1-minute closes at 16:50 UTC, compared with 28 days earlier, show ARB down 26.6% ($0.2267 to $0.1663), versus ETH down 14.0% and BTC down 4.7%. But Binance daily candles show the 28-day low was $0.1621 on Oct. 8; Oct. 24’s low was $0.1635, so the “new four-week low” wording is not confirmed on this venue. ARB was $0.1653 at 17:10:03 UTC. This is a timestamped comparison, not a forecast; prices and windows can differ by source. What market data do you use to track ARB?
Source: [The Defiant](https://thedefiant.io/news/markets/arb-touches-four-week-low-as-losses-outpace-bitcoin-and-ether)
Conclusion: $ARB . Binance Spot snapshot as of 17:10:03 UTC; this is not a trade signal. Official Binance ARB/USDT chart: https://www.binance.com/en/trade/ARB_USDT?type=spot. Check the chart for yourself, do your own research, and trade responsibly.
#Arbitrum #ARB #CryptoMarkets #MarketData
The Defiant published a report at 16:50 UTC saying ARB touched a four-week low. Binance Spot 1-minute closes at 16:50 UTC, compared with 28 days earlier, show ARB down 26.6% ($0.2267 to $0.1663), versus ETH down 14.0% and BTC down 4.7%. But Binance daily candles show the 28-day low was $0.1621 on Oct. 8; Oct. 24’s low was $0.1635, so the “new four-week low” wording is not confirmed on this venue. ARB was $0.1653 at 17:10:03 UTC. This is a timestamped comparison, not a forecast; prices and windows can differ by source. What market data do you use to track ARB?
Source: [The Defiant](https://thedefiant.io/news/markets/arb-touches-four-week-low-as-losses-outpace-bitcoin-and-ether)
Conclusion: $ARB . Binance Spot snapshot as of 17:10:03 UTC; this is not a trade signal. Official Binance ARB/USDT chart: https://www.binance.com/en/trade/ARB_USDT?type=spot. Check the chart for yourself, do your own research, and trade responsibly.
#Arbitrum #ARB #CryptoMarkets #MarketData

118

THE MARKET CAN BE GREEN AND RED AT THE SAME TIME—DEPENDING ON THE INDEX.
At 20:00 ICT, CoinMarketCap showed total crypto capitalization at $2.16T, down 0.90% over 24 hours, with $48.81B in volume. CoinGecko simultaneously reported $2.22T, up 1.7%, and $46.2B in volume. Yet both put Bitcoin near $62.7K, so the conflict is in the aggregate, not the core price.
Market lesson: “total market cap” is a provider-defined index shaped by listing coverage, supply inputs, stablecoin treatment, and update timing. Compare like with like before reading a market signal. When two reputable dashboards disagree on direction, use the divergence as a prompt to inspect methodology—not as proof that one side must be wrong. #MarketData $BTC
THE MARKET CAN BE GREEN AND RED AT THE SAME TIME—DEPENDING ON THE INDEX.
At 20:00 ICT, CoinMarketCap showed total crypto capitalization at $2.16T, down 0.90% over 24 hours, with $48.81B in volume. CoinGecko simultaneously reported $2.22T, up 1.7%, and $46.2B in volume. Yet both put Bitcoin near $62.7K, so the conflict is in the aggregate, not the core price.
Market lesson: “total market cap” is a provider-defined index shaped by listing coverage, supply inputs, stablecoin treatment, and update timing. Compare like with like before reading a market signal. When two reputable dashboards disagree on direction, use the divergence as a prompt to inspect methodology—not as proof that one side must be wrong. #MarketData $BTC
At 20:00 ICT, CoinMarketCap showed total crypto capitalization at $2.16T, down 0.90% over 24 hours, with $48.81B in volume. CoinGecko simultaneously reported $2.22T, up 1.7%, and $46.2B in volume. Yet both put Bitcoin near $62.7K, so the conflict is in the aggregate, not the core price.
Market lesson: “total market cap” is a provider-defined index shaped by listing coverage, supply inputs, stablecoin treatment, and update timing. Compare like with like before reading a market signal. When two reputable dashboards disagree on direction, use the divergence as a prompt to inspect methodology—not as proof that one side must be wrong. #MarketData $BTC
76


·
--
ສັນຍານກະທິງ
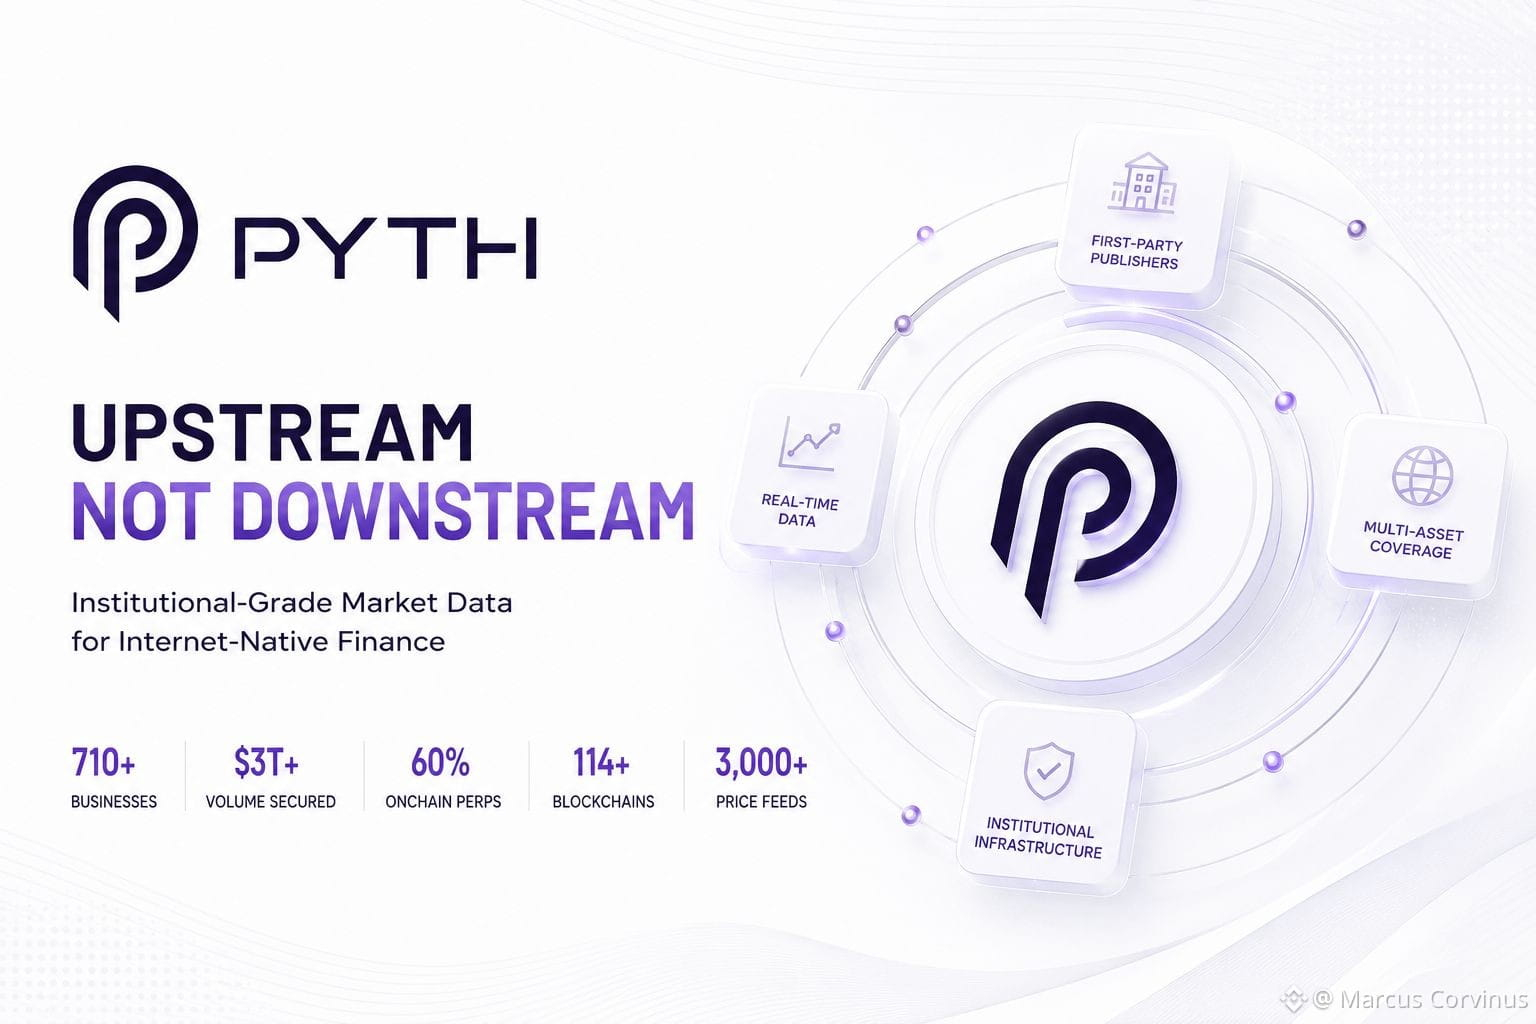
$PYTH is redefining how market data moves across internet-native finance.
While most data providers operate downstream, Pyth goes upstream sourcing prices directly from the institutions and market participants that create them.
Today, Pyth powers:
• 710+ businesses
• $3T+ cumulative transaction volume secured
• 60% of the onchain perpetuals market
• 114+ blockchains receiving feeds
• 3,000+ price feeds across global markets
• Sub-100ms latency and 99.99% uptime
Through Pyth Pro, institutions and exchanges gain access to multi-asset market data through a single integration, while Pyth Terminal provides a transparent way to explore live feeds, compare benchmarks, and inspect data publishers.
The future of finance needs reliable, verifiable, and machine-readable data. Pyth is building the infrastructure layer to make that possible.
Pyth Network continues strengthening the foundation for next-generation financial markets alongside innovative infrastructure ecosystems such as $LINK and the emerging AI-driven economy powered by $TAO .
B U L L I S H 🥂
#PythNetwork #MarketData #DeFi
$PYTH is redefining how market data moves across internet-native finance.
While most data providers operate downstream, Pyth goes upstream sourcing prices directly from the institutions and market participants that create them.
Today, Pyth powers:
• 710+ businesses
• $3T+ cumulative transaction volume secured
• 60% of the onchain perpetuals market
• 114+ blockchains receiving feeds
• 3,000+ price feeds across global markets
• Sub-100ms latency and 99.99% uptime
Through Pyth Pro, institutions and exchanges gain access to multi-asset market data through a single integration, while Pyth Terminal provides a transparent way to explore live feeds, compare benchmarks, and inspect data publishers.
The future of finance needs reliable, verifiable, and machine-readable data. Pyth is building the infrastructure layer to make that possible.
Pyth Network continues strengthening the foundation for next-generation financial markets alongside innovative infrastructure ecosystems such as $LINK and the emerging AI-driven economy powered by $TAO .
B U L L I S H 🥂
#PythNetwork #MarketData #DeFi
While most data providers operate downstream, Pyth goes upstream sourcing prices directly from the institutions and market participants that create them.
Today, Pyth powers:
• 710+ businesses
• $3T+ cumulative transaction volume secured
• 60% of the onchain perpetuals market
• 114+ blockchains receiving feeds
• 3,000+ price feeds across global markets
• Sub-100ms latency and 99.99% uptime
Through Pyth Pro, institutions and exchanges gain access to multi-asset market data through a single integration, while Pyth Terminal provides a transparent way to explore live feeds, compare benchmarks, and inspect data publishers.
The future of finance needs reliable, verifiable, and machine-readable data. Pyth is building the infrastructure layer to make that possible.
Pyth Network continues strengthening the foundation for next-generation financial markets alongside innovative infrastructure ecosystems such as $LINK and the emerging AI-driven economy powered by $TAO .
B U L L I S H 🥂
#PythNetwork #MarketData #DeFi
112
78
20.4k

ຢືນຢັນແລ້ວ
Most crypto projects talk about adoption.
Pyth has already built it.
710+ businesses trust Pyth for live market data.
$3T+ in cumulative transaction volume secured.
60% of the entire onchain perpetuals market runs on Pyth.
114 blockchains. 138+ first-party publishers. 3,000+ price feeds.
This isn't oracle infra. This is financial infrastructure the same kind. TradFi institutions have relied on for decades, rebuilt for internet-native markets.
Coinbase uses it. BitMEX uses it. Polymarket uses it. @PythNetwork
SGX FX and Euronext FX use it.
Pyth Pro reached a $3M ARR run-rate in Q1 2026.
Target: $10M ARR by year-end.
The market-data layer for the next era of finance isn't being built.
It's already live.
$PYTH #PythNetwork #DeFi #CryptoInfrastructure #MarketData
Most crypto projects talk about adoption.
Pyth has already built it.
710+ businesses trust Pyth for live market data.
$3T+ in cumulative transaction volume secured.
60% of the entire onchain perpetuals market runs on Pyth.
114 blockchains. 138+ first-party publishers. 3,000+ price feeds.
This isn't oracle infra. This is financial infrastructure the same kind. TradFi institutions have relied on for decades, rebuilt for internet-native markets.
Coinbase uses it. BitMEX uses it. Polymarket uses it. @PythNetwork
SGX FX and Euronext FX use it.
Pyth Pro reached a $3M ARR run-rate in Q1 2026.
Target: $10M ARR by year-end.
The market-data layer for the next era of finance isn't being built.
It's already live.
$PYTH #PythNetwork #DeFi #CryptoInfrastructure #MarketData
Pyth has already built it.
710+ businesses trust Pyth for live market data.
$3T+ in cumulative transaction volume secured.
60% of the entire onchain perpetuals market runs on Pyth.
114 blockchains. 138+ first-party publishers. 3,000+ price feeds.
This isn't oracle infra. This is financial infrastructure the same kind. TradFi institutions have relied on for decades, rebuilt for internet-native markets.
Coinbase uses it. BitMEX uses it. Polymarket uses it. @PythNetwork
SGX FX and Euronext FX use it.
Pyth Pro reached a $3M ARR run-rate in Q1 2026.
Target: $10M ARR by year-end.
The market-data layer for the next era of finance isn't being built.
It's already live.
$PYTH #PythNetwork #DeFi #CryptoInfrastructure #MarketData
20
20
10.9k

·
--
My analysis of $PNUT shows Balanced DOM (1.19x) and Accumulating (+) 1H Open Interest. The Whales L/S is 52.5% Long, which is slightly positive. Here are the levels I'm watching: 🔥 Deep Market Intel
✅ Order Book: Balanced DOM (1.19x)
✅ 1H Open Interest: Accumulating (+)
✅ Whales L/S: 52.5% Long
✅ Taker Flow: 0.70x
✅ 🔥 Deep Market Intel
✅ Order Book: Heavy Buy Walls (2.22x)
✅ 1H Open Interest: Declining (-)
✅ Whales L/S: 65.4% Long
✅ Taker Flow: 1.15x
✅
🎯 $PNUT DEEP VALUE 📌
✅ Entry Zone: 0.04383 - 0.04450
✅ 🎯 Target 1: 0.04540
✅ 🎯 Target 2: 0.04630
✅ 🎯 Target 3: 0.04738
✅ 🛑 Invalidation (SL): 0.04275 Keep an eye on the overall market sentiment with $NEAR . #PNUT #MarketData
My analysis of $PNUT shows Balanced DOM (1.19x) and Accumulating (+) 1H Open Interest. The Whales L/S is 52.5% Long, which is slightly positive. Here are the levels I'm watching: 🔥 Deep Market Intel
✅ Order Book: Balanced DOM (1.19x)
✅ 1H Open Interest: Accumulating (+)
✅ Whales L/S: 52.5% Long
✅ Taker Flow: 0.70x
✅ 🔥 Deep Market Intel
✅ Order Book: Heavy Buy Walls (2.22x)
✅ 1H Open Interest: Declining (-)
✅ Whales L/S: 65.4% Long
✅ Taker Flow: 1.15x
✅
🎯 $PNUT DEEP VALUE 📌
✅ Entry Zone: 0.04383 - 0.04450
✅ 🎯 Target 1: 0.04540
✅ 🎯 Target 2: 0.04630
✅ 🎯 Target 3: 0.04738
✅ 🛑 Invalidation (SL): 0.04275 Keep an eye on the overall market sentiment with $NEAR . #PNUT #MarketData
✅ Order Book: Balanced DOM (1.19x)
✅ 1H Open Interest: Accumulating (+)
✅ Whales L/S: 52.5% Long
✅ Taker Flow: 0.70x
✅ 🔥 Deep Market Intel
✅ Order Book: Heavy Buy Walls (2.22x)
✅ 1H Open Interest: Declining (-)
✅ Whales L/S: 65.4% Long
✅ Taker Flow: 1.15x
✅
🎯 $PNUT DEEP VALUE 📌
✅ Entry Zone: 0.04383 - 0.04450
✅ 🎯 Target 1: 0.04540
✅ 🎯 Target 2: 0.04630
✅ 🎯 Target 3: 0.04738
✅ 🛑 Invalidation (SL): 0.04275 Keep an eye on the overall market sentiment with $NEAR . #PNUT #MarketData
2
454

·
--
ສັນຍານກະທິງ
ຢືນຢັນແລ້ວ
Pyth Network is building serious infrastructure for internet-native finance.
$PYTH is the network token tied to governance and Pyth’s broader market-data ecosystem.
Most market data is downstream.
Pyth goes upstream—sourcing prices directly from institutions and market participants creating the data.
The scale stands out.
710+ businesses.
125+ institutional publishers.
114+ blockchains.
$3.25T+ in cumulative volume secured.
$LINK , $ONDO, and $HYPE each connect to parts of the broader financial-infrastructure narrative.
Pyth’s first-party, multi-asset market-data model gives it a distinct lane.
Pyth Pro, Data Marketplace, and Pyth Indices are pushing that infrastructure deeper into internet-native markets.
Not financial advice, just information post
#PYTH #DeFi #RWA #MarketData #Crypto .
Pyth Network is building serious infrastructure for internet-native finance.
$PYTH is the network token tied to governance and Pyth’s broader market-data ecosystem.
Most market data is downstream.
Pyth goes upstream—sourcing prices directly from institutions and market participants creating the data.
The scale stands out.
710+ businesses.
125+ institutional publishers.
114+ blockchains.
$3.25T+ in cumulative volume secured.
$LINK , $ONDO, and $HYPE each connect to parts of the broader financial-infrastructure narrative.
Pyth’s first-party, multi-asset market-data model gives it a distinct lane.
Pyth Pro, Data Marketplace, and Pyth Indices are pushing that infrastructure deeper into internet-native markets.
Not financial advice, just information post
#PYTH #DeFi #RWA #MarketData #Crypto .
$PYTH is the network token tied to governance and Pyth’s broader market-data ecosystem.
Most market data is downstream.
Pyth goes upstream—sourcing prices directly from institutions and market participants creating the data.
The scale stands out.
710+ businesses.
125+ institutional publishers.
114+ blockchains.
$3.25T+ in cumulative volume secured.
$LINK , $ONDO, and $HYPE each connect to parts of the broader financial-infrastructure narrative.
Pyth’s first-party, multi-asset market-data model gives it a distinct lane.
Pyth Pro, Data Marketplace, and Pyth Indices are pushing that infrastructure deeper into internet-native markets.
Not financial advice, just information post
#PYTH #DeFi #RWA #MarketData #Crypto .

68
1
60
21.3k

A new player is emerging in the on-chain market data space with $PYTH , and it's catching attention for all the right reasons 🚀
Entry: 1.20
Target: 1.80
Stop Loss: 0.90
This project is making waves by providing fast and reliable market data to internet-native finance, and its potential impact on the market structure is significant. With a strong focus on bringing institutions and traders together, $PYTH is poised to play a major role in shaping the future of on-chain markets.
Not financial advice. Manage your risk.
#PYTH #MarketData #OnchainFinance
❌
A new player is emerging in the on-chain market data space with $PYTH , and it's catching attention for all the right reasons 🚀
Entry: 1.20
Target: 1.80
Stop Loss: 0.90
This project is making waves by providing fast and reliable market data to internet-native finance, and its potential impact on the market structure is significant. With a strong focus on bringing institutions and traders together, $PYTH is poised to play a major role in shaping the future of on-chain markets.
Not financial advice. Manage your risk.
#PYTH #MarketData #OnchainFinance
❌
Entry: 1.20
Target: 1.80
Stop Loss: 0.90
This project is making waves by providing fast and reliable market data to internet-native finance, and its potential impact on the market structure is significant. With a strong focus on bringing institutions and traders together, $PYTH is poised to play a major role in shaping the future of on-chain markets.
Not financial advice. Manage your risk.
#PYTH #MarketData #OnchainFinance
❌

83

·
--
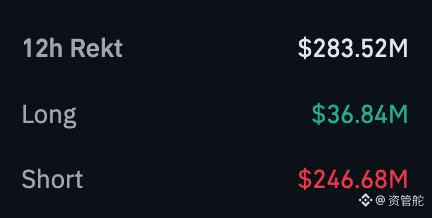
过去 12 小时,清算数据把方向写得很清楚。
- 总爆仓:2.8352 亿美元
- 多头爆仓:3,684 万美元
- 空头爆仓:2.4668 亿美元
空头被爆的规模是多头的 6 倍以上。这意味着过去半天价格出现过一段快速上行,把高杠杆空单硬生生拉爆。这种走势通常不是"基本面反转",而是流动性驱动的轧空:空头止损 → 价格加速 → 更多空头被平。
但爆仓数据是滞后的。它告诉你刚才发生了什么,而不是接下来会发生什么。看到空头大规模出清后,追多和追空同样危险:追多可能接到流动性耗尽后的回调,追空则可能在残余空头继续被爆时受伤。
数据更像是一张"风险地图",不是操作指令。
$BTC #Crypto #Liquidation #MarketData
过去 12 小时,清算数据把方向写得很清楚。
- 总爆仓:2.8352 亿美元
- 多头爆仓:3,684 万美元
- 空头爆仓:2.4668 亿美元
空头被爆的规模是多头的 6 倍以上。这意味着过去半天价格出现过一段快速上行,把高杠杆空单硬生生拉爆。这种走势通常不是"基本面反转",而是流动性驱动的轧空:空头止损 → 价格加速 → 更多空头被平。
但爆仓数据是滞后的。它告诉你刚才发生了什么,而不是接下来会发生什么。看到空头大规模出清后,追多和追空同样危险:追多可能接到流动性耗尽后的回调,追空则可能在残余空头继续被爆时受伤。
数据更像是一张"风险地图",不是操作指令。
$BTC #Crypto #Liquidation #MarketData
- 总爆仓:2.8352 亿美元
- 多头爆仓:3,684 万美元
- 空头爆仓:2.4668 亿美元
空头被爆的规模是多头的 6 倍以上。这意味着过去半天价格出现过一段快速上行,把高杠杆空单硬生生拉爆。这种走势通常不是"基本面反转",而是流动性驱动的轧空:空头止损 → 价格加速 → 更多空头被平。
但爆仓数据是滞后的。它告诉你刚才发生了什么,而不是接下来会发生什么。看到空头大规模出清后,追多和追空同样危险:追多可能接到流动性耗尽后的回调,追空则可能在残余空头继续被爆时受伤。
数据更像是一张"风险地图",不是操作指令。
$BTC #Crypto #Liquidation #MarketData
92
☀️ WPO DAILY MARKET — Mon 05 Oct 20:18 (GMT+4)
Total mcap: $2.90T (-0.23% 24h)
BTC dom: 59.0% | ETH: 11.3%
Fear & Greed: 70 Greed 🟩🟩🟩🟩▫️
🟠 $BTC $85,121 -0.21% | $ETH $2,695 -0.19%
Breadth: 🟢 87 (45%) 🔴 100 (52%) avg +0.44% (194 assets)
🚀 Top gainers (liquid 24h)
🟢 $RLC +53.4% $0.5548
🟢 FLUID +23.7% $2.14
🟢 CARDS +16.9% $0.2863
🟢 NIL +14.2% $0.1027
🟢 AI +11.4% $0.1247
📉 Top losers
🔴 CT -14.5% $0.4109
🔴 SAND -12.3% $0.0679
🔴 STRK -7.75% $0.0523
🔴 SOON -7.39% $0.3359
🔴 USELESS -6.42% $0.2238
🧩 Zones (24h, mcap-weighted)
🟢 AI +1.08%
🟢 MEMES +0.84%
🟢 DEFI +0.38%
🔴 GAMING -1.55%
🔴 INFRASTRUCTURE -1.07%
🔴 SOLANA -0.98%
WPO Read: Leadership is mixed and rotation is selective. Treat isolated movers cautiously until breadth and total market value confirm the direction.
Sources: CoinMarketCap, Alternative.me
#wpo_report #CryptoMarket #MarketData
☀️ WPO DAILY MARKET — Mon 05 Oct 20:18 (GMT+4)
Total mcap: $2.90T (-0.23% 24h)
BTC dom: 59.0% | ETH: 11.3%
Fear & Greed: 70 Greed 🟩🟩🟩🟩▫️
🟠 $BTC $85,121 -0.21% | $ETH $2,695 -0.19%
Breadth: 🟢 87 (45%) 🔴 100 (52%) avg +0.44% (194 assets)
🚀 Top gainers (liquid 24h)
🟢 $RLC +53.4% $0.5548
🟢 FLUID +23.7% $2.14
🟢 CARDS +16.9% $0.2863
🟢 NIL +14.2% $0.1027
🟢 AI +11.4% $0.1247
📉 Top losers
🔴 CT -14.5% $0.4109
🔴 SAND -12.3% $0.0679
🔴 STRK -7.75% $0.0523
🔴 SOON -7.39% $0.3359
🔴 USELESS -6.42% $0.2238
🧩 Zones (24h, mcap-weighted)
🟢 AI +1.08%
🟢 MEMES +0.84%
🟢 DEFI +0.38%
🔴 GAMING -1.55%
🔴 INFRASTRUCTURE -1.07%
🔴 SOLANA -0.98%
WPO Read: Leadership is mixed and rotation is selective. Treat isolated movers cautiously until breadth and total market value confirm the direction.
Sources: CoinMarketCap, Alternative.me
#wpo_report #CryptoMarket #MarketData
Total mcap: $2.90T (-0.23% 24h)
BTC dom: 59.0% | ETH: 11.3%
Fear & Greed: 70 Greed 🟩🟩🟩🟩▫️
🟠 $BTC $85,121 -0.21% | $ETH $2,695 -0.19%
Breadth: 🟢 87 (45%) 🔴 100 (52%) avg +0.44% (194 assets)
🚀 Top gainers (liquid 24h)
🟢 $RLC +53.4% $0.5548
🟢 FLUID +23.7% $2.14
🟢 CARDS +16.9% $0.2863
🟢 NIL +14.2% $0.1027
🟢 AI +11.4% $0.1247
📉 Top losers
🔴 CT -14.5% $0.4109
🔴 SAND -12.3% $0.0679
🔴 STRK -7.75% $0.0523
🔴 SOON -7.39% $0.3359
🔴 USELESS -6.42% $0.2238
🧩 Zones (24h, mcap-weighted)
🟢 AI +1.08%
🟢 MEMES +0.84%
🟢 DEFI +0.38%
🔴 GAMING -1.55%
🔴 INFRASTRUCTURE -1.07%
🔴 SOLANA -0.98%
WPO Read: Leadership is mixed and rotation is selective. Treat isolated movers cautiously until breadth and total market value confirm the direction.
Sources: CoinMarketCap, Alternative.me
#wpo_report #CryptoMarket #MarketData
1
1
589
·
--
ສັນຍານກະທິງ
ຢືນຢັນແລ້ວ
Market data is becoming critical infrastructure for 24/7 finance.
Most data travels downstream. Pyth Network goes upstream, sourcing prices directly from institutions and traders creating them.
$PYTH provides governance and utility within the Pyth Network ecosystem.
710+ businesses use Pyth Network data.
$3.25T+ cumulative volume secured.
125+ institutional publishers across 114+ blockchains, with 60% of the onchain perpetuals market running on Pyth Network.
Pyth Pro delivers multi-asset data through one integration and crossed $6M ARR within months.
$HBAR connects with institutional adoption, $XLM with programmable finance, and $TAO with autonomous AI systems.
Pyth Network takes a distinct path through first-party financial data infrastructure.
Not financial advice, just information post.
#PYTH #PythNetwork #RWA #MarketData #DeFi
Market data is becoming critical infrastructure for 24/7 finance.
Most data travels downstream. Pyth Network goes upstream, sourcing prices directly from institutions and traders creating them.
$PYTH provides governance and utility within the Pyth Network ecosystem.
710+ businesses use Pyth Network data.
$3.25T+ cumulative volume secured.
125+ institutional publishers across 114+ blockchains, with 60% of the onchain perpetuals market running on Pyth Network.
Pyth Pro delivers multi-asset data through one integration and crossed $6M ARR within months.
$HBAR connects with institutional adoption, $XLM with programmable finance, and $TAO with autonomous AI systems.
Pyth Network takes a distinct path through first-party financial data infrastructure.
Not financial advice, just information post.
#PYTH #PythNetwork #RWA #MarketData #DeFi
Most data travels downstream. Pyth Network goes upstream, sourcing prices directly from institutions and traders creating them.
$PYTH provides governance and utility within the Pyth Network ecosystem.
710+ businesses use Pyth Network data.
$3.25T+ cumulative volume secured.
125+ institutional publishers across 114+ blockchains, with 60% of the onchain perpetuals market running on Pyth Network.
Pyth Pro delivers multi-asset data through one integration and crossed $6M ARR within months.
$HBAR connects with institutional adoption, $XLM with programmable finance, and $TAO with autonomous AI systems.
Pyth Network takes a distinct path through first-party financial data infrastructure.
Not financial advice, just information post.
#PYTH #PythNetwork #RWA #MarketData #DeFi

67
44
11.8k
·
--
ສັນຍານກະທິງ
ຢືນຢັນແລ້ວ
Pyth Network goes upstream while most market data stays downstream.
$PYTH powers the Pyth ecosystem, connecting first-party institutional pricing with internet-native finance.
Pyth Pro crossed $6M ARR, subscription ARR jumped 109% QoQ, while 710+ businesses use Pyth data across 114+ blockchains.
$UMA connects with prediction markets, $ONDO targets RWAs, and $HYPE represents perpetual markets. Pyth brings institutional market data across all three themes.
With 125+ publishers and $3.25T+ cumulative volume secured, Pyth keeps expanding its role in 24/7 markets.
Not financial advice, just information post
#PYTH #PythNetwork #DeFi #RWA #MarketData
Pyth Network goes upstream while most market data stays downstream.
$PYTH powers the Pyth ecosystem, connecting first-party institutional pricing with internet-native finance.
Pyth Pro crossed $6M ARR, subscription ARR jumped 109% QoQ, while 710+ businesses use Pyth data across 114+ blockchains.
$UMA connects with prediction markets, $ONDO targets RWAs, and $HYPE represents perpetual markets. Pyth brings institutional market data across all three themes.
With 125+ publishers and $3.25T+ cumulative volume secured, Pyth keeps expanding its role in 24/7 markets.
Not financial advice, just information post
#PYTH #PythNetwork #DeFi #RWA #MarketData
$PYTH powers the Pyth ecosystem, connecting first-party institutional pricing with internet-native finance.
Pyth Pro crossed $6M ARR, subscription ARR jumped 109% QoQ, while 710+ businesses use Pyth data across 114+ blockchains.
$UMA connects with prediction markets, $ONDO targets RWAs, and $HYPE represents perpetual markets. Pyth brings institutional market data across all three themes.
With 125+ publishers and $3.25T+ cumulative volume secured, Pyth keeps expanding its role in 24/7 markets.
Not financial advice, just information post
#PYTH #PythNetwork #DeFi #RWA #MarketData
57
36
11.9k

Weekend Market Snapshot
After the CPI-driven volatility, the market is trying to stabilize.
Bitcoin is holding around the $77,200–$77,400 zone.
{spot}(BTCUSDT)
Ethereum continues to show relative strength, up over 2% and trading near $2,520.
{spot}(ETHUSDT)
Key observations from the data:
- ETH is outperforming BTC in the short term.
- Rate hike odds remain elevated after the hotter inflation print.
- Liquidations were heavy yesterday, but price recovered quickly.
With the Fed meeting next week, traders are watching whether Bitcoin can hold current support or if we see another test lower.
Data still points to selective strength rather than broad risk-on.
What’s your view heading into next week?
#CryptoAnalytics #BTC #ETH #MarketData #BinanceSquare
Weekend Market Snapshot
After the CPI-driven volatility, the market is trying to stabilize.
Bitcoin is holding around the $77,200–$77,400 zone.
Ethereum continues to show relative strength, up over 2% and trading near $2,520.
Key observations from the data:
- ETH is outperforming BTC in the short term.
- Rate hike odds remain elevated after the hotter inflation print.
- Liquidations were heavy yesterday, but price recovered quickly.
With the Fed meeting next week, traders are watching whether Bitcoin can hold current support or if we see another test lower.
Data still points to selective strength rather than broad risk-on.
What’s your view heading into next week?
#CryptoAnalytics #BTC #ETH #MarketData #BinanceSquare
After the CPI-driven volatility, the market is trying to stabilize.
Bitcoin is holding around the $77,200–$77,400 zone.
Ethereum continues to show relative strength, up over 2% and trading near $2,520.
Key observations from the data:
- ETH is outperforming BTC in the short term.
- Rate hike odds remain elevated after the hotter inflation print.
- Liquidations were heavy yesterday, but price recovered quickly.
With the Fed meeting next week, traders are watching whether Bitcoin can hold current support or if we see another test lower.
Data still points to selective strength rather than broad risk-on.
What’s your view heading into next week?
#CryptoAnalytics #BTC #ETH #MarketData #BinanceSquare
126

·
--
ສັນຍານກະທິງ
ຢືນຢັນແລ້ວ
Pyth Network is quietly rebuilding how financial markets get their data.
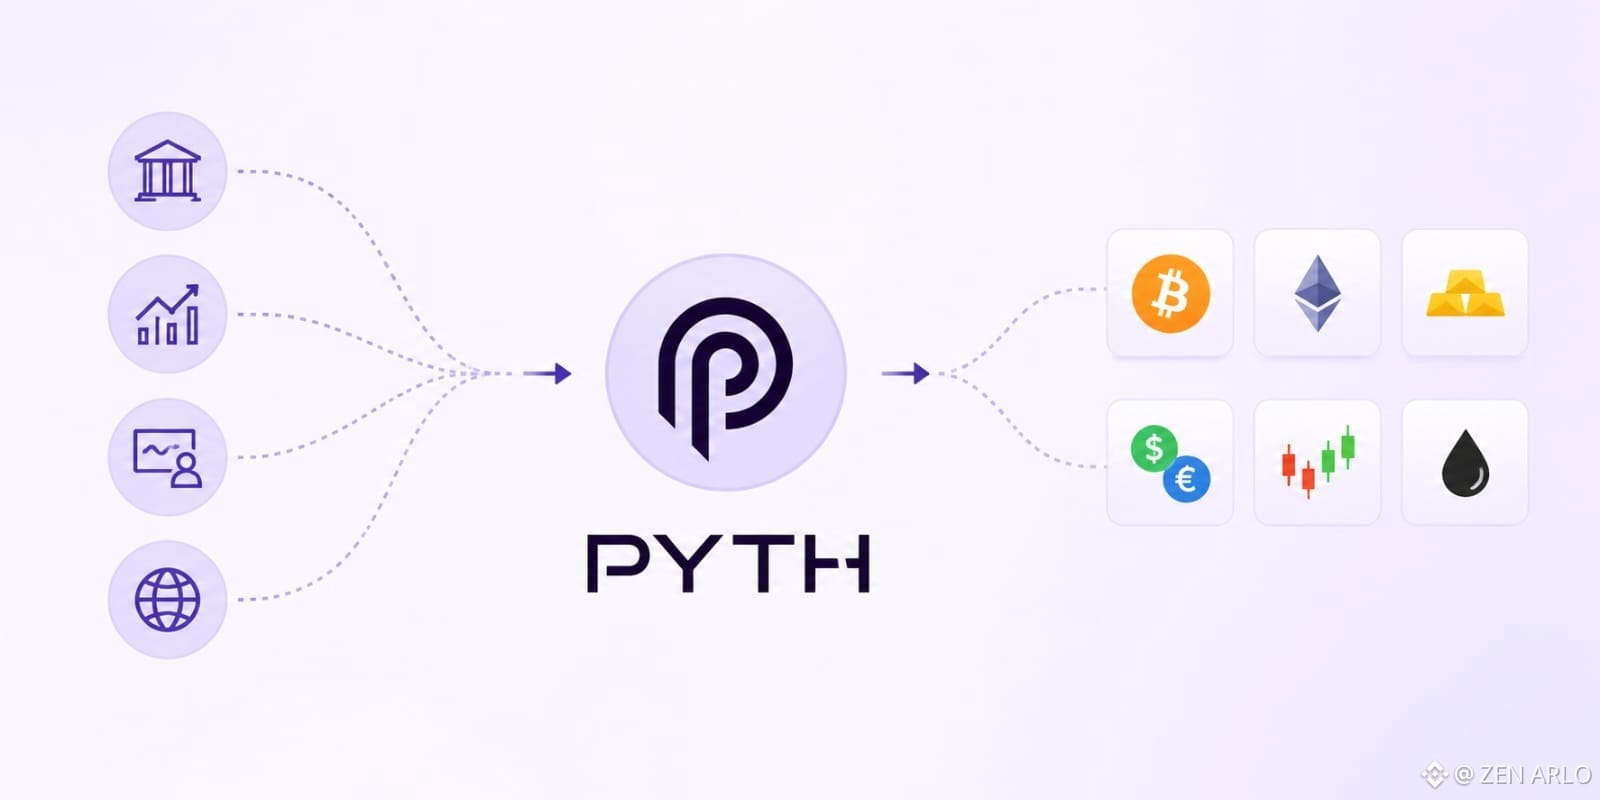
Most market data is downstream. Pyth goes upstream—sourcing prices directly from the institutions and traders creating them.
The scale is already significant:
710+ businesses using Pyth data
$3.25T+ cumulative volume secured
60% of the onchain perpetuals market
125+ institutional publishers
114+ blockchains receiving feeds
3,000+ price feeds across global markets
Pyth Pro takes this infrastructure institutional, offering 2,200+ instruments across multiple asset classes through one integration, with sub-100ms end-to-end latency and 99.99% uptime guarantees.
That matters for normal users because better underlying data can support more reliable pricing, collateral valuation, liquidations, settlement and 24/7 financial products.
Pyth Terminal makes the same ecosystem easier to inspect, letting users explore live feeds, compare pricing against benchmarks and see where data comes from.
Then there are two additional layers: Pyth Data Marketplace for distributing proprietary institutional datasets, and Pyth Indices for always-on pricing across individual assets and baskets.
Pyth Pro for AI Agents extends this further into autonomous finance, where machines need reliable, structured financial data to make decisions.
Commercial adoption is also accelerating. Pyth Pro crossed $6M ARR within months of launch, subscription ARR grew 109% QoQ, and Pyth reported three consecutive months above $1M in gross new ARR.
For context, $LINK overlaps with institutional data infrastructure, $ONDO with RWAs, $HYPE with perpetual markets, and $TAO with the emerging AI-agent narrative.
The bigger question isn't simply who provides data onchain. It's who becomes the market-data layer for financial markets that never close.
Only information not financial advice
#PythNetwork #MarketData #DeFi
Pyth Network is quietly rebuilding how financial markets get their data.
Most market data is downstream. Pyth goes upstream—sourcing prices directly from the institutions and traders creating them.
The scale is already significant:
710+ businesses using Pyth data
$3.25T+ cumulative volume secured
60% of the onchain perpetuals market
125+ institutional publishers
114+ blockchains receiving feeds
3,000+ price feeds across global markets
Pyth Pro takes this infrastructure institutional, offering 2,200+ instruments across multiple asset classes through one integration, with sub-100ms end-to-end latency and 99.99% uptime guarantees.
That matters for normal users because better underlying data can support more reliable pricing, collateral valuation, liquidations, settlement and 24/7 financial products.
Pyth Terminal makes the same ecosystem easier to inspect, letting users explore live feeds, compare pricing against benchmarks and see where data comes from.
Then there are two additional layers: Pyth Data Marketplace for distributing proprietary institutional datasets, and Pyth Indices for always-on pricing across individual assets and baskets.
Pyth Pro for AI Agents extends this further into autonomous finance, where machines need reliable, structured financial data to make decisions.
Commercial adoption is also accelerating. Pyth Pro crossed $6M ARR within months of launch, subscription ARR grew 109% QoQ, and Pyth reported three consecutive months above $1M in gross new ARR.
For context, $LINK overlaps with institutional data infrastructure, $ONDO with RWAs, $HYPE with perpetual markets, and $TAO with the emerging AI-agent narrative.
The bigger question isn't simply who provides data onchain. It's who becomes the market-data layer for financial markets that never close.
Only information not financial advice
#PythNetwork #MarketData #DeFi
Most market data is downstream. Pyth goes upstream—sourcing prices directly from the institutions and traders creating them.
The scale is already significant:
710+ businesses using Pyth data
$3.25T+ cumulative volume secured
60% of the onchain perpetuals market
125+ institutional publishers
114+ blockchains receiving feeds
3,000+ price feeds across global markets
Pyth Pro takes this infrastructure institutional, offering 2,200+ instruments across multiple asset classes through one integration, with sub-100ms end-to-end latency and 99.99% uptime guarantees.
That matters for normal users because better underlying data can support more reliable pricing, collateral valuation, liquidations, settlement and 24/7 financial products.
Pyth Terminal makes the same ecosystem easier to inspect, letting users explore live feeds, compare pricing against benchmarks and see where data comes from.
Then there are two additional layers: Pyth Data Marketplace for distributing proprietary institutional datasets, and Pyth Indices for always-on pricing across individual assets and baskets.
Pyth Pro for AI Agents extends this further into autonomous finance, where machines need reliable, structured financial data to make decisions.
Commercial adoption is also accelerating. Pyth Pro crossed $6M ARR within months of launch, subscription ARR grew 109% QoQ, and Pyth reported three consecutive months above $1M in gross new ARR.
For context, $LINK overlaps with institutional data infrastructure, $ONDO with RWAs, $HYPE with perpetual markets, and $TAO with the emerging AI-agent narrative.
The bigger question isn't simply who provides data onchain. It's who becomes the market-data layer for financial markets that never close.
Only information not financial advice
#PythNetwork #MarketData #DeFi
79
1
60
17.6k

·
--
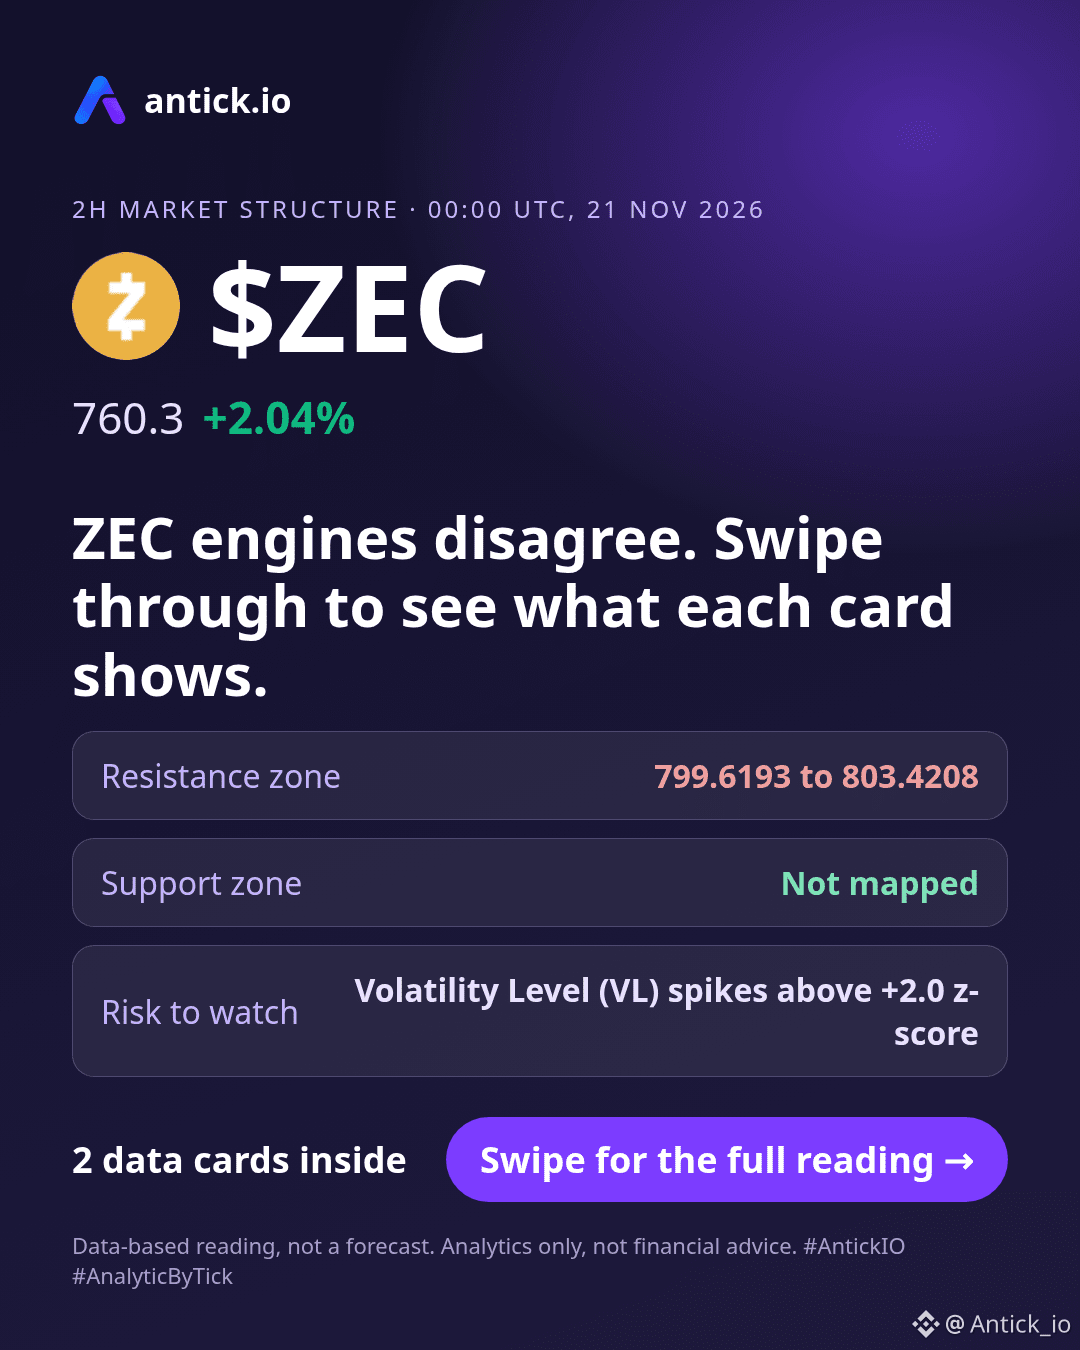
$ZEC · 2H check · data as of 00:00 UTC, 21 Nov 2026
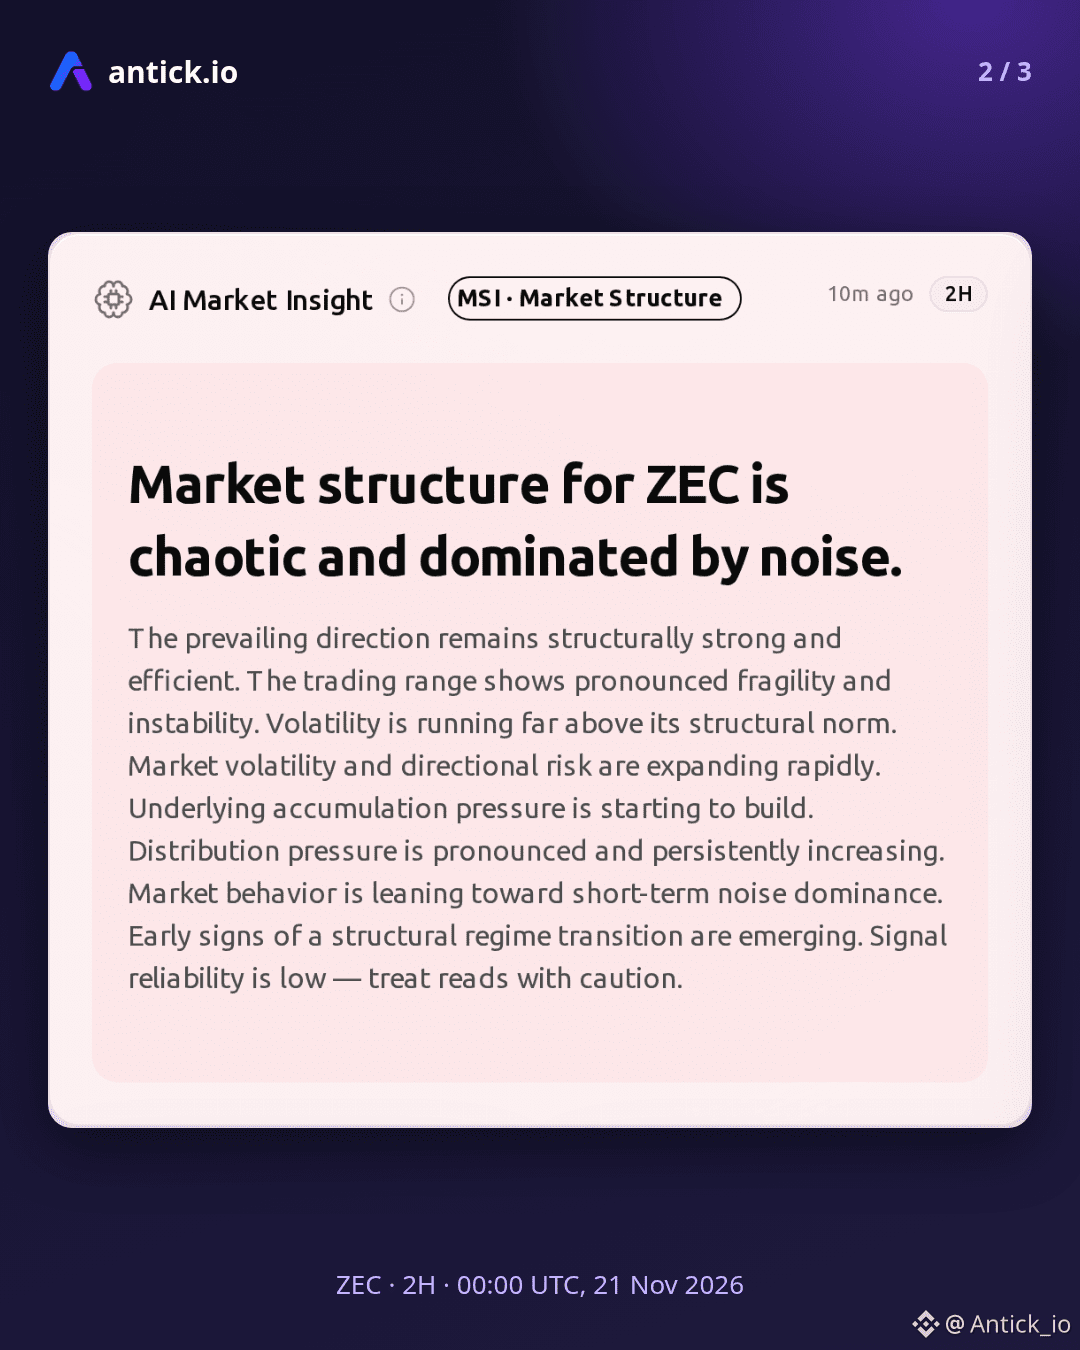
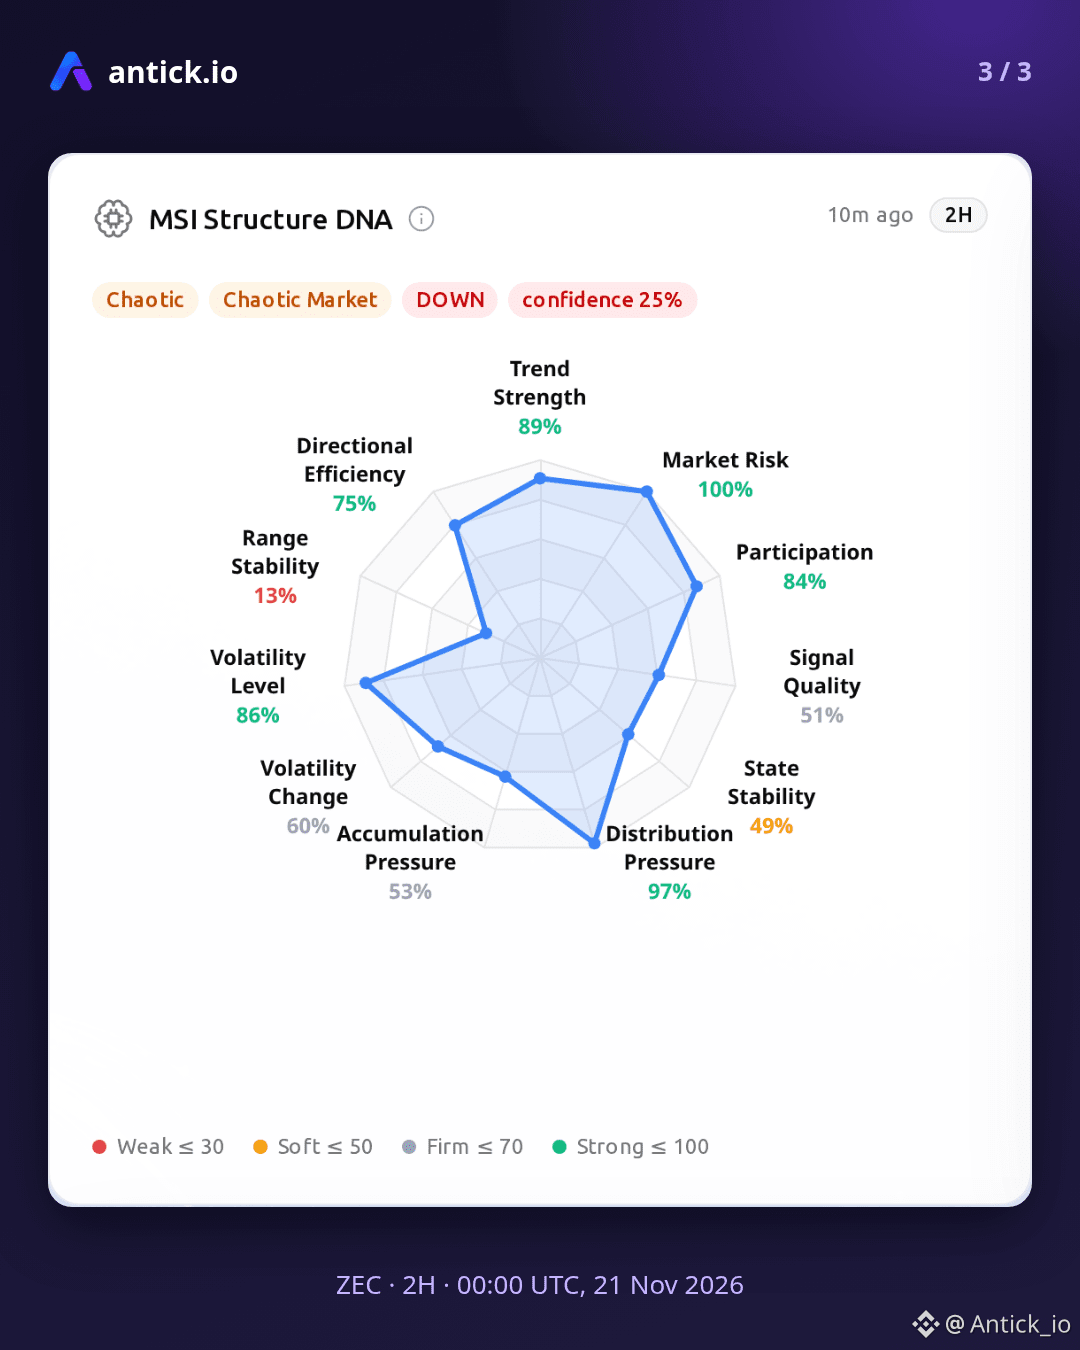
ZEC engine readings are split. A drop is possible if the overextended move and the chaotic structure in MSI Structure DNA keep pressing. A rebound is possible if order-book absorption and cautious Smart Follow participation keep holding. The AI Market Insight card shows both sides still in play.
Checklist, risk side:
✓ Volatility Level (VL) spikes above +2.0 z-score
✓ Signal Quality (SQ) drops below 0.3, noise dominant
Checklist, price side:
✓ Downside reading weakens on a 2H close above 799.6193 to 803.4208
✓ State Stability (SS) breaks below -0.5
Data-based reading, not a forecast. Analytics only, not financial advice.
$ZEC #ZEC #AntickIO #AnalyticByTick #MarketData
$ZEC · 2H check · data as of 00:00 UTC, 21 Nov 2026
ZEC engine readings are split. A drop is possible if the overextended move and the chaotic structure in MSI Structure DNA keep pressing. A rebound is possible if order-book absorption and cautious Smart Follow participation keep holding. The AI Market Insight card shows both sides still in play.
Checklist, risk side:
✓ Volatility Level (VL) spikes above +2.0 z-score
✓ Signal Quality (SQ) drops below 0.3, noise dominant
Checklist, price side:
✓ Downside reading weakens on a 2H close above 799.6193 to 803.4208
✓ State Stability (SS) breaks below -0.5
Data-based reading, not a forecast. Analytics only, not financial advice.
$ZEC #ZEC #AntickIO #AnalyticByTick #MarketData
ZEC engine readings are split. A drop is possible if the overextended move and the chaotic structure in MSI Structure DNA keep pressing. A rebound is possible if order-book absorption and cautious Smart Follow participation keep holding. The AI Market Insight card shows both sides still in play.
Checklist, risk side:
✓ Volatility Level (VL) spikes above +2.0 z-score
✓ Signal Quality (SQ) drops below 0.3, noise dominant
Checklist, price side:
✓ Downside reading weakens on a 2H close above 799.6193 to 803.4208
✓ State Stability (SS) breaks below -0.5
Data-based reading, not a forecast. Analytics only, not financial advice.
$ZEC #ZEC #AntickIO #AnalyticByTick #MarketData
74

·
--
🧾 Evidence first: 4H volume just moved up 65% versus the prior stretch.
📌 That's on $EUR, currently $1.10 (+0.01% 24H).
🔬 Supporting data:
EMA20/EMA50: $1.10 / $1.10 — structure reads bearish
Volume: rising
100-candle range: $1.10 – $1.15
🧠 Trend and momentum are aligned on this one.
#Crypto #Binance $EUR #MarketData
🧾 Evidence first: 4H volume just moved up 65% versus the prior stretch.
📌 That's on $EUR , currently $1.10 (+0.01% 24H).
🔬 Supporting data:
EMA20/EMA50: $1.10 / $1.10 — structure reads bearish
Volume: rising
100-candle range: $1.10 – $1.15
🧠 Trend and momentum are aligned on this one.
#Crypto #Binance $EUR #MarketData
📌 That's on $EUR , currently $1.10 (+0.01% 24H).
🔬 Supporting data:
EMA20/EMA50: $1.10 / $1.10 — structure reads bearish
Volume: rising
100-candle range: $1.10 – $1.15
🧠 Trend and momentum are aligned on this one.
#Crypto #Binance $EUR #MarketData
·
--
🧾 Evidence first: RSI(14) has pushed to 30.3, a weaker reading than typical.
📌 That's on $BNB, currently $567.55 (-4.24% 24H).
🔬 Supporting data:
EMA20/EMA50: $583.41 / $604.58 — structure reads bearish
Volume: steady
100-candle range: $565.05 – $723.42
🧠 Trend and momentum are aligned on this one.
#Crypto #Binance $BNB #MarketData
🧾 Evidence first: RSI(14) has pushed to 30.3, a weaker reading than typical.
📌 That's on $BNB , currently $567.55 (-4.24% 24H).
🔬 Supporting data:
EMA20/EMA50: $583.41 / $604.58 — structure reads bearish
Volume: steady
100-candle range: $565.05 – $723.42
🧠 Trend and momentum are aligned on this one.
#Crypto #Binance $BNB #MarketData
📌 That's on $BNB , currently $567.55 (-4.24% 24H).
🔬 Supporting data:
EMA20/EMA50: $583.41 / $604.58 — structure reads bearish
Volume: steady
100-candle range: $565.05 – $723.42
🧠 Trend and momentum are aligned on this one.
#Crypto #Binance $BNB #MarketData
9
Trend quality improves when gains are shared across several liquid names.
Stocks — Top Performance & Trend:
$INTC | $CVX | $WMT | AAPL | BAC | DIS | AVGO | MSFT | JPM | XOM
WPO Read:
Intel leads the liquid universe at +1.92% in the latest monitored session and -3.62% across the five-session sample. 2 of the top 5 names are positive, so breadth is selective. Leadership is shared across the top group; volume is 1.6x its recent pace.
Confirmation across the next session would strengthen the trend case.
#wpo_report #MarketData #StockWatch
Trend quality improves when gains are shared across several liquid names.
Stocks — Top Performance & Trend:
$INTC | $CVX | $WMT | AAPL | BAC | DIS | AVGO | MSFT | JPM | XOM
WPO Read:
Intel leads the liquid universe at +1.92% in the latest monitored session and -3.62% across the five-session sample. 2 of the top 5 names are positive, so breadth is selective. Leadership is shared across the top group; volume is 1.6x its recent pace.
Confirmation across the next session would strengthen the trend case.
#wpo_report #MarketData #StockWatch
Stocks — Top Performance & Trend:
$INTC | $CVX | $WMT | AAPL | BAC | DIS | AVGO | MSFT | JPM | XOM
WPO Read:
Intel leads the liquid universe at +1.92% in the latest monitored session and -3.62% across the five-session sample. 2 of the top 5 names are positive, so breadth is selective. Leadership is shared across the top group; volume is 1.6x its recent pace.
Confirmation across the next session would strengthen the trend case.
#wpo_report #MarketData #StockWatch
512

·
--
📊 TWO COINS. SAME 5% PRICE MOVE. VERY DIFFERENT MARKETS.
Imagine $BTC and $SOL both rise by 5%.
At first glance, the moves look identical.
But percentages alone don't explain how a market behaves.
Consider three hidden variables:
1. Liquidity
How much buying or selling can the market absorb before prices move significantly?
2. Trading Volume
How much activity occurred during the period?
3. Bid-Ask Spread
How large is the difference between the best available buying and selling prices?
Two assets can show the same percentage change while behaving very differently under trading pressure.
That's why I prefer understanding the structure behind a price move rather than judging a chart by its percentage alone.
The percentage is the headline. Market structure is the story.
💬 If you could examine only ONE metric before interpreting a price movement, which would you choose — liquidity, volume, or volatility? And why?
#Bitcoin
{spot}(SOLUSDT)
{spot}(BTCUSDT)
#Solana #CryptoAnalysis #MarketData
Educational content only, not financial advice. Disclosure: I may earn rewards through Binance Square's Write to Earn program.
📊 TWO COINS. SAME 5% PRICE MOVE. VERY DIFFERENT MARKETS.
Imagine $BTC and $SOL both rise by 5%.
At first glance, the moves look identical.
But percentages alone don't explain how a market behaves.
Consider three hidden variables:
1. Liquidity
How much buying or selling can the market absorb before prices move significantly?
2. Trading Volume
How much activity occurred during the period?
3. Bid-Ask Spread
How large is the difference between the best available buying and selling prices?
Two assets can show the same percentage change while behaving very differently under trading pressure.
That's why I prefer understanding the structure behind a price move rather than judging a chart by its percentage alone.
The percentage is the headline. Market structure is the story.
💬 If you could examine only ONE metric before interpreting a price movement, which would you choose — liquidity, volume, or volatility? And why?
#Bitcoin
#Solana #CryptoAnalysis #MarketData
Educational content only, not financial advice. Disclosure: I may earn rewards through Binance Square's Write to Earn program.
Imagine $BTC and $SOL both rise by 5%.
At first glance, the moves look identical.
But percentages alone don't explain how a market behaves.
Consider three hidden variables:
1. Liquidity
How much buying or selling can the market absorb before prices move significantly?
2. Trading Volume
How much activity occurred during the period?
3. Bid-Ask Spread
How large is the difference between the best available buying and selling prices?
Two assets can show the same percentage change while behaving very differently under trading pressure.
That's why I prefer understanding the structure behind a price move rather than judging a chart by its percentage alone.
The percentage is the headline. Market structure is the story.
💬 If you could examine only ONE metric before interpreting a price movement, which would you choose — liquidity, volume, or volatility? And why?
#Bitcoin
#Solana #CryptoAnalysis #MarketData
Educational content only, not financial advice. Disclosure: I may earn rewards through Binance Square's Write to Earn program.
70
ເຂົ້າສູ່ລະບົບເພື່ອສຳຫຼວດເນື້ອຫາເພີ່ມເຕີມ
ເຂົ້າຮ່ວມກຸ່ມຜູ້ໃຊ້ຄຣິບໂຕທົ່ວໂລກໃນ Binance Square.
⚡️ ໄດ້ຮັບຂໍ້ມູນຫຼ້າສຸດ ແລະ ທີ່ມີປະໂຫຍດກ່ຽວກັບຄຣິບໂຕ.
💬 ໄດ້ຮັບຄວາມໄວ້ວາງໃຈຈາກຕະຫຼາດແລກປ່ຽນຄຣິບໂຕທີ່ໃຫຍ່ທີ່ສຸດໃນໂລກ.
👍 ຄົ້ນຫາຂໍ້ມູນເຊີງເລິກທີ່ແທ້ຈາກນັກສ້າງທີ່ໄດ້ຮັບການຢືນຢັນ.
ອີເມວ / ເບີໂທລະສັບ
ຫົວຂໍ້ທີ່ກໍາລັງນິຍົມ
1
#CanBTCReboundAfterFallingBelow60K?
388,957 ຄັ້ງທີ່ເບິ່ງ
1,660 ກຳລັງສົນທະນາ
2
#GlobalStocksFaceLongestLosingStreakSince2023
129,378 ຄັ້ງທີ່ເບິ່ງ
1,154 ກຳລັງສົນທະນາ
3
#BlackRockIBITPostsRecord$541MSingleDayOutflow
1,028 ຄັ້ງທີ່ເບິ່ງ
30 ກຳລັງສົນທະນາ
4
#AnthropicPlungesTowardIPOPriceonDay2
61,498 ຄັ້ງທີ່ເບິ່ງ
620 ກຳລັງສົນທະນາ
5
#TwentyOneCapitalAdds172.25BTC
14,326 ຄັ້ງທີ່ເບິ່ງ
180 ກຳລັງສົນທະນາ
6
#HKBillWouldExcludeTokenizedDepositsFromVirtualAssets
1,432 ຄັ້ງທີ່ເບິ່ງ
18 ກຳລັງສົນທະນາ
7
#BNBDropsBelow540USDTWith8.46%DailyDecline
34,954 ຄັ້ງທີ່ເບິ່ງ
296 ກຳລັງສົນທະນາ
8
#HKBillProposesHK$100KFineForUnauthorizedCryptoTitles
1,141 ຄັ້ງທີ່ເບິ່ງ
17 ກຳລັງສົນທະນາ
9
#BitMineFaces$10.1BUnrealizedETHLoss
2,166 ຄັ້ງທີ່ເບິ່ງ
20 ກຳລັງສົນທະນາ
10
#StrategyReports$35BNetReserves
2,128 ຄັ້ງທີ່ເບິ່ງ
18 ກຳລັງສົນທະນາ