

JOSEPH DESOZE
16.8k Жариялаулар

JOSEPH DESOZE
 «Square расталған» белгісі
Хабарлау
Пайдаланушыны блоктау
Crypto Enthusiast, Market Analyst; Gem Hunter Blockchain Believer.
Ашық сауда
Жиі сауда жасайтын трейдер
2 жыл
199 Жазылым
30.1K+ Жазылушылар
18.6K+ лайк басылған
Жазбалар
Портфолио
Барлығы
Баға ұсыныстары
Тікелей эфир



🎙️ 建设币安广场,持有BNB|周六,美国非农数据一出来,BTC一度蹿到87000美金又快速回落,你们觉得这是一锤子买卖还是信号的拐点?来聊聊~

Соңы
05 сағ 11 а 33 с
12.8k
39
51
·
--
Жоғары (өспелі)
Why is everyone suddenly calling HYPE a bottom?
$HYPE /USDT - LONG
Trade Plan:
Entry: 88.884 – 89.522
SL: 86.140
TP1: 91.500
TP2: 93.032
TP3: 95.329
Why this setup?
Debate:
Are we hitting TP2 at 93.032 or getting trapped before the invalidation at 88.542?
⚠️ Personal market analysis only. NFA — manage risk and DYOR.
Educational content, not investment advice or a recommendation to buy, sell, deposit, or withdraw any asset. No paid promotion or referral/affiliate links.
{future}(HYPEUSDT)
Why is everyone suddenly calling HYPE a bottom?
$HYPE /USDT - LONG
Trade Plan:
Entry: 88.884 – 89.522
SL: 86.140
TP1: 91.500
TP2: 93.032
TP3: 95.329
Why this setup?
Debate:
Are we hitting TP2 at 93.032 or getting trapped before the invalidation at 88.542?
⚠️ Personal market analysis only. NFA — manage risk and DYOR.
Educational content, not investment advice or a recommendation to buy, sell, deposit, or withdraw any asset. No paid promotion or referral/affiliate links.
$HYPE /USDT - LONG
Trade Plan:
Entry: 88.884 – 89.522
SL: 86.140
TP1: 91.500
TP2: 93.032
TP3: 95.329
Why this setup?
Debate:
Are we hitting TP2 at 93.032 or getting trapped before the invalidation at 88.542?
⚠️ Personal market analysis only. NFA — manage risk and DYOR.
Educational content, not investment advice or a recommendation to buy, sell, deposit, or withdraw any asset. No paid promotion or referral/affiliate links.
186
#EarningsSeason
This is the part of the market where the chart can stop telling the whole story.
Q3 earnings expectations are already high. FactSet’s latest estimate puts S&P 500 earnings growth around 28.9% year over year, which would mark a third straight quarter above 25%.
But after watching earnings seasons closely, the number I care about most isn't EPS.
It’s guidance.
A company can beat estimates and still sell off if management lowers the outlook. Another can miss slightly and hold up if the forward picture improves.
That’s why this season gets interesting.
Revenue → margins → guidance → capex.
In AI and semiconductors, capex is especially important. Micron reports Wednesday, and the market is watching whether AI-driven memory demand is translating into sustainable pricing and profits rather than just another powerful quarter.
And outside tech, the consumer side deserves attention.
Higher energy costs, Treasury yields and persistent inflation can eventually show up in margins and spending decisions.
This week alone brings Micron, Nike, Accenture, McCormick, Conagra and others, alongside major economic data including GDP, PCE and the September jobs report.
So I’m not watching earnings for the headline beat.
I’m watching what companies say after the numbers.
Because the market already knows what happened last quarter.
The interesting information is what management thinks happens next.
#EarningsSeason
This is the part of the market where the chart can stop telling the whole story.
Q3 earnings expectations are already high. FactSet’s latest estimate puts S&P 500 earnings growth around 28.9% year over year, which would mark a third straight quarter above 25%.
But after watching earnings seasons closely, the number I care about most isn't EPS.
It’s guidance.
A company can beat estimates and still sell off if management lowers the outlook. Another can miss slightly and hold up if the forward picture improves.
That’s why this season gets interesting.
Revenue → margins → guidance → capex.
In AI and semiconductors, capex is especially important. Micron reports Wednesday, and the market is watching whether AI-driven memory demand is translating into sustainable pricing and profits rather than just another powerful quarter.
And outside tech, the consumer side deserves attention.
Higher energy costs, Treasury yields and persistent inflation can eventually show up in margins and spending decisions.
This week alone brings Micron, Nike, Accenture, McCormick, Conagra and others, alongside major economic data including GDP, PCE and the September jobs report.
So I’m not watching earnings for the headline beat.
I’m watching what companies say after the numbers.
Because the market already knows what happened last quarter.
The interesting information is what management thinks happens next.
This is the part of the market where the chart can stop telling the whole story.
Q3 earnings expectations are already high. FactSet’s latest estimate puts S&P 500 earnings growth around 28.9% year over year, which would mark a third straight quarter above 25%.
But after watching earnings seasons closely, the number I care about most isn't EPS.
It’s guidance.
A company can beat estimates and still sell off if management lowers the outlook. Another can miss slightly and hold up if the forward picture improves.
That’s why this season gets interesting.
Revenue → margins → guidance → capex.
In AI and semiconductors, capex is especially important. Micron reports Wednesday, and the market is watching whether AI-driven memory demand is translating into sustainable pricing and profits rather than just another powerful quarter.
And outside tech, the consumer side deserves attention.
Higher energy costs, Treasury yields and persistent inflation can eventually show up in margins and spending decisions.
This week alone brings Micron, Nike, Accenture, McCormick, Conagra and others, alongside major economic data including GDP, PCE and the September jobs report.
So I’m not watching earnings for the headline beat.
I’m watching what companies say after the numbers.
Because the market already knows what happened last quarter.
The interesting information is what management thinks happens next.
412
#CircleMints500MUSDCOnSolana
$500M USDC appeared on Solana.
At first glance, that sounds like a huge liquidity event.
But watching stablecoin flows closely teaches you to pause here.
A mint is not the same thing as capital rushing into DeFi.
Circle’s own explanation is pretty simple: when an eligible institution deposits dollars through Circle Mint, Circle issues the equivalent USDC. That newly created USDC can then be distributed across wallets, exchanges, market makers and applications.
And that distinction matters.
We’ve seen this before.
On September 19, Circle minted another $500M on Solana through two separate 250M USDC transactions. On-chain analysis showed most of that balance initially remained in the treasury-labeled account rather than immediately becoming market liquidity.
So when I see another $500M mint, I’m less interested in the headline number.
I’m watching the wallet after the mint.
Where does it go?
Exchange wallets?
Market makers?
DEX liquidity?
Lending protocols?
Cross-chain infrastructure?
That’s where the signal gets interesting.
There’s another quiet detail too: USDC is already native to dozens of chains, and Circle says it had about $75.2B in circulation as of September 24, backed by roughly $75.5B in reserves.
So a Solana mint can represent new issuance, but cross-chain mechanics can also move where USDC supply exists without necessarily meaning an equal amount of fresh global capital entered crypto.
That’s why I wouldn’t read the $500M as “$500M just entered Solana.”
I’d read it as:
$500M of potential dollar liquidity was created on Solana.
The interesting part comes next.
Follow the wallets.
Because the real story usually starts after the mint transaction disappears from the headlines.
#CircleMints500MUSDCOnSolana
$500M USDC appeared on Solana.
At first glance, that sounds like a huge liquidity event.
But watching stablecoin flows closely teaches you to pause here.
A mint is not the same thing as capital rushing into DeFi.
Circle’s own explanation is pretty simple: when an eligible institution deposits dollars through Circle Mint, Circle issues the equivalent USDC. That newly created USDC can then be distributed across wallets, exchanges, market makers and applications.
And that distinction matters.
We’ve seen this before.
On September 19, Circle minted another $500M on Solana through two separate 250M USDC transactions. On-chain analysis showed most of that balance initially remained in the treasury-labeled account rather than immediately becoming market liquidity.
So when I see another $500M mint, I’m less interested in the headline number.
I’m watching the wallet after the mint.
Where does it go?
Exchange wallets?
Market makers?
DEX liquidity?
Lending protocols?
Cross-chain infrastructure?
That’s where the signal gets interesting.
There’s another quiet detail too: USDC is already native to dozens of chains, and Circle says it had about $75.2B in circulation as of September 24, backed by roughly $75.5B in reserves.
So a Solana mint can represent new issuance, but cross-chain mechanics can also move where USDC supply exists without necessarily meaning an equal amount of fresh global capital entered crypto.
That’s why I wouldn’t read the $500M as “$500M just entered Solana.”
I’d read it as:
$500M of potential dollar liquidity was created on Solana.
The interesting part comes next.
Follow the wallets.
Because the real story usually starts after the mint transaction disappears from the headlines.
$500M USDC appeared on Solana.
At first glance, that sounds like a huge liquidity event.
But watching stablecoin flows closely teaches you to pause here.
A mint is not the same thing as capital rushing into DeFi.
Circle’s own explanation is pretty simple: when an eligible institution deposits dollars through Circle Mint, Circle issues the equivalent USDC. That newly created USDC can then be distributed across wallets, exchanges, market makers and applications.
And that distinction matters.
We’ve seen this before.
On September 19, Circle minted another $500M on Solana through two separate 250M USDC transactions. On-chain analysis showed most of that balance initially remained in the treasury-labeled account rather than immediately becoming market liquidity.
So when I see another $500M mint, I’m less interested in the headline number.
I’m watching the wallet after the mint.
Where does it go?
Exchange wallets?
Market makers?
DEX liquidity?
Lending protocols?
Cross-chain infrastructure?
That’s where the signal gets interesting.
There’s another quiet detail too: USDC is already native to dozens of chains, and Circle says it had about $75.2B in circulation as of September 24, backed by roughly $75.5B in reserves.
So a Solana mint can represent new issuance, but cross-chain mechanics can also move where USDC supply exists without necessarily meaning an equal amount of fresh global capital entered crypto.
That’s why I wouldn’t read the $500M as “$500M just entered Solana.”
I’d read it as:
$500M of potential dollar liquidity was created on Solana.
The interesting part comes next.
Follow the wallets.
Because the real story usually starts after the mint transaction disappears from the headlines.
2
215
·
--
Жоғары (өспелі)
Most traders are about to get blindsided by SYMBOL right now.
$HYPE /USDT - LONG
Trade Plan:
Entry: 92.404 – 92.922
SL: 90.177
TP1: 94.527
TP2: 95.770
TP3: 97.634
Why this setup?
Why now? The daily trend is bullish, and the 1h price is sitting at 92.663, which is the exact entry reference level. The 15m RSI at 46.29 shows the asset is not yet overbought, leaving room to run. The 1h ATR of 1.035698 tells us the market is volatile enough to push from the entry zone of 92.404 to 92.922 all the way to TP1 at 94.527 and beyond to TP2 at 95.770. The invalidation level at 90.147 is the hard stop that protects this trade.
Debate:
Are we hitting TP2 or getting trapped at 95.770?
⚠️ Personal market analysis only. NFA — manage risk and DYOR.
Educational content, not investment advice or a recommendation to buy, sell, deposit, or withdraw any asset. No paid promotion or referral/affiliate links.
{future}(HYPEUSDT)
Most traders are about to get blindsided by SYMBOL right now.
$HYPE /USDT - LONG
Trade Plan:
Entry: 92.404 – 92.922
SL: 90.177
TP1: 94.527
TP2: 95.770
TP3: 97.634
Why this setup?
Why now? The daily trend is bullish, and the 1h price is sitting at 92.663, which is the exact entry reference level. The 15m RSI at 46.29 shows the asset is not yet overbought, leaving room to run. The 1h ATR of 1.035698 tells us the market is volatile enough to push from the entry zone of 92.404 to 92.922 all the way to TP1 at 94.527 and beyond to TP2 at 95.770. The invalidation level at 90.147 is the hard stop that protects this trade.
Debate:
Are we hitting TP2 or getting trapped at 95.770?
⚠️ Personal market analysis only. NFA — manage risk and DYOR.
Educational content, not investment advice or a recommendation to buy, sell, deposit, or withdraw any asset. No paid promotion or referral/affiliate links.
$HYPE /USDT - LONG
Trade Plan:
Entry: 92.404 – 92.922
SL: 90.177
TP1: 94.527
TP2: 95.770
TP3: 97.634
Why this setup?
Why now? The daily trend is bullish, and the 1h price is sitting at 92.663, which is the exact entry reference level. The 15m RSI at 46.29 shows the asset is not yet overbought, leaving room to run. The 1h ATR of 1.035698 tells us the market is volatile enough to push from the entry zone of 92.404 to 92.922 all the way to TP1 at 94.527 and beyond to TP2 at 95.770. The invalidation level at 90.147 is the hard stop that protects this trade.
Debate:
Are we hitting TP2 or getting trapped at 95.770?
⚠️ Personal market analysis only. NFA — manage risk and DYOR.
Educational content, not investment advice or a recommendation to buy, sell, deposit, or withdraw any asset. No paid promotion or referral/affiliate links.
1
181
·
--
Төмен (кемімелі)
Everyone's watching SYMBOL climb, but one number says otherwise.
$WLD /USDT - SHORT
Trade Plan:
Entry: 0.4562 – 0.4602
SL: 0.4776
TP1: 0.4436
TP2: 0.4339
TP3: 0.4193
Why this setup?
Why now? Because the daily trend is still just a range, meaning the uptrend believers may be fighting thin air. The 15m RSI at 73.23 shows the 1h price already stretched to the upside, which often precedes a pullback rather than continuation. With the 1h ATR at 0.008098, swings are active enough to deliver a clean move from the 0.4562 to 0.4602 entry zone down toward TP1 at 0.4436 and TP2 at 0.4339. The invalidation level sits at 0.4376, the line in the sand where this setup fails.
Debate:
Are we hitting TP2 or getting trapped?
⚠️ Personal market analysis only. NFA — manage risk and DYOR.
Educational content, not investment advice or a recommendation to buy, sell, deposit, or withdraw any asset. No paid promotion or referral/affiliate links.
{future}(WLDUSDT)
Everyone's watching SYMBOL climb, but one number says otherwise.
$WLD /USDT - SHORT
Trade Plan:
Entry: 0.4562 – 0.4602
SL: 0.4776
TP1: 0.4436
TP2: 0.4339
TP3: 0.4193
Why this setup?
Why now? Because the daily trend is still just a range, meaning the uptrend believers may be fighting thin air. The 15m RSI at 73.23 shows the 1h price already stretched to the upside, which often precedes a pullback rather than continuation. With the 1h ATR at 0.008098, swings are active enough to deliver a clean move from the 0.4562 to 0.4602 entry zone down toward TP1 at 0.4436 and TP2 at 0.4339. The invalidation level sits at 0.4376, the line in the sand where this setup fails.
Debate:
Are we hitting TP2 or getting trapped?
⚠️ Personal market analysis only. NFA — manage risk and DYOR.
Educational content, not investment advice or a recommendation to buy, sell, deposit, or withdraw any asset. No paid promotion or referral/affiliate links.
$WLD /USDT - SHORT
Trade Plan:
Entry: 0.4562 – 0.4602
SL: 0.4776
TP1: 0.4436
TP2: 0.4339
TP3: 0.4193
Why this setup?
Why now? Because the daily trend is still just a range, meaning the uptrend believers may be fighting thin air. The 15m RSI at 73.23 shows the 1h price already stretched to the upside, which often precedes a pullback rather than continuation. With the 1h ATR at 0.008098, swings are active enough to deliver a clean move from the 0.4562 to 0.4602 entry zone down toward TP1 at 0.4436 and TP2 at 0.4339. The invalidation level sits at 0.4376, the line in the sand where this setup fails.
Debate:
Are we hitting TP2 or getting trapped?
⚠️ Personal market analysis only. NFA — manage risk and DYOR.
Educational content, not investment advice or a recommendation to buy, sell, deposit, or withdraw any asset. No paid promotion or referral/affiliate links.
484
·
--
Жоғары (өспелі)
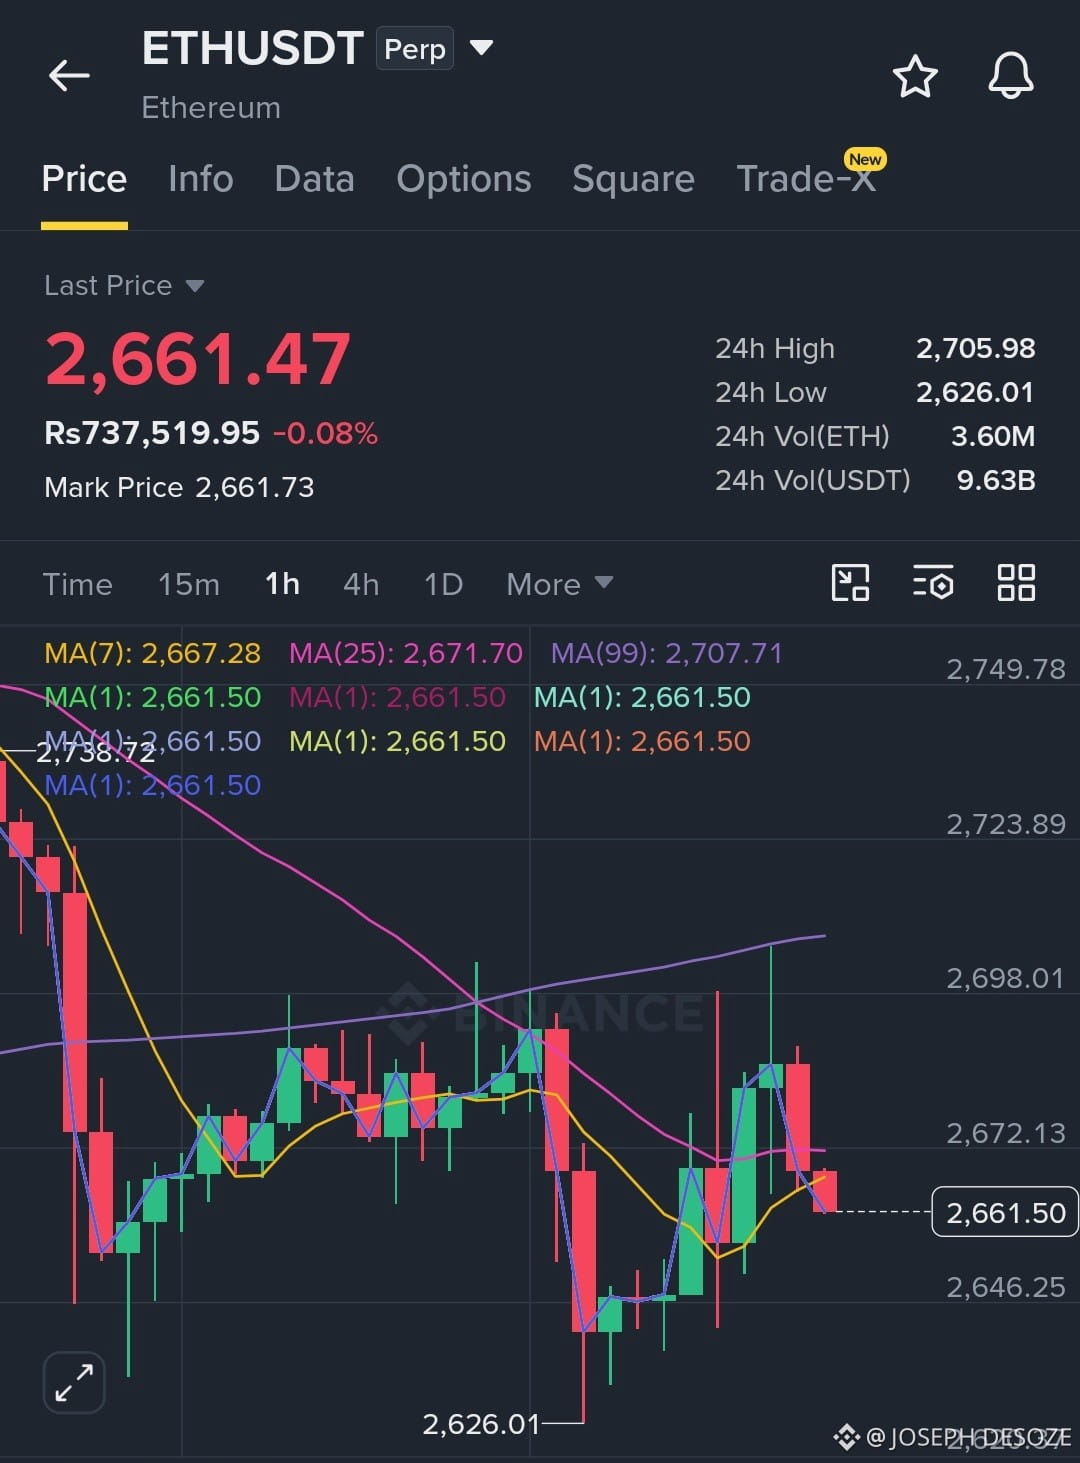
Nobody is talking about this hidden bullish setup forming on $ETH/USDT right now.
$ETH /USDT - LONG
Trade Plan:
Entry: 2662.48 – 2675.58
SL: 2606.18
TP1: 2716.17
TP2: 2747.60
TP3: 2794.74
Why this setup?
Debate:
Are we about to push to TP2 or is the invalidation level about to crush the longs?
⚠️ Personal market analysis only. NFA — manage risk and DYOR.
Educational content, not investment advice or a recommendation to buy, sell, deposit, or withdraw any asset. No paid promotion or referral/affiliate links.
{future}(ETHUSDT)
#Ethereum
Nobody is talking about this hidden bullish setup forming on $ETH /USDT right now.
$ETH /USDT - LONG
Trade Plan:
Entry: 2662.48 – 2675.58
SL: 2606.18
TP1: 2716.17
TP2: 2747.60
TP3: 2794.74
Why this setup?
Debate:
Are we about to push to TP2 or is the invalidation level about to crush the longs?
⚠️ Personal market analysis only. NFA — manage risk and DYOR.
Educational content, not investment advice or a recommendation to buy, sell, deposit, or withdraw any asset. No paid promotion or referral/affiliate links.
#Ethereum
$ETH /USDT - LONG
Trade Plan:
Entry: 2662.48 – 2675.58
SL: 2606.18
TP1: 2716.17
TP2: 2747.60
TP3: 2794.74
Why this setup?
Debate:
Are we about to push to TP2 or is the invalidation level about to crush the longs?
⚠️ Personal market analysis only. NFA — manage risk and DYOR.
Educational content, not investment advice or a recommendation to buy, sell, deposit, or withdraw any asset. No paid promotion or referral/affiliate links.
#Ethereum
322
Расталды
#binancewilllisthyperliquid(hype)
$HYPE on Binance feels bigger than just another listing.
What caught my attention isn’t the ticker appearing on a new exchange.
It’s the route HYPE took to get here.
Hyperliquid didn’t start by trying to become another exchange-listed token. The product came first. Traders came for the execution, liquidity and onchain perps. HYPE became attached to that ecosystem afterward.
Now Binance is putting the asset in front of a completely different pool of traders.
HYPE/USDT.
HYPE/USDC.
HYPE/TRY.
And Binance has given it the Seed Tag, which is a small detail worth noticing. It’s basically Binance saying: this is still an asset that deserves extra caution around volatility and risk.
That matters because the first reaction will probably be obvious:
“Binance listed HYPE.”
The more interesting question is what happens after the first-day attention disappears.
Does liquidity deepen?
Does spot demand persist?
Does activity around Hyperliquid continue without needing another narrative?
Because that’s where the distinction becomes important.
A centralized exchange can give HYPE access to millions of traders.
It cannot manufacture organic usage on Hyperliquid forever.
That part still has to come from the product.
And after watching HYPE for a while, that’s the detail I’d keep coming back to.
The Binance listing changes access.
Now we get to see what the market does with it.
#binancewilllisthyperliquid(hype)
$HYPE on Binance feels bigger than just another listing.
What caught my attention isn’t the ticker appearing on a new exchange.
It’s the route HYPE took to get here.
Hyperliquid didn’t start by trying to become another exchange-listed token. The product came first. Traders came for the execution, liquidity and onchain perps. HYPE became attached to that ecosystem afterward.
Now Binance is putting the asset in front of a completely different pool of traders.
HYPE/USDT.
HYPE/USDC.
HYPE/TRY.
And Binance has given it the Seed Tag, which is a small detail worth noticing. It’s basically Binance saying: this is still an asset that deserves extra caution around volatility and risk.
That matters because the first reaction will probably be obvious:
“Binance listed HYPE.”
The more interesting question is what happens after the first-day attention disappears.
Does liquidity deepen?
Does spot demand persist?
Does activity around Hyperliquid continue without needing another narrative?
Because that’s where the distinction becomes important.
A centralized exchange can give HYPE access to millions of traders.
It cannot manufacture organic usage on Hyperliquid forever.
That part still has to come from the product.
And after watching HYPE for a while, that’s the detail I’d keep coming back to.
The Binance listing changes access.
Now we get to see what the market does with it.
$HYPE on Binance feels bigger than just another listing.
What caught my attention isn’t the ticker appearing on a new exchange.
It’s the route HYPE took to get here.
Hyperliquid didn’t start by trying to become another exchange-listed token. The product came first. Traders came for the execution, liquidity and onchain perps. HYPE became attached to that ecosystem afterward.
Now Binance is putting the asset in front of a completely different pool of traders.
HYPE/USDT.
HYPE/USDC.
HYPE/TRY.
And Binance has given it the Seed Tag, which is a small detail worth noticing. It’s basically Binance saying: this is still an asset that deserves extra caution around volatility and risk.
That matters because the first reaction will probably be obvious:
“Binance listed HYPE.”
The more interesting question is what happens after the first-day attention disappears.
Does liquidity deepen?
Does spot demand persist?
Does activity around Hyperliquid continue without needing another narrative?
Because that’s where the distinction becomes important.
A centralized exchange can give HYPE access to millions of traders.
It cannot manufacture organic usage on Hyperliquid forever.
That part still has to come from the product.
And after watching HYPE for a while, that’s the detail I’d keep coming back to.
The Binance listing changes access.
Now we get to see what the market does with it.

1
1.1k
·
--
Жоғары (өспелі)
Everyone is about to miss the BNB move that is already forming right now.
$BNB /USDT - LONG
Trade Plan:
Entry: 765.5 – 768.9
SL: 750.9
TP1: 779.4
TP2: 787.6
TP3: 799.8
Why this setup?
Why now? The daily trend is bullish and the 1h price is sitting at 767.2, which is also the exact entry reference. The 15m RSI is at 43.91, meaning there is room for a push higher before any exhaustion. The 1h ATR of 6.801653 shows that each candle can move enough to reach the first target at 779.4 and the second target at 787.6. The entry zone between 765.5 and 768.9 is tight enough to give a clean risk-to-reward setup. The invalidation level is 756.9, and that is the hard line that protects the trade.
Debate:
Are we hitting TP2 at 787.6 or is 756.9 about to stop the move?
⚠️ Personal market analysis only. NFA — manage risk and DYOR.
Educational content, not investment advice or a recommendation to buy, sell, deposit, or withdraw any asset. No paid promotion or referral/affiliate links.
Everyone is about to miss the BNB move that is already forming right now.
$BNB /USDT - LONG
Trade Plan:
Entry: 765.5 – 768.9
SL: 750.9
TP1: 779.4
TP2: 787.6
TP3: 799.8
Why this setup?
Why now? The daily trend is bullish and the 1h price is sitting at 767.2, which is also the exact entry reference. The 15m RSI is at 43.91, meaning there is room for a push higher before any exhaustion. The 1h ATR of 6.801653 shows that each candle can move enough to reach the first target at 779.4 and the second target at 787.6. The entry zone between 765.5 and 768.9 is tight enough to give a clean risk-to-reward setup. The invalidation level is 756.9, and that is the hard line that protects the trade.
Debate:
Are we hitting TP2 at 787.6 or is 756.9 about to stop the move?
⚠️ Personal market analysis only. NFA — manage risk and DYOR.
Educational content, not investment advice or a recommendation to buy, sell, deposit, or withdraw any asset. No paid promotion or referral/affiliate links.
$BNB /USDT - LONG
Trade Plan:
Entry: 765.5 – 768.9
SL: 750.9
TP1: 779.4
TP2: 787.6
TP3: 799.8
Why this setup?
Why now? The daily trend is bullish and the 1h price is sitting at 767.2, which is also the exact entry reference. The 15m RSI is at 43.91, meaning there is room for a push higher before any exhaustion. The 1h ATR of 6.801653 shows that each candle can move enough to reach the first target at 779.4 and the second target at 787.6. The entry zone between 765.5 and 768.9 is tight enough to give a clean risk-to-reward setup. The invalidation level is 756.9, and that is the hard line that protects the trade.
Debate:
Are we hitting TP2 at 787.6 or is 756.9 about to stop the move?
⚠️ Personal market analysis only. NFA — manage risk and DYOR.
Educational content, not investment advice or a recommendation to buy, sell, deposit, or withdraw any asset. No paid promotion or referral/affiliate links.
83
·
--
Жоғары (өспелі)
Why is everyone ignoring the short setup forming on $MU/USDT right now?
$MU /USDT - SHORT
Trade Plan:
Entry: 1069.6 – 1074.2
SL: 1094.3
TP1: 1055.1
TP2: 1043.9
TP3: 1027.1
Why this setup?
Debate:
Are we hitting TP2 at 1043.9 or getting trapped before the invalidation at 1028.8?
⚠️ Personal market analysis only. NFA — manage risk and DYOR.
Educational content, not investment advice or a recommendation to buy, sell, deposit, or withdraw any asset. No paid promotion or referral/affiliate links.
{future}(MUUSDT)
Why is everyone ignoring the short setup forming on $MU /USDT right now?
$MU /USDT - SHORT
Trade Plan:
Entry: 1069.6 – 1074.2
SL: 1094.3
TP1: 1055.1
TP2: 1043.9
TP3: 1027.1
Why this setup?
Debate:
Are we hitting TP2 at 1043.9 or getting trapped before the invalidation at 1028.8?
⚠️ Personal market analysis only. NFA — manage risk and DYOR.
Educational content, not investment advice or a recommendation to buy, sell, deposit, or withdraw any asset. No paid promotion or referral/affiliate links.
$MU /USDT - SHORT
Trade Plan:
Entry: 1069.6 – 1074.2
SL: 1094.3
TP1: 1055.1
TP2: 1043.9
TP3: 1027.1
Why this setup?
Debate:
Are we hitting TP2 at 1043.9 or getting trapped before the invalidation at 1028.8?
⚠️ Personal market analysis only. NFA — manage risk and DYOR.
Educational content, not investment advice or a recommendation to buy, sell, deposit, or withdraw any asset. No paid promotion or referral/affiliate links.
294
·
--
Жоғары (өспелі)
Why is $XAG/USDT holding the entry zone like a secret nobody has noticed yet?
$XAG /USDT - LONG
Trade Plan:
Entry: 64.37 – 64.57
SL: 63.22
TP1: 65.40
TP2: 66.03
TP3: 66.96
Why this setup?
Why now? The 1h price is pinned at 64.47 inside a tight daily range, which means the market is coiled and waiting for a catalyst. The 15m RSI sits at 39.43, showing enough bearish exhaustion to favor a reversal higher without being overbought. The 1h ATR of 0.39913 proves volatility is compressed, so a breakout from this entry zone between 64.37 and 64.57 could be explosive. Target TP1 at 65.40 and TP2 at 66.03 offer a clean measured move, but the line in the sand is invalid at 65.38, because anything above that destroys the entire setup.
Debate:
Are we about to blow past TP2 at 66.03 or is 65.38 going to send this straight into the alt trade?
⚠️ Personal market analysis only. NFA — manage risk and DYOR.
Educational content, not investment advice or a recommendation to buy, sell, deposit, or withdraw any asset. No paid promotion or referral/affiliate links.
{future}(XAGUSDT)
Why is $XAG /USDT holding the entry zone like a secret nobody has noticed yet?
$XAG /USDT - LONG
Trade Plan:
Entry: 64.37 – 64.57
SL: 63.22
TP1: 65.40
TP2: 66.03
TP3: 66.96
Why this setup?
Why now? The 1h price is pinned at 64.47 inside a tight daily range, which means the market is coiled and waiting for a catalyst. The 15m RSI sits at 39.43, showing enough bearish exhaustion to favor a reversal higher without being overbought. The 1h ATR of 0.39913 proves volatility is compressed, so a breakout from this entry zone between 64.37 and 64.57 could be explosive. Target TP1 at 65.40 and TP2 at 66.03 offer a clean measured move, but the line in the sand is invalid at 65.38, because anything above that destroys the entire setup.
Debate:
Are we about to blow past TP2 at 66.03 or is 65.38 going to send this straight into the alt trade?
⚠️ Personal market analysis only. NFA — manage risk and DYOR.
Educational content, not investment advice or a recommendation to buy, sell, deposit, or withdraw any asset. No paid promotion or referral/affiliate links.
$XAG /USDT - LONG
Trade Plan:
Entry: 64.37 – 64.57
SL: 63.22
TP1: 65.40
TP2: 66.03
TP3: 66.96
Why this setup?
Why now? The 1h price is pinned at 64.47 inside a tight daily range, which means the market is coiled and waiting for a catalyst. The 15m RSI sits at 39.43, showing enough bearish exhaustion to favor a reversal higher without being overbought. The 1h ATR of 0.39913 proves volatility is compressed, so a breakout from this entry zone between 64.37 and 64.57 could be explosive. Target TP1 at 65.40 and TP2 at 66.03 offer a clean measured move, but the line in the sand is invalid at 65.38, because anything above that destroys the entire setup.
Debate:
Are we about to blow past TP2 at 66.03 or is 65.38 going to send this straight into the alt trade?
⚠️ Personal market analysis only. NFA — manage risk and DYOR.
Educational content, not investment advice or a recommendation to buy, sell, deposit, or withdraw any asset. No paid promotion or referral/affiliate links.
246
·
--
Төмен (кемімелі)
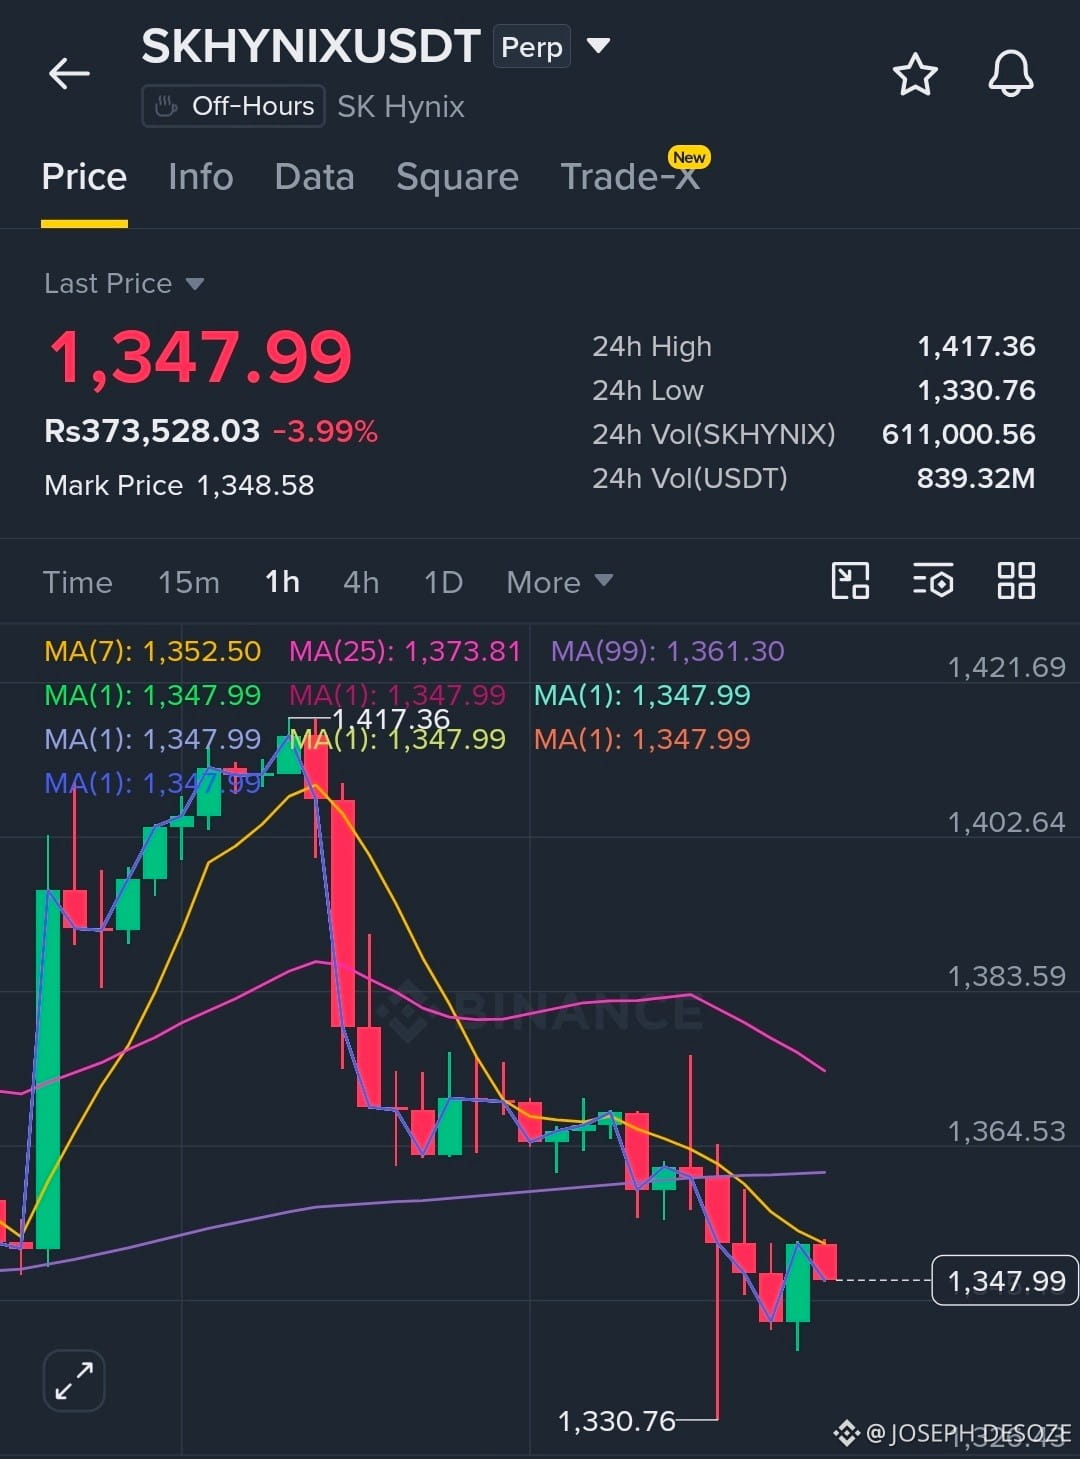
Everyone watching $SKHYNIX/USDT for a breakout is about to get blindsided.
$SKHYNIX /USDT - SHORT
Trade Plan:
Entry: 1346.79 – 1353.37
SL: 1381.63
TP1: 1326.42
TP2: 1310.64
TP3: 1286.98
Why this setup?
Why now? The daily trend is range, which often precedes a sharp move once a boundary breaks. The 1h price sits at 1350.08, exactly at the entry reference level where the setup is armed. The 15m RSI reads 46.83, showing just enough bearish lean to favor the short without being overextended. The 1h ATR of 13.145382 confirms enough volatility to reach the first target of 1326.42 and potentially push toward the second target at 1310.64. The line in the sand is 1356.41; a breach there destroys the entire trade structure.
Debate:
Are we hitting TP2 or getting trapped?
⚠️ Personal market analysis only. NFA — manage risk and DYOR.
Educational content, not investment advice or a recommendation to buy, sell, deposit, or withdraw any asset. No paid promotion or referral/affiliate links.
{future}(SKHYNIXUSDT)
#AIStocksWhatNext #BCHJumps28%OnCMEFuturesListing #WallStreetEarningsRevisionsTurnBearish #DollarIndexReclaims101 #21SharesLaunchesEuropesFirstZcashETP
Everyone watching $SKHYNIX /USDT for a breakout is about to get blindsided.
$SKHYNIX /USDT - SHORT
Trade Plan:
Entry: 1346.79 – 1353.37
SL: 1381.63
TP1: 1326.42
TP2: 1310.64
TP3: 1286.98
Why this setup?
Why now? The daily trend is range, which often precedes a sharp move once a boundary breaks. The 1h price sits at 1350.08, exactly at the entry reference level where the setup is armed. The 15m RSI reads 46.83, showing just enough bearish lean to favor the short without being overextended. The 1h ATR of 13.145382 confirms enough volatility to reach the first target of 1326.42 and potentially push toward the second target at 1310.64. The line in the sand is 1356.41; a breach there destroys the entire trade structure.
Debate:
Are we hitting TP2 or getting trapped?
⚠️ Personal market analysis only. NFA — manage risk and DYOR.
Educational content, not investment advice or a recommendation to buy, sell, deposit, or withdraw any asset. No paid promotion or referral/affiliate links.
#AIStocksWhatNext #BCHJumps28%OnCMEFuturesListing #WallStreetEarningsRevisionsTurnBearish #DollarIndexReclaims101 #21SharesLaunchesEuropesFirstZcashETP
$SKHYNIX /USDT - SHORT
Trade Plan:
Entry: 1346.79 – 1353.37
SL: 1381.63
TP1: 1326.42
TP2: 1310.64
TP3: 1286.98
Why this setup?
Why now? The daily trend is range, which often precedes a sharp move once a boundary breaks. The 1h price sits at 1350.08, exactly at the entry reference level where the setup is armed. The 15m RSI reads 46.83, showing just enough bearish lean to favor the short without being overextended. The 1h ATR of 13.145382 confirms enough volatility to reach the first target of 1326.42 and potentially push toward the second target at 1310.64. The line in the sand is 1356.41; a breach there destroys the entire trade structure.
Debate:
Are we hitting TP2 or getting trapped?
⚠️ Personal market analysis only. NFA — manage risk and DYOR.
Educational content, not investment advice or a recommendation to buy, sell, deposit, or withdraw any asset. No paid promotion or referral/affiliate links.
#AIStocksWhatNext #BCHJumps28%OnCMEFuturesListing #WallStreetEarningsRevisionsTurnBearish #DollarIndexReclaims101 #21SharesLaunchesEuropesFirstZcashETP
1
304
·
--
Жоғары (өспелі)
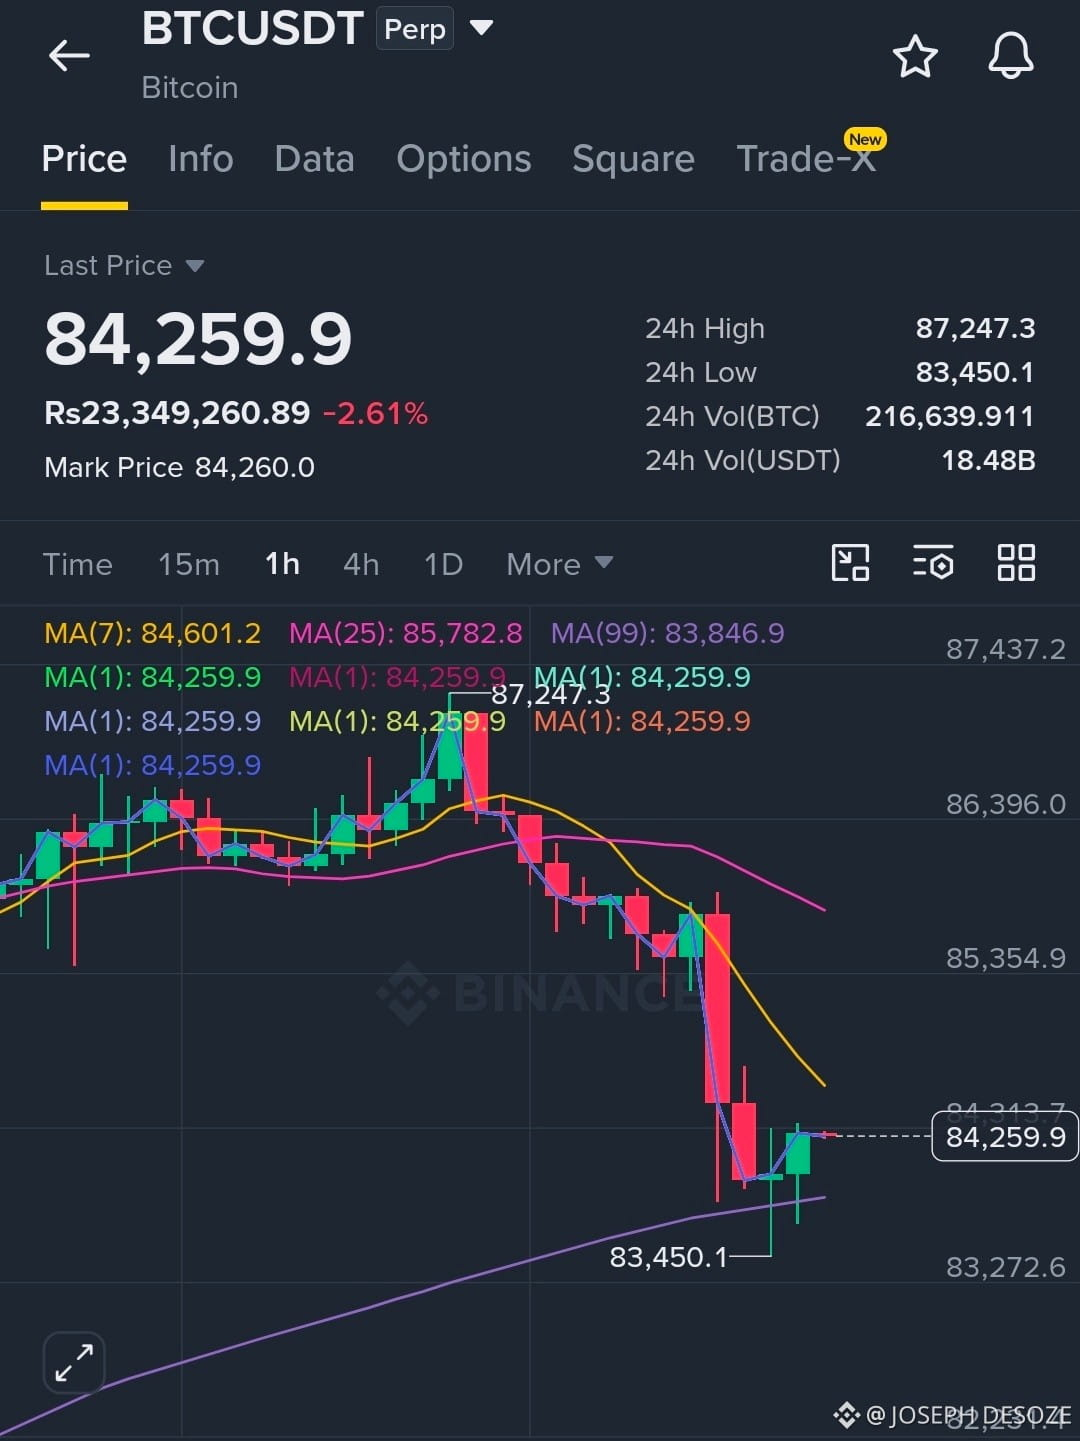
Nobody is talking about this SYMBOL setup hiding in plain sight.
$BTC /USDT - LONG
Trade Plan:
Entry: 84096.4 – 84398.4
SL: 82798.1
TP1: 85334.4
TP2: 86059.0
TP3: 87146.0
Why this setup?
Why now? The 1d trend is bullish and the 15m RSI sits at 35.97, meaning the short-term pullback has room to recover before momentum fades. The 1h ATR of 603.88 confirms volatile expansion, giving the trade enough runway to breathe. The entry zone around 84247.4 sits on the 1h price action, with TP1 at 85334.4 and TP2 at 86059.0 offering stacked targets that align with the higher-timeframe move. The invalidation level at 81396.0 is the absolute line in the sand that protects the position if the structure breaks.
Debate:
Are we hitting TP2 or getting trapped at the invalidation?
⚠️ Personal market analysis only. NFA — manage risk and DYOR.
Educational content, not investment advice or a recommendation to buy, sell, deposit, or withdraw any asset. No paid promotion or referral/affiliate links.
{future}(BTCUSDT)
#BTC
Nobody is talking about this SYMBOL setup hiding in plain sight.
$BTC /USDT - LONG
Trade Plan:
Entry: 84096.4 – 84398.4
SL: 82798.1
TP1: 85334.4
TP2: 86059.0
TP3: 87146.0
Why this setup?
Why now? The 1d trend is bullish and the 15m RSI sits at 35.97, meaning the short-term pullback has room to recover before momentum fades. The 1h ATR of 603.88 confirms volatile expansion, giving the trade enough runway to breathe. The entry zone around 84247.4 sits on the 1h price action, with TP1 at 85334.4 and TP2 at 86059.0 offering stacked targets that align with the higher-timeframe move. The invalidation level at 81396.0 is the absolute line in the sand that protects the position if the structure breaks.
Debate:
Are we hitting TP2 or getting trapped at the invalidation?
⚠️ Personal market analysis only. NFA — manage risk and DYOR.
Educational content, not investment advice or a recommendation to buy, sell, deposit, or withdraw any asset. No paid promotion or referral/affiliate links.
#BTC
$BTC /USDT - LONG
Trade Plan:
Entry: 84096.4 – 84398.4
SL: 82798.1
TP1: 85334.4
TP2: 86059.0
TP3: 87146.0
Why this setup?
Why now? The 1d trend is bullish and the 15m RSI sits at 35.97, meaning the short-term pullback has room to recover before momentum fades. The 1h ATR of 603.88 confirms volatile expansion, giving the trade enough runway to breathe. The entry zone around 84247.4 sits on the 1h price action, with TP1 at 85334.4 and TP2 at 86059.0 offering stacked targets that align with the higher-timeframe move. The invalidation level at 81396.0 is the absolute line in the sand that protects the position if the structure breaks.
Debate:
Are we hitting TP2 or getting trapped at the invalidation?
⚠️ Personal market analysis only. NFA — manage risk and DYOR.
Educational content, not investment advice or a recommendation to buy, sell, deposit, or withdraw any asset. No paid promotion or referral/affiliate links.
#BTC
121
·
--
Жоғары (өспелі)
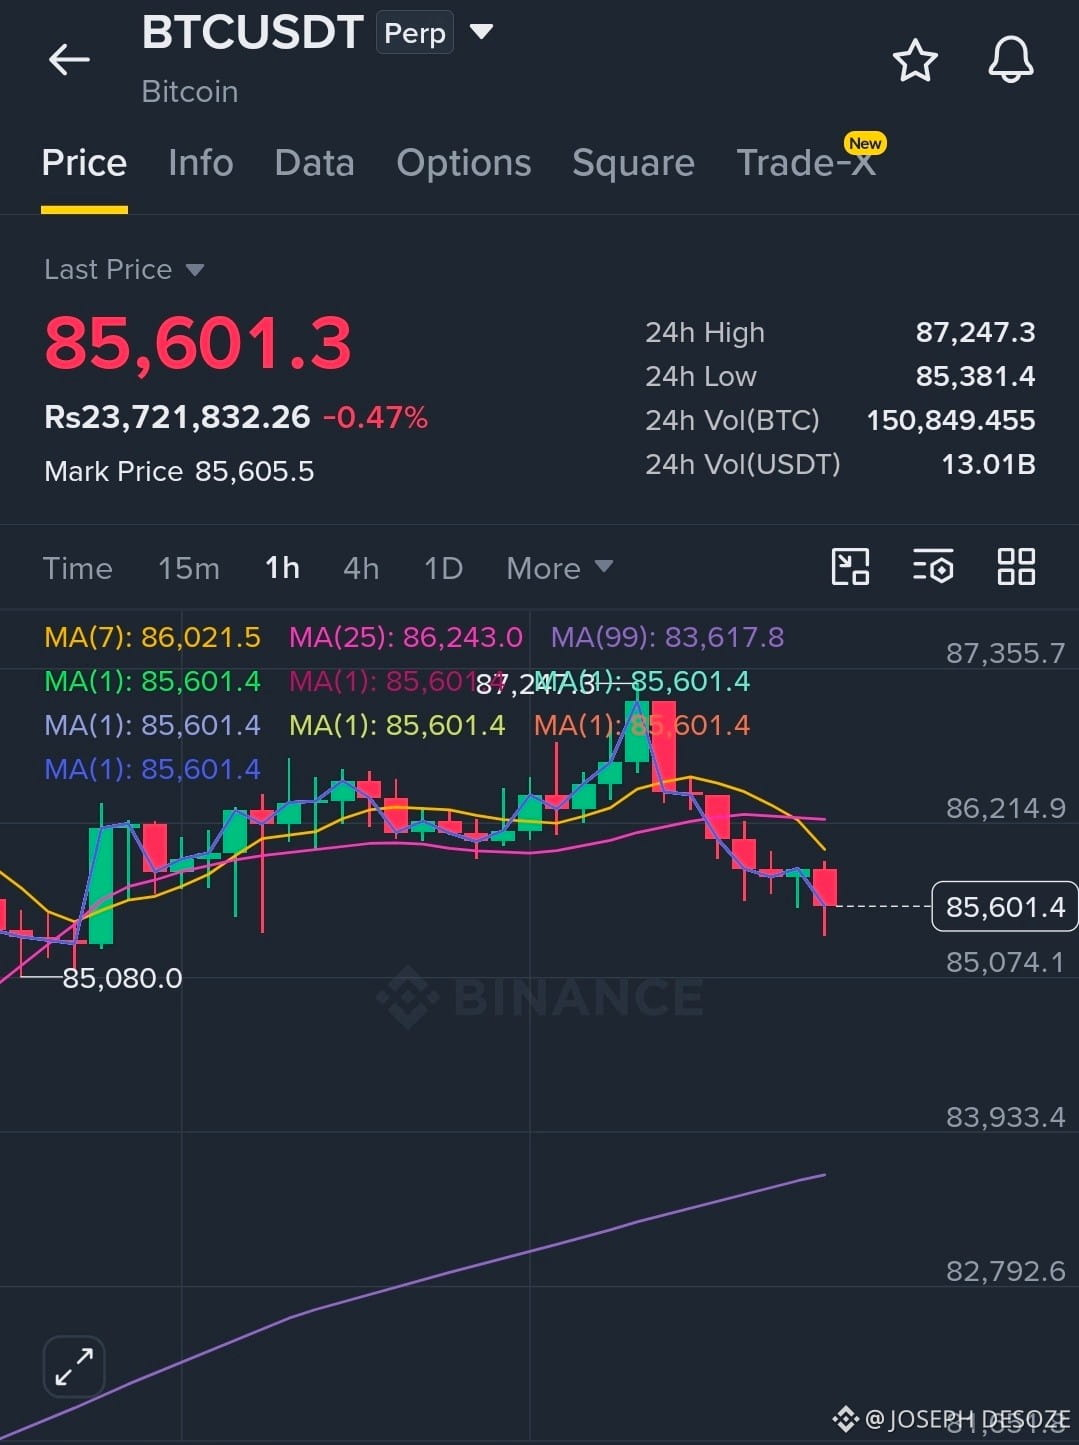
Most traders are about to miss a rare long setup on $BTC/USDT.
$BTC /USDT - LONG
Trade Plan:
Entry: 85314.8 – 85555.8
SL: 84278.1
TP1: 86303.2
TP2: 86881.8
TP3: 87749.8
Why this setup?
Why now? The daily trend is bullish, the 1h price sits at 85435.3, and the 15m RSI has dropped to 29.31, signaling a potential reversal into a long entry. The 1h ATR of 482.18 shows the current volatility is compressed enough for a decisive move. The entry zone between 85314.8 and 85555.8 defines the exact risk window, while TP1 at 86303.2 and TP2 at 86881.8 offer two clear profit targets. The invalidation level at 81237.3 is the absolute line in the sand that protects the trade.
Debate:
Are we hitting TP2 or getting trapped at the daily trend line?
⚠️ Personal market analysis only. NFA — manage risk and DYOR.
Educational content, not investment advice or a recommendation to buy, sell, deposit, or withdraw any asset. No paid promotion or referral/affiliate links.
{future}(BTCUSDT)
#BTC
Most traders are about to miss a rare long setup on $BTC /USDT.
$BTC /USDT - LONG
Trade Plan:
Entry: 85314.8 – 85555.8
SL: 84278.1
TP1: 86303.2
TP2: 86881.8
TP3: 87749.8
Why this setup?
Why now? The daily trend is bullish, the 1h price sits at 85435.3, and the 15m RSI has dropped to 29.31, signaling a potential reversal into a long entry. The 1h ATR of 482.18 shows the current volatility is compressed enough for a decisive move. The entry zone between 85314.8 and 85555.8 defines the exact risk window, while TP1 at 86303.2 and TP2 at 86881.8 offer two clear profit targets. The invalidation level at 81237.3 is the absolute line in the sand that protects the trade.
Debate:
Are we hitting TP2 or getting trapped at the daily trend line?
⚠️ Personal market analysis only. NFA — manage risk and DYOR.
Educational content, not investment advice or a recommendation to buy, sell, deposit, or withdraw any asset. No paid promotion or referral/affiliate links.
#BTC
$BTC /USDT - LONG
Trade Plan:
Entry: 85314.8 – 85555.8
SL: 84278.1
TP1: 86303.2
TP2: 86881.8
TP3: 87749.8
Why this setup?
Why now? The daily trend is bullish, the 1h price sits at 85435.3, and the 15m RSI has dropped to 29.31, signaling a potential reversal into a long entry. The 1h ATR of 482.18 shows the current volatility is compressed enough for a decisive move. The entry zone between 85314.8 and 85555.8 defines the exact risk window, while TP1 at 86303.2 and TP2 at 86881.8 offer two clear profit targets. The invalidation level at 81237.3 is the absolute line in the sand that protects the trade.
Debate:
Are we hitting TP2 or getting trapped at the daily trend line?
⚠️ Personal market analysis only. NFA — manage risk and DYOR.
Educational content, not investment advice or a recommendation to buy, sell, deposit, or withdraw any asset. No paid promotion or referral/affiliate links.
#BTC
116
·
--
Төмен (кемімелі)
Insiders are fading the bounce on SYMBOL right now.
$BCH /USDT - SHORT
Trade Plan:
Entry: 348.1 – 353.7
SL: 385.4
TP1: 325.0
TP2: 307.8
TP3: 281.9
Why this setup?
Why now? The 1h price sits at 350.9 inside a tight entry zone, while the daily trend remains range-bound, setting up a low-risk short. The 15m RSI reads 49.89, showing neither overbought nor oversold exhaustion but neutral drift that favors a breakdown. The 1h ATR of 11.061712 confirms enough volatility to push the market from the entry zone toward the first target at 325.0 and the second target at 307.8. The invalidation level sits at 271.1, which is the hard line below which this entire directional thesis collapses.
Debate:
Are we hitting TP2 at 307.8 or getting trapped before the invalidation at 271.1?
⚠️ Personal market analysis only. NFA — manage risk and DYOR.
Educational content, not investment advice or a recommendation to buy, sell, deposit, or withdraw any asset. No paid promotion or referral/affiliate links.
{future}(BCHUSDT)
Insiders are fading the bounce on SYMBOL right now.
$BCH /USDT - SHORT
Trade Plan:
Entry: 348.1 – 353.7
SL: 385.4
TP1: 325.0
TP2: 307.8
TP3: 281.9
Why this setup?
Why now? The 1h price sits at 350.9 inside a tight entry zone, while the daily trend remains range-bound, setting up a low-risk short. The 15m RSI reads 49.89, showing neither overbought nor oversold exhaustion but neutral drift that favors a breakdown. The 1h ATR of 11.061712 confirms enough volatility to push the market from the entry zone toward the first target at 325.0 and the second target at 307.8. The invalidation level sits at 271.1, which is the hard line below which this entire directional thesis collapses.
Debate:
Are we hitting TP2 at 307.8 or getting trapped before the invalidation at 271.1?
⚠️ Personal market analysis only. NFA — manage risk and DYOR.
Educational content, not investment advice or a recommendation to buy, sell, deposit, or withdraw any asset. No paid promotion or referral/affiliate links.
$BCH /USDT - SHORT
Trade Plan:
Entry: 348.1 – 353.7
SL: 385.4
TP1: 325.0
TP2: 307.8
TP3: 281.9
Why this setup?
Why now? The 1h price sits at 350.9 inside a tight entry zone, while the daily trend remains range-bound, setting up a low-risk short. The 15m RSI reads 49.89, showing neither overbought nor oversold exhaustion but neutral drift that favors a breakdown. The 1h ATR of 11.061712 confirms enough volatility to push the market from the entry zone toward the first target at 325.0 and the second target at 307.8. The invalidation level sits at 271.1, which is the hard line below which this entire directional thesis collapses.
Debate:
Are we hitting TP2 at 307.8 or getting trapped before the invalidation at 271.1?
⚠️ Personal market analysis only. NFA — manage risk and DYOR.
Educational content, not investment advice or a recommendation to buy, sell, deposit, or withdraw any asset. No paid promotion or referral/affiliate links.
123
·
--
Жоғары (өспелі)
📊 *Signal Update*
*Pair:* $PENGU USDT
*Direction:* LONG
*Leverage:* Cross 20X
*Entry:* 0.01068— 0.01046
🎯 *TP1:* 0.01091
🎯 *TP2:* 0.01117
🎯 *TP3:* 0.01180
🛡 *SL:* 0.09832
{future}(PENGUUSDT)
📊 *Signal Update*
*Pair:* $PENGU USDT
*Direction:* LONG
*Leverage:* Cross 20X
*Entry:* 0.01068— 0.01046
🎯 *TP1:* 0.01091
🎯 *TP2:* 0.01117
🎯 *TP3:* 0.01180
🛡 *SL:* 0.09832
*Pair:* $PENGU USDT
*Direction:* LONG
*Leverage:* Cross 20X
*Entry:* 0.01068— 0.01046
🎯 *TP1:* 0.01091
🎯 *TP2:* 0.01117
🎯 *TP3:* 0.01180
🛡 *SL:* 0.09832
139
·
--
Жоғары (өспелі)
$ENA /USDT is quietly coiling for a breakout most traders will miss.
$ENA/USDT - LONG
Trade Plan:
Entry: 0.2059 – 0.2091
SL: 0.1925
TP1: 0.2187
TP2: 0.2262
TP3: 0.2374
Why this setup?
Why now? The daily trend is bullish and the 1h price sits at 0.2073, just below the entry reference of 0.2075, setting up a precise LONG setup. The 15m RSI at 44.45 shows room for a bullish push before overbought, while the 1h ATR of 0.006235 tells us the next leg could easily clear the TP1 of 0.2187. With TP2 at 0.2262 and TP3 at 0.2374, the reward profile is stacked, but the invalidation level of 0.1780 acts as the hard line in the sand that protects the trade.
Debate:
Are we hitting TP2 or getting trapped?
⚠️ Personal market analysis only. NFA — manage risk and DYOR.
Educational content, not investment advice or a recommendation to buy, sell, deposit, or withdraw any asset. No paid promotion or referral/affiliate links.
{future}(ENAUSDT)
$ENA /USDT is quietly coiling for a breakout most traders will miss.
$ENA /USDT - LONG
Trade Plan:
Entry: 0.2059 – 0.2091
SL: 0.1925
TP1: 0.2187
TP2: 0.2262
TP3: 0.2374
Why this setup?
Why now? The daily trend is bullish and the 1h price sits at 0.2073, just below the entry reference of 0.2075, setting up a precise LONG setup. The 15m RSI at 44.45 shows room for a bullish push before overbought, while the 1h ATR of 0.006235 tells us the next leg could easily clear the TP1 of 0.2187. With TP2 at 0.2262 and TP3 at 0.2374, the reward profile is stacked, but the invalidation level of 0.1780 acts as the hard line in the sand that protects the trade.
Debate:
Are we hitting TP2 or getting trapped?
⚠️ Personal market analysis only. NFA — manage risk and DYOR.
Educational content, not investment advice or a recommendation to buy, sell, deposit, or withdraw any asset. No paid promotion or referral/affiliate links.
$ENA /USDT - LONG
Trade Plan:
Entry: 0.2059 – 0.2091
SL: 0.1925
TP1: 0.2187
TP2: 0.2262
TP3: 0.2374
Why this setup?
Why now? The daily trend is bullish and the 1h price sits at 0.2073, just below the entry reference of 0.2075, setting up a precise LONG setup. The 15m RSI at 44.45 shows room for a bullish push before overbought, while the 1h ATR of 0.006235 tells us the next leg could easily clear the TP1 of 0.2187. With TP2 at 0.2262 and TP3 at 0.2374, the reward profile is stacked, but the invalidation level of 0.1780 acts as the hard line in the sand that protects the trade.
Debate:
Are we hitting TP2 or getting trapped?
⚠️ Personal market analysis only. NFA — manage risk and DYOR.
Educational content, not investment advice or a recommendation to buy, sell, deposit, or withdraw any asset. No paid promotion or referral/affiliate links.
281
Көбірек контент көру үшін кіріңіз
Binance Square платформасында әлемдік криптоқоғамдастыққа қосылыңыз
⚡️ Криптовалюта туралы ең соңғы және пайдалы ақпаратты алыңыз.
💬 Әлемдегі ең ірі криптобиржаның сеніміне ие.
👍 Расталған авторлардың нақты пікірлерін табыңыз.
Электрондық пошта/телефон нөмірі
Трендтегі тақырыптар
ZcashETFPostsFirstWeeklyOutflow$93.6M
30,251 рет көрілді
90 адам талқылап жатыр
#ZcashETFPostsFirstWeeklyOutflow$93.6M
🚨🚨🚨🚨🚨🚨🚨🚨🚨🚨🚨🚨🚨🚨✅ 🚨 ZCASH ETF FLOWS TURN NEGATIVE FOR THE FIRST TIME! 📉
$ZEC is facing a notable shift in institutional fund flows, with Zcash investment products recording their first weekly net outflow since launching in August.
According to fund-flow data, around $93.6M was withdrawn from Zcash products during the latest week, while ZEC price action also cooled significantly.
📊 WHAT HAPPENED?
• Weekly Zcash ETF outflow: $93.6M
• September 30 daily outflow: $30.25M
• ZCSH previously attracted around $98.2M in one week
• ZEC is trading near $1,300
• Recent high: around $1,690
• Weekly decline: roughly 17%+
🔍 LEVELS TO WATCH
🟢 Support: $1,280–$1,300
🔴 Resistance: $1,450–$1,500
The key question now is whether the $1,300 area can hold and attract fresh buyers.
Institutional flows will also be important. A return of consistent positive inflows could signal renewed confidence, while continued outflows may keep pressure on $ZEC .
👀 Is this simply profit-taking after ZEC’s huge rally, or could we see another deeper pullback before buyers return?
Share your view below. 👇
#Zcash #ZEC #ZcashETF #Crypto
#analysis
owhggwiohsjowve
·0 лайк
·140 рет көрілді
GreekPoliceBustCryptoScamRingArrest17
56,076 рет көрілді
572 адам талқылап жатыр
BitcoinRejectedAt$87K
112,588 рет көрілді
150 адам талқылап жатыр