
#tradingtips
tradingtips
10.1M рет көрілді
25,724 адам талқылап жатыр
Қызу саудада
Ең соңғы

·
--
Your stop on $SEI at $0.04454 is closer than the hourly noise
Most traders pick an arbitrary percentage loss and call that a risk plan
That is a bad habit because the market does not care about your math
Take $SEI sitting right here at $0.04489 with an hourly swing of 0.6 percent
If you tuck your stop just under the recent low of $0.04454 you get clipped instantly by routine chop
A proper stop belongs below the structural level that completely breaks your trade thesis
Where do you normally set your exit when the chart starts shaking
#SEI #TradingTips
Your stop on $SEI at $0.04454 is closer than the hourly noise
Most traders pick an arbitrary percentage loss and call that a risk plan
That is a bad habit because the market does not care about your math
Take $SEI sitting right here at $0.04489 with an hourly swing of 0.6 percent
If you tuck your stop just under the recent low of $0.04454 you get clipped instantly by routine chop
A proper stop belongs below the structural level that completely breaks your trade thesis
Where do you normally set your exit when the chart starts shaking
#SEI #TradingTips
Most traders pick an arbitrary percentage loss and call that a risk plan
That is a bad habit because the market does not care about your math
Take $SEI sitting right here at $0.04489 with an hourly swing of 0.6 percent
If you tuck your stop just under the recent low of $0.04454 you get clipped instantly by routine chop
A proper stop belongs below the structural level that completely breaks your trade thesis
Where do you normally set your exit when the chart starts shaking
#SEI #TradingTips
15
·
--
$ICP moves 0.6 percent an hour. Most people size it like a stablecoin
Trade size is not about how much cash you want to put in. It is about where your stop goes and what you are willing to lose
Imagine your account is 1000 dollars and you want to risk 1 percent of that total. That is 10 dollars of risk
The 1h ATR on $ICP is 0.6 percent right now which sits at about 0.014 dollars away from the current 2.3840 price
If you put your stop one ATR away at 2.3700 you divide your 10 dollar risk by that 0.014 dollar distance
That math gives you a position of about 714 coins
If the price drops to 2.3730 which matches the recent swing low you lose your exact 10 dollars and nothing more
Figure out your risk dollar amount first before you touch any trade buttons
How do you usually set your stops on volatile moves
#ICP #TradingTips
$ICP moves 0.6 percent an hour. Most people size it like a stablecoin
Trade size is not about how much cash you want to put in. It is about where your stop goes and what you are willing to lose
Imagine your account is 1000 dollars and you want to risk 1 percent of that total. That is 10 dollars of risk
The 1h ATR on $ICP is 0.6 percent right now which sits at about 0.014 dollars away from the current 2.3840 price
If you put your stop one ATR away at 2.3700 you divide your 10 dollar risk by that 0.014 dollar distance
That math gives you a position of about 714 coins
If the price drops to 2.3730 which matches the recent swing low you lose your exact 10 dollars and nothing more
Figure out your risk dollar amount first before you touch any trade buttons
How do you usually set your stops on volatile moves
#ICP #TradingTips
Trade size is not about how much cash you want to put in. It is about where your stop goes and what you are willing to lose
Imagine your account is 1000 dollars and you want to risk 1 percent of that total. That is 10 dollars of risk
The 1h ATR on $ICP is 0.6 percent right now which sits at about 0.014 dollars away from the current 2.3840 price
If you put your stop one ATR away at 2.3700 you divide your 10 dollar risk by that 0.014 dollar distance
That math gives you a position of about 714 coins
If the price drops to 2.3730 which matches the recent swing low you lose your exact 10 dollars and nothing more
Figure out your risk dollar amount first before you touch any trade buttons
How do you usually set your stops on volatile moves
#ICP #TradingTips
5


·
--
$PEPE - Meme strength while majors stall often signals retail chasing, not conviction.
Volume under 25M USDT on a 2% pop means thin liquidity - easy to trap late buyers when BTC decides direction.
Live example: $PEPE +2.2% on 21.8M USDT volume.
Tape now: $BTC 75,977 USDT (+0.1%) · $ETH 2,238 USDT (-0.3%)
#TradingTips #RiskManagement
$PEPE - Meme strength while majors stall often signals retail chasing, not conviction.
Volume under 25M USDT on a 2% pop means thin liquidity - easy to trap late buyers when BTC decides direction.
Live example: $PEPE +2.2% on 21.8M USDT volume.
Tape now: $BTC 75,977 USDT (+0.1%) · $ETH 2,238 USDT (-0.3%)
#TradingTips #RiskManagement
Volume under 25M USDT on a 2% pop means thin liquidity - easy to trap late buyers when BTC decides direction.
Live example: $PEPE +2.2% on 21.8M USDT volume.
Tape now: $BTC 75,977 USDT (+0.1%) · $ETH 2,238 USDT (-0.3%)
#TradingTips #RiskManagement
1
159
·
--
$HFT is up 6.3 percent right now and you need to see who is selling
Most retail traders pile in when they see a green candle without checking the math
Look at the daily range on $HFT where the high reached 0.009999 dollars earlier today
Right now the price sits at 0.007110 dollars which is only 28 percent up from the 24 hour low
That means anyone who bought the actual bottom is dumping their bags straight into your market order
Volume spiked to 2.3 million dollars which is 4.4 times the weekly average giving them plenty of liquidity to exit
You are not buying strength when you chase a top gainer you are just paying someone else to leave their trade
Always check where price sits in the daily range before buying so you never become the exit liquidity
What is your exact checklist for ignoring a pumped chart
#HFT #TradingTips
$HFT is up 6.3 percent right now and you need to see who is selling
Most retail traders pile in when they see a green candle without checking the math
Look at the daily range on $HFT where the high reached 0.009999 dollars earlier today
Right now the price sits at 0.007110 dollars which is only 28 percent up from the 24 hour low
That means anyone who bought the actual bottom is dumping their bags straight into your market order
Volume spiked to 2.3 million dollars which is 4.4 times the weekly average giving them plenty of liquidity to exit
You are not buying strength when you chase a top gainer you are just paying someone else to leave their trade
Always check where price sits in the daily range before buying so you never become the exit liquidity
What is your exact checklist for ignoring a pumped chart
#HFT #TradingTips
Most retail traders pile in when they see a green candle without checking the math
Look at the daily range on $HFT where the high reached 0.009999 dollars earlier today
Right now the price sits at 0.007110 dollars which is only 28 percent up from the 24 hour low
That means anyone who bought the actual bottom is dumping their bags straight into your market order
Volume spiked to 2.3 million dollars which is 4.4 times the weekly average giving them plenty of liquidity to exit
You are not buying strength when you chase a top gainer you are just paying someone else to leave their trade
Always check where price sits in the daily range before buying so you never become the exit liquidity
What is your exact checklist for ignoring a pumped chart
#HFT #TradingTips
1

·
--
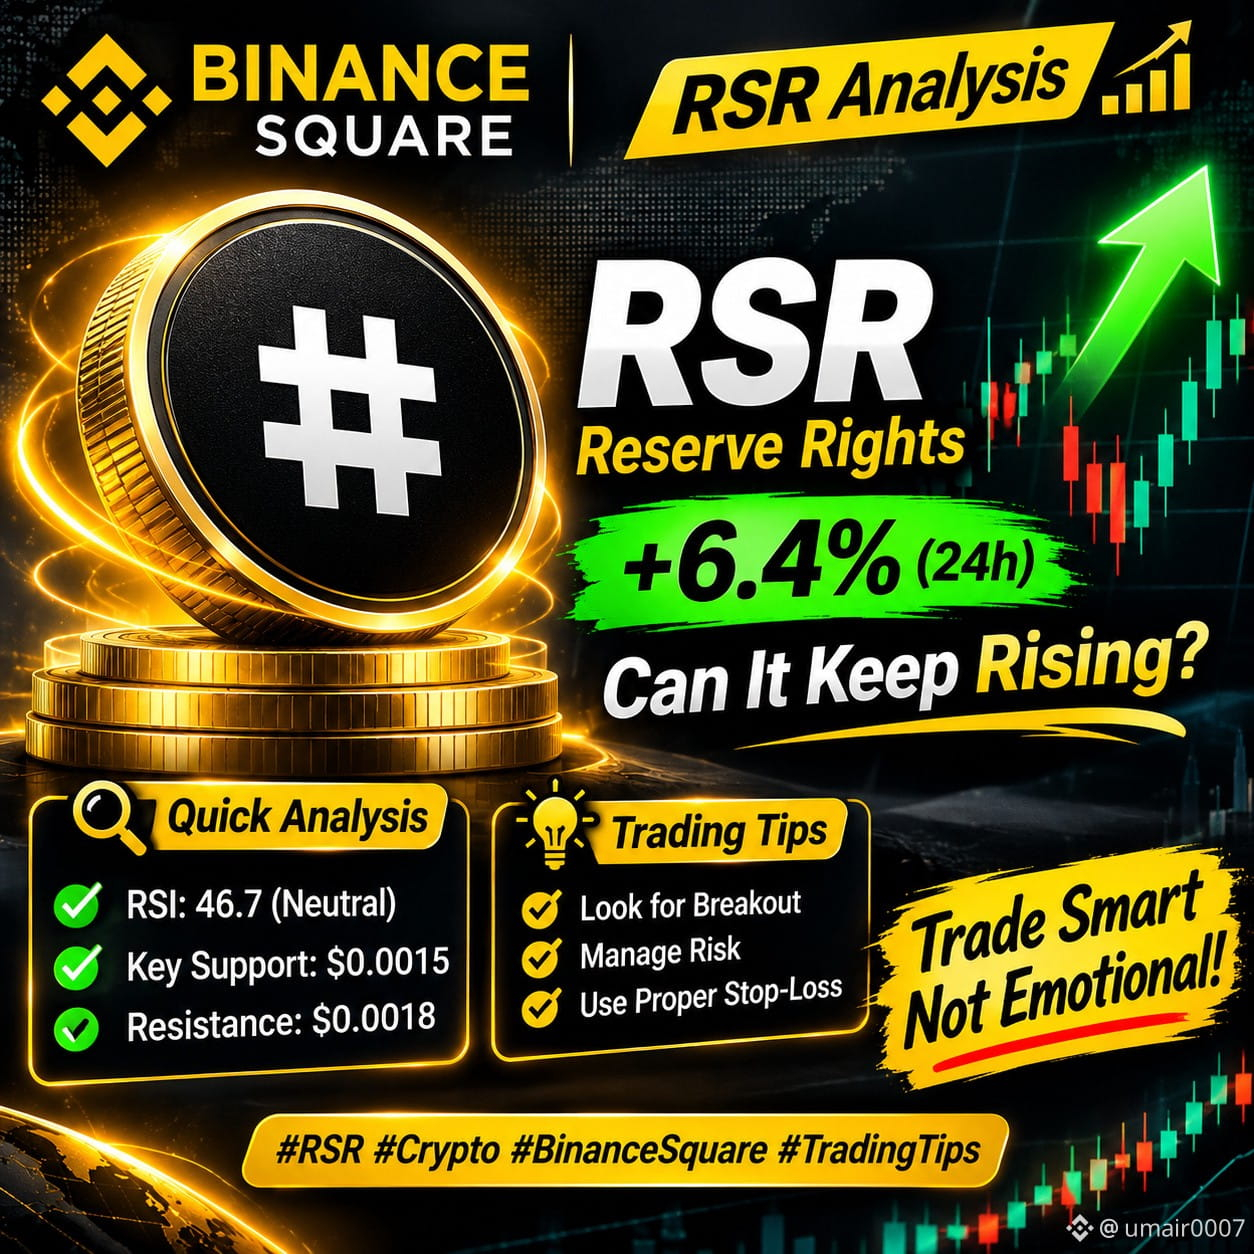
🚀 RSR (Reserve Rights) Price Analysis
RSR is showing positive momentum, but can the bullish trend continue?
📊 Watch RSI, trading volume & key resistance levels.
📈 Look for breakout confirmation.
🛡️ Manage risk and avoid FOMO.
Smart analysis matters more than chasing pumps!
What’s your outlook on RSR? Bullish or bearish?
$BTC
{spot}(BTCUSDT)
$SOL
{spot}(SOLUSDT)
$ETH
{spot}(ETHUSDT)
#RSR/USDT #ReserveRights #tradingtips #RiskManagement
🚀 RSR (Reserve Rights) Price Analysis
RSR is showing positive momentum, but can the bullish trend continue?
📊 Watch RSI, trading volume & key resistance levels.
📈 Look for breakout confirmation.
🛡️ Manage risk and avoid FOMO.
Smart analysis matters more than chasing pumps!
What’s your outlook on RSR? Bullish or bearish?
$BTC
$SOL
$ETH
#RSR/USDT #ReserveRights #tradingtips #RiskManagement
RSR is showing positive momentum, but can the bullish trend continue?
📊 Watch RSI, trading volume & key resistance levels.
📈 Look for breakout confirmation.
🛡️ Manage risk and avoid FOMO.
Smart analysis matters more than chasing pumps!
What’s your outlook on RSR? Bullish or bearish?
$BTC
$SOL
$ETH
#RSR/USDT #ReserveRights #tradingtips #RiskManagement
1
238

·
--
I'm hedging to manage risk. Got 100 units of an asset, sell 28 units of something similar to reduce exposure. If it TANKS, I'll only be exposed to 72 units. No guarantee, but it helps. Controlling risk with 28 units, that's the goal. $TRADING #RiskManagement #Portfolio #TradingTips
I'm hedging to manage risk. Got 100 units of an asset, sell 28 units of something similar to reduce exposure. If it TANKS, I'll only be exposed to 72 units. No guarantee, but it helps. Controlling risk with 28 units, that's the goal. $TRADING #RiskManagement #Portfolio #TradingTips
·
--
Traders use funding rate to gauge market sentiment. It's a fee paid by one side of a trade to the other. A high funding rate means traders are bullish, a low rate means they're bearish. This indicator helps traders make informed decisions. It's not a guarantee, but it's useful. #CryptoEducation #Blockchain #TradingTips
Traders use funding rate to gauge market sentiment. It's a fee paid by one side of a trade to the other. A high funding rate means traders are bullish, a low rate means they're bearish. This indicator helps traders make informed decisions. It's not a guarantee, but it's useful. #CryptoEducation #Blockchain #TradingTips
1

·
--
Anatomía de una Liquidación en Cadena: Por qué los Stop Loss dinámicos fallan en Caídas Rápidas (Flash Crashes)Muchos operadores confían ciegamente en que un Stop Loss móvil (Trailing Stop) los protegerá de cualquier evento extremo. Sin embargo, en caídas abruptas de alta volatilidad (Flash Crashes), el libro de órdenes sufre una evaporación instantánea de liquidez.
¿Qué ocurre realmente tras bambalinas en el motor de emparejamiento de órdenes?
1. El Vacío de Órdenes Límite: Cuando el precio cae en vertical, las órdenes límite de compra son absorbidas en milisegundos. Si tu Stop Loss es una orden a mercado (Market Stop), tu orden se ejecutará al mejor precio disponible, que puede estar un 5% o 10% por debajo de tu nivel previsto (Slippage catastrófico).
2. Cascada de Liquidaciones Forzadas: Las liquidaciones de posiciones sobreapalancadas emiten órdenes de venta agresivas que saturan el libro, empujando el precio aún más abajo.
3. Cómo Blindar tu Cuenta:
• Nunca apalanques más de lo que tu liquidez de emergencia puede respaldar.
• Utiliza Stop Loss duros calculados por volatilidad (ATR) en lugar de fijar distancias arbitrarias.
• Respeta siempre el límite de pérdida máxima por operación (no más del 1% a 2% de tu cuenta total).
En mercados cripto, la supervivencia es la única métrica que importa.
$BTC $SOL $BNB #BinanceSquare #TradingTips #RiskManagement #Futures
Anatomía de una Liquidación en Cadena: Por qué los Stop Loss dinámicos fallan en Caídas Rápidas (Flash Crashes)
Muchos operadores confían ciegamente en que un Stop Loss móvil (Trailing Stop) los protegerá de cualquier evento extremo. Sin embargo, en caídas abruptas de alta volatilidad (Flash Crashes), el libro de órdenes sufre una evaporación instantánea de liquidez.
¿Qué ocurre realmente tras bambalinas en el motor de emparejamiento de órdenes?
1. El Vacío de Órdenes Límite: Cuando el precio cae en vertical, las órdenes límite de compra son absorbidas en milisegundos. Si tu Stop Loss es una orden a mercado (Market Stop), tu orden se ejecutará al mejor precio disponible, que puede estar un 5% o 10% por debajo de tu nivel previsto (Slippage catastrófico).
2. Cascada de Liquidaciones Forzadas: Las liquidaciones de posiciones sobreapalancadas emiten órdenes de venta agresivas que saturan el libro, empujando el precio aún más abajo.
3. Cómo Blindar tu Cuenta:
• Nunca apalanques más de lo que tu liquidez de emergencia puede respaldar.
• Utiliza Stop Loss duros calculados por volatilidad (ATR) en lugar de fijar distancias arbitrarias.
• Respeta siempre el límite de pérdida máxima por operación (no más del 1% a 2% de tu cuenta total).
En mercados cripto, la supervivencia es la única métrica que importa.
$BTC $SOL $BNB #BinanceSquare #TradingTips #RiskManagement #Futures
¿Qué ocurre realmente tras bambalinas en el motor de emparejamiento de órdenes?
1. El Vacío de Órdenes Límite: Cuando el precio cae en vertical, las órdenes límite de compra son absorbidas en milisegundos. Si tu Stop Loss es una orden a mercado (Market Stop), tu orden se ejecutará al mejor precio disponible, que puede estar un 5% o 10% por debajo de tu nivel previsto (Slippage catastrófico).
2. Cascada de Liquidaciones Forzadas: Las liquidaciones de posiciones sobreapalancadas emiten órdenes de venta agresivas que saturan el libro, empujando el precio aún más abajo.
3. Cómo Blindar tu Cuenta:
• Nunca apalanques más de lo que tu liquidez de emergencia puede respaldar.
• Utiliza Stop Loss duros calculados por volatilidad (ATR) en lugar de fijar distancias arbitrarias.
• Respeta siempre el límite de pérdida máxima por operación (no más del 1% a 2% de tu cuenta total).
En mercados cripto, la supervivencia es la única métrica que importa.
$BTC $SOL $BNB #BinanceSquare #TradingTips #RiskManagement #Futures
92
·
--
Hedging is a trading concept that can help manage risk. It's like having insurance for your trades. Let's say you have 10 units of $BTC and you're worried the value might drop. You can hedge by trading a contract that will increase in value if $BTC drops. This way, if $BTC loses value, your contract will gain value, offsetting some of the loss. It's not a guarantee, but it can help reduce potential losses. Hedging can be complex, so it's essential to understand the basics before using it in your trading strategy. #Hedging #RiskManagement #TradingTips
Hedging is a trading concept that can help manage risk. It's like having insurance for your trades. Let's say you have 10 units of $BTC and you're worried the value might drop. You can hedge by trading a contract that will increase in value if $BTC drops. This way, if $BTC loses value, your contract will gain value, offsetting some of the loss. It's not a guarantee, but it can help reduce potential losses. Hedging can be complex, so it's essential to understand the basics before using it in your trading strategy. #Hedging #RiskManagement #TradingTips
9

·
--
💡 3 Crypto Market Signals Every Beginner Should Understand
Many beginners focus only on the price of Bitcoin.
But experienced market watchers often look at more than price.
Here are three useful indicators:
1️⃣ Bitcoin Dominance: Shows Bitcoin's share of the total crypto market capitalization.
2️⃣ Trading Volume: Helps traders understand the level of market activity behind a price move.
3️⃣ Fear & Greed Index: Provides a snapshot of overall crypto market sentiment.
Understanding these indicators can help you analyze market conditions instead of blindly following social media predictions.
Remember: No single indicator can predict the market perfectly.
Question: Which one do you check first?
A) Bitcoin Dominance
B) Trading Volume
C) Fear & Greed Index
Comment A, B, or C below!
$BTC $ETH $BNB
#CryptoEducation #bitcoin #tradingtips #CryptoAwareness
💡 3 Crypto Market Signals Every Beginner Should Understand
Many beginners focus only on the price of Bitcoin.
But experienced market watchers often look at more than price.
Here are three useful indicators:
1️⃣ Bitcoin Dominance: Shows Bitcoin's share of the total crypto market capitalization.
2️⃣ Trading Volume: Helps traders understand the level of market activity behind a price move.
3️⃣ Fear & Greed Index: Provides a snapshot of overall crypto market sentiment.
Understanding these indicators can help you analyze market conditions instead of blindly following social media predictions.
Remember: No single indicator can predict the market perfectly.
Question: Which one do you check first?
A) Bitcoin Dominance
B) Trading Volume
C) Fear & Greed Index
Comment A, B, or C below!
$BTC $ETH $BNB
#CryptoEducation #bitcoin #tradingtips #CryptoAwareness
Many beginners focus only on the price of Bitcoin.
But experienced market watchers often look at more than price.
Here are three useful indicators:
1️⃣ Bitcoin Dominance: Shows Bitcoin's share of the total crypto market capitalization.
2️⃣ Trading Volume: Helps traders understand the level of market activity behind a price move.
3️⃣ Fear & Greed Index: Provides a snapshot of overall crypto market sentiment.
Understanding these indicators can help you analyze market conditions instead of blindly following social media predictions.
Remember: No single indicator can predict the market perfectly.
Question: Which one do you check first?
A) Bitcoin Dominance
B) Trading Volume
C) Fear & Greed Index
Comment A, B, or C below!
$BTC $ETH $BNB
#CryptoEducation #bitcoin #tradingtips #CryptoAwareness
49

Stay Calm During Market Volatility! 🧠
Crypto markets move in both directions. Fear can lead to bad decisions, while greed can create unnecessary risks. Successful investors focus on discipline, research, patience, and proper risk management.$BNB
{spot}(BNBUSDT)
Never invest more than you can afford to lose.
#CryptoMindset #Bitcoin #TradingTips #Investing
Stay Calm During Market Volatility! 🧠
Crypto markets move in both directions. Fear can lead to bad decisions, while greed can create unnecessary risks. Successful investors focus on discipline, research, patience, and proper risk management.$BNB
Never invest more than you can afford to lose.
#CryptoMindset #Bitcoin #TradingTips #Investing
Crypto markets move in both directions. Fear can lead to bad decisions, while greed can create unnecessary risks. Successful investors focus on discipline, research, patience, and proper risk management.$BNB
Never invest more than you can afford to lose.
#CryptoMindset #Bitcoin #TradingTips #Investing
39
·
--
$STRK volume sits at 0.5x its weekly average and most people misread that completely
Price drops 6.0 percent today to $0.03934 but the low volume tells the real story
When a coin falls on weak volume it usually means sellers lack real conviction
You check this ratio yourself in 20 seconds by dividing today volume into the seven day average
A drop with heavy volume signals panic while a drop with half average volume just means nobody cares
Always check if the volume backs the move before you open any chart
Open $STRK and set an alert at that level
What is your favorite filter to spot fake moves
#STRK #TradingTips
$STRK volume sits at 0.5x its weekly average and most people misread that completely
Price drops 6.0 percent today to $0.03934 but the low volume tells the real story
When a coin falls on weak volume it usually means sellers lack real conviction
You check this ratio yourself in 20 seconds by dividing today volume into the seven day average
A drop with heavy volume signals panic while a drop with half average volume just means nobody cares
Always check if the volume backs the move before you open any chart
Open $STRK and set an alert at that level
What is your favorite filter to spot fake moves
#STRK #TradingTips
Price drops 6.0 percent today to $0.03934 but the low volume tells the real story
When a coin falls on weak volume it usually means sellers lack real conviction
You check this ratio yourself in 20 seconds by dividing today volume into the seven day average
A drop with heavy volume signals panic while a drop with half average volume just means nobody cares
Always check if the volume backs the move before you open any chart
Open $STRK and set an alert at that level
What is your favorite filter to spot fake moves
#STRK #TradingTips
2

·
--
Don't let the FUD get to you.
Bitcoin's Fear & Greed Index is flashing 'Extreme Fear' at 25.
This isn't a time to panic, but to assess. Markets often reverse when sentiment is at its lowest.
Stay calm, stick to your plan, and look for opportunities amidst the chaos.
#CryptoPsychology #TradingTips
Don't let the FUD get to you.
Bitcoin's Fear & Greed Index is flashing 'Extreme Fear' at 25.
This isn't a time to panic, but to assess. Markets often reverse when sentiment is at its lowest.
Stay calm, stick to your plan, and look for opportunities amidst the chaos.
#CryptoPsychology #TradingTips
Bitcoin's Fear & Greed Index is flashing 'Extreme Fear' at 25.
This isn't a time to panic, but to assess. Markets often reverse when sentiment is at its lowest.
Stay calm, stick to your plan, and look for opportunities amidst the chaos.
#CryptoPsychology #TradingTips
🚀 Why a sudden dip in $BTC can actually be a green light for buyers
In the last 24 hours $BTC slipped ‑0.2 % to $75,975.6 while trading volume surged to $379 M. This contrast is a textbook case of **volume confirmation**: when price moves against the trend but volume spikes, it often signals that the move is being absorbed by strong hands, setting the stage for a bounce.
Here’s how to read it:
1️⃣ Price drops → look for a volume spike.
2️⃣ If volume is significantly higher than the 7‑day average, sellers are likely getting exhausted.
3️⃣ Expect a short‑term reversal or at least a stabilization near the current level.
Traders who spot this pattern can position for a rebound or tighten stop‑losses, turning a perceived weakness into a strategic edge.
What other volume‑price mismatches have you spotted lately? $BTC
#CryptoEducation #TradingTips
We post every algo signal's REAL result openly and the full live track record + a free preview channel are in our bio/profile.
🚀 Why a sudden dip in $BTC can actually be a green light for buyers
In the last 24 hours $BTC slipped ‑0.2 % to $75,975.6 while trading volume surged to $379 M. This contrast is a textbook case of **volume confirmation**: when price moves against the trend but volume spikes, it often signals that the move is being absorbed by strong hands, setting the stage for a bounce.
Here’s how to read it:
1️⃣ Price drops → look for a volume spike.
2️⃣ If volume is significantly higher than the 7‑day average, sellers are likely getting exhausted.
3️⃣ Expect a short‑term reversal or at least a stabilization near the current level.
Traders who spot this pattern can position for a rebound or tighten stop‑losses, turning a perceived weakness into a strategic edge.
What other volume‑price mismatches have you spotted lately? $BTC
#CryptoEducation #TradingTips
We post every algo signal's REAL result openly and the full live track record + a free preview channel are in our bio/profile.
In the last 24 hours $BTC slipped ‑0.2 % to $75,975.6 while trading volume surged to $379 M. This contrast is a textbook case of **volume confirmation**: when price moves against the trend but volume spikes, it often signals that the move is being absorbed by strong hands, setting the stage for a bounce.
Here’s how to read it:
1️⃣ Price drops → look for a volume spike.
2️⃣ If volume is significantly higher than the 7‑day average, sellers are likely getting exhausted.
3️⃣ Expect a short‑term reversal or at least a stabilization near the current level.
Traders who spot this pattern can position for a rebound or tighten stop‑losses, turning a perceived weakness into a strategic edge.
What other volume‑price mismatches have you spotted lately? $BTC
#CryptoEducation #TradingTips
We post every algo signal's REAL result openly and the full live track record + a free preview channel are in our bio/profile.
92
·
--
Your $AVAX stop is at some random percentage and that is why you get wicked out
Put your stop below the level that proves your idea was actually wrong
If you enter long here you look at the 24h low of 8.1340 dollars
The 1h ATR shows a normal hourly swing of 0.5 percent of the price
A tight stop inside that range gets hit by market noise alone
Put your stop under the key level plus one hourly swing to give it room
Where do you usually put your stops
Tap $AVAX and check the hourly chart yourself
#AVAX #TradingTips
Your $AVAX stop is at some random percentage and that is why you get wicked out
Put your stop below the level that proves your idea was actually wrong
If you enter long here you look at the 24h low of 8.1340 dollars
The 1h ATR shows a normal hourly swing of 0.5 percent of the price
A tight stop inside that range gets hit by market noise alone
Put your stop under the key level plus one hourly swing to give it room
Where do you usually put your stops
Tap $AVAX and check the hourly chart yourself
#AVAX #TradingTips
Put your stop below the level that proves your idea was actually wrong
If you enter long here you look at the 24h low of 8.1340 dollars
The 1h ATR shows a normal hourly swing of 0.5 percent of the price
A tight stop inside that range gets hit by market noise alone
Put your stop under the key level plus one hourly swing to give it room
Where do you usually put your stops
Tap $AVAX and check the hourly chart yourself
#AVAX #TradingTips
11
·
--
$ZRO volume is 0.3x its weekly average. Here is why that low number is a trap
Most traders buy a dip without checking the fuel gauge and wonder why it stalls
Look at $ZRO today sitting at 1.6030 down 1.9 percent near the low of its range
The 24h volume is only 1.9M which is 0.3x the 7 day average
That means 1.9 divided by the average is less than half normal participation
Price moving on low volume is just air not accumulation
Open your exchange tap indicators type volume look at the 20 period moving average bar
If today is way below that line the move lacks institutional hands
Never trust a bounce when the volume ratio stays under one
What is your cutoff for a low volume fakeout
#ZRO #TradingTips
$ZRO volume is 0.3x its weekly average. Here is why that low number is a trap
Most traders buy a dip without checking the fuel gauge and wonder why it stalls
Look at $ZRO today sitting at 1.6030 down 1.9 percent near the low of its range
The 24h volume is only 1.9M which is 0.3x the 7 day average
That means 1.9 divided by the average is less than half normal participation
Price moving on low volume is just air not accumulation
Open your exchange tap indicators type volume look at the 20 period moving average bar
If today is way below that line the move lacks institutional hands
Never trust a bounce when the volume ratio stays under one
What is your cutoff for a low volume fakeout
#ZRO #TradingTips
Most traders buy a dip without checking the fuel gauge and wonder why it stalls
Look at $ZRO today sitting at 1.6030 down 1.9 percent near the low of its range
The 24h volume is only 1.9M which is 0.3x the 7 day average
That means 1.9 divided by the average is less than half normal participation
Price moving on low volume is just air not accumulation
Open your exchange tap indicators type volume look at the 20 period moving average bar
If today is way below that line the move lacks institutional hands
Never trust a bounce when the volume ratio stays under one
What is your cutoff for a low volume fakeout
#ZRO #TradingTips
12

·
--
Quiet charts are where accounts quietly get wrecked.
$BTC traded inside a range of under 0.9% over the last 24 hours (roughly 75.6k to 76.2k). Three days ago the same coin swung about 7.5% high to low in a single daily candle. Same asset, same week, very different risk.
Why it matters: when price goes flat, a lot of traders size up or add leverage because "nothing is happening". Then volatility comes back, and it rarely sends a calendar invite first.
A simple risk framework I like:
1. Decide the loss first. Many traders cap risk at 1–2% of the account per trade. On a $10,000 account, 1% is $100.
2. Let the stop set the size. If your stop is 3% away, position size = $100 / 0.03 ≈ $3,333. Stop 1% away? About $10,000. The risk stays $100 either way.
3. Plan for the range, not the current calm. Place stops based on recent volatility. A stop that survives a 0.9% day can get swept on a 7% day.
4. Cap total exposure. BTC, $ETH and $SOL often move together, so three "separate" 1% trades can behave like one 3% bet.
Calm markets don't lower your risk. They just hide it.
How do you size positions when volatility drops?
Not financial advice.
#RiskManagement #TradingTips #Bitcoin
Quiet charts are where accounts quietly get wrecked.
$BTC traded inside a range of under 0.9% over the last 24 hours (roughly 75.6k to 76.2k). Three days ago the same coin swung about 7.5% high to low in a single daily candle. Same asset, same week, very different risk.
Why it matters: when price goes flat, a lot of traders size up or add leverage because "nothing is happening". Then volatility comes back, and it rarely sends a calendar invite first.
A simple risk framework I like:
1. Decide the loss first. Many traders cap risk at 1–2% of the account per trade. On a $10,000 account, 1% is $100.
2. Let the stop set the size. If your stop is 3% away, position size = $100 / 0.03 ≈ $3,333. Stop 1% away? About $10,000. The risk stays $100 either way.
3. Plan for the range, not the current calm. Place stops based on recent volatility. A stop that survives a 0.9% day can get swept on a 7% day.
4. Cap total exposure. BTC, $ETH and $SOL often move together, so three "separate" 1% trades can behave like one 3% bet.
Calm markets don't lower your risk. They just hide it.
How do you size positions when volatility drops?
Not financial advice.
#RiskManagement #TradingTips #Bitcoin
$BTC traded inside a range of under 0.9% over the last 24 hours (roughly 75.6k to 76.2k). Three days ago the same coin swung about 7.5% high to low in a single daily candle. Same asset, same week, very different risk.
Why it matters: when price goes flat, a lot of traders size up or add leverage because "nothing is happening". Then volatility comes back, and it rarely sends a calendar invite first.
A simple risk framework I like:
1. Decide the loss first. Many traders cap risk at 1–2% of the account per trade. On a $10,000 account, 1% is $100.
2. Let the stop set the size. If your stop is 3% away, position size = $100 / 0.03 ≈ $3,333. Stop 1% away? About $10,000. The risk stays $100 either way.
3. Plan for the range, not the current calm. Place stops based on recent volatility. A stop that survives a 0.9% day can get swept on a 7% day.
4. Cap total exposure. BTC, $ETH and $SOL often move together, so three "separate" 1% trades can behave like one 3% bet.
Calm markets don't lower your risk. They just hide it.
How do you size positions when volatility drops?
Not financial advice.
#RiskManagement #TradingTips #Bitcoin
1
·
--
Your stop on $ONDO at $0.35920 is just guessing if you ignore the math
Most traders drop a random percentage below price and wonder why it keeps getting wicked out
Right now $ONDO trades at $0.36020 down 2.0 percent on the day sitting near the bottom of the $0.35920 to $0.37140 range
The 1h ATR is 0.6 percent which means normal hourly noise swings right through any tight percentage risk you pick
If you put your stop closer than that hourly range the market takes you out by accident before the direction even matters
A real stop belongs below the structure that proves your thesis dead wrong not at an arbitrary number that sounds neat
Put your stop past the noise floor every single time 📈
Where do you normally measure your risk
#ONDO #TradingTips
Your stop on $ONDO at $0.35920 is just guessing if you ignore the math
Most traders drop a random percentage below price and wonder why it keeps getting wicked out
Right now $ONDO trades at $0.36020 down 2.0 percent on the day sitting near the bottom of the $0.35920 to $0.37140 range
The 1h ATR is 0.6 percent which means normal hourly noise swings right through any tight percentage risk you pick
If you put your stop closer than that hourly range the market takes you out by accident before the direction even matters
A real stop belongs below the structure that proves your thesis dead wrong not at an arbitrary number that sounds neat
Put your stop past the noise floor every single time 📈
Where do you normally measure your risk
#ONDO #TradingTips
Most traders drop a random percentage below price and wonder why it keeps getting wicked out
Right now $ONDO trades at $0.36020 down 2.0 percent on the day sitting near the bottom of the $0.35920 to $0.37140 range
The 1h ATR is 0.6 percent which means normal hourly noise swings right through any tight percentage risk you pick
If you put your stop closer than that hourly range the market takes you out by accident before the direction even matters
A real stop belongs below the structure that proves your thesis dead wrong not at an arbitrary number that sounds neat
Put your stop past the noise floor every single time 📈
Where do you normally measure your risk
#ONDO #TradingTips
5
·
--
$AAVE is up 2 percent. Ask yourself who is selling to you at this price
Most traders chase green candles without checking where the price actually sits in the daily range
Right now $AAVE trades at 131.7800 dollars which puts it at 68 percent of its daily move
The range spans from 129.2500 dollars up to 132.9800 dollars so you are buying near the top of today already
Volume is thin at 0.4 times the average and RSI sits right in the middle at 53
That means passive sellers are dumping into your market order while smart money sits on their hands
Wait for the pullback to the range low instead of paying the impatient tax
What trigger do you wait for before buying a green candle
#AAVE #TradingTips
$AAVE is up 2 percent. Ask yourself who is selling to you at this price
Most traders chase green candles without checking where the price actually sits in the daily range
Right now $AAVE trades at 131.7800 dollars which puts it at 68 percent of its daily move
The range spans from 129.2500 dollars up to 132.9800 dollars so you are buying near the top of today already
Volume is thin at 0.4 times the average and RSI sits right in the middle at 53
That means passive sellers are dumping into your market order while smart money sits on their hands
Wait for the pullback to the range low instead of paying the impatient tax
What trigger do you wait for before buying a green candle
#AAVE #TradingTips
Most traders chase green candles without checking where the price actually sits in the daily range
Right now $AAVE trades at 131.7800 dollars which puts it at 68 percent of its daily move
The range spans from 129.2500 dollars up to 132.9800 dollars so you are buying near the top of today already
Volume is thin at 0.4 times the average and RSI sits right in the middle at 53
That means passive sellers are dumping into your market order while smart money sits on their hands
Wait for the pullback to the range low instead of paying the impatient tax
What trigger do you wait for before buying a green candle
#AAVE #TradingTips
4
·
--
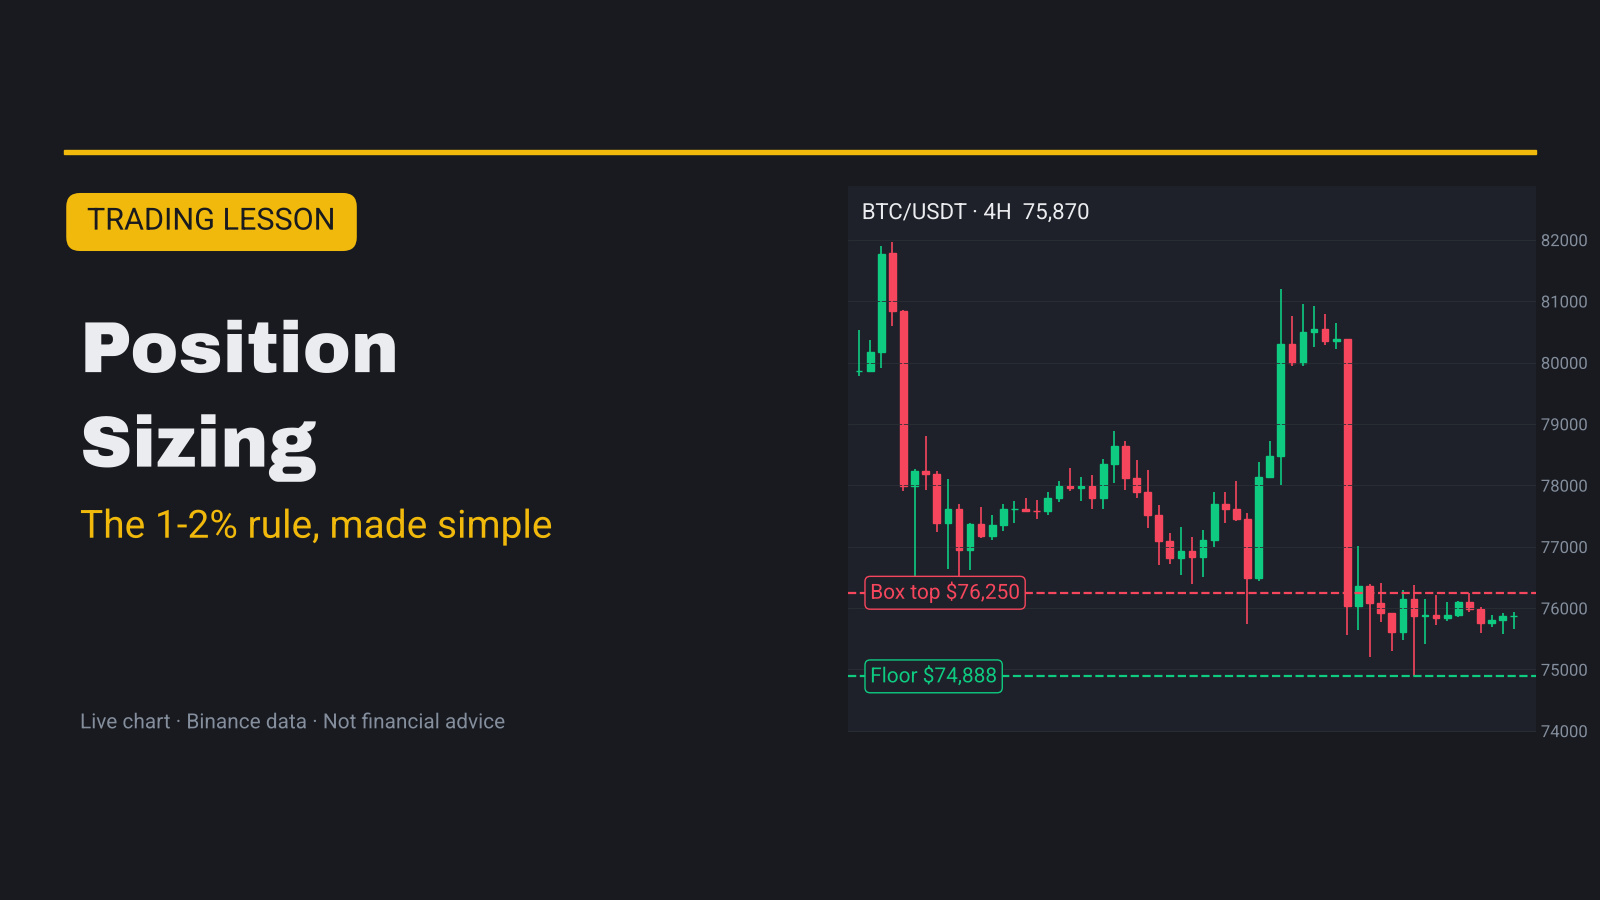
Мақала
Position Sizing: Explained Simply📘 What is position sizing?
Position sizing means deciding how big a trade should be BEFORE you enter. Not "how much do I feel like buying", but "how much can I lose if I'm wrong".
The most common rule is simple: never risk more than 1-2% of your account on one trade. Lose 10 trades in a row and you still have about 80-90% of your money. Risk 20% per trade and three bad trades can cut your account in half.
📊 Live chart in the cover and in the image post below.
🔍 How to work it out
• Step 1: pick your stop-loss from the chart (where your idea is proven wrong). Last week's lesson covered this
• Step 2: measure the stop distance in %. Entry $100, stop $95 = 5%
• Step 3: decide your risk in dollars. $1,000 account x 1% = $10
• Step 4: position size = risk $ / stop distance %. $10 / 5% = $200
• That's it. The stop decides the size, not your mood
📈 How traders use it
• Wide stop = smaller position. Tight stop = bigger position. The dollar risk stays the same
• Volatile coins get smaller positions than BTC, because their stops need more room
• Leverage does NOT change your risk if the stop is set. A $555 position with 5x needs only $111 margin, but the stop still costs $10. Leverage just lets you put up less cash
• Without a stop, leverage is dangerous: a 10x long loses about 60% of its margin on a 6% drop
• Keep the same % on every trade so one loss never undoes a week of wins
🧪 Live example: $BTC right now
• Nov 5 showed why size matters: BTC fell from $80,390 to $75,568 in a single 4H candle (12:00 UTC), about -6%. A 10x long with no stop lost roughly 60% of its margin in four hours
• Since then BTC has been stuck in a tight box: floor $74,888 (Nov 6 low, the first dip under $75K since August), top $76,250 (Nov 7 high). Today it sits near $75,870
• Example long here: the idea is wrong if BTC breaks the $74,888 floor. Stop with a buffer: about $74,500, which is 1.8% away
• $1,000 account, 1% risk ($10): position ≈ $10 / 1.8% ≈ $555
• $5,000 account, 1% risk ($50): position ≈ $2,770
• If you want a tighter stop, the position can be bigger. If you want more room, it must be smaller
⚠️ Common mistakes
• Choosing the size first ("I'll buy $1,000"), then guessing a stop
• Going bigger after a loss to "win it back" (revenge sizing)
• Thinking 10x leverage means 10x the risk. The risk is set by size x stop distance
• Opening several trades on coins that move together (BTC, ETH, SOL) and counting each as a separate 1%
✅ Quick checklist
• Stop first, from the chart
• Stop distance in %
• Risk = 1-2% of the account in dollars
• Size = risk $ / stop distance %
• Check total risk across all open trades
💬 How much do you risk per trade: 1%, 2%, or "it depends"? 👇
Not financial advice. DYOR.
#TradingTips #RiskManagement #Bitcoin
Position Sizing: Explained Simply
📘 What is position sizing?
Position sizing means deciding how big a trade should be BEFORE you enter. Not "how much do I feel like buying", but "how much can I lose if I'm wrong".
The most common rule is simple: never risk more than 1-2% of your account on one trade. Lose 10 trades in a row and you still have about 80-90% of your money. Risk 20% per trade and three bad trades can cut your account in half.
📊 Live chart in the cover and in the image post below.
🔍 How to work it out
• Step 1: pick your stop-loss from the chart (where your idea is proven wrong). Last week's lesson covered this
• Step 2: measure the stop distance in %. Entry $100, stop $95 = 5%
• Step 3: decide your risk in dollars. $1,000 account x 1% = $10
• Step 4: position size = risk $ / stop distance %. $10 / 5% = $200
• That's it. The stop decides the size, not your mood
📈 How traders use it
• Wide stop = smaller position. Tight stop = bigger position. The dollar risk stays the same
• Volatile coins get smaller positions than BTC, because their stops need more room
• Leverage does NOT change your risk if the stop is set. A $555 position with 5x needs only $111 margin, but the stop still costs $10. Leverage just lets you put up less cash
• Without a stop, leverage is dangerous: a 10x long loses about 60% of its margin on a 6% drop
• Keep the same % on every trade so one loss never undoes a week of wins
🧪 Live example: $BTC right now
• Nov 5 showed why size matters: BTC fell from $80,390 to $75,568 in a single 4H candle (12:00 UTC), about -6%. A 10x long with no stop lost roughly 60% of its margin in four hours
• Since then BTC has been stuck in a tight box: floor $74,888 (Nov 6 low, the first dip under $75K since August), top $76,250 (Nov 7 high). Today it sits near $75,870
• Example long here: the idea is wrong if BTC breaks the $74,888 floor. Stop with a buffer: about $74,500, which is 1.8% away
• $1,000 account, 1% risk ($10): position ≈ $10 / 1.8% ≈ $555
• $5,000 account, 1% risk ($50): position ≈ $2,770
• If you want a tighter stop, the position can be bigger. If you want more room, it must be smaller
⚠️ Common mistakes
• Choosing the size first ("I'll buy $1,000"), then guessing a stop
• Going bigger after a loss to "win it back" (revenge sizing)
• Thinking 10x leverage means 10x the risk. The risk is set by size x stop distance
• Opening several trades on coins that move together (BTC, ETH, SOL) and counting each as a separate 1%
✅ Quick checklist
• Stop first, from the chart
• Stop distance in %
• Risk = 1-2% of the account in dollars
• Size = risk $ / stop distance %
• Check total risk across all open trades
💬 How much do you risk per trade: 1%, 2%, or "it depends"? 👇
Not financial advice. DYOR.
#TradingTips #RiskManagement #Bitcoin
Position sizing means deciding how big a trade should be BEFORE you enter. Not "how much do I feel like buying", but "how much can I lose if I'm wrong".
The most common rule is simple: never risk more than 1-2% of your account on one trade. Lose 10 trades in a row and you still have about 80-90% of your money. Risk 20% per trade and three bad trades can cut your account in half.
📊 Live chart in the cover and in the image post below.
🔍 How to work it out
• Step 1: pick your stop-loss from the chart (where your idea is proven wrong). Last week's lesson covered this
• Step 2: measure the stop distance in %. Entry $100, stop $95 = 5%
• Step 3: decide your risk in dollars. $1,000 account x 1% = $10
• Step 4: position size = risk $ / stop distance %. $10 / 5% = $200
• That's it. The stop decides the size, not your mood
📈 How traders use it
• Wide stop = smaller position. Tight stop = bigger position. The dollar risk stays the same
• Volatile coins get smaller positions than BTC, because their stops need more room
• Leverage does NOT change your risk if the stop is set. A $555 position with 5x needs only $111 margin, but the stop still costs $10. Leverage just lets you put up less cash
• Without a stop, leverage is dangerous: a 10x long loses about 60% of its margin on a 6% drop
• Keep the same % on every trade so one loss never undoes a week of wins
🧪 Live example: $BTC right now
• Nov 5 showed why size matters: BTC fell from $80,390 to $75,568 in a single 4H candle (12:00 UTC), about -6%. A 10x long with no stop lost roughly 60% of its margin in four hours
• Since then BTC has been stuck in a tight box: floor $74,888 (Nov 6 low, the first dip under $75K since August), top $76,250 (Nov 7 high). Today it sits near $75,870
• Example long here: the idea is wrong if BTC breaks the $74,888 floor. Stop with a buffer: about $74,500, which is 1.8% away
• $1,000 account, 1% risk ($10): position ≈ $10 / 1.8% ≈ $555
• $5,000 account, 1% risk ($50): position ≈ $2,770
• If you want a tighter stop, the position can be bigger. If you want more room, it must be smaller
⚠️ Common mistakes
• Choosing the size first ("I'll buy $1,000"), then guessing a stop
• Going bigger after a loss to "win it back" (revenge sizing)
• Thinking 10x leverage means 10x the risk. The risk is set by size x stop distance
• Opening several trades on coins that move together (BTC, ETH, SOL) and counting each as a separate 1%
✅ Quick checklist
• Stop first, from the chart
• Stop distance in %
• Risk = 1-2% of the account in dollars
• Size = risk $ / stop distance %
• Check total risk across all open trades
💬 How much do you risk per trade: 1%, 2%, or "it depends"? 👇
Not financial advice. DYOR.
#TradingTips #RiskManagement #Bitcoin
128
Көбірек контент көру үшін кіріңіз
Binance Square платформасында әлемдік криптоқоғамдастыққа қосылыңыз
⚡️ Криптовалюта туралы ең соңғы және пайдалы ақпаратты алыңыз.
💬 Әлемдегі ең ірі криптобиржаның сеніміне ие.
👍 Расталған авторлардың нақты пікірлерін табыңыз.
Электрондық пошта/телефон нөмірі
Трендтегі тақырыптар
1
#BinanceReopensWithdrawalsForHYPE&APT
79,018 рет көрілді
936 адам талқылап жатыр
2
#SouthKoreaDraftLawTargets15To20%ShareholderCap
79,140 рет көрілді
621 адам талқылап жатыр
3
#TradFiForBeginners
177,311 рет көрілді
1,814 адам талқылап жатыр
4
#KeplrAdvisesSocialLoginUsersToTransferAssets
43,685 рет көрілді
501 адам талқылап жатыр
5
#TetherPlans€28.8MForJuventusCapitalIncrease
30,803 рет көрілді
386 адам талқылап жатыр
6
#JobsReportRaisesHikeOdds
848,976 рет көрілді
4,421 адам талқылап жатыр
7
#CPITestsDecemberRateOutlook
343,521 рет көрілді
1,868 адам талқылап жатыр
8
#US Data Center Rules May Constrain AI Expansion
127,837 рет көрілді
258 адам талқылап жатыр
9
#ARKPlans14ThematicETFsCoveringAIAndTokenizedMarkets
9,208 рет көрілді
89 адам талқылап жатыр
10
#WillAnthropicListOnTime
268,950 рет көрілді
1,879 адам талқылап жатыр