

Zholdak
132 投稿
Zholdak
報告
ユーザーをブロック
32 フォロー
34 フォロワー
143 いいね
投稿
·
--
ブリッシュ
先月、#BStocks ですべてのルートを試してみた。結果のためではなく、限界を理解するためだ。
いつも通り始まった:取引所で買って、保有して、売る。この段階ではbStockは通常のスポットペアのように振る舞う。
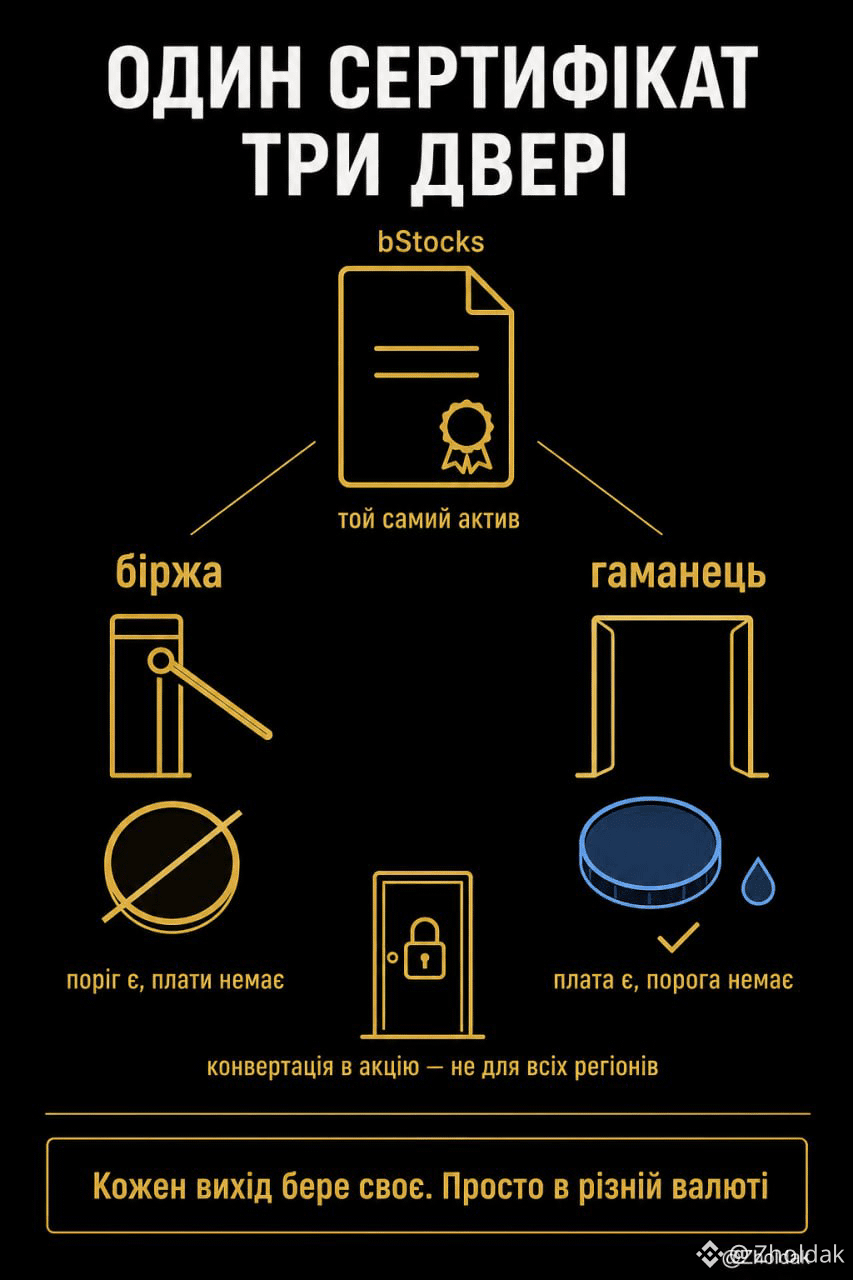
bStockは自分のWeb3ウォレットに出金できる。これにはネットワーク手数料がまったくない、ゼロだ。ただし出金には最低金額があり、それが小さなポジションをふるい落としてしまう。ウォレット内ではトークンをそのまま売るか、流動性プールに入れるか、取引所へ戻すこともできる。
ただし戻すのは有料。ウォレットからの送金はガス代がかかる。トランザクションにサインするのは今や自分自身だからだ。セントのごく小さな端数でも、ゼロにはならない。とはいえ最低出金額はない。つまり、ほんの少しでも送りたいなら送れる。
構図は鏡みたいに逆だ。取引所は「閾値」を取るが「お金」は取らない。ウォレットは「お金」は取るが「閾値」は設けない。
もう一つのルートも試したが、通らなかった。取引所にはbStockを本物の株式に1対1でコンバートするボタンがある。承諾が2つ、免責事項の署名があり、最後の手順で「私の地域ではこの機能は利用できません」というメッセージが出る。ボタンは存在する。ドアも実在する。ただし、誰にでも開いているわけではない。
これは、それが重要になる前に確かめておくべきことだ。
先月、#BStocks ですべてのルートを試してみた。結果のためではなく、限界を理解するためだ。
いつも通り始まった:取引所で買って、保有して、売る。この段階ではbStockは通常のスポットペアのように振る舞う。
bStockは自分のWeb3ウォレットに出金できる。これにはネットワーク手数料がまったくない、ゼロだ。ただし出金には最低金額があり、それが小さなポジションをふるい落としてしまう。ウォレット内ではトークンをそのまま売るか、流動性プールに入れるか、取引所へ戻すこともできる。
ただし戻すのは有料。ウォレットからの送金はガス代がかかる。トランザクションにサインするのは今や自分自身だからだ。セントのごく小さな端数でも、ゼロにはならない。とはいえ最低出金額はない。つまり、ほんの少しでも送りたいなら送れる。
構図は鏡みたいに逆だ。取引所は「閾値」を取るが「お金」は取らない。ウォレットは「お金」は取るが「閾値」は設けない。
もう一つのルートも試したが、通らなかった。取引所にはbStockを本物の株式に1対1でコンバートするボタンがある。承諾が2つ、免責事項の署名があり、最後の手順で「私の地域ではこの機能は利用できません」というメッセージが出る。ボタンは存在する。ドアも実在する。ただし、誰にでも開いているわけではない。
これは、それが重要になる前に確かめておくべきことだ。
いつも通り始まった:取引所で買って、保有して、売る。この段階ではbStockは通常のスポットペアのように振る舞う。
bStockは自分のWeb3ウォレットに出金できる。これにはネットワーク手数料がまったくない、ゼロだ。ただし出金には最低金額があり、それが小さなポジションをふるい落としてしまう。ウォレット内ではトークンをそのまま売るか、流動性プールに入れるか、取引所へ戻すこともできる。
ただし戻すのは有料。ウォレットからの送金はガス代がかかる。トランザクションにサインするのは今や自分自身だからだ。セントのごく小さな端数でも、ゼロにはならない。とはいえ最低出金額はない。つまり、ほんの少しでも送りたいなら送れる。
構図は鏡みたいに逆だ。取引所は「閾値」を取るが「お金」は取らない。ウォレットは「お金」は取るが「閾値」は設けない。
もう一つのルートも試したが、通らなかった。取引所にはbStockを本物の株式に1対1でコンバートするボタンがある。承諾が2つ、免責事項の署名があり、最後の手順で「私の地域ではこの機能は利用できません」というメッセージが出る。ボタンは存在する。ドアも実在する。ただし、誰にでも開いているわけではない。
これは、それが重要になる前に確かめておくべきことだ。
1
206
·
--
ブリッシュ
Binanceでは、同じ米国株に対してエクスポージャーを取る方法が今4つあります。bStock、株の直接購入、TradFiパーペチュアル、そして- 9月1日から- オプションです。
違いはインターフェースではなく、どこで決済(計算)が行われるかにあります。
#bstock は BNBチェーンの証明書です。オンチェーンで決済され、即時です。チェーンには休日がないため、取引は24時間行われます。
#TradFi -パーペチュアルも、取引所の中でステーブルコインを用いて計算され、こちらも休みなく動きます。ただし、保有する資産を付与するものではありません。これは証拠金(マージン)のある取引手段で、必要証拠金の要件があり、価格が急変した場合には清算(リクイディション)が行われます。
次に、別の半分が始まります。
株の直接購入は、すでに本物の有価証券です。Nest Trading は注文を米国のクライアリング(決済)と保管のために Alpaca Securities に送ります。そして米国でのクライアリングは、米国市場のスケジュールに従って稼働します。
オプションも同様に、株の実物引渡し(フィジカル・デリバリー)があります。だから営業時間も市場準拠で、ニューヨーク時間で9:30から16:00までです。この時間枠の外では注文は受け付けられません。
以上がすべての規則性です。2つの手段は、夜がない場所で計算されており、24時間稼働します。残り2つは、眠ってしまうクライアリングを経由して計算され、そのスケジュールに従って動きます。
プラットフォームが営業時間を決めるのではありません。実際に所有者が変わる場所が、それを決めます。
Binanceでは、同じ米国株に対してエクスポージャーを取る方法が今4つあります。bStock、株の直接購入、TradFiパーペチュアル、そして- 9月1日から- オプションです。
違いはインターフェースではなく、どこで決済(計算)が行われるかにあります。
#bstock は BNBチェーンの証明書です。オンチェーンで決済され、即時です。チェーンには休日がないため、取引は24時間行われます。
#TradFi -パーペチュアルも、取引所の中でステーブルコインを用いて計算され、こちらも休みなく動きます。ただし、保有する資産を付与するものではありません。これは証拠金(マージン)のある取引手段で、必要証拠金の要件があり、価格が急変した場合には清算(リクイディション)が行われます。
次に、別の半分が始まります。
株の直接購入は、すでに本物の有価証券です。Nest Trading は注文を米国のクライアリング(決済)と保管のために Alpaca Securities に送ります。そして米国でのクライアリングは、米国市場のスケジュールに従って稼働します。
オプションも同様に、株の実物引渡し(フィジカル・デリバリー)があります。だから営業時間も市場準拠で、ニューヨーク時間で9:30から16:00までです。この時間枠の外では注文は受け付けられません。
以上がすべての規則性です。2つの手段は、夜がない場所で計算されており、24時間稼働します。残り2つは、眠ってしまうクライアリングを経由して計算され、そのスケジュールに従って動きます。
プラットフォームが営業時間を決めるのではありません。実際に所有者が変わる場所が、それを決めます。
違いはインターフェースではなく、どこで決済(計算)が行われるかにあります。
#bstock は BNBチェーンの証明書です。オンチェーンで決済され、即時です。チェーンには休日がないため、取引は24時間行われます。
#TradFi -パーペチュアルも、取引所の中でステーブルコインを用いて計算され、こちらも休みなく動きます。ただし、保有する資産を付与するものではありません。これは証拠金(マージン)のある取引手段で、必要証拠金の要件があり、価格が急変した場合には清算(リクイディション)が行われます。
次に、別の半分が始まります。
株の直接購入は、すでに本物の有価証券です。Nest Trading は注文を米国のクライアリング(決済)と保管のために Alpaca Securities に送ります。そして米国でのクライアリングは、米国市場のスケジュールに従って稼働します。
オプションも同様に、株の実物引渡し(フィジカル・デリバリー)があります。だから営業時間も市場準拠で、ニューヨーク時間で9:30から16:00までです。この時間枠の外では注文は受け付けられません。
以上がすべての規則性です。2つの手段は、夜がない場所で計算されており、24時間稼働します。残り2つは、眠ってしまうクライアリングを経由して計算され、そのスケジュールに従って動きます。
プラットフォームが営業時間を決めるのではありません。実際に所有者が変わる場所が、それを決めます。

98
·
--
ブリッシュ
ナスダックとNYSEは23/5形式へ向かっている:週5日、ほぼ24時間取引が行われる。値動きは正しいが、継続的な市場ではない。
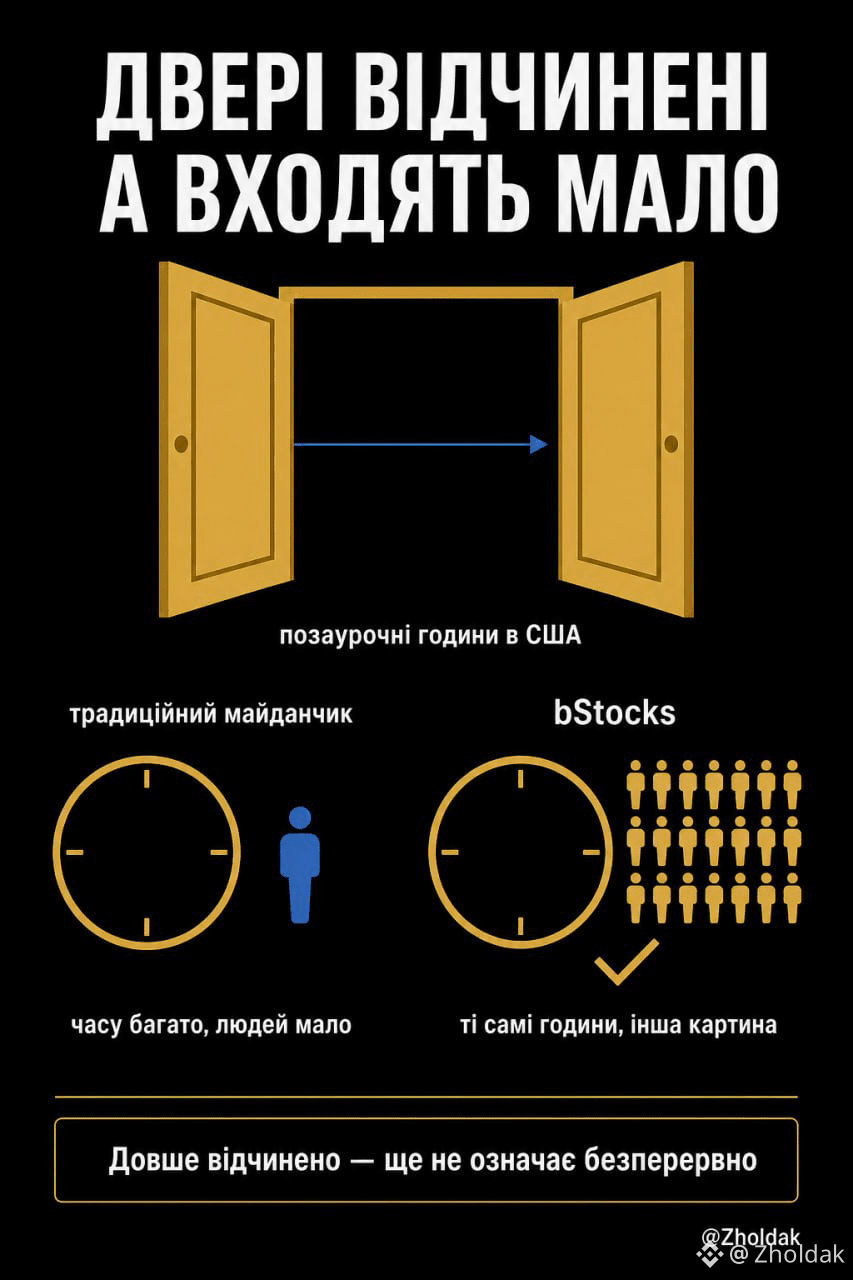
米国での時間外(アフターマーケット)取引は何十年も前から存在する。つまり、ドアはすでに週の大半にわたって開いている。
Binanceのブログからの2つの数字:米国市場の通常の取引時間外には、カレンダー週の80.7%がある一方、7月にその領域に流れた取引量は10.8%。
ドアはほぼ1週間中開いていて、入ってくるのはその十分の一だ。
Binanceの「#BStocks 」では、7月の取引量の62%が、ちょうど米国の市場が閉じているときに発生している。同じ基礎資産で、2つの環境、正反対の状況だ。
Binanceで取引所と取引を担当するシュンイエ・ヤンは、これを構造的に説明する:需要は常にあったが、再編する必要があるのは取引所だけではなく、清算会社、銀行、マーケットメイカーも含まれる。
23/5に移行した後も、毎週約53時間はどの米国の取引所も稼働しないままだ。これはカレンダー週の31.5%。
週末がいちばん厳しい:市場が7日間稼働するには、銀行システムも稼働していなければならない。暗号資産にはこの依存関係はない。ステーブルコインは即時に、そして休日も関係なく決済される。
Binanceは、従来の取引所がまだ閉じていない時間帯をまるごと閉じる。
ナスダックとNYSEは23/5形式へ向かっている:週5日、ほぼ24時間取引が行われる。値動きは正しいが、継続的な市場ではない。
米国での時間外(アフターマーケット)取引は何十年も前から存在する。つまり、ドアはすでに週の大半にわたって開いている。
Binanceのブログからの2つの数字:米国市場の通常の取引時間外には、カレンダー週の80.7%がある一方、7月にその領域に流れた取引量は10.8%。
ドアはほぼ1週間中開いていて、入ってくるのはその十分の一だ。
Binanceの「#BStocks 」では、7月の取引量の62%が、ちょうど米国の市場が閉じているときに発生している。同じ基礎資産で、2つの環境、正反対の状況だ。
Binanceで取引所と取引を担当するシュンイエ・ヤンは、これを構造的に説明する:需要は常にあったが、再編する必要があるのは取引所だけではなく、清算会社、銀行、マーケットメイカーも含まれる。
23/5に移行した後も、毎週約53時間はどの米国の取引所も稼働しないままだ。これはカレンダー週の31.5%。
週末がいちばん厳しい:市場が7日間稼働するには、銀行システムも稼働していなければならない。暗号資産にはこの依存関係はない。ステーブルコインは即時に、そして休日も関係なく決済される。
Binanceは、従来の取引所がまだ閉じていない時間帯をまるごと閉じる。
米国での時間外(アフターマーケット)取引は何十年も前から存在する。つまり、ドアはすでに週の大半にわたって開いている。
Binanceのブログからの2つの数字:米国市場の通常の取引時間外には、カレンダー週の80.7%がある一方、7月にその領域に流れた取引量は10.8%。
ドアはほぼ1週間中開いていて、入ってくるのはその十分の一だ。
Binanceの「#BStocks 」では、7月の取引量の62%が、ちょうど米国の市場が閉じているときに発生している。同じ基礎資産で、2つの環境、正反対の状況だ。
Binanceで取引所と取引を担当するシュンイエ・ヤンは、これを構造的に説明する:需要は常にあったが、再編する必要があるのは取引所だけではなく、清算会社、銀行、マーケットメイカーも含まれる。
23/5に移行した後も、毎週約53時間はどの米国の取引所も稼働しないままだ。これはカレンダー週の31.5%。
週末がいちばん厳しい:市場が7日間稼働するには、銀行システムも稼働していなければならない。暗号資産にはこの依存関係はない。ステーブルコインは即時に、そして休日も関係なく決済される。
Binanceは、従来の取引所がまだ閉じていない時間帯をまるごと閉じる。
69
·
--
ブリッシュ
私の3 BNBがBinance Earnで16か月間に獲得した配分(ナラチュバニヤ)は69回でした。67個のユニークなティッカーで、$LAYER は3回同じものとして重複しました。
最小の配分は0,0964 $EUL 。最大は125,4055 $LINEA 。
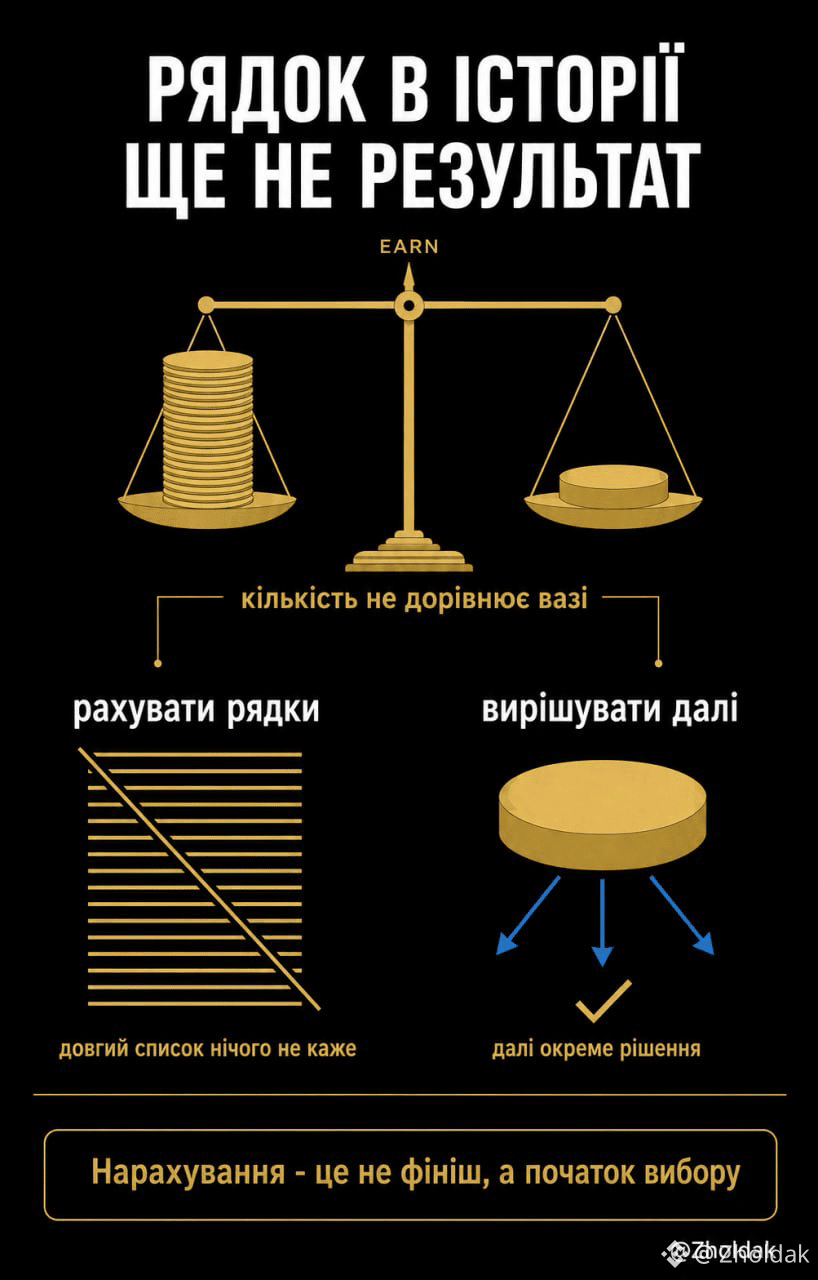
差はとても大きいですが、それはほとんど何も意味しません。
トークンはそれぞれ違います。あるものは発行量が数十億単位で、別のものは数百万単位で、そしてそれぞれの「1」が持つ価値も別です。125個のうちの1つと0.1個のうちの別の1つを比べるのは、キログラムとメートルを比べるのと同じです。
全部をドルに換算するのも解決にはなりません。デビューの足(ローソク)ではアグリゲーターの差が3倍にもなり、最終結果はあなたがどのサイトを開いたか次第になります。
だから、本当に意味のある問いは別です。では、次にそのトークンで何をするのか?
トークンはスポットで受け取られ、そこで別の決断になります。ローンチプールのトークンにはさらにPre-Marketがあり、公式のスポット・リスティング前に売ることができます。
そしてここで、1つ知っておくべきことがあります。ChainCatcherの調査によれば、エアドロップされたトークンの88%は、上場(リスティング)後最初の15日間で値下がりしました。これは統計であってルールではなく、各ケースで異なります。
ただ、それは「配分(ナラチュバニヤ)は終わりではない理由」を説明しています。Binance Earnでのポジションは履歴(履歴の1行)になります。その1行がどういう結果を出すかは、それが終わってから決まります。
#BinanceEarn
{spot}(BNBUSDT)
私の3 BNBがBinance Earnで16か月間に獲得した配分(ナラチュバニヤ)は69回でした。67個のユニークなティッカーで、$LAYER は3回同じものとして重複しました。
最小の配分は0,0964 $EUL 。最大は125,4055 $LINEA 。
差はとても大きいですが、それはほとんど何も意味しません。
トークンはそれぞれ違います。あるものは発行量が数十億単位で、別のものは数百万単位で、そしてそれぞれの「1」が持つ価値も別です。125個のうちの1つと0.1個のうちの別の1つを比べるのは、キログラムとメートルを比べるのと同じです。
全部をドルに換算するのも解決にはなりません。デビューの足(ローソク)ではアグリゲーターの差が3倍にもなり、最終結果はあなたがどのサイトを開いたか次第になります。
だから、本当に意味のある問いは別です。では、次にそのトークンで何をするのか?
トークンはスポットで受け取られ、そこで別の決断になります。ローンチプールのトークンにはさらにPre-Marketがあり、公式のスポット・リスティング前に売ることができます。
そしてここで、1つ知っておくべきことがあります。ChainCatcherの調査によれば、エアドロップされたトークンの88%は、上場(リスティング)後最初の15日間で値下がりしました。これは統計であってルールではなく、各ケースで異なります。
ただ、それは「配分(ナラチュバニヤ)は終わりではない理由」を説明しています。Binance Earnでのポジションは履歴(履歴の1行)になります。その1行がどういう結果を出すかは、それが終わってから決まります。
#BinanceEarn
最小の配分は0,0964 $EUL 。最大は125,4055 $LINEA 。
差はとても大きいですが、それはほとんど何も意味しません。
トークンはそれぞれ違います。あるものは発行量が数十億単位で、別のものは数百万単位で、そしてそれぞれの「1」が持つ価値も別です。125個のうちの1つと0.1個のうちの別の1つを比べるのは、キログラムとメートルを比べるのと同じです。
全部をドルに換算するのも解決にはなりません。デビューの足(ローソク)ではアグリゲーターの差が3倍にもなり、最終結果はあなたがどのサイトを開いたか次第になります。
だから、本当に意味のある問いは別です。では、次にそのトークンで何をするのか?
トークンはスポットで受け取られ、そこで別の決断になります。ローンチプールのトークンにはさらにPre-Marketがあり、公式のスポット・リスティング前に売ることができます。
そしてここで、1つ知っておくべきことがあります。ChainCatcherの調査によれば、エアドロップされたトークンの88%は、上場(リスティング)後最初の15日間で値下がりしました。これは統計であってルールではなく、各ケースで異なります。
ただ、それは「配分(ナラチュバニヤ)は終わりではない理由」を説明しています。Binance Earnでのポジションは履歴(履歴の1行)になります。その1行がどういう結果を出すかは、それが終わってから決まります。
#BinanceEarn
2
1.9k
·
--
ブリッシュ
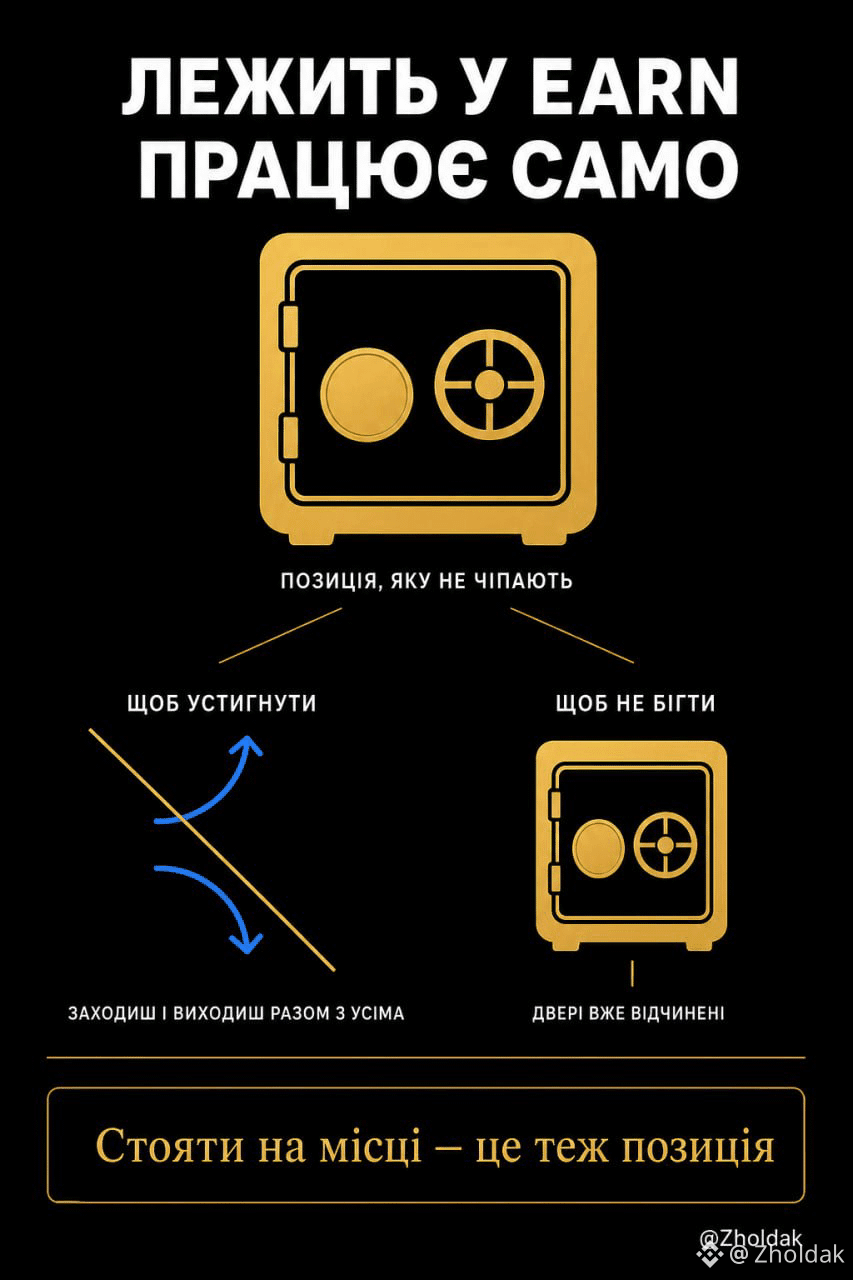
2025年2月からBinance Earnで3 BNBを保有していて、触っていません。
理由はシンプルです。3 BNBはTGE参加のための通常の基準額です。希少なPrimeローンチにはより高い条件があり、それは例外。残りのケースでは、それ以上保有しても意味がなく、下回ればすでに取り分が不足します。
代替案は、アナウンスのたびに買い足すことです。ですが、ここで電卓では見えないものが隠れています。
こうするのは一人ではありません。イベント前は$BNB に入って、終わったらそこから出ます。スパイクで買って、リトレースで売る。そしてその差が、あなたがそこに来た理由の一部を食い潰します。借りるのも同じで、しかも利息付きです。
だから私はタイミングを取りにいきません。3 BNBはただ置いておく。TGEが来たら、私はすでに参加しています。
そのうえ、ポジションが自分で自分を回収してくれることも分かりました。16か月で69の付与:9つのローンチプールと60のホルダー向けエアドロップ。私はそれらに対して何もしていないのに、当然のように、元から置いてあった残高に入ってきました。
仕組みは別物です。ローンチプールの期間は事前に発表されます。一方、ホルダー向けエアドロップのための残高スナップショットは—事前には分かりません。つまり、期間は事後になってから判明します。だから、その直前にBNBを入れても意味がありません。
つまり、保有していれば両方の目的が満たせる—TGEの基準も、配分の資格も。
リスクは一般的です。BNBの価格は上下どちらにも動きますし、付与は誰も保証しません。
#BinanceEarn
{spot}(BNBUSDT)
2025年2月からBinance Earnで3 BNBを保有していて、触っていません。
理由はシンプルです。3 BNBはTGE参加のための通常の基準額です。希少なPrimeローンチにはより高い条件があり、それは例外。残りのケースでは、それ以上保有しても意味がなく、下回ればすでに取り分が不足します。
代替案は、アナウンスのたびに買い足すことです。ですが、ここで電卓では見えないものが隠れています。
こうするのは一人ではありません。イベント前は$BNB に入って、終わったらそこから出ます。スパイクで買って、リトレースで売る。そしてその差が、あなたがそこに来た理由の一部を食い潰します。借りるのも同じで、しかも利息付きです。
だから私はタイミングを取りにいきません。3 BNBはただ置いておく。TGEが来たら、私はすでに参加しています。
そのうえ、ポジションが自分で自分を回収してくれることも分かりました。16か月で69の付与:9つのローンチプールと60のホルダー向けエアドロップ。私はそれらに対して何もしていないのに、当然のように、元から置いてあった残高に入ってきました。
仕組みは別物です。ローンチプールの期間は事前に発表されます。一方、ホルダー向けエアドロップのための残高スナップショットは—事前には分かりません。つまり、期間は事後になってから判明します。だから、その直前にBNBを入れても意味がありません。
つまり、保有していれば両方の目的が満たせる—TGEの基準も、配分の資格も。
リスクは一般的です。BNBの価格は上下どちらにも動きますし、付与は誰も保証しません。
#BinanceEarn
理由はシンプルです。3 BNBはTGE参加のための通常の基準額です。希少なPrimeローンチにはより高い条件があり、それは例外。残りのケースでは、それ以上保有しても意味がなく、下回ればすでに取り分が不足します。
代替案は、アナウンスのたびに買い足すことです。ですが、ここで電卓では見えないものが隠れています。
こうするのは一人ではありません。イベント前は$BNB に入って、終わったらそこから出ます。スパイクで買って、リトレースで売る。そしてその差が、あなたがそこに来た理由の一部を食い潰します。借りるのも同じで、しかも利息付きです。
だから私はタイミングを取りにいきません。3 BNBはただ置いておく。TGEが来たら、私はすでに参加しています。
そのうえ、ポジションが自分で自分を回収してくれることも分かりました。16か月で69の付与:9つのローンチプールと60のホルダー向けエアドロップ。私はそれらに対して何もしていないのに、当然のように、元から置いてあった残高に入ってきました。
仕組みは別物です。ローンチプールの期間は事前に発表されます。一方、ホルダー向けエアドロップのための残高スナップショットは—事前には分かりません。つまり、期間は事後になってから判明します。だから、その直前にBNBを入れても意味がありません。
つまり、保有していれば両方の目的が満たせる—TGEの基準も、配分の資格も。
リスクは一般的です。BNBの価格は上下どちらにも動きますし、付与は誰も保証しません。
#BinanceEarn
3
1.2k
·
--
まさに――そして、その順序は単発ではなく一貫しています。3つの異なるティッカーで同じ最終ステップが行われ、ETFも含まれます。つまり、特定の論文によるものではなく、その“機能”がゲートされているということです。さらにそれは、あなたが同意する開示と、必要になる許可が2つの別々のゲートであり、順番もその通りだという意味でもあります。
まさに――そして、その順序は単発ではなく一貫しています。3つの異なるティッカーで同じ最終ステップが行われ、ETFも含まれます。つまり、特定の論文によるものではなく、その“機能”がゲートされているということです。さらにそれは、あなたが同意する開示と、必要になる許可が2つの別々のゲートであり、順番もその通りだという意味でもあります。
1
70
·
--
ブリッシュ
#bstockscis @BinanceCIS
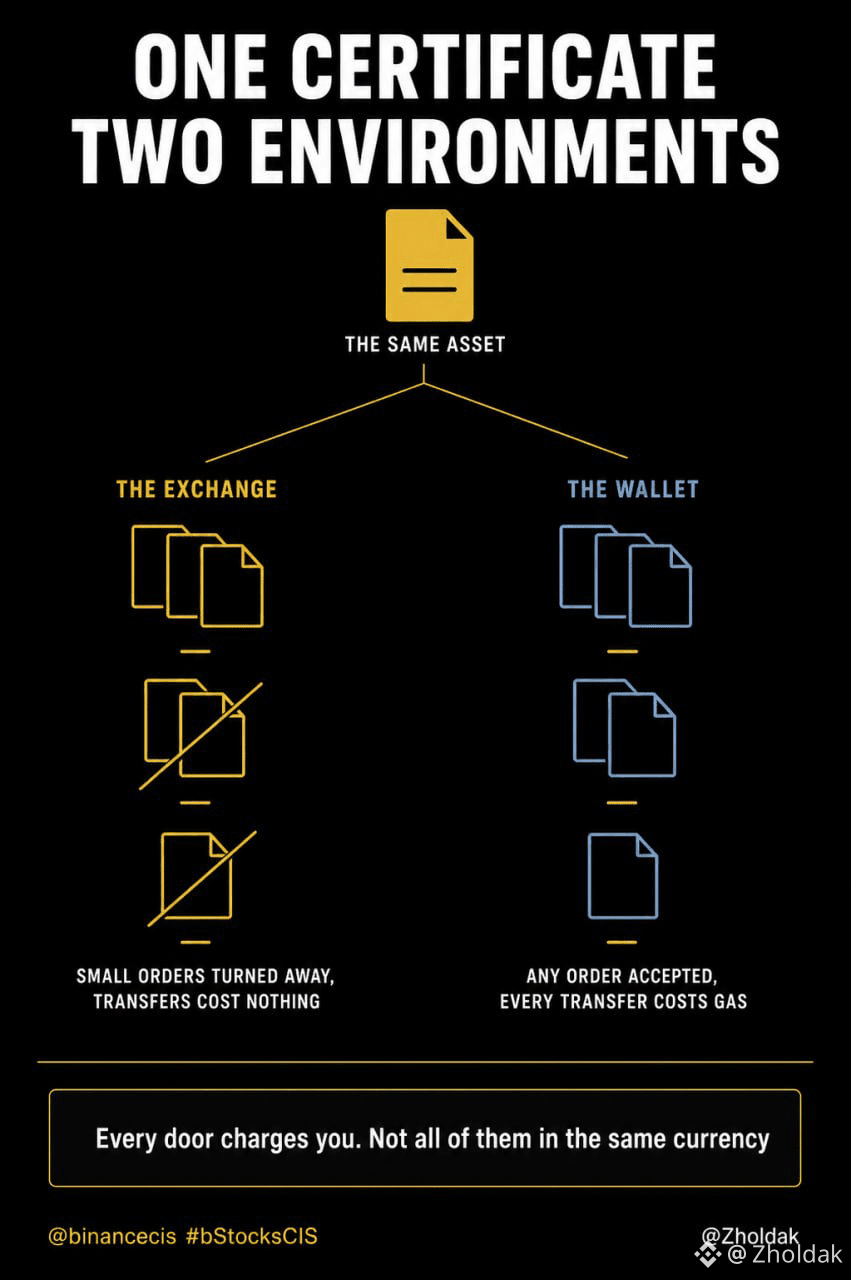
証明書は1つ、環境は2つ。同じ資産、同じ権利、同じチェーン。違うのはその周りの仕組みで、いま自分がどちら側に立っているのかを知っておく価値があります。
Binance Spotで$SPCXB を買うのは板取引です。指値か成行か、どこに座るかを選ぶのはあなたで、座る場所が役割と手数料を決めます。10日前にその間違いを書きました。
Binance Web3 Walletでは、同じことを期待してプロフェッショナルタブを開きました。見た目は同じです。買う/売る、注文種別の入力欄、サイズのスライダー。ですが注文種別は「Market」、その下の設定は価格ではありません。スリッページ許容、ネットワーク手数料、ルーティング提供者です。板に座ることができません。プールに対して価格を付けるので、設定した値は、取引をやめたくなるところまでどれだけズレうるかを決めます。
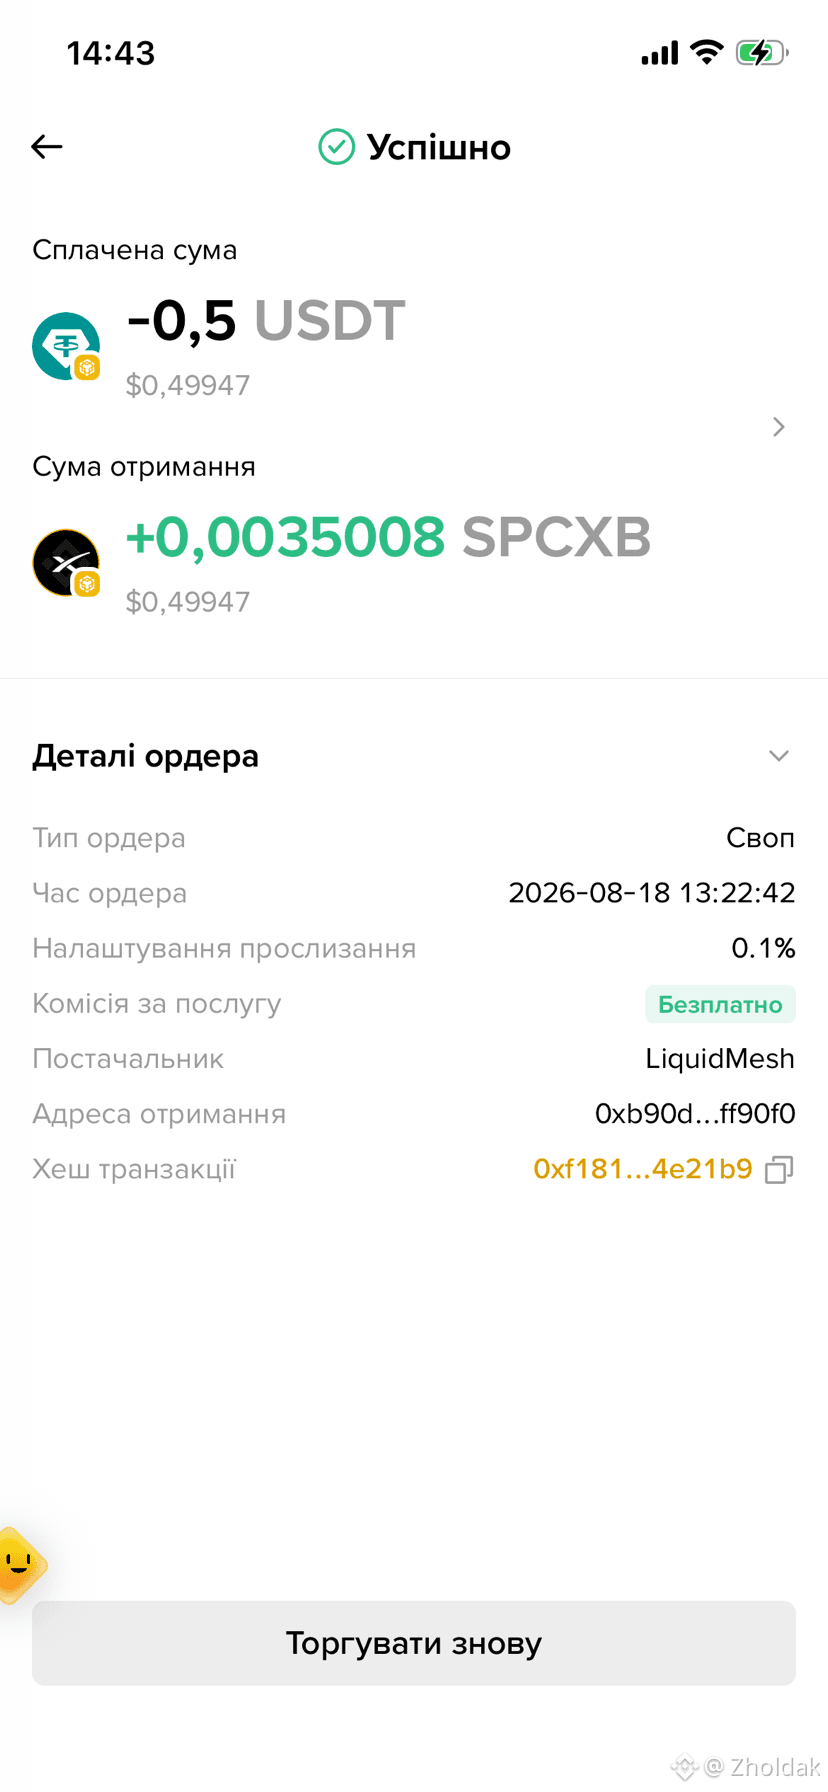
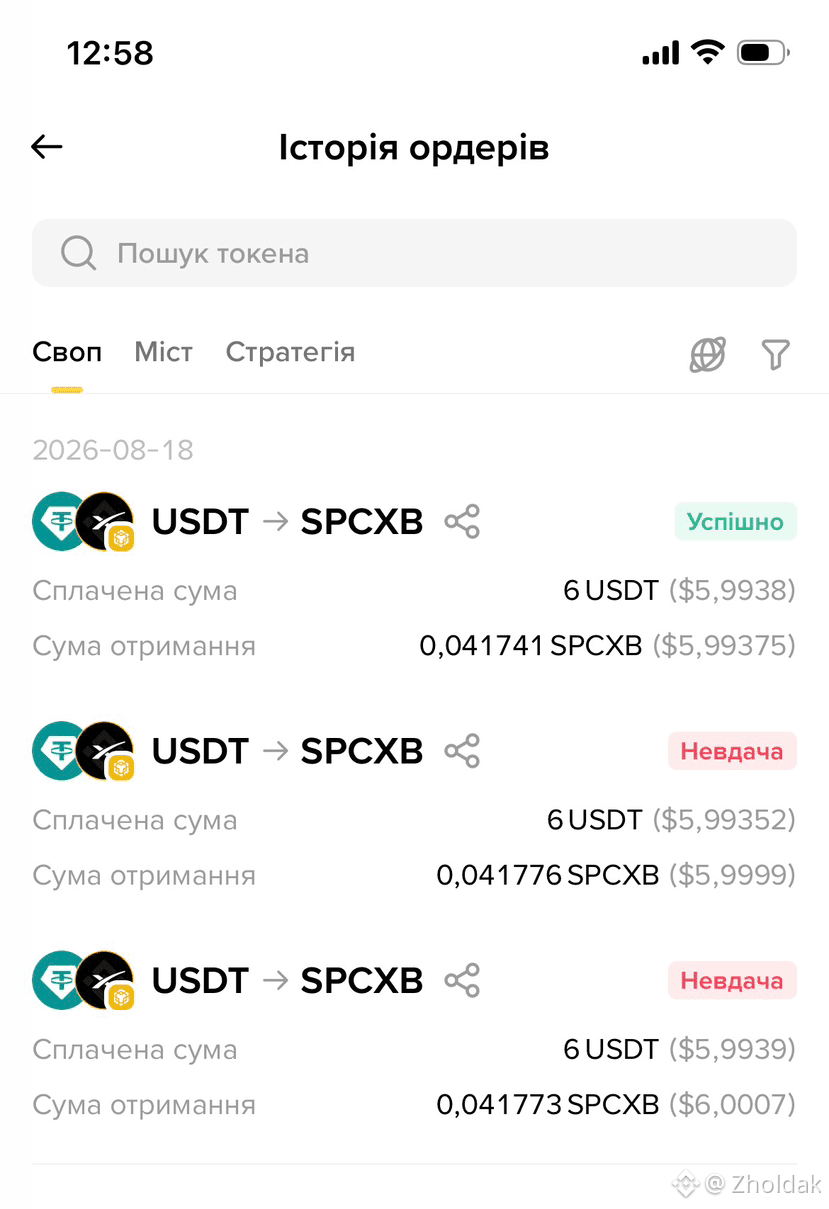
0.1%にして、買いを押しました。2回は通らず、3回目で通りました🤷
最初の2回は、約定した1回よりもSPCXBをより多く提示されていました。これは失敗ではなく設計どおりです。フライト中にプールが私の許容を超えたため、悪い条件で約定する前に取り消されたのです。
取引所では未約定の指値が待ってくれます。オンチェーンでは話は終わりで、改めて提示し直します。
そして、私が実際に持ち帰った本質。どちらもエントリー時にあなたに請求します。ただし別の通貨で。
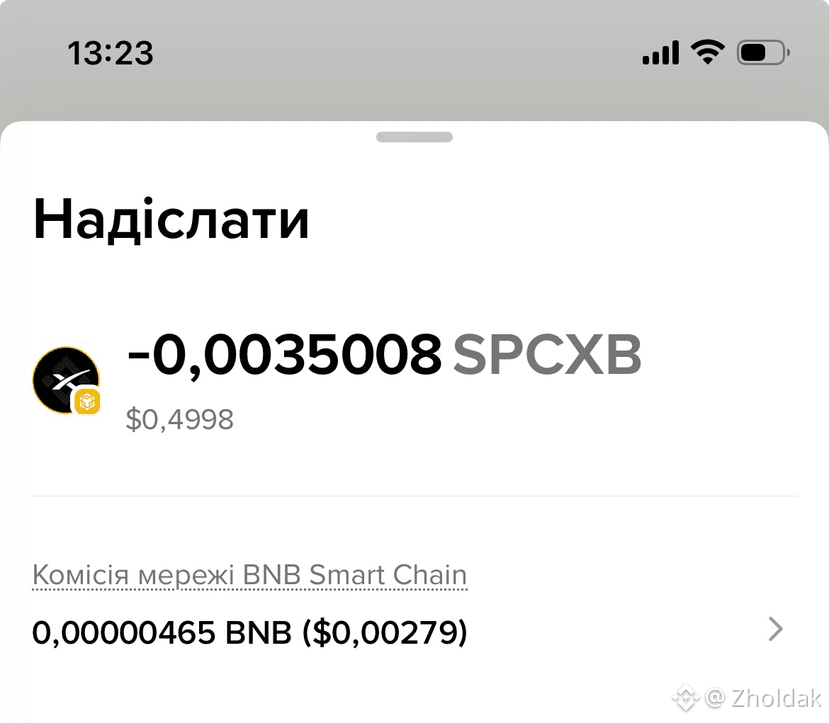
Spotはしきい値で請求されます。最低注文額5ドル、最低SPCXB出金額0.005。取引所側では、外に出すのにネットワーク手数料は一切かかりません。
ウォレット側はガスで請求されます。私は6ドル、次に3ドル、そして50セントで買いましたが、何も文句を言われませんでした。返してSpotに送るたびにBNBが必要です。1セント未満の端数でも、ゼロにはなりません。今度は私がサインしているからです。
どちらのルートも機能し、もう一方のための回避策でもありません。違うのは、支払う料金所の通行料を別の単位で払うだけです。
出典:自分自身のWeb3 Walletでの取引および転送履歴、SPCXBの出金画面と入金記録、2026年8月18日、UTC+3。
@BinanceCIS あなたはどちら側で買っていますか?
#bStocksCIS
{spot}(SPCXBUSDT)
#bstockscis @BinanceCIS
証明書は1つ、環境は2つ。同じ資産、同じ権利、同じチェーン。違うのはその周りの仕組みで、いま自分がどちら側に立っているのかを知っておく価値があります。
Binance Spotで$SPCXB を買うのは板取引です。指値か成行か、どこに座るかを選ぶのはあなたで、座る場所が役割と手数料を決めます。10日前にその間違いを書きました。
Binance Web3 Walletでは、同じことを期待してプロフェッショナルタブを開きました。見た目は同じです。買う/売る、注文種別の入力欄、サイズのスライダー。ですが注文種別は「Market」、その下の設定は価格ではありません。スリッページ許容、ネットワーク手数料、ルーティング提供者です。板に座ることができません。プールに対して価格を付けるので、設定した値は、取引をやめたくなるところまでどれだけズレうるかを決めます。
0.1%にして、買いを押しました。2回は通らず、3回目で通りました🤷
最初の2回は、約定した1回よりもSPCXBをより多く提示されていました。これは失敗ではなく設計どおりです。フライト中にプールが私の許容を超えたため、悪い条件で約定する前に取り消されたのです。
取引所では未約定の指値が待ってくれます。オンチェーンでは話は終わりで、改めて提示し直します。
そして、私が実際に持ち帰った本質。どちらもエントリー時にあなたに請求します。ただし別の通貨で。
Spotはしきい値で請求されます。最低注文額5ドル、最低SPCXB出金額0.005。取引所側では、外に出すのにネットワーク手数料は一切かかりません。
ウォレット側はガスで請求されます。私は6ドル、次に3ドル、そして50セントで買いましたが、何も文句を言われませんでした。返してSpotに送るたびにBNBが必要です。1セント未満の端数でも、ゼロにはなりません。今度は私がサインしているからです。
どちらのルートも機能し、もう一方のための回避策でもありません。違うのは、支払う料金所の通行料を別の単位で払うだけです。
出典:自分自身のWeb3 Walletでの取引および転送履歴、SPCXBの出金画面と入金記録、2026年8月18日、UTC+3。
@BinanceCIS あなたはどちら側で買っていますか?
#bStocksCIS
証明書は1つ、環境は2つ。同じ資産、同じ権利、同じチェーン。違うのはその周りの仕組みで、いま自分がどちら側に立っているのかを知っておく価値があります。
Binance Spotで$SPCXB を買うのは板取引です。指値か成行か、どこに座るかを選ぶのはあなたで、座る場所が役割と手数料を決めます。10日前にその間違いを書きました。
Binance Web3 Walletでは、同じことを期待してプロフェッショナルタブを開きました。見た目は同じです。買う/売る、注文種別の入力欄、サイズのスライダー。ですが注文種別は「Market」、その下の設定は価格ではありません。スリッページ許容、ネットワーク手数料、ルーティング提供者です。板に座ることができません。プールに対して価格を付けるので、設定した値は、取引をやめたくなるところまでどれだけズレうるかを決めます。
0.1%にして、買いを押しました。2回は通らず、3回目で通りました🤷
最初の2回は、約定した1回よりもSPCXBをより多く提示されていました。これは失敗ではなく設計どおりです。フライト中にプールが私の許容を超えたため、悪い条件で約定する前に取り消されたのです。
取引所では未約定の指値が待ってくれます。オンチェーンでは話は終わりで、改めて提示し直します。
そして、私が実際に持ち帰った本質。どちらもエントリー時にあなたに請求します。ただし別の通貨で。
Spotはしきい値で請求されます。最低注文額5ドル、最低SPCXB出金額0.005。取引所側では、外に出すのにネットワーク手数料は一切かかりません。
ウォレット側はガスで請求されます。私は6ドル、次に3ドル、そして50セントで買いましたが、何も文句を言われませんでした。返してSpotに送るたびにBNBが必要です。1セント未満の端数でも、ゼロにはなりません。今度は私がサインしているからです。
どちらのルートも機能し、もう一方のための回避策でもありません。違うのは、支払う料金所の通行料を別の単位で払うだけです。
出典:自分自身のWeb3 Walletでの取引および転送履歴、SPCXBの出金画面と入金記録、2026年8月18日、UTC+3。
@BinanceCIS あなたはどちら側で買っていますか?
#bStocksCIS
11
7
150
·
--
ブリッシュ
#bstockscis @BinanceCIS
交換レートは1対1です。それにたどり着くのは別問題ですが。
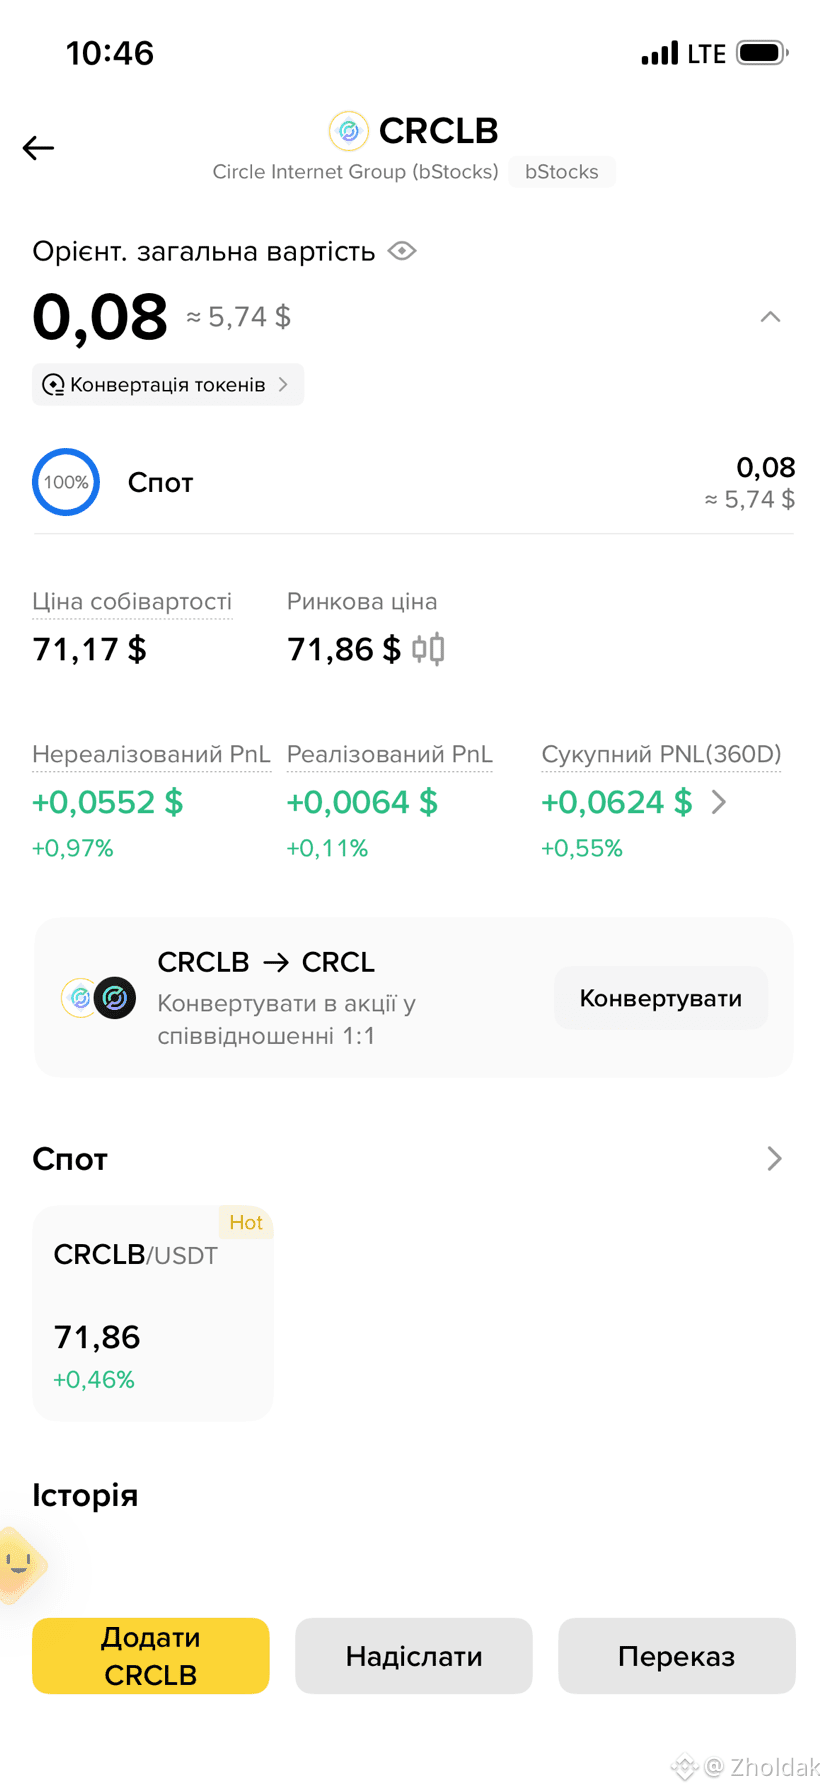
今日は bStock を実際の株に換えようと試してみました。まず $CRCLB 、次に $EWYB 。どちらのカードも同じ文言が載っています。「1:1で株式に交換する」。5日前にそのボタンで止めていて押しませんでしたが、今日は押しました。
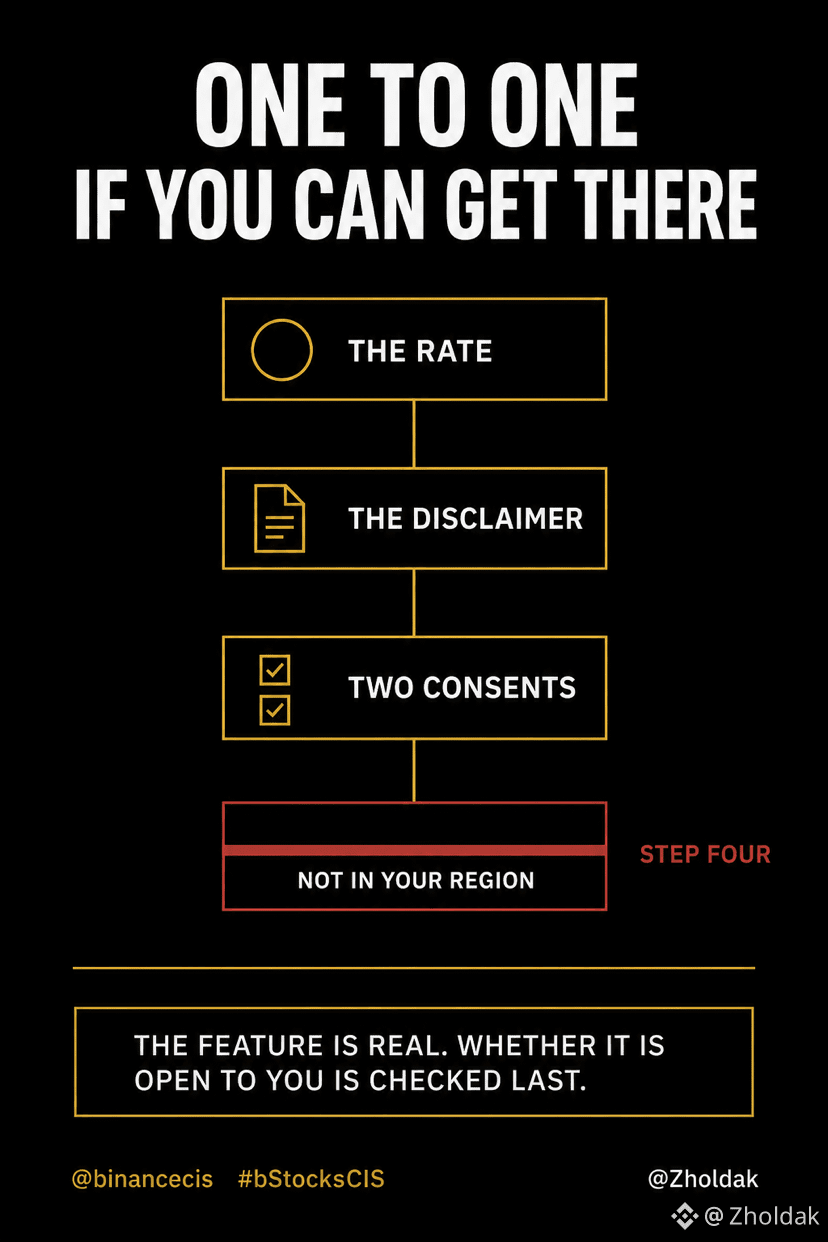
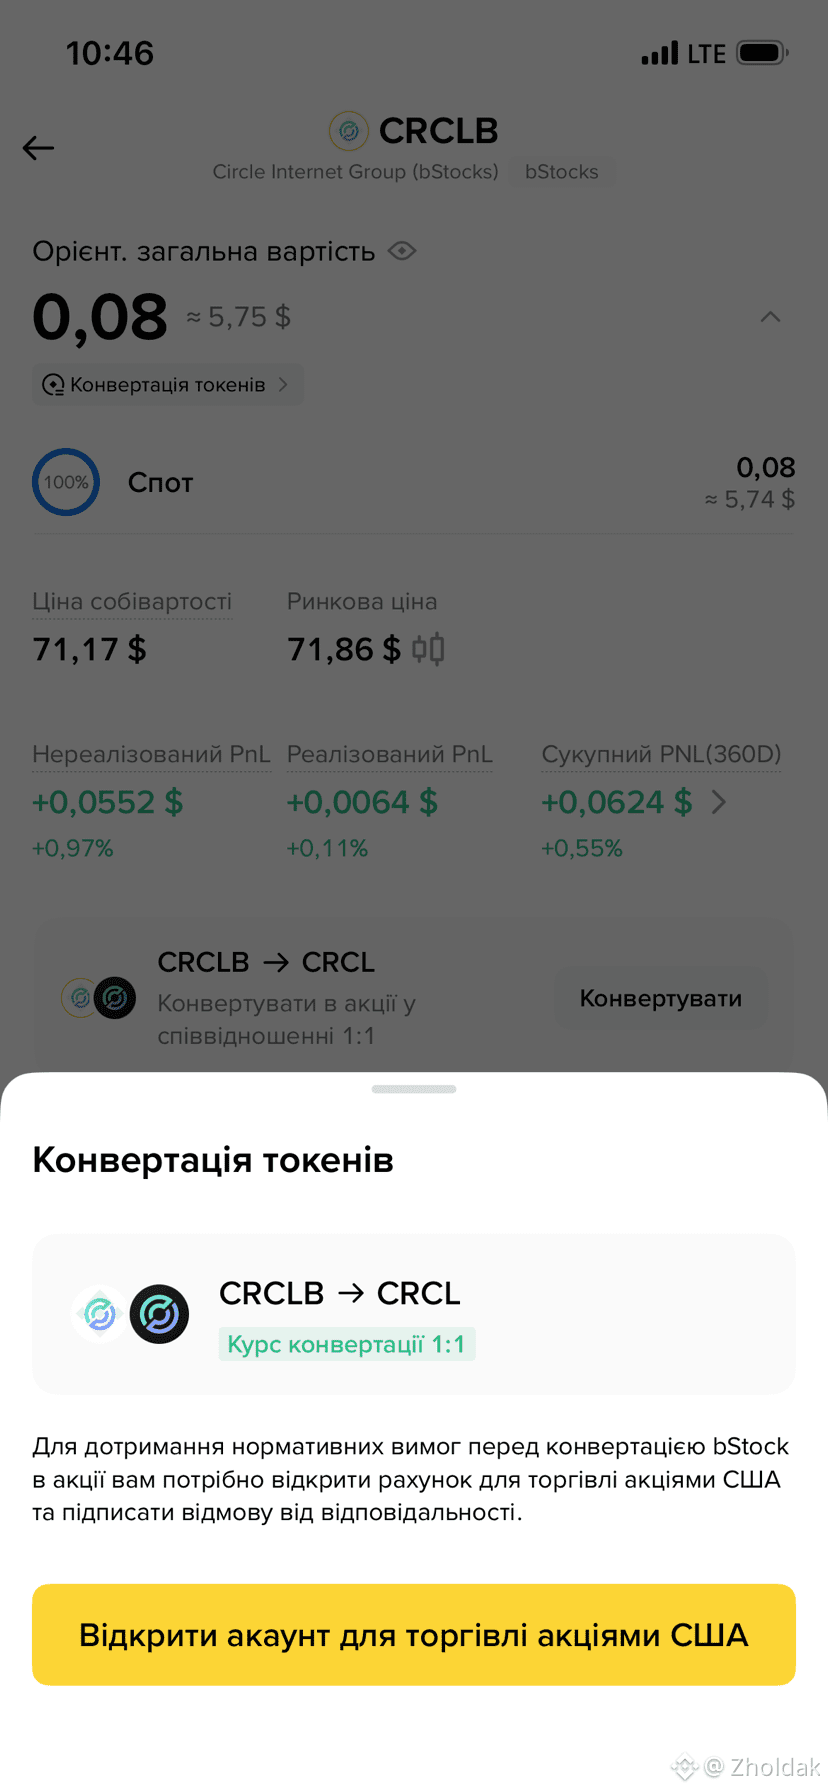
ステップ1:1:1のレートを確認するパネルと、規制上、最初に米国の株取引用口座と署名済みの免責同意書が必要だという注意書き。
ステップ2:免責同意書自体。スクロールするより読む価値があります。Nest Trading Limited があなたのブローカーとして機能し、注文は執行・清算・決済・保管のために、その清算パートナーである Alpaca Securities LLC に渡されます。Binance はあなたの証券を処理したり保管したりしません。これは、私の bStock を保有しているチェーンとは別の「保管(custody)」の連鎖で、何かに同意する前に明記されています。
ステップ3:チェックボックスが2つ――商品条件、そしてデータを Alpaca に渡すことへの同意。両方にチェックを入れて、確認を押しました。
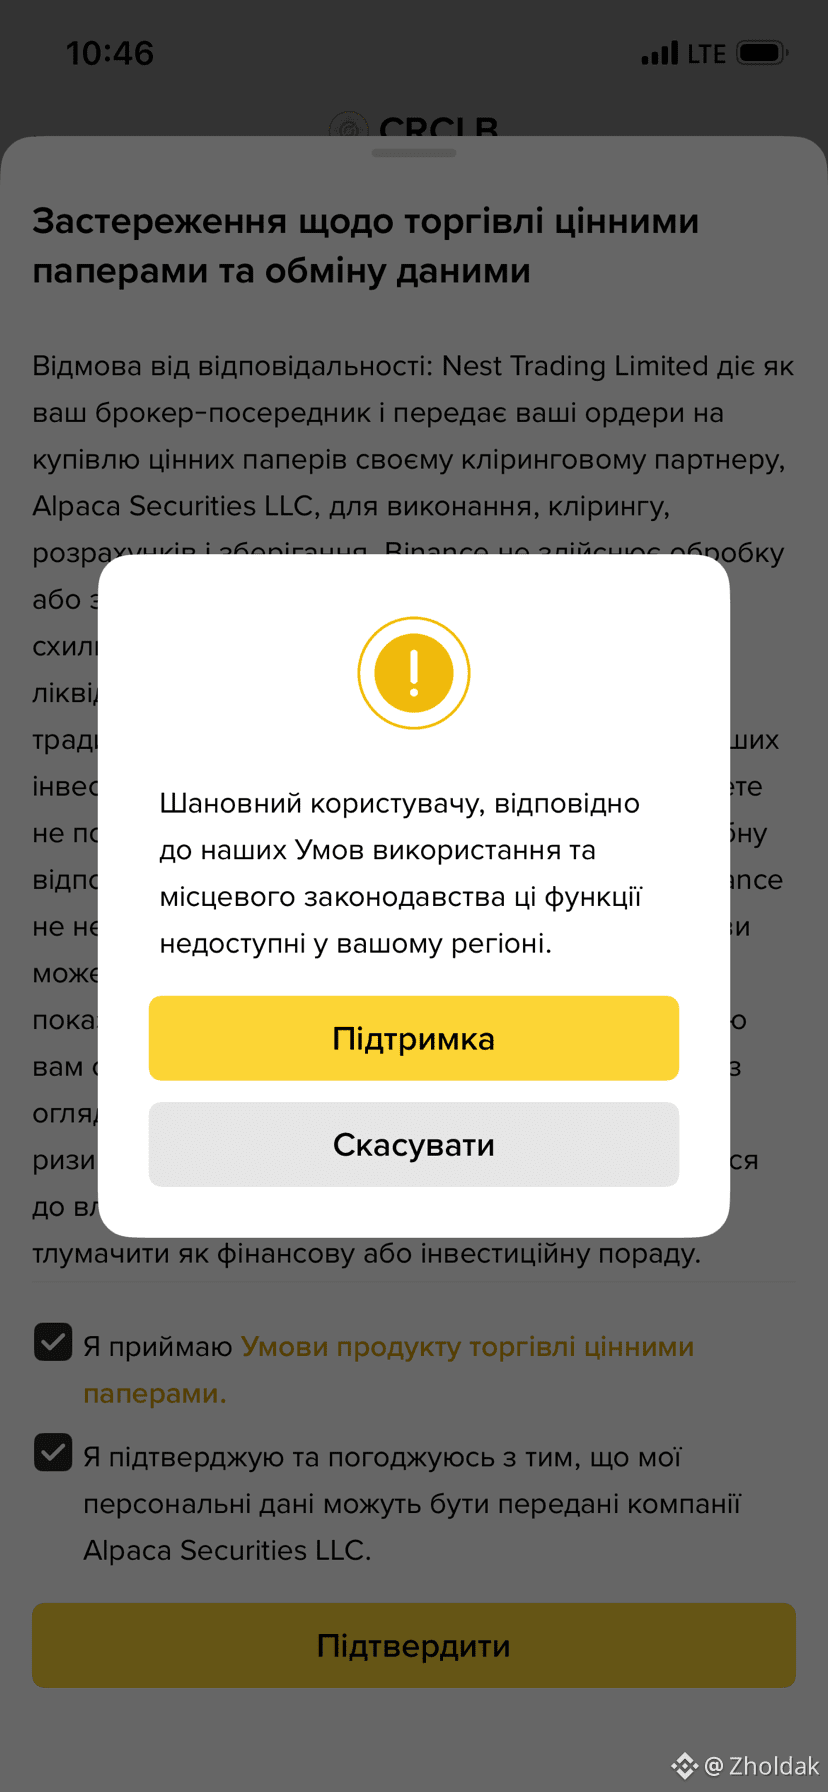
ステップ4:これらの機能はお住まいの地域では利用できません。
2つのティッカーで同じ結果でした。6分違い。
結果には腹は立てていません――ルールはルールで、なぜそうなるのかメッセージは明確です。私が気づいたのは順番です。1:1への変換は商品の実際の性質で、カード上でも宣伝されています。それを使えるかどうかは、どこにいるかに左右され、2つの同意とデータ共有契約の後、最後にそのチェックが走るのです。
だから、同じ立場の人向けに正直に言うと:あなたは額面どおり1株へ換算される証明書を持っているが、その「換算」は通り抜けていけるドアではないかもしれません。あなたがどちら側にいるのか、あなたにとって重要になる前に確認しておく価値があります。
出典:Binance アプリ内の私自身の CRCLB および EWYB の換算画面、2026年8月17日 10:46 と 10:47(キーウ時間)。
@BinanceCIS 変換が実際にあなたに開かれているか確認しましたか?
#bStocksCIS
#bstockscis @BinanceCIS
交換レートは1対1です。それにたどり着くのは別問題ですが。
今日は bStock を実際の株に換えようと試してみました。まず $CRCLB 、次に $EWYB 。どちらのカードも同じ文言が載っています。「1:1で株式に交換する」。5日前にそのボタンで止めていて押しませんでしたが、今日は押しました。
ステップ1:1:1のレートを確認するパネルと、規制上、最初に米国の株取引用口座と署名済みの免責同意書が必要だという注意書き。
ステップ2:免責同意書自体。スクロールするより読む価値があります。Nest Trading Limited があなたのブローカーとして機能し、注文は執行・清算・決済・保管のために、その清算パートナーである Alpaca Securities LLC に渡されます。Binance はあなたの証券を処理したり保管したりしません。これは、私の bStock を保有しているチェーンとは別の「保管(custody)」の連鎖で、何かに同意する前に明記されています。
ステップ3:チェックボックスが2つ――商品条件、そしてデータを Alpaca に渡すことへの同意。両方にチェックを入れて、確認を押しました。
ステップ4:これらの機能はお住まいの地域では利用できません。
2つのティッカーで同じ結果でした。6分違い。
結果には腹は立てていません――ルールはルールで、なぜそうなるのかメッセージは明確です。私が気づいたのは順番です。1:1への変換は商品の実際の性質で、カード上でも宣伝されています。それを使えるかどうかは、どこにいるかに左右され、2つの同意とデータ共有契約の後、最後にそのチェックが走るのです。
だから、同じ立場の人向けに正直に言うと:あなたは額面どおり1株へ換算される証明書を持っているが、その「換算」は通り抜けていけるドアではないかもしれません。あなたがどちら側にいるのか、あなたにとって重要になる前に確認しておく価値があります。
出典:Binance アプリ内の私自身の CRCLB および EWYB の換算画面、2026年8月17日 10:46 と 10:47(キーウ時間)。
@BinanceCIS 変換が実際にあなたに開かれているか確認しましたか?
#bStocksCIS
交換レートは1対1です。それにたどり着くのは別問題ですが。
今日は bStock を実際の株に換えようと試してみました。まず $CRCLB 、次に $EWYB 。どちらのカードも同じ文言が載っています。「1:1で株式に交換する」。5日前にそのボタンで止めていて押しませんでしたが、今日は押しました。
ステップ1:1:1のレートを確認するパネルと、規制上、最初に米国の株取引用口座と署名済みの免責同意書が必要だという注意書き。
ステップ2:免責同意書自体。スクロールするより読む価値があります。Nest Trading Limited があなたのブローカーとして機能し、注文は執行・清算・決済・保管のために、その清算パートナーである Alpaca Securities LLC に渡されます。Binance はあなたの証券を処理したり保管したりしません。これは、私の bStock を保有しているチェーンとは別の「保管(custody)」の連鎖で、何かに同意する前に明記されています。
ステップ3:チェックボックスが2つ――商品条件、そしてデータを Alpaca に渡すことへの同意。両方にチェックを入れて、確認を押しました。
ステップ4:これらの機能はお住まいの地域では利用できません。
2つのティッカーで同じ結果でした。6分違い。
結果には腹は立てていません――ルールはルールで、なぜそうなるのかメッセージは明確です。私が気づいたのは順番です。1:1への変換は商品の実際の性質で、カード上でも宣伝されています。それを使えるかどうかは、どこにいるかに左右され、2つの同意とデータ共有契約の後、最後にそのチェックが走るのです。
だから、同じ立場の人向けに正直に言うと:あなたは額面どおり1株へ換算される証明書を持っているが、その「換算」は通り抜けていけるドアではないかもしれません。あなたがどちら側にいるのか、あなたにとって重要になる前に確認しておく価値があります。
出典:Binance アプリ内の私自身の CRCLB および EWYB の換算画面、2026年8月17日 10:46 と 10:47(キーウ時間)。
@BinanceCIS 変換が実際にあなたに開かれているか確認しましたか?
#bStocksCIS
10
8
170
·
--
ブリッシュ
#bstockscis @BinanceCIS
昨日、トークン化された株式を流動性プールに入れて、出てきた結果を報告すると約束しました。ここにあります。
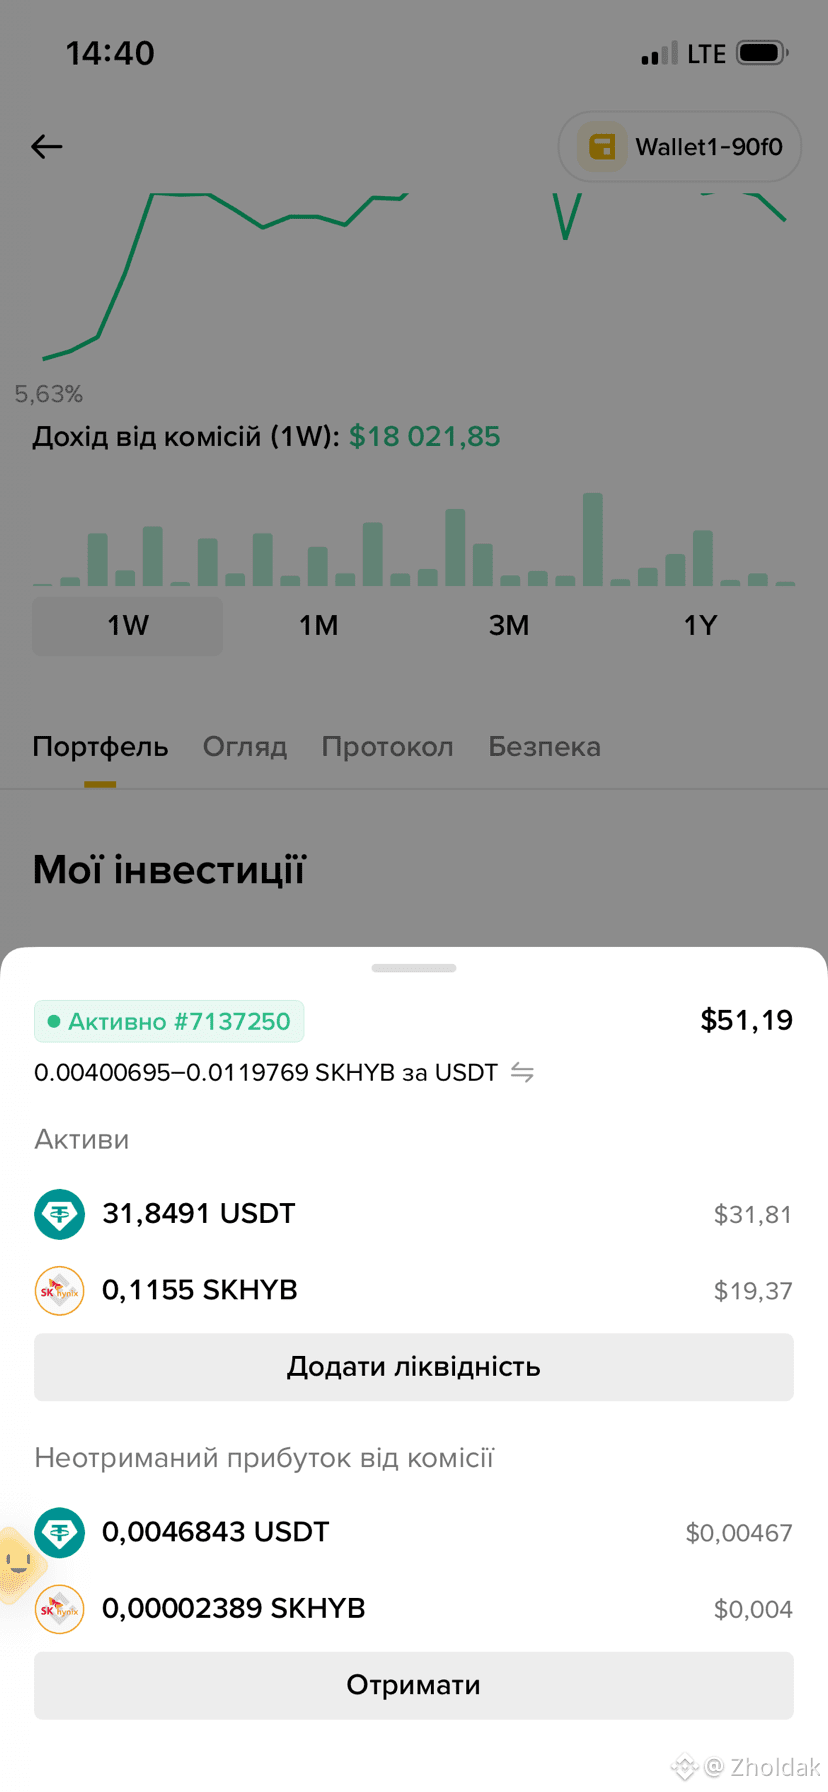
入金(In):8月15日 17:02 0.118($SKHYB )および 31.44563 USDT。
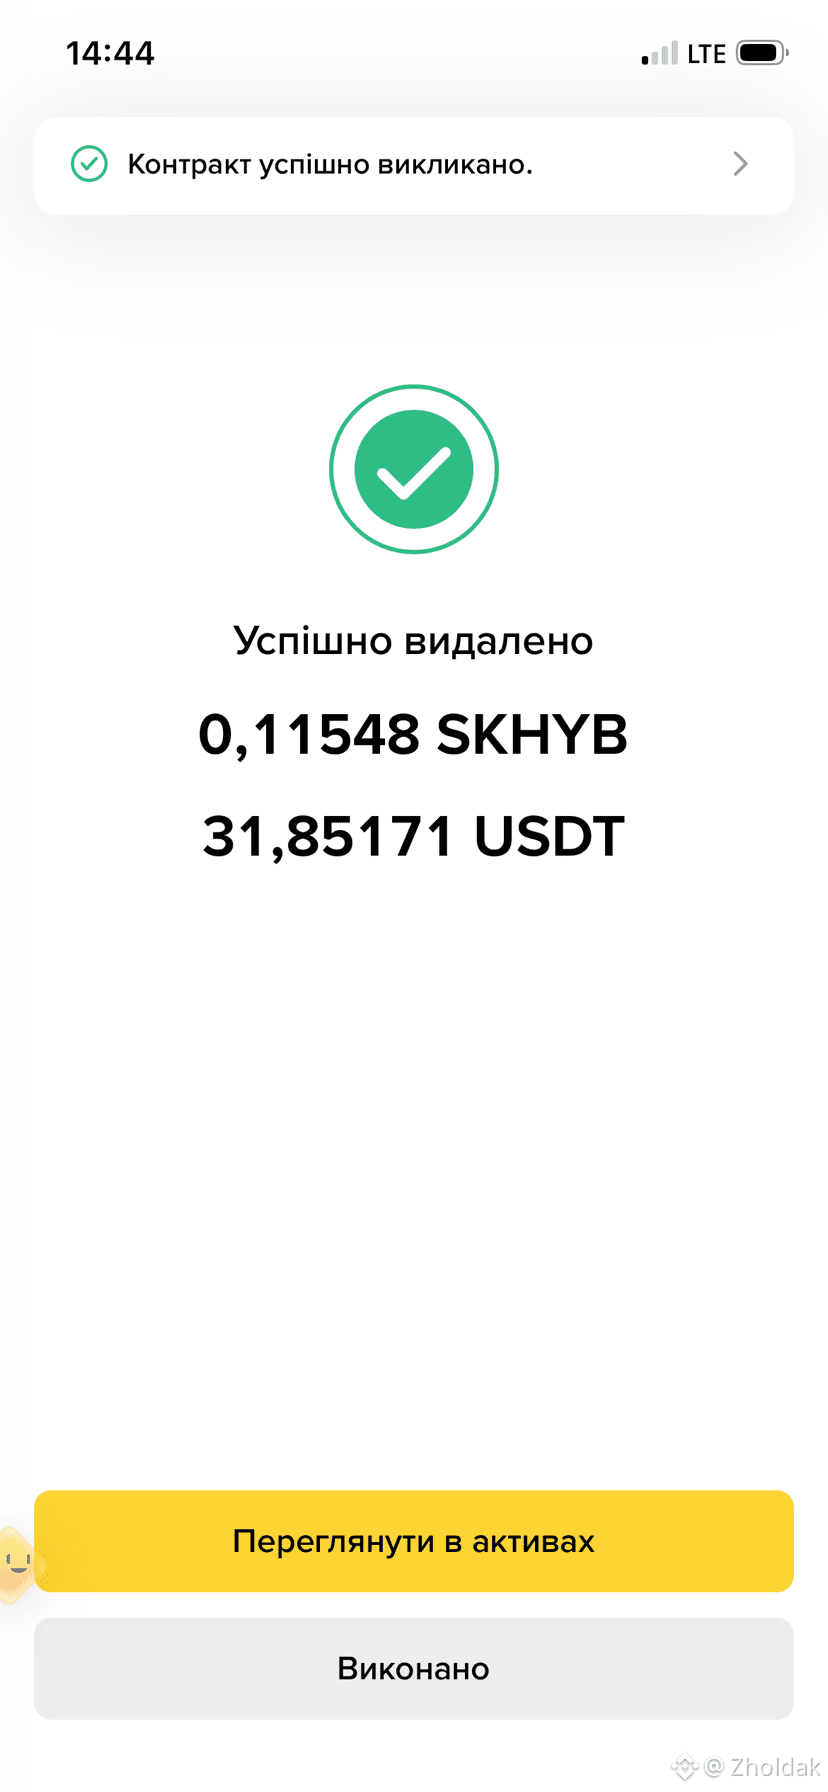
出金(Out):今日 14:44 0.11548 SKHYB および 31.85171 USDT。
株数を減らして、ドルを増やす。価値ベースではほぼ相殺されました——トークンの約42セント分がUSDTの約41セント分になっただけです。21時間にわたって得られた手数料は、1セント未満。
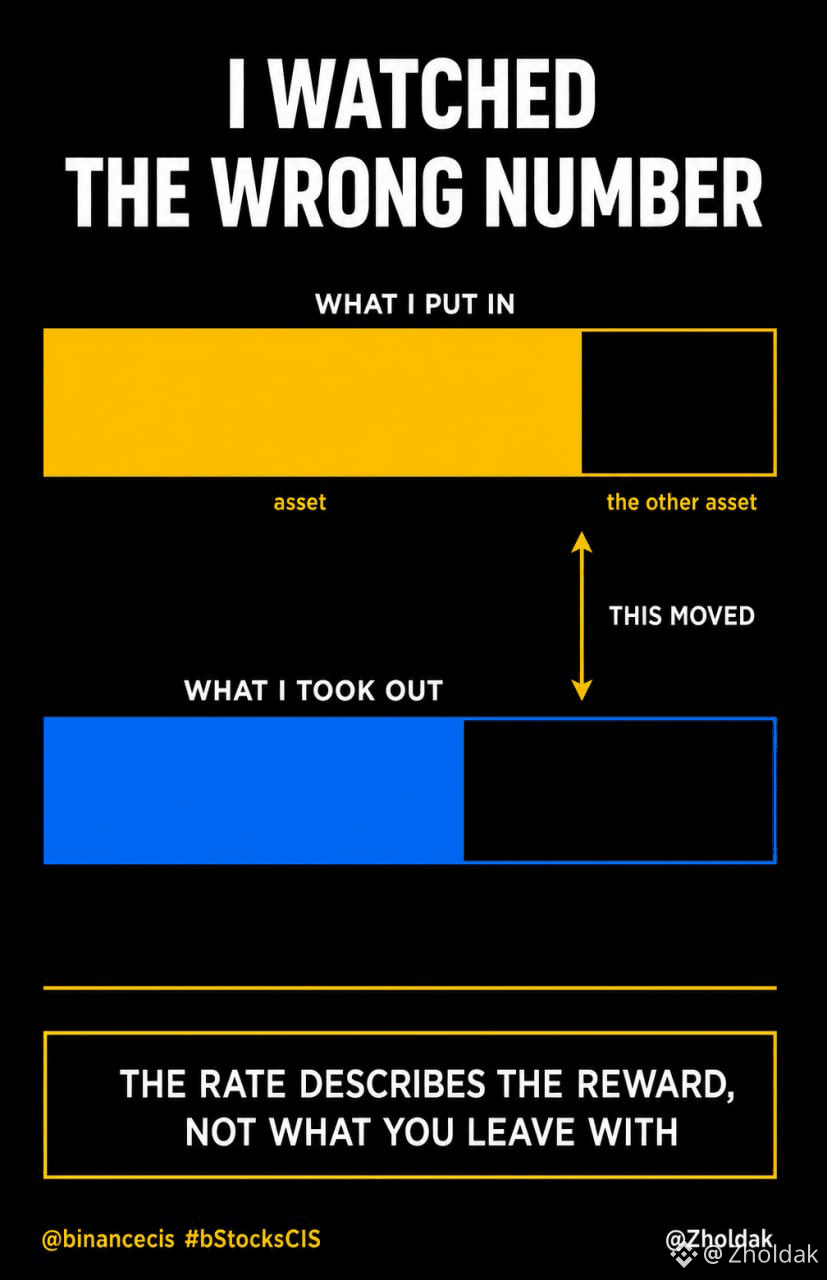
つまり、プールは私が眠っている間にSK hynixにおける私の持ち分の約2%を売り払い、特権として私に1セント未満のごく一部を支払ったということです。私が実際に持つことになったものの変化は、得た報酬の約50倍の大きさでした。
暗号資産のペアなら、よくあるトレードオフです。bStockでは、その着地は違ってくると思います。これは供給量を投機しているトークンではありません。現実の株式に対する証明書であり、保有する理由は特定の企業へのエクスポージャーです。流動性プールはそれを知りません。価格があなたのレンジをまたぐたびに、注文フローだけを根拠に、事業における持ち分を削ったり足したりします。
それは欠陥ではありません。流動性提供とはそういうものですし、そこに入れたものなら何でも同じ仕組みが適用されます。ですが、株式という資産クラスでは「始めたときと違う金額になってしまった」というのは端数の丸めではなく、意思決定の問題です。
エクスポージャーを決める前に知っておくとよいのは、それが“他人の”取引在庫であるべきだという点です。
出典:Binance Web3 Walletにおける、私自身のPancakeSwap V3ポジション #7137250(8月15日 17:02に開始、16日 14:44にキエフ時間で終了)。
@BinanceCIS プールに、ある企業におけるあなたのポジションのサイズを調整させますか?
#bStocksCIS
#bstockscis @BinanceCIS
昨日、トークン化された株式を流動性プールに入れて、出てきた結果を報告すると約束しました。ここにあります。
入金(In):8月15日 17:02 0.118($SKHYB )および 31.44563 USDT。
出金(Out):今日 14:44 0.11548 SKHYB および 31.85171 USDT。
株数を減らして、ドルを増やす。価値ベースではほぼ相殺されました——トークンの約42セント分がUSDTの約41セント分になっただけです。21時間にわたって得られた手数料は、1セント未満。
つまり、プールは私が眠っている間にSK hynixにおける私の持ち分の約2%を売り払い、特権として私に1セント未満のごく一部を支払ったということです。私が実際に持つことになったものの変化は、得た報酬の約50倍の大きさでした。
暗号資産のペアなら、よくあるトレードオフです。bStockでは、その着地は違ってくると思います。これは供給量を投機しているトークンではありません。現実の株式に対する証明書であり、保有する理由は特定の企業へのエクスポージャーです。流動性プールはそれを知りません。価格があなたのレンジをまたぐたびに、注文フローだけを根拠に、事業における持ち分を削ったり足したりします。
それは欠陥ではありません。流動性提供とはそういうものですし、そこに入れたものなら何でも同じ仕組みが適用されます。ですが、株式という資産クラスでは「始めたときと違う金額になってしまった」というのは端数の丸めではなく、意思決定の問題です。
エクスポージャーを決める前に知っておくとよいのは、それが“他人の”取引在庫であるべきだという点です。
出典:Binance Web3 Walletにおける、私自身のPancakeSwap V3ポジション #7137250(8月15日 17:02に開始、16日 14:44にキエフ時間で終了)。
@BinanceCIS プールに、ある企業におけるあなたのポジションのサイズを調整させますか?
#bStocksCIS
昨日、トークン化された株式を流動性プールに入れて、出てきた結果を報告すると約束しました。ここにあります。
入金(In):8月15日 17:02 0.118($SKHYB )および 31.44563 USDT。
出金(Out):今日 14:44 0.11548 SKHYB および 31.85171 USDT。
株数を減らして、ドルを増やす。価値ベースではほぼ相殺されました——トークンの約42セント分がUSDTの約41セント分になっただけです。21時間にわたって得られた手数料は、1セント未満。
つまり、プールは私が眠っている間にSK hynixにおける私の持ち分の約2%を売り払い、特権として私に1セント未満のごく一部を支払ったということです。私が実際に持つことになったものの変化は、得た報酬の約50倍の大きさでした。
暗号資産のペアなら、よくあるトレードオフです。bStockでは、その着地は違ってくると思います。これは供給量を投機しているトークンではありません。現実の株式に対する証明書であり、保有する理由は特定の企業へのエクスポージャーです。流動性プールはそれを知りません。価格があなたのレンジをまたぐたびに、注文フローだけを根拠に、事業における持ち分を削ったり足したりします。
それは欠陥ではありません。流動性提供とはそういうものですし、そこに入れたものなら何でも同じ仕組みが適用されます。ですが、株式という資産クラスでは「始めたときと違う金額になってしまった」というのは端数の丸めではなく、意思決定の問題です。
エクスポージャーを決める前に知っておくとよいのは、それが“他人の”取引在庫であるべきだという点です。
出典:Binance Web3 Walletにおける、私自身のPancakeSwap V3ポジション #7137250(8月15日 17:02に開始、16日 14:44にキエフ時間で終了)。
@BinanceCIS プールに、ある企業におけるあなたのポジションのサイズを調整させますか?
#bStocksCIS
7
5
108
·
--
ブリッシュ
#bstockscis @BinanceCIS
数日前、「bStock は取引所からセルフカストディへ移すことができる」と書きました。まだ試していませんでした。今日試しました。Binance Web3 Wallet へ。これは同じアカウントに紐づいていて、いつでもワンタップで開けるからです。
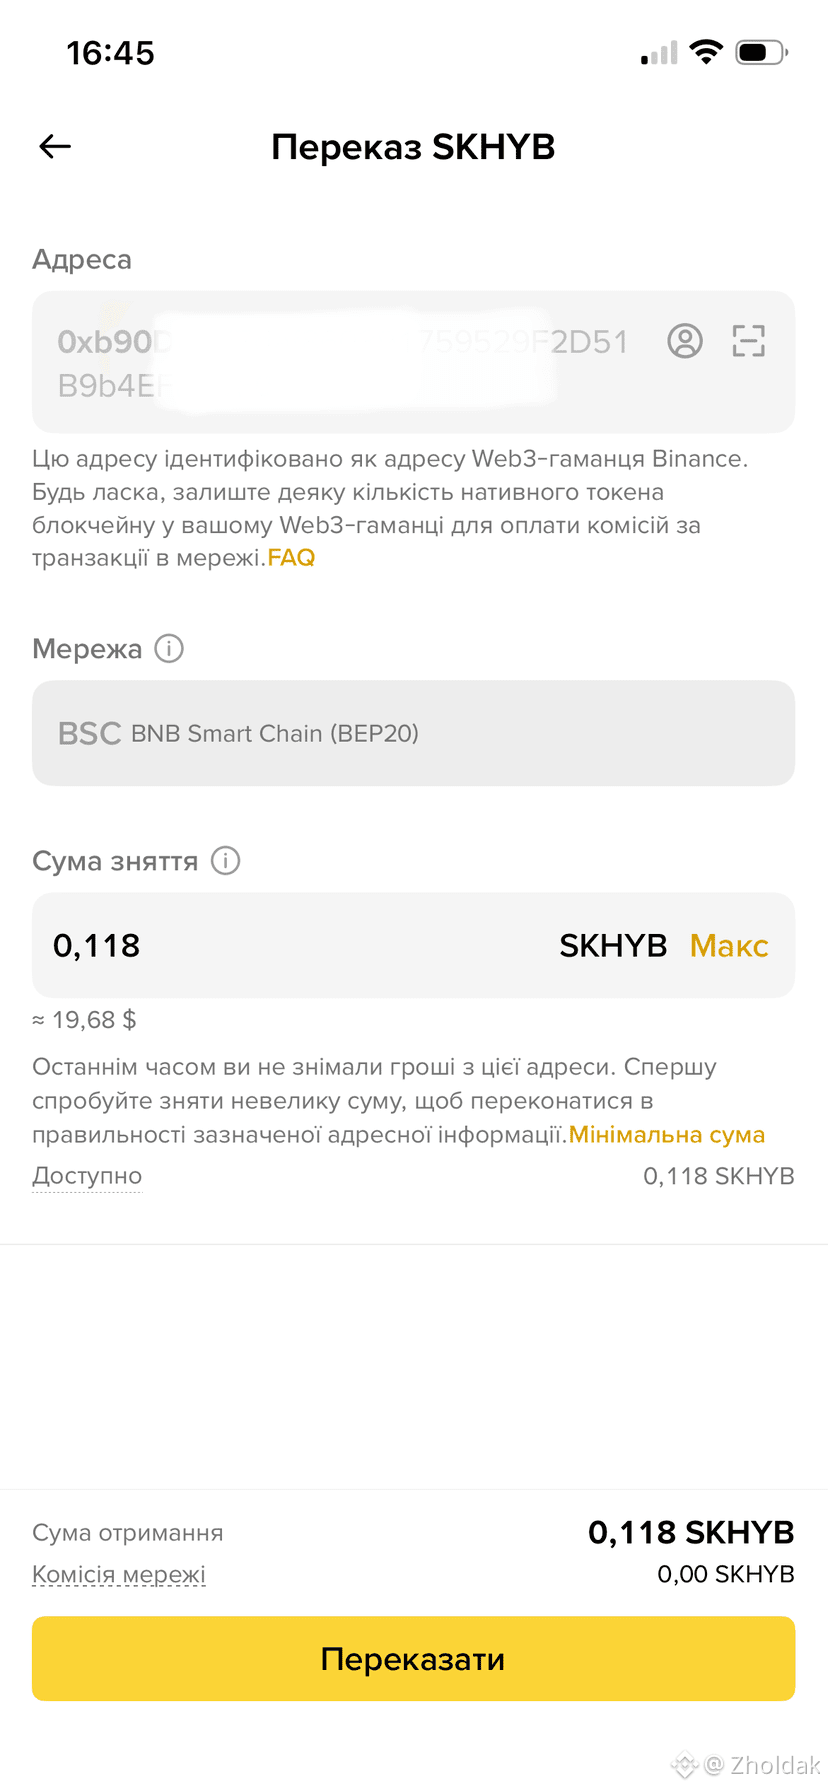
送金自体は特に何もなく、それがポイントです。暗号資産の送信で使うのと同じ画面で、BEP-20、BNB Smart Chain、ネットワーク手数料はゼロ。壁は1つあって、最小送金額が 0.1 なので、0.118 $SKHYB を送りました。
ただ、そこで待っていたものは想定外でした。Stock Hub → bStocks Earn です。私の持ち分は「ただ保有しているだけのもの」ではなくなりました。
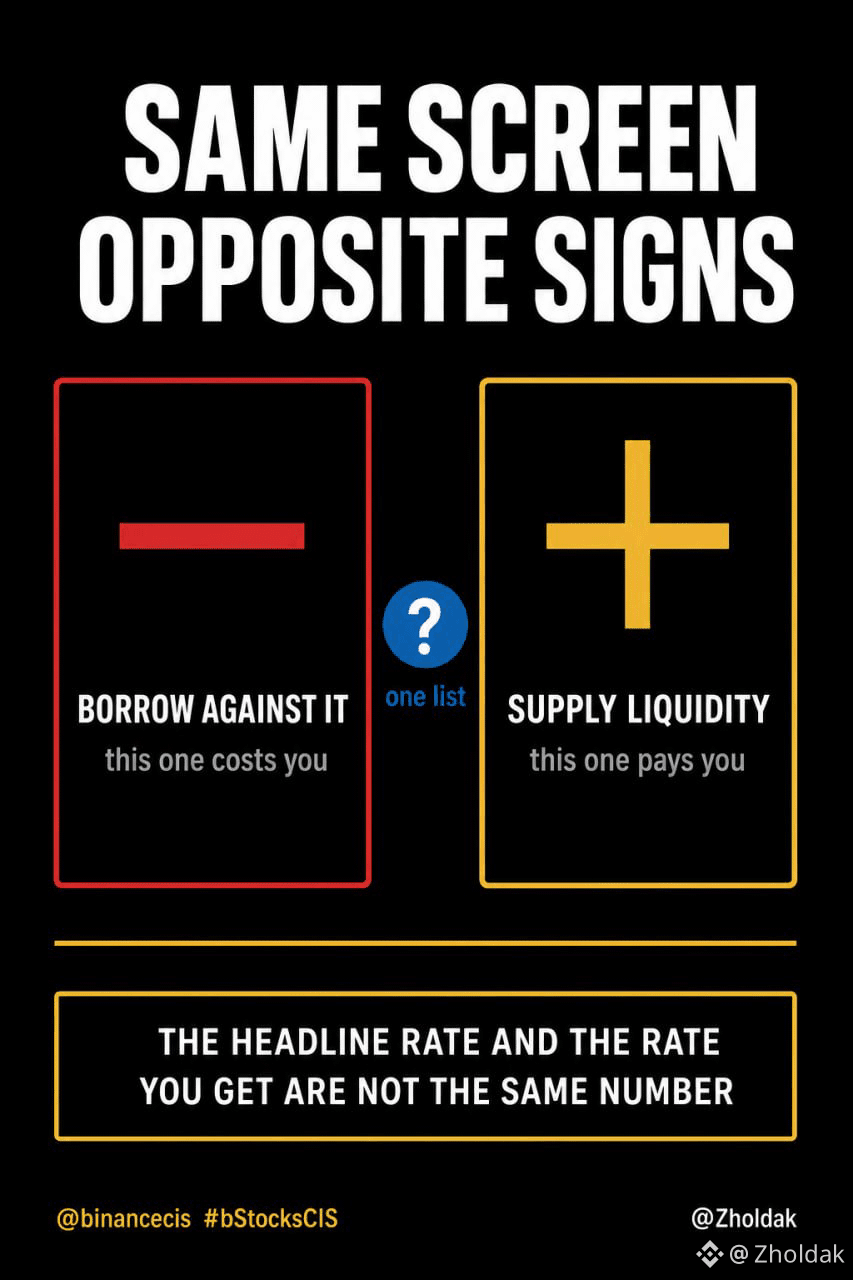
ある見出しの下に複数の仕組みがあり、数値の前に付く符号がそれを分けています。
いくつかの項目はレンディングマーケット(Venus、Lista など)で、bStock を担保として置き、それに対して借りる形です。これらのパーセンテージはマイナスです。そして、そこに付くマイナスは損失ではありません。それはローンのコストです。必要なときに現金が要るのに、ポジションを売らずに済ませる代償。私は $CRCLB を保有していて、そのリストに載っています。
他の項目は流動性プールで、こちらは報酬なのでプラスになります。私が試したのはこのタイプです。
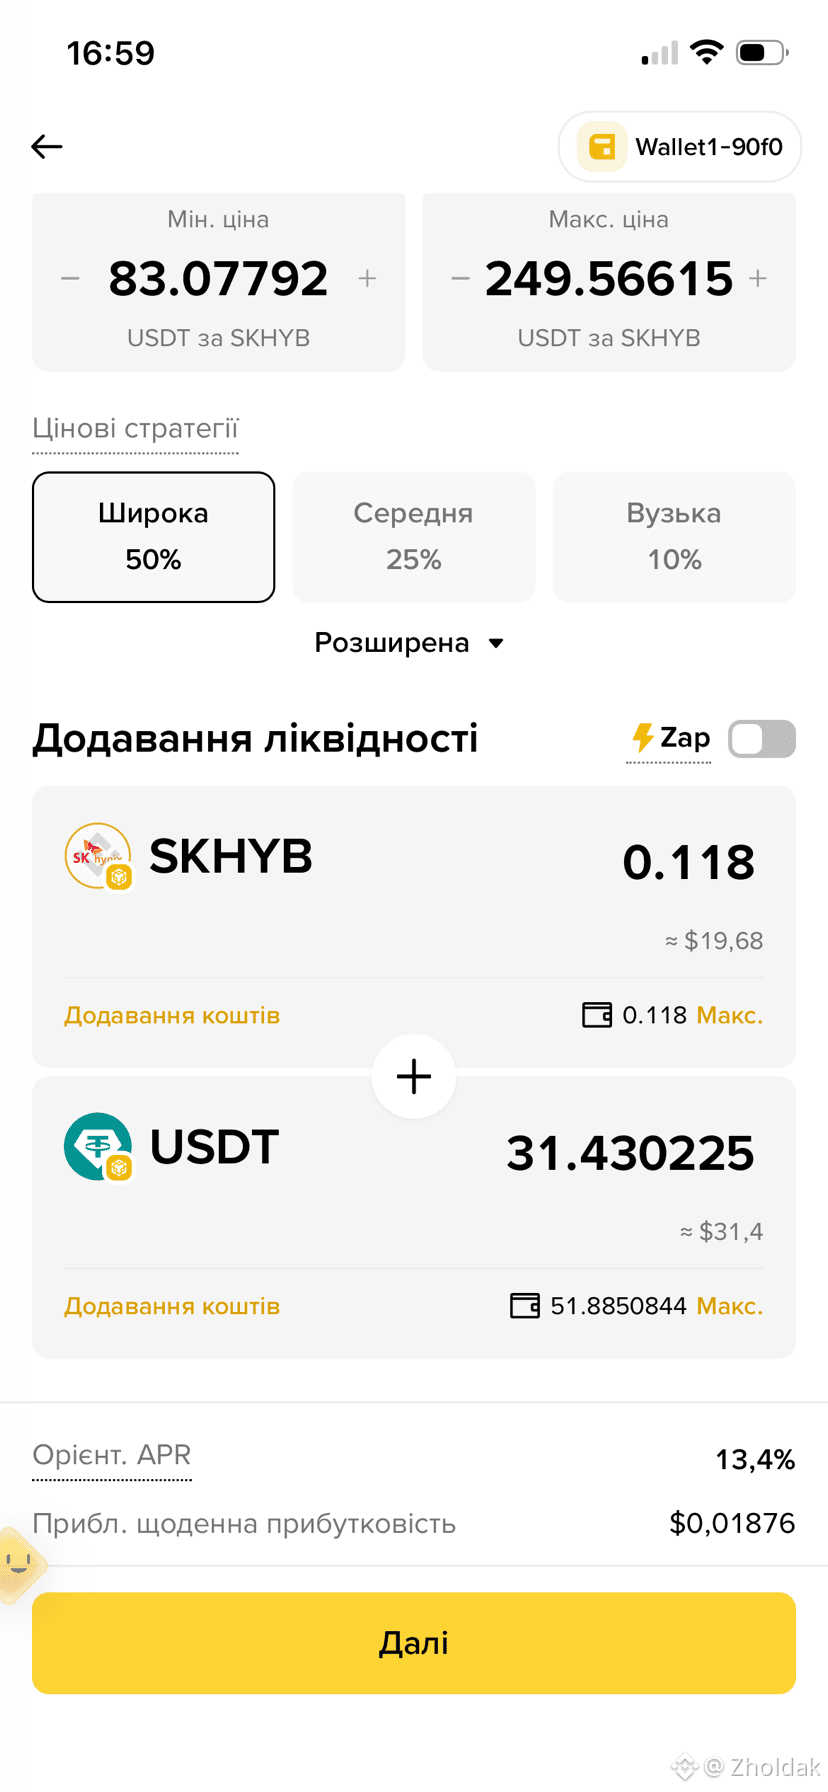
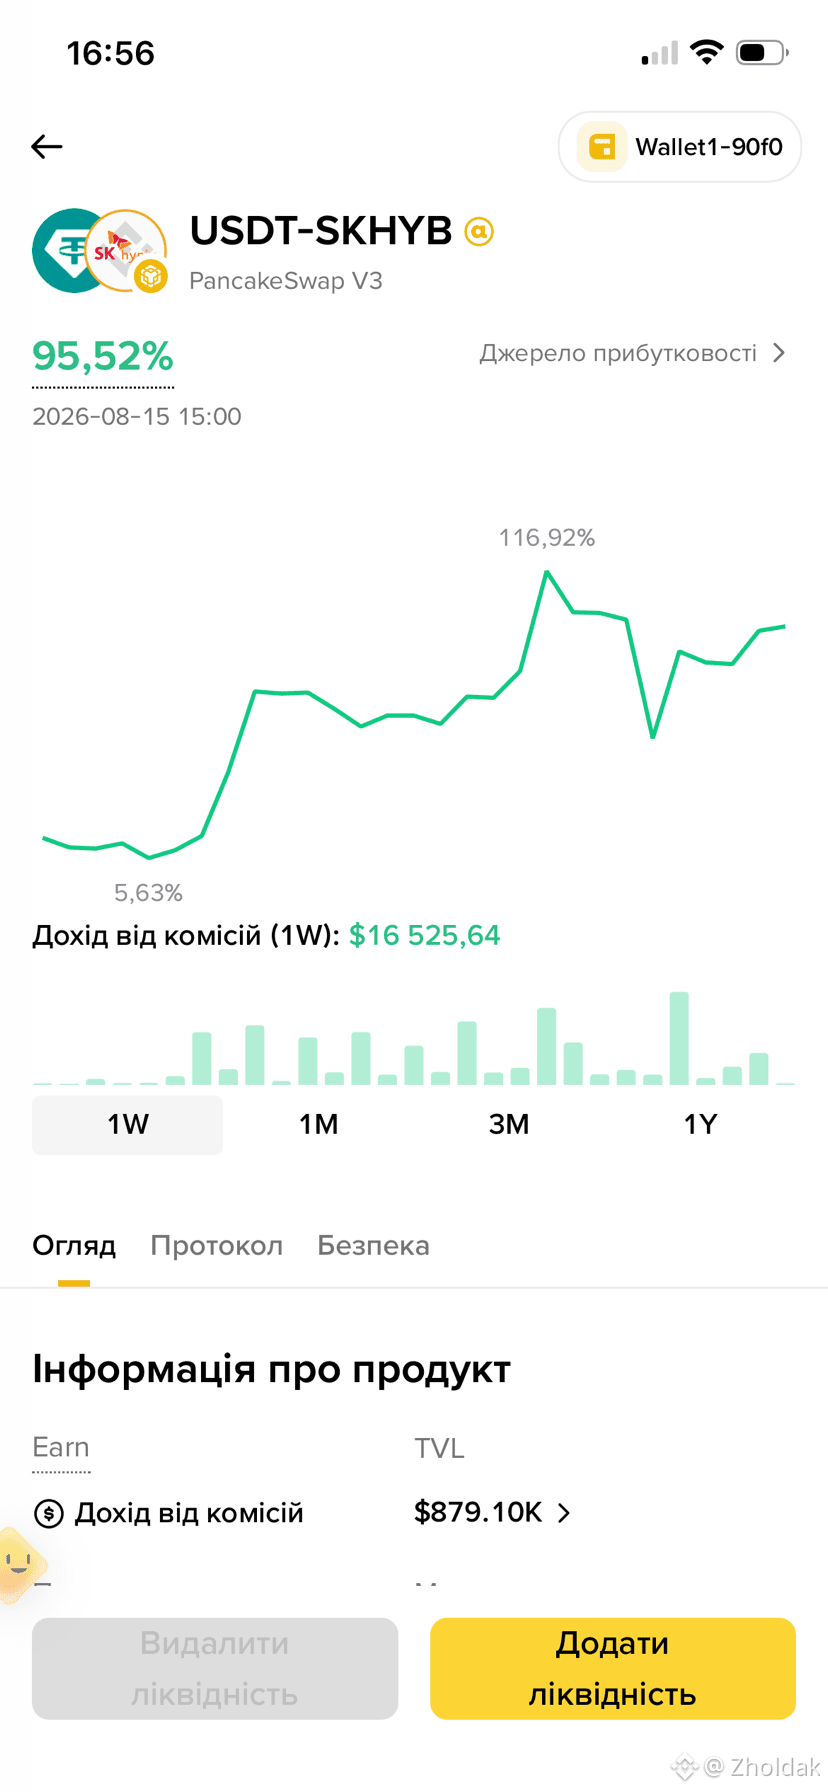
16:56 に、USDT-SKHYB プールが 95.52% と表示していました。開いて、いちばん広いレンジを選択しました。狭いレンジだと週末の間にレンジ外へずれて、稼ぐのをやめます。確認画面での見積もりは 13.4%。推定日次リターン:$0.01876。
そこに導いてくれた数字より 7 分の 1、さらに 6 分早いタイミング。どちらの数字も嘘ではありません。狭いレンジは、実際に取引が行われる場所に資金を集中させるので、続いている間はより稼ぎます。広いレンジは稼ぎが少なくなる代わりに長持ちします。見出しの数字は攻めた方(積極的な方)です。選択画面に出るのは正直な方。
0.118 SKHYB と 31.4458 USDT を投入して、そのままにしました。日曜に、実際にどれだけ増えたか報告します。
1回の送金で、「株を保有するだけ」から「それを使える状態」へ、距離そのものを越えました。
出典:Binance アプリと Binance Web3 Wallet で私自身が表示した画面、2026年8月15日、キエフ時間16:42〜17:02。
@BinanceCIS 利回りの数字を見たとき、それはどの問いに答えているか分かりますか?
#bstocksCIS
#bstockscis @BinanceCIS
数日前、「bStock は取引所からセルフカストディへ移すことができる」と書きました。まだ試していませんでした。今日試しました。Binance Web3 Wallet へ。これは同じアカウントに紐づいていて、いつでもワンタップで開けるからです。
送金自体は特に何もなく、それがポイントです。暗号資産の送信で使うのと同じ画面で、BEP-20、BNB Smart Chain、ネットワーク手数料はゼロ。壁は1つあって、最小送金額が 0.1 なので、0.118 $SKHYB を送りました。
ただ、そこで待っていたものは想定外でした。Stock Hub → bStocks Earn です。私の持ち分は「ただ保有しているだけのもの」ではなくなりました。
ある見出しの下に複数の仕組みがあり、数値の前に付く符号がそれを分けています。
いくつかの項目はレンディングマーケット(Venus、Lista など)で、bStock を担保として置き、それに対して借りる形です。これらのパーセンテージはマイナスです。そして、そこに付くマイナスは損失ではありません。それはローンのコストです。必要なときに現金が要るのに、ポジションを売らずに済ませる代償。私は $CRCLB を保有していて、そのリストに載っています。
他の項目は流動性プールで、こちらは報酬なのでプラスになります。私が試したのはこのタイプです。
16:56 に、USDT-SKHYB プールが 95.52% と表示していました。開いて、いちばん広いレンジを選択しました。狭いレンジだと週末の間にレンジ外へずれて、稼ぐのをやめます。確認画面での見積もりは 13.4%。推定日次リターン:$0.01876。
そこに導いてくれた数字より 7 分の 1、さらに 6 分早いタイミング。どちらの数字も嘘ではありません。狭いレンジは、実際に取引が行われる場所に資金を集中させるので、続いている間はより稼ぎます。広いレンジは稼ぎが少なくなる代わりに長持ちします。見出しの数字は攻めた方(積極的な方)です。選択画面に出るのは正直な方。
0.118 SKHYB と 31.4458 USDT を投入して、そのままにしました。日曜に、実際にどれだけ増えたか報告します。
1回の送金で、「株を保有するだけ」から「それを使える状態」へ、距離そのものを越えました。
出典:Binance アプリと Binance Web3 Wallet で私自身が表示した画面、2026年8月15日、キエフ時間16:42〜17:02。
@BinanceCIS 利回りの数字を見たとき、それはどの問いに答えているか分かりますか?
#bstocksCIS
数日前、「bStock は取引所からセルフカストディへ移すことができる」と書きました。まだ試していませんでした。今日試しました。Binance Web3 Wallet へ。これは同じアカウントに紐づいていて、いつでもワンタップで開けるからです。
送金自体は特に何もなく、それがポイントです。暗号資産の送信で使うのと同じ画面で、BEP-20、BNB Smart Chain、ネットワーク手数料はゼロ。壁は1つあって、最小送金額が 0.1 なので、0.118 $SKHYB を送りました。
ただ、そこで待っていたものは想定外でした。Stock Hub → bStocks Earn です。私の持ち分は「ただ保有しているだけのもの」ではなくなりました。
ある見出しの下に複数の仕組みがあり、数値の前に付く符号がそれを分けています。
いくつかの項目はレンディングマーケット(Venus、Lista など)で、bStock を担保として置き、それに対して借りる形です。これらのパーセンテージはマイナスです。そして、そこに付くマイナスは損失ではありません。それはローンのコストです。必要なときに現金が要るのに、ポジションを売らずに済ませる代償。私は $CRCLB を保有していて、そのリストに載っています。
他の項目は流動性プールで、こちらは報酬なのでプラスになります。私が試したのはこのタイプです。
16:56 に、USDT-SKHYB プールが 95.52% と表示していました。開いて、いちばん広いレンジを選択しました。狭いレンジだと週末の間にレンジ外へずれて、稼ぐのをやめます。確認画面での見積もりは 13.4%。推定日次リターン:$0.01876。
そこに導いてくれた数字より 7 分の 1、さらに 6 分早いタイミング。どちらの数字も嘘ではありません。狭いレンジは、実際に取引が行われる場所に資金を集中させるので、続いている間はより稼ぎます。広いレンジは稼ぎが少なくなる代わりに長持ちします。見出しの数字は攻めた方(積極的な方)です。選択画面に出るのは正直な方。
0.118 SKHYB と 31.4458 USDT を投入して、そのままにしました。日曜に、実際にどれだけ増えたか報告します。
1回の送金で、「株を保有するだけ」から「それを使える状態」へ、距離そのものを越えました。
出典:Binance アプリと Binance Web3 Wallet で私自身が表示した画面、2026年8月15日、キエフ時間16:42〜17:02。
@BinanceCIS 利回りの数字を見たとき、それはどの問いに答えているか分かりますか?
#bstocksCIS
10
5
167
·
--
ブリッシュ
一部該当
#bstockscis @BinanceCIS
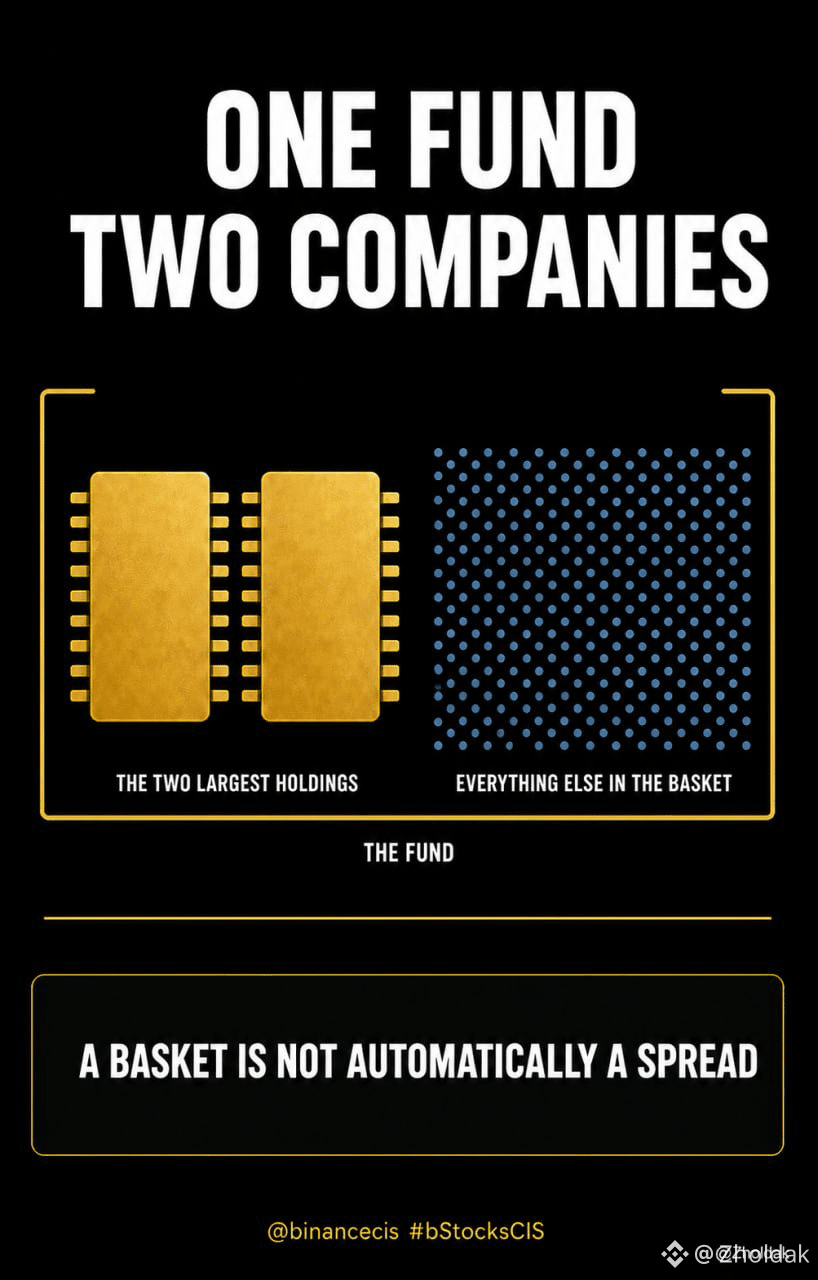
1つのファンドに83の保有銘柄。上位2つが、そのうち40%超を占めています。
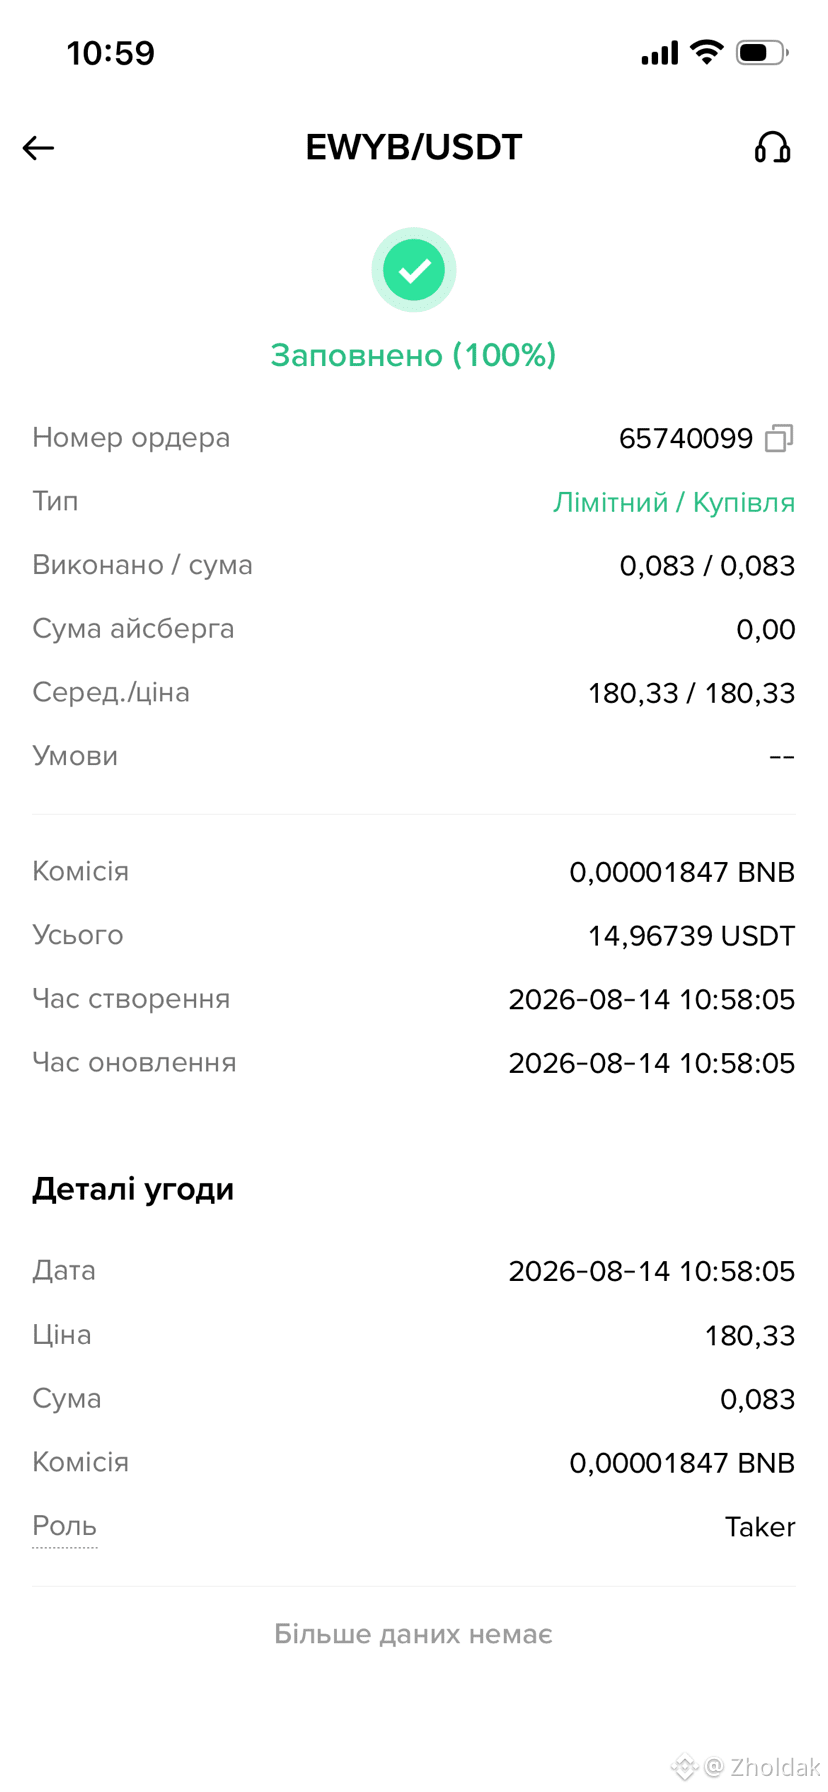
今朝、$EWYB を買いました—0.083を180.33で。TradFiの下に並んでいるbStocksのほとんどは単体企業で、私は代わりにファンドが欲しかったのです。いくつかありますが、その中で一番「広く」見えたものを選びました。特定のセクターでも、テック銘柄の指数でもなく、国まるごとです。韓国の企業83社が、毎回1つの物語に賭けるのをやめる、いちばん素直な方法に思えました。
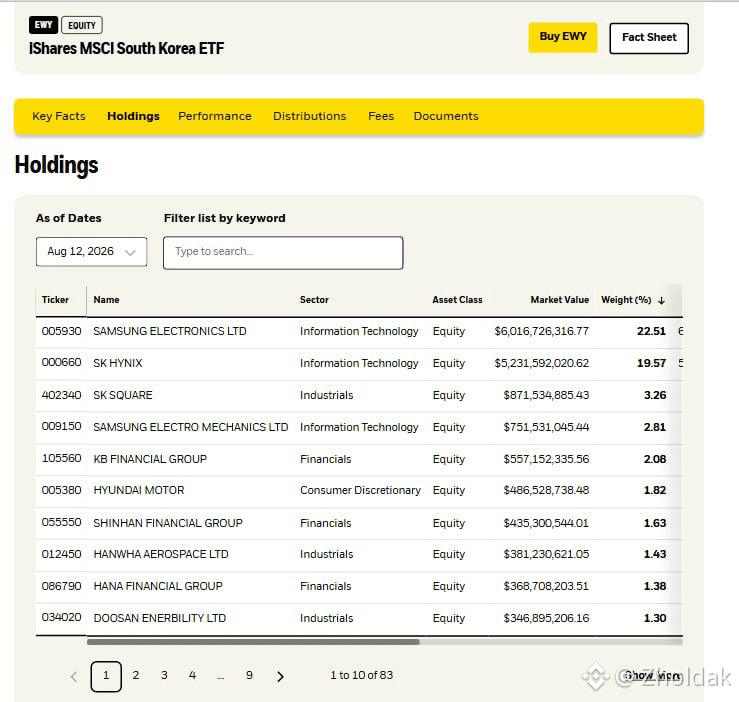
それから発行体の保有銘柄ページを開きました。Samsung Electronicsが22.51%、SK hynixが19.57%。合わせて42.08%。3番目のSK Squareは3.26%です。
つまり、私が入れた15ドルのうち、だいたい6ドルはメモリメーカー2社に入っています。残り81社はそのほかに分散されていて、そのうち最大の銘柄でも約50セントです。
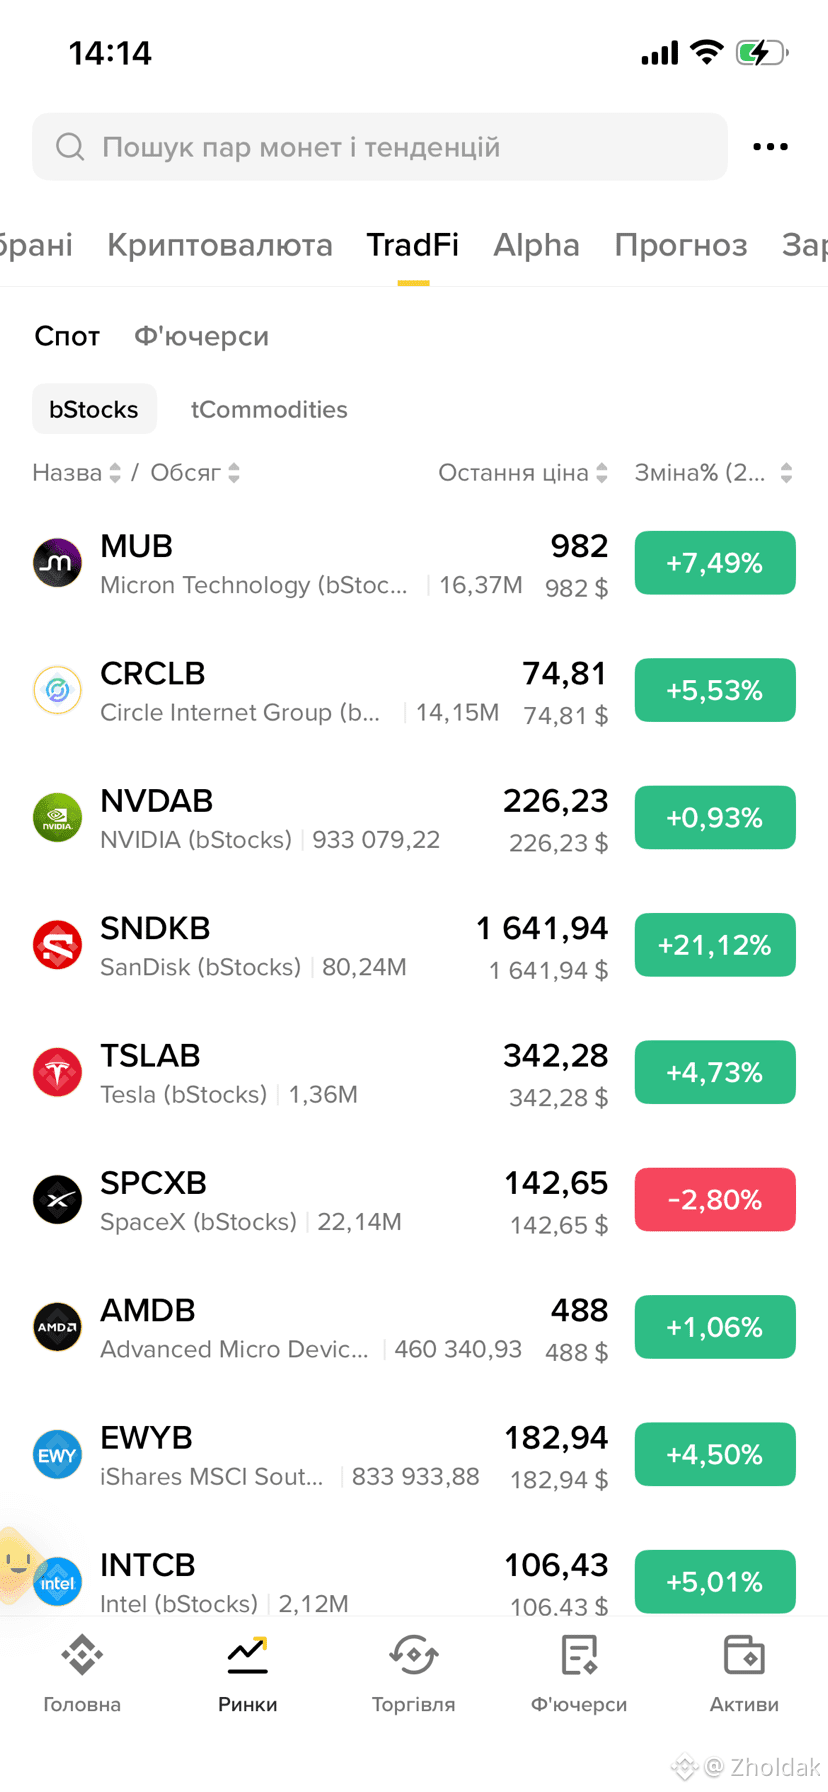
今日14:14の時点で、私のファンドは4.50%上昇、$MUB は7.49%、$SNDKB は21.12%——同じ画面、同じ分。午後1回の値動きだけでは何も証明できませんが、保有銘柄ページとも矛盾しません。
ここに誤った表記はありません。ティッカーは韓国で、ファンドも韓国に連動し、2社がその市場を支配する「時価総額加重の国指数」がどう見えるか、それがこれです。
でも、私は特定のメモリチップを避けたいわけではありませんでした。避けたかったのは「1社ずつ保有する」ことです。ファンドならそれが答えに見えました。そしてこのファンドは、私が単体ティッカーを1つずつ選ぶよりも、上位2銘柄により多くの重みを置いています。つまり、私が取るつもりだったポジションとは違った。保有銘柄ページを見れば、30秒で分かったはずです—クリックした後ではなく、クリックする前に。
出典:自分自身のEWYB/USDTの注文詳細と、Binanceアプリ内のbStocksリスト、2026年8月14日。発行体が公表している、iShares MSCI South Korea ETFの保有銘柄(12 August時点)。
@BinanceCIS あなたが保有しているファンドの中身、分かっていますか?
#bStocksCIS
#bstockscis @BinanceCIS
1つのファンドに83の保有銘柄。上位2つが、そのうち40%超を占めています。
今朝、$EWYB を買いました—0.083を180.33で。TradFiの下に並んでいるbStocksのほとんどは単体企業で、私は代わりにファンドが欲しかったのです。いくつかありますが、その中で一番「広く」見えたものを選びました。特定のセクターでも、テック銘柄の指数でもなく、国まるごとです。韓国の企業83社が、毎回1つの物語に賭けるのをやめる、いちばん素直な方法に思えました。
それから発行体の保有銘柄ページを開きました。Samsung Electronicsが22.51%、SK hynixが19.57%。合わせて42.08%。3番目のSK Squareは3.26%です。
つまり、私が入れた15ドルのうち、だいたい6ドルはメモリメーカー2社に入っています。残り81社はそのほかに分散されていて、そのうち最大の銘柄でも約50セントです。
今日14:14の時点で、私のファンドは4.50%上昇、$MUB は7.49%、$SNDKB は21.12%——同じ画面、同じ分。午後1回の値動きだけでは何も証明できませんが、保有銘柄ページとも矛盾しません。
ここに誤った表記はありません。ティッカーは韓国で、ファンドも韓国に連動し、2社がその市場を支配する「時価総額加重の国指数」がどう見えるか、それがこれです。
でも、私は特定のメモリチップを避けたいわけではありませんでした。避けたかったのは「1社ずつ保有する」ことです。ファンドならそれが答えに見えました。そしてこのファンドは、私が単体ティッカーを1つずつ選ぶよりも、上位2銘柄により多くの重みを置いています。つまり、私が取るつもりだったポジションとは違った。保有銘柄ページを見れば、30秒で分かったはずです—クリックした後ではなく、クリックする前に。
出典:自分自身のEWYB/USDTの注文詳細と、Binanceアプリ内のbStocksリスト、2026年8月14日。発行体が公表している、iShares MSCI South Korea ETFの保有銘柄(12 August時点)。
@BinanceCIS あなたが保有しているファンドの中身、分かっていますか?
#bStocksCIS
1つのファンドに83の保有銘柄。上位2つが、そのうち40%超を占めています。
今朝、$EWYB を買いました—0.083を180.33で。TradFiの下に並んでいるbStocksのほとんどは単体企業で、私は代わりにファンドが欲しかったのです。いくつかありますが、その中で一番「広く」見えたものを選びました。特定のセクターでも、テック銘柄の指数でもなく、国まるごとです。韓国の企業83社が、毎回1つの物語に賭けるのをやめる、いちばん素直な方法に思えました。
それから発行体の保有銘柄ページを開きました。Samsung Electronicsが22.51%、SK hynixが19.57%。合わせて42.08%。3番目のSK Squareは3.26%です。
つまり、私が入れた15ドルのうち、だいたい6ドルはメモリメーカー2社に入っています。残り81社はそのほかに分散されていて、そのうち最大の銘柄でも約50セントです。
今日14:14の時点で、私のファンドは4.50%上昇、$MUB は7.49%、$SNDKB は21.12%——同じ画面、同じ分。午後1回の値動きだけでは何も証明できませんが、保有銘柄ページとも矛盾しません。
ここに誤った表記はありません。ティッカーは韓国で、ファンドも韓国に連動し、2社がその市場を支配する「時価総額加重の国指数」がどう見えるか、それがこれです。
でも、私は特定のメモリチップを避けたいわけではありませんでした。避けたかったのは「1社ずつ保有する」ことです。ファンドならそれが答えに見えました。そしてこのファンドは、私が単体ティッカーを1つずつ選ぶよりも、上位2銘柄により多くの重みを置いています。つまり、私が取るつもりだったポジションとは違った。保有銘柄ページを見れば、30秒で分かったはずです—クリックした後ではなく、クリックする前に。
出典:自分自身のEWYB/USDTの注文詳細と、Binanceアプリ内のbStocksリスト、2026年8月14日。発行体が公表している、iShares MSCI South Korea ETFの保有銘柄(12 August時点)。
@BinanceCIS あなたが保有しているファンドの中身、分かっていますか?
#bStocksCIS
18
9
281
·
--
ブリッシュ
一部該当
#bstockscis @BinanceCIS
すべての bStock ページに、これまで開いたことがないタブが1つあります。「Information」です。チャートとデータの間にあって、アプリの中でいちばん面白い画面だと分かりました。
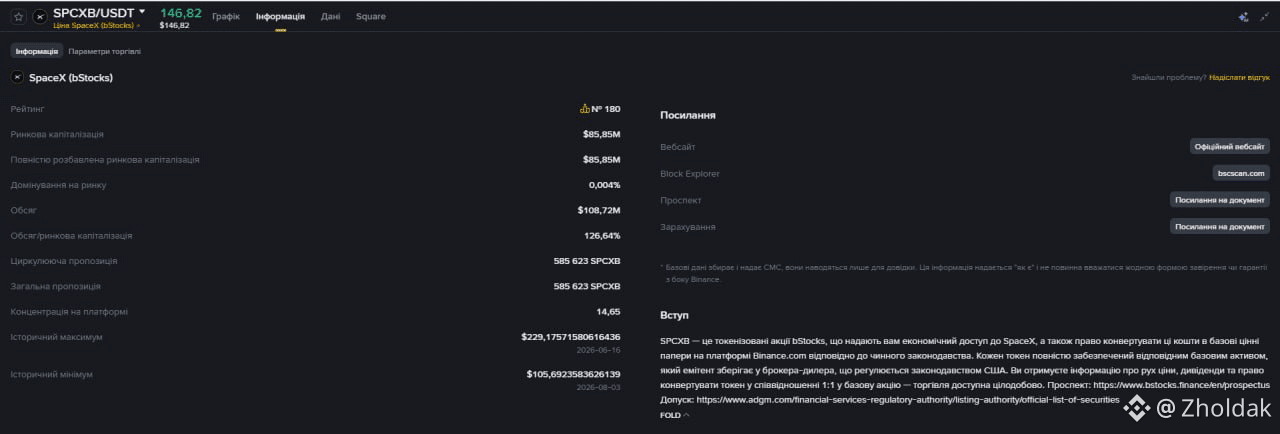
$SPCXB 、今朝の数値。流通供給量:585,623。総供給量:585,623。
同じ数字が2つ。暗号資産では、この2行が一致することはほとんどありません——その差分こそが、まだ市場に出ていない部分であり、購入前に確認すべきアンロック(解放)スケジュールです。ですがここにはギャップがありません。bStock は、株がその bStock に紐づいて保有されているときにだけ存在するからです。後から解放されるものがない。
下には:時価総額 85.85M、出来高 108.72M。出来高/時価総額:126.64%。供給全体が、1日のうちに一度ではなく何度も回転しました。
そのページの Binance の注記には、基になっているデータは CMC から来ていて、参照目的のみだと書かれています。なので自分でも確かめに行きました。
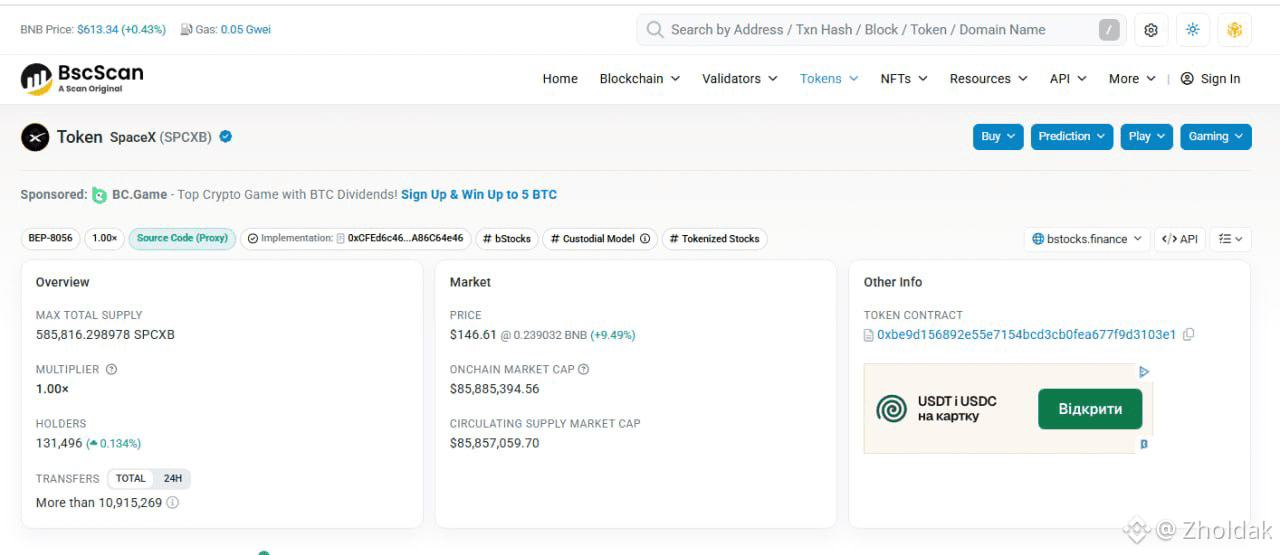
同じページには Block Explorer へのリンクもあります。ワンタップで、トークンのコントラクトが BscScan に表示されます:
最大総供給量 585,816.298978。保有者 131,496。トランスファー(送金/移転)、10,915,269 件超。オンチェーンの時価総額 85,885,394.56。
供給の数字は、約193トークンだけ違います——およそ0.03%。ライブのオンチェーンカウンターと、自身のスケジュールで更新される参照フィードの間なら、期待できる差です。
131,496 のアドレス。これが私の気を止めました。取引所の口座数ではありません——公開チェーン上のアドレスで、6月に上場した会社に対する証明書を保有しています。契約は、それ以来ほぼ1,100万件のトランスファーを処理しています。
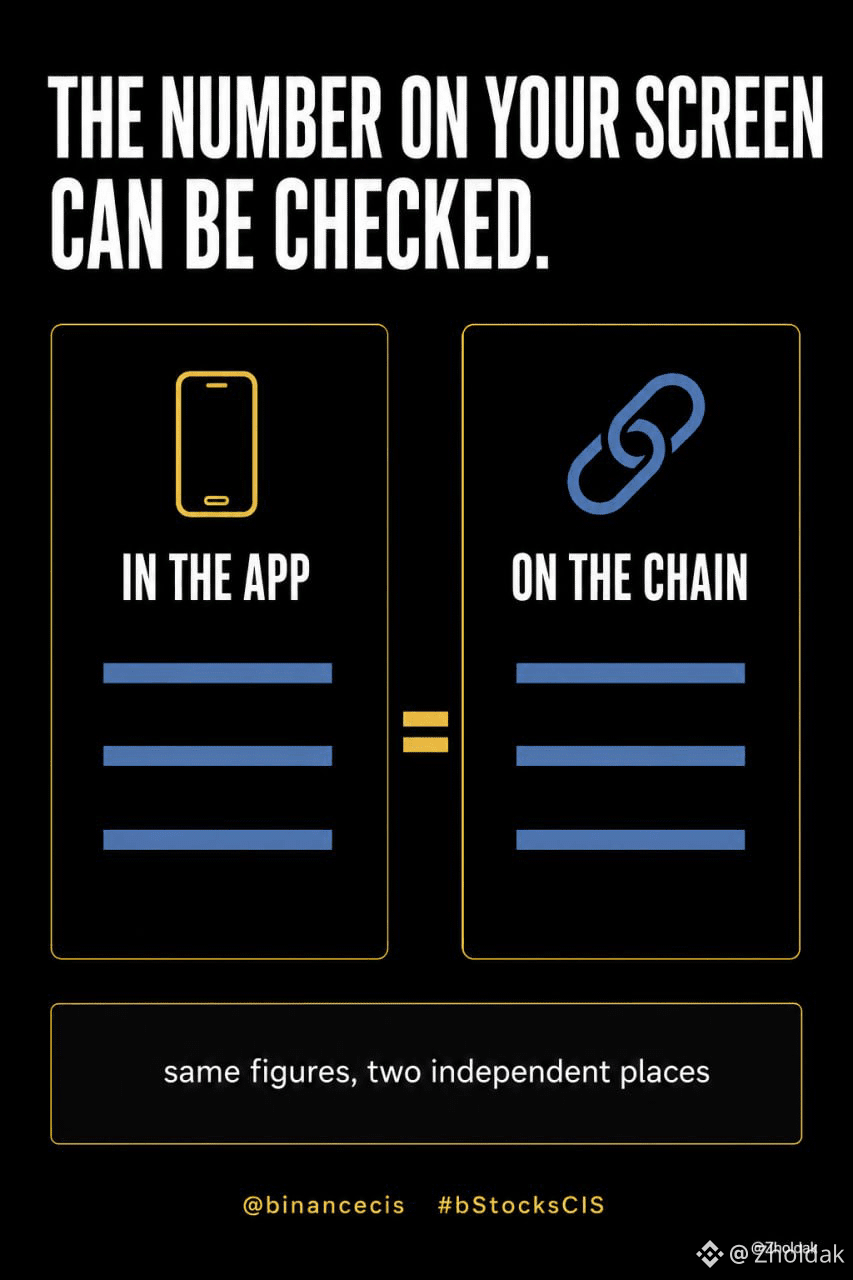
私は10日間、価格と注文板を見てきました。本来最初に見たべきだったのは、画面に出ている数字が何か別のものと照合できるかどうかです。できます。たった1分ほどで。アカウントなしで誰でも。さらに Binance は、そのリンクをページにそのまま載せています。
出典:Binance の SPCXB/USDT Information タブ(2026年8月13日);BscScan の SPCXB トークンページとコントラクト(同日);Binance bStocks のローンチ発表(2026年6月12日)。
@BinanceCIS あなたは Information タブを開いたことがありますか?
#bStocksCİS
#bstockscis @BinanceCIS
すべての bStock ページに、これまで開いたことがないタブが1つあります。「Information」です。チャートとデータの間にあって、アプリの中でいちばん面白い画面だと分かりました。
$SPCXB 、今朝の数値。流通供給量:585,623。総供給量:585,623。
同じ数字が2つ。暗号資産では、この2行が一致することはほとんどありません——その差分こそが、まだ市場に出ていない部分であり、購入前に確認すべきアンロック(解放)スケジュールです。ですがここにはギャップがありません。bStock は、株がその bStock に紐づいて保有されているときにだけ存在するからです。後から解放されるものがない。
下には:時価総額 85.85M、出来高 108.72M。出来高/時価総額:126.64%。供給全体が、1日のうちに一度ではなく何度も回転しました。
そのページの Binance の注記には、基になっているデータは CMC から来ていて、参照目的のみだと書かれています。なので自分でも確かめに行きました。
同じページには Block Explorer へのリンクもあります。ワンタップで、トークンのコントラクトが BscScan に表示されます:
最大総供給量 585,816.298978。保有者 131,496。トランスファー(送金/移転)、10,915,269 件超。オンチェーンの時価総額 85,885,394.56。
供給の数字は、約193トークンだけ違います——およそ0.03%。ライブのオンチェーンカウンターと、自身のスケジュールで更新される参照フィードの間なら、期待できる差です。
131,496 のアドレス。これが私の気を止めました。取引所の口座数ではありません——公開チェーン上のアドレスで、6月に上場した会社に対する証明書を保有しています。契約は、それ以来ほぼ1,100万件のトランスファーを処理しています。
私は10日間、価格と注文板を見てきました。本来最初に見たべきだったのは、画面に出ている数字が何か別のものと照合できるかどうかです。できます。たった1分ほどで。アカウントなしで誰でも。さらに Binance は、そのリンクをページにそのまま載せています。
出典:Binance の SPCXB/USDT Information タブ(2026年8月13日);BscScan の SPCXB トークンページとコントラクト(同日);Binance bStocks のローンチ発表(2026年6月12日)。
@BinanceCIS あなたは Information タブを開いたことがありますか?
#bStocksCİS
すべての bStock ページに、これまで開いたことがないタブが1つあります。「Information」です。チャートとデータの間にあって、アプリの中でいちばん面白い画面だと分かりました。
$SPCXB 、今朝の数値。流通供給量:585,623。総供給量:585,623。
同じ数字が2つ。暗号資産では、この2行が一致することはほとんどありません——その差分こそが、まだ市場に出ていない部分であり、購入前に確認すべきアンロック(解放)スケジュールです。ですがここにはギャップがありません。bStock は、株がその bStock に紐づいて保有されているときにだけ存在するからです。後から解放されるものがない。
下には:時価総額 85.85M、出来高 108.72M。出来高/時価総額:126.64%。供給全体が、1日のうちに一度ではなく何度も回転しました。
そのページの Binance の注記には、基になっているデータは CMC から来ていて、参照目的のみだと書かれています。なので自分でも確かめに行きました。
同じページには Block Explorer へのリンクもあります。ワンタップで、トークンのコントラクトが BscScan に表示されます:
最大総供給量 585,816.298978。保有者 131,496。トランスファー(送金/移転)、10,915,269 件超。オンチェーンの時価総額 85,885,394.56。
供給の数字は、約193トークンだけ違います——およそ0.03%。ライブのオンチェーンカウンターと、自身のスケジュールで更新される参照フィードの間なら、期待できる差です。
131,496 のアドレス。これが私の気を止めました。取引所の口座数ではありません——公開チェーン上のアドレスで、6月に上場した会社に対する証明書を保有しています。契約は、それ以来ほぼ1,100万件のトランスファーを処理しています。
私は10日間、価格と注文板を見てきました。本来最初に見たべきだったのは、画面に出ている数字が何か別のものと照合できるかどうかです。できます。たった1分ほどで。アカウントなしで誰でも。さらに Binance は、そのリンクをページにそのまま載せています。
出典:Binance の SPCXB/USDT Information タブ(2026年8月13日);BscScan の SPCXB トークンページとコントラクト(同日);Binance bStocks のローンチ発表(2026年6月12日)。
@BinanceCIS あなたは Information タブを開いたことがありますか?
#bStocksCİS
11
6
176
·
--
ブリッシュ
本人確認中
#bstockscis @BinanceCIS
今朝、株の約1/10を買ってから、出口を探しに行きました。
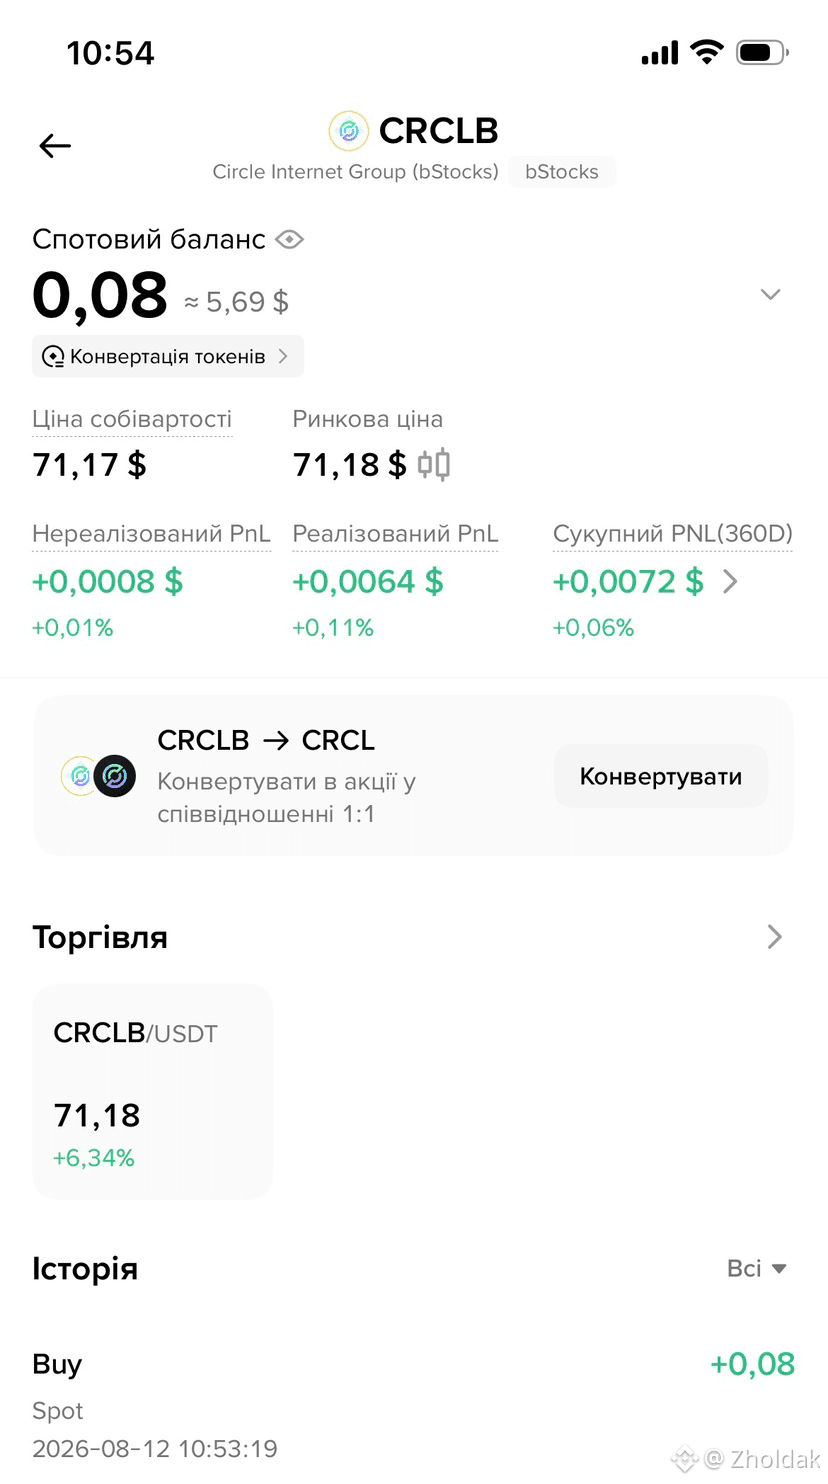
0.08 $CRCLB を 71.17 で買ったところ、5.6936 USDTになりました。通常の証券会社ならここで話は終わりで、あなたは端数を持つだけ、その端数は口座に置かれ、あなたが買ってくれた同じ証券会社にそれを売り戻すまでそこに留まります。
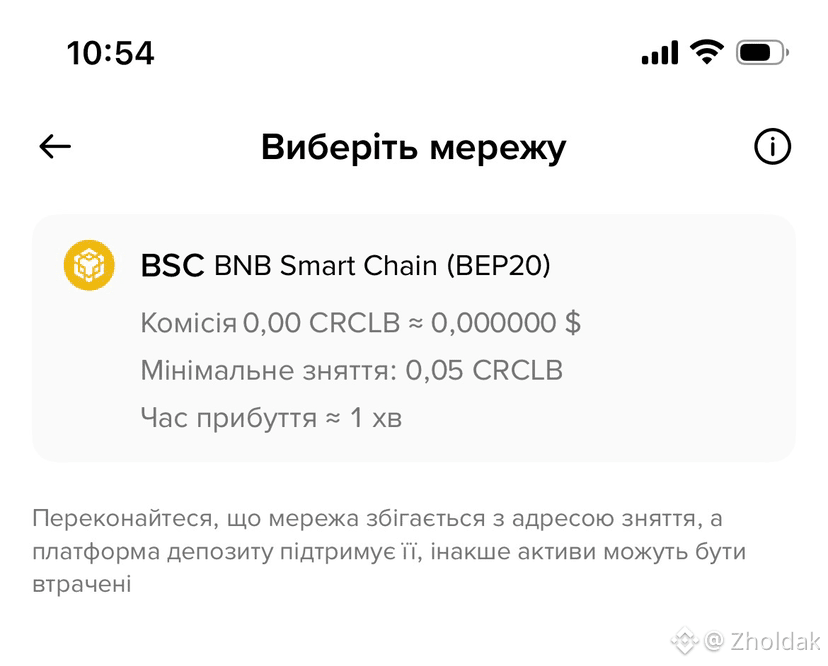
そこで、出金画面を開いてみて、何が表示されるか確かめました。
BNB Smart Chain。手数料 0.00 CRCLB。最低出金額 0.05 CRCLB。到着時間は約1分。
最低0.05。これはCircleの株の1/10未満で、しかも私がさっき買った額より少ない。今このまま自分のウォレットに送れば、そこに置いておけます。
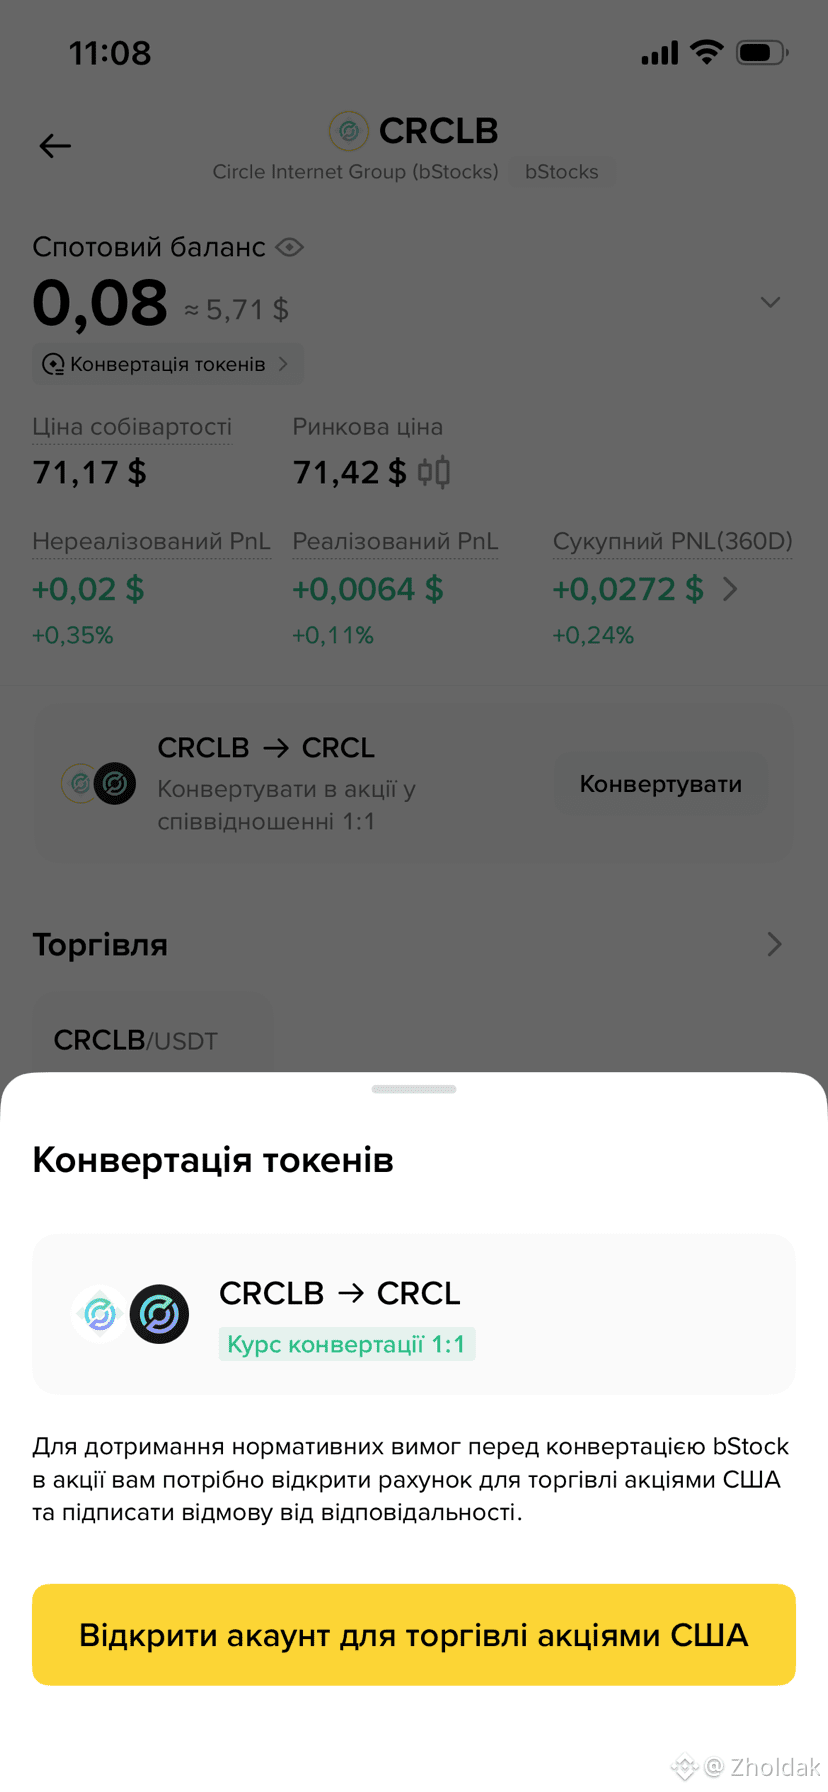
資産ページに戻ると、さらにもう一つボタンがありました。週にわたって見過ごしていたものです。CRCLBをCRCLへ換える、1対1。売却ではなく換え(変換)です。私はそれをタップしてそのまま止めました。すると、規制対応のためにまずUS株の取引口座を開設し、免責事項に署名している必要があることが分かりました。つまり扉はあるけれど、その前に私はまだ踏み越えていない段差がある、ということです。
どれもbStockを「株そのもの」にするものではありません。ローンチの告知は明確で、これは1対1で裏付けられた証明書であり、元となる企業の所有権ではない、とされています。
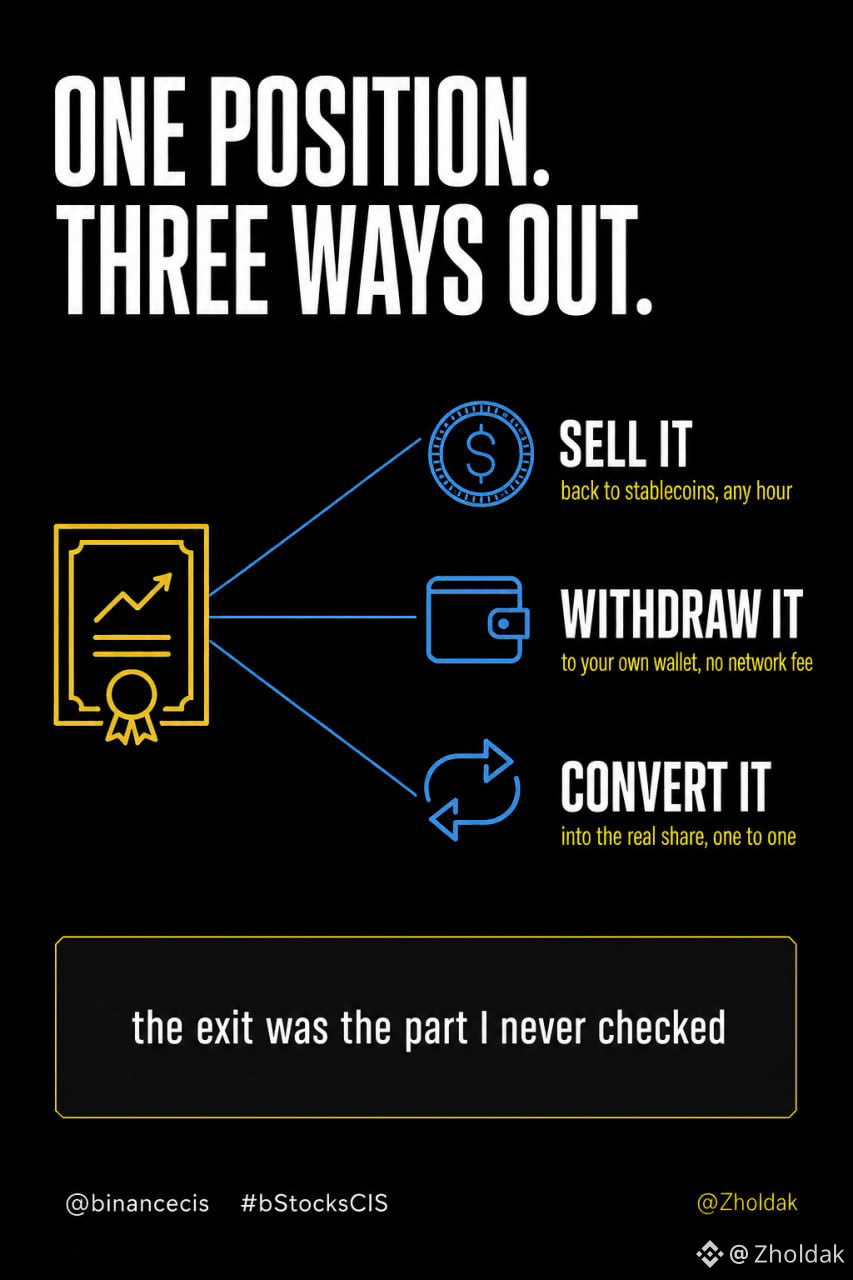
すると、今日使える出口は2つです。ステーブルコインに売り戻すか、BEP-20トークンとして自分が管理するウォレットへ出金するか。私はたぶんどちらもしません。クリプトと並んだままSpot残高に置いておけばいいからです。ただ、それが“詰まって抜け出せない”わけではないと分かると、保有感が変わります。外へ持ち出せるポジションは、売り戻し相手が“買った人”に限られるポジションとは違うからです。
私はこの取引について1週間かけて書いてきました。けれど、1つ持って出ていこうとすると何が起きるのかは、一度も確認していませんでした。出ていけるかどうか、その部分は実は最も整備されていて、誰も(私も含めて)話さない部分でした。
出典:私自身のCRCLB/USDTの注文詳細、資産ページ、出金画面、変換画面、2026年8月12日;Binance bStocksローンチ告知、2026年6月12日。
@BinanceCIS bStockの出金画面は開きましたか?
#bStocksCIS
#bstockscis @BinanceCIS
今朝、株の約1/10を買ってから、出口を探しに行きました。
0.08 $CRCLB を 71.17 で買ったところ、5.6936 USDTになりました。通常の証券会社ならここで話は終わりで、あなたは端数を持つだけ、その端数は口座に置かれ、あなたが買ってくれた同じ証券会社にそれを売り戻すまでそこに留まります。
そこで、出金画面を開いてみて、何が表示されるか確かめました。
BNB Smart Chain。手数料 0.00 CRCLB。最低出金額 0.05 CRCLB。到着時間は約1分。
最低0.05。これはCircleの株の1/10未満で、しかも私がさっき買った額より少ない。今このまま自分のウォレットに送れば、そこに置いておけます。
資産ページに戻ると、さらにもう一つボタンがありました。週にわたって見過ごしていたものです。CRCLBをCRCLへ換える、1対1。売却ではなく換え(変換)です。私はそれをタップしてそのまま止めました。すると、規制対応のためにまずUS株の取引口座を開設し、免責事項に署名している必要があることが分かりました。つまり扉はあるけれど、その前に私はまだ踏み越えていない段差がある、ということです。
どれもbStockを「株そのもの」にするものではありません。ローンチの告知は明確で、これは1対1で裏付けられた証明書であり、元となる企業の所有権ではない、とされています。
すると、今日使える出口は2つです。ステーブルコインに売り戻すか、BEP-20トークンとして自分が管理するウォレットへ出金するか。私はたぶんどちらもしません。クリプトと並んだままSpot残高に置いておけばいいからです。ただ、それが“詰まって抜け出せない”わけではないと分かると、保有感が変わります。外へ持ち出せるポジションは、売り戻し相手が“買った人”に限られるポジションとは違うからです。
私はこの取引について1週間かけて書いてきました。けれど、1つ持って出ていこうとすると何が起きるのかは、一度も確認していませんでした。出ていけるかどうか、その部分は実は最も整備されていて、誰も(私も含めて)話さない部分でした。
出典:私自身のCRCLB/USDTの注文詳細、資産ページ、出金画面、変換画面、2026年8月12日;Binance bStocksローンチ告知、2026年6月12日。
@BinanceCIS bStockの出金画面は開きましたか?
#bStocksCIS
今朝、株の約1/10を買ってから、出口を探しに行きました。
0.08 $CRCLB を 71.17 で買ったところ、5.6936 USDTになりました。通常の証券会社ならここで話は終わりで、あなたは端数を持つだけ、その端数は口座に置かれ、あなたが買ってくれた同じ証券会社にそれを売り戻すまでそこに留まります。
そこで、出金画面を開いてみて、何が表示されるか確かめました。
BNB Smart Chain。手数料 0.00 CRCLB。最低出金額 0.05 CRCLB。到着時間は約1分。
最低0.05。これはCircleの株の1/10未満で、しかも私がさっき買った額より少ない。今このまま自分のウォレットに送れば、そこに置いておけます。
資産ページに戻ると、さらにもう一つボタンがありました。週にわたって見過ごしていたものです。CRCLBをCRCLへ換える、1対1。売却ではなく換え(変換)です。私はそれをタップしてそのまま止めました。すると、規制対応のためにまずUS株の取引口座を開設し、免責事項に署名している必要があることが分かりました。つまり扉はあるけれど、その前に私はまだ踏み越えていない段差がある、ということです。
どれもbStockを「株そのもの」にするものではありません。ローンチの告知は明確で、これは1対1で裏付けられた証明書であり、元となる企業の所有権ではない、とされています。
すると、今日使える出口は2つです。ステーブルコインに売り戻すか、BEP-20トークンとして自分が管理するウォレットへ出金するか。私はたぶんどちらもしません。クリプトと並んだままSpot残高に置いておけばいいからです。ただ、それが“詰まって抜け出せない”わけではないと分かると、保有感が変わります。外へ持ち出せるポジションは、売り戻し相手が“買った人”に限られるポジションとは違うからです。
私はこの取引について1週間かけて書いてきました。けれど、1つ持って出ていこうとすると何が起きるのかは、一度も確認していませんでした。出ていけるかどうか、その部分は実は最も整備されていて、誰も(私も含めて)話さない部分でした。
出典:私自身のCRCLB/USDTの注文詳細、資産ページ、出金画面、変換画面、2026年8月12日;Binance bStocksローンチ告知、2026年6月12日。
@BinanceCIS bStockの出金画面は開きましたか?
#bStocksCIS
19
11
241
·
--
ブリッシュ
#bstockscis
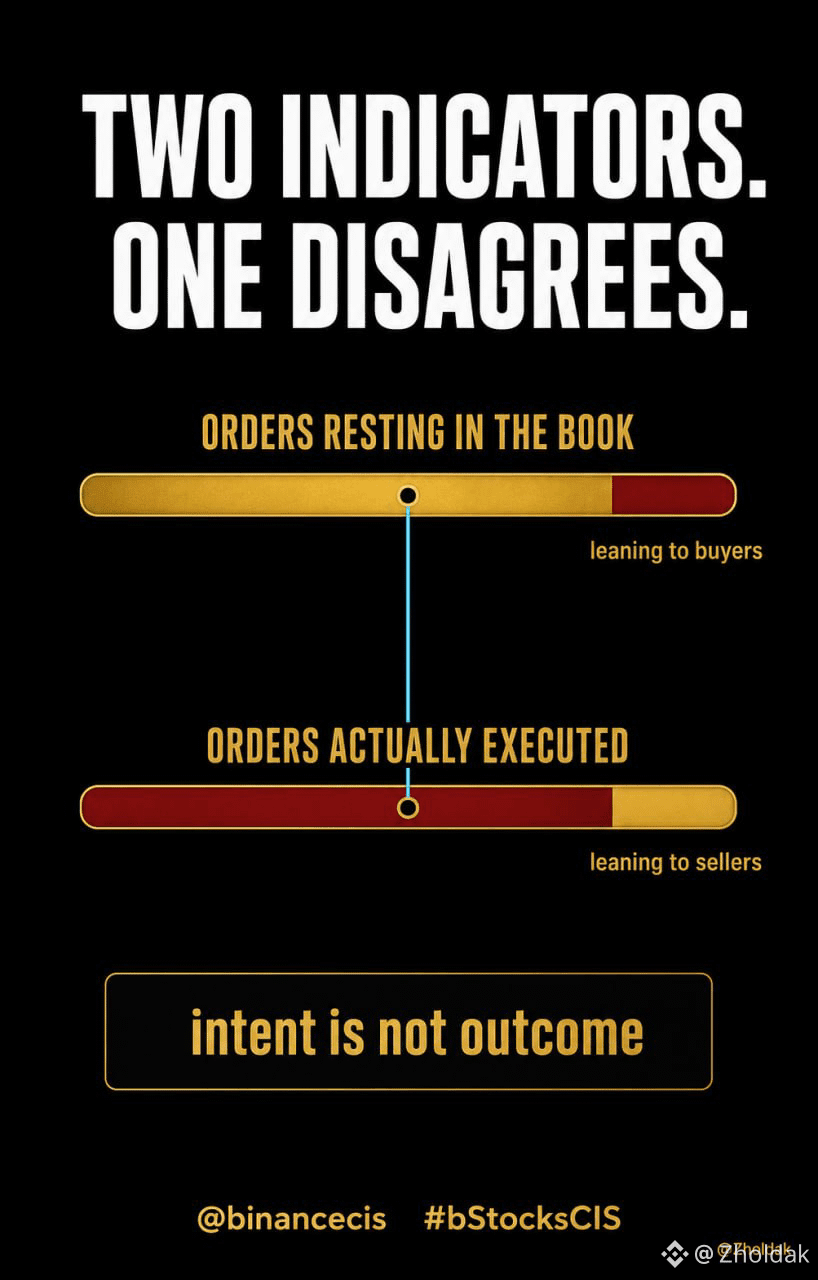
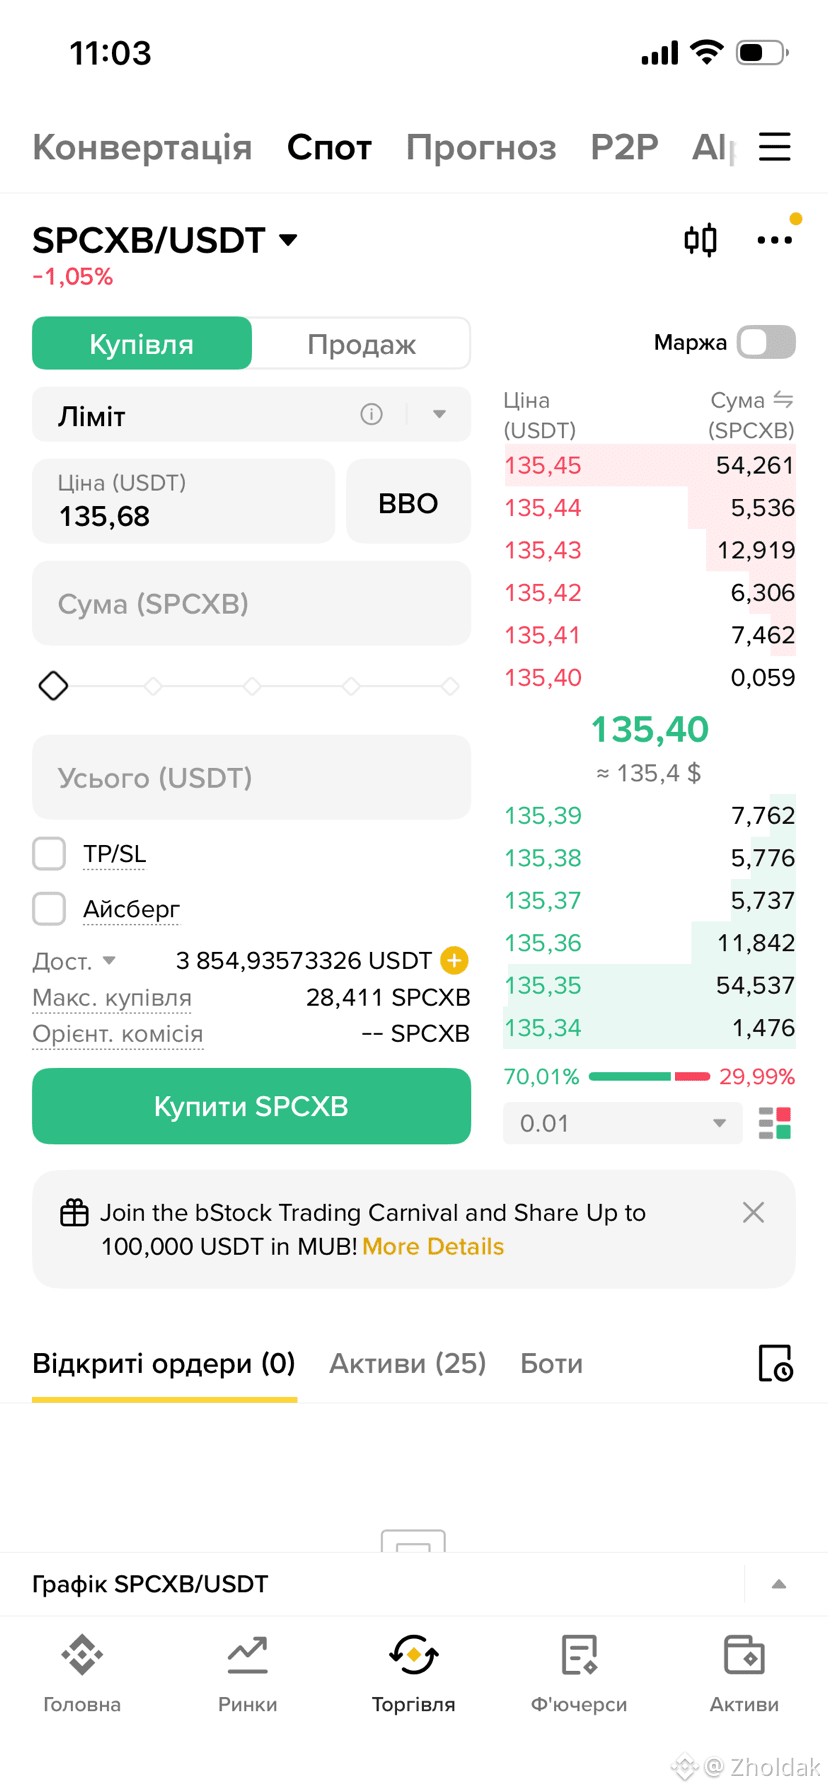
70.01%が買い。29.99%が売り。
今朝11:03の時点で、$SPCXB の注文板の下にある比率バーが示していたのがこれです。
買い手は3対1。
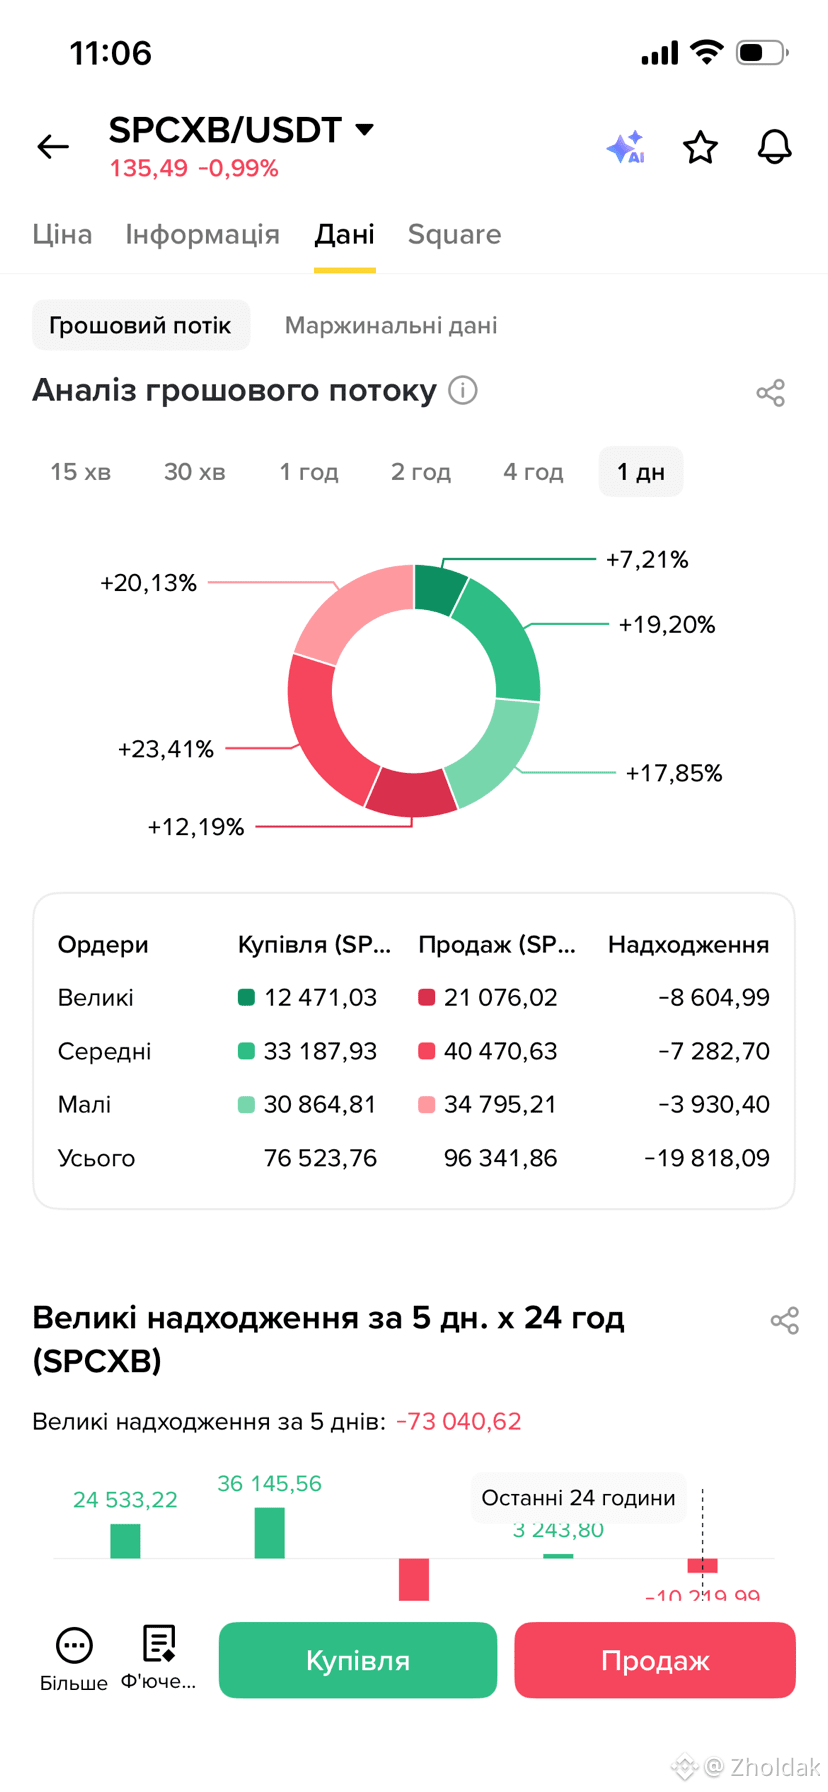
その3分後、同じペアで同じ24時間のウィンドウのデータタブを開きました。
買い出来高 76,523.76。売り出来高 96,341.86。
ネットフロー:マイナス19,818.09。
同じ銘柄。 同じ分。 でも真逆の読み。
どちらも壊れてはいません。数えているものが違うだけです。
比率バーは、板に“滞留している注文”を測ります――つまり、人々がまだ誰も到達していない価格でやりたいことです。
一方、マネーフローは“実際に約定した注文”を測ります。
意図と結果の違いです。
分解すると、より分かりやすい。大口はネットでマイナス8,604.99。中口はマイナス7,282.70。小口はマイナス3,930.40。
あらゆるサイズ区分で、同じ方向です。
これはクジラが1頭抜けた話ではありません。
見えている比率が反対方向に傾いている間も、板全体は一方向に傾いていました。
あなたが読んでいるのがどちらなのかは知っておく価値があります。
2つはタップ2回分しか離れておらず、そしてそのうちの1つだけが“実際に起きたこと”を描写しているからです。
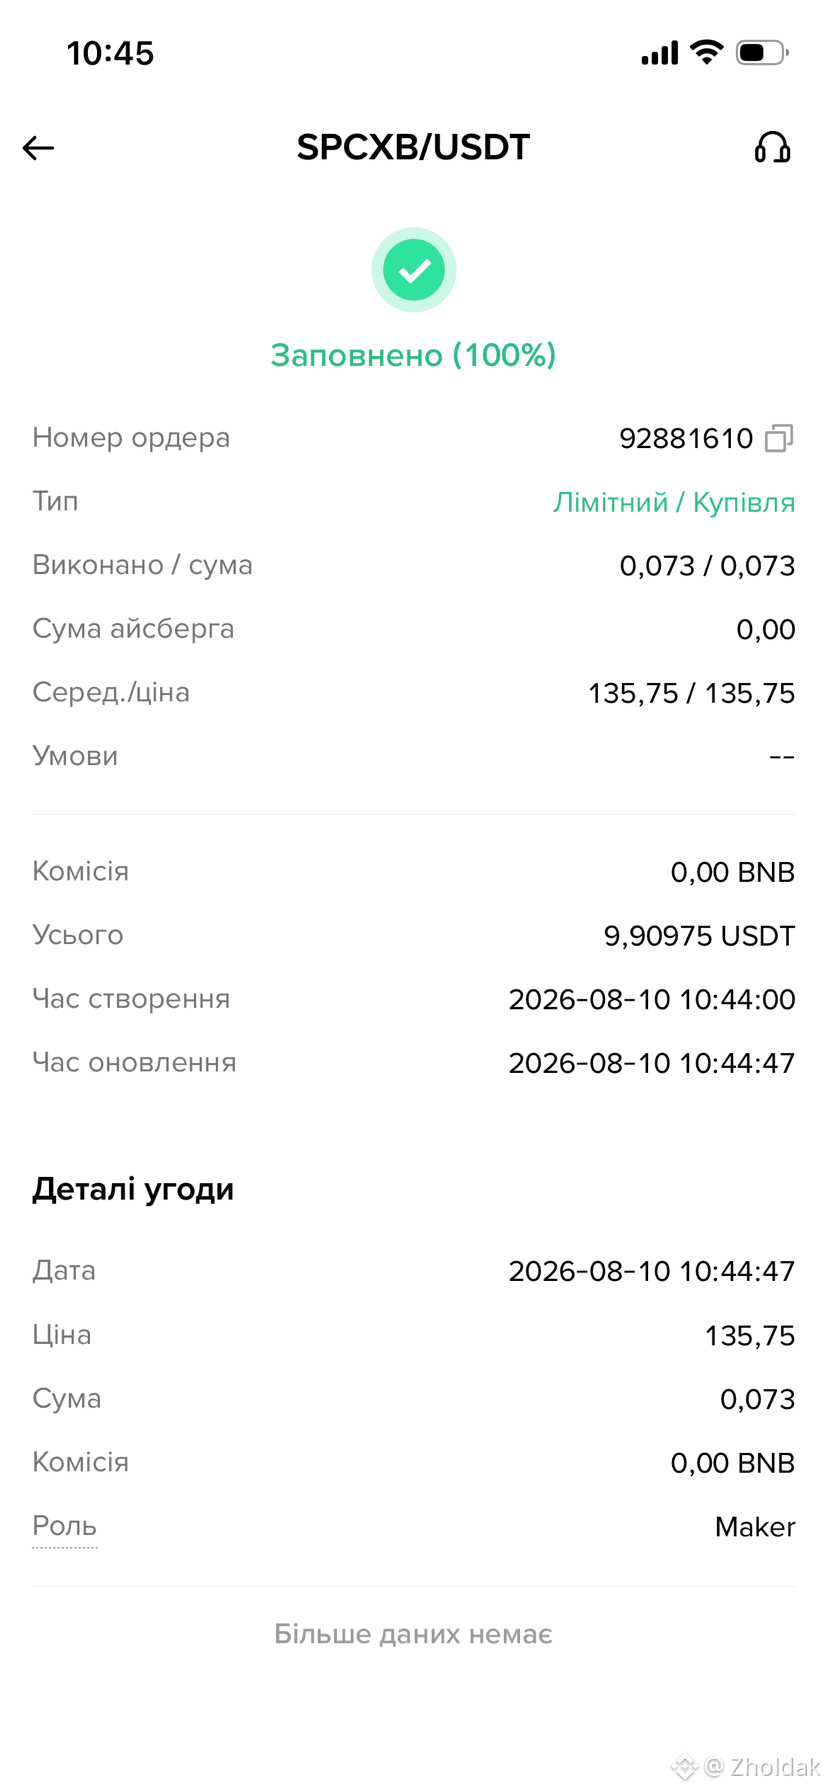
私は今朝10:44に135.75で0.073を買い、8秒後にそれを売り戻しました。
当時、どちらの指標も問題ないように見えました。
でも私は2つ目を確認していませんでした。
NASDAQは金曜の取引終了後から停止しています。
決算もありませんし、ガイダンスもなく、この会社について新しい情報も何もありません。
それでも、これらは注文フローだけで動きました。
出典:私自身のSPCXB/USDT注文板とデータタブのスクリーンショット、2026年8月10日 11:03と11:06(キエフ時間);私のSPCXB/USDT注文詳細、同日の10:44。
@BinanceCIS あなたが注文を出す前に、本当にどちらを見ていますか?
#bStocksCIS
#bstockscis
70.01%が買い。29.99%が売り。
今朝11:03の時点で、$SPCXB の注文板の下にある比率バーが示していたのがこれです。
買い手は3対1。
その3分後、同じペアで同じ24時間のウィンドウのデータタブを開きました。
買い出来高 76,523.76。売り出来高 96,341.86。
ネットフロー:マイナス19,818.09。
同じ銘柄。 同じ分。 でも真逆の読み。
どちらも壊れてはいません。数えているものが違うだけです。
比率バーは、板に“滞留している注文”を測ります――つまり、人々がまだ誰も到達していない価格でやりたいことです。
一方、マネーフローは“実際に約定した注文”を測ります。
意図と結果の違いです。
分解すると、より分かりやすい。大口はネットでマイナス8,604.99。中口はマイナス7,282.70。小口はマイナス3,930.40。
あらゆるサイズ区分で、同じ方向です。
これはクジラが1頭抜けた話ではありません。
見えている比率が反対方向に傾いている間も、板全体は一方向に傾いていました。
あなたが読んでいるのがどちらなのかは知っておく価値があります。
2つはタップ2回分しか離れておらず、そしてそのうちの1つだけが“実際に起きたこと”を描写しているからです。
私は今朝10:44に135.75で0.073を買い、8秒後にそれを売り戻しました。
当時、どちらの指標も問題ないように見えました。
でも私は2つ目を確認していませんでした。
NASDAQは金曜の取引終了後から停止しています。
決算もありませんし、ガイダンスもなく、この会社について新しい情報も何もありません。
それでも、これらは注文フローだけで動きました。
出典:私自身のSPCXB/USDT注文板とデータタブのスクリーンショット、2026年8月10日 11:03と11:06(キエフ時間);私のSPCXB/USDT注文詳細、同日の10:44。
@BinanceCIS あなたが注文を出す前に、本当にどちらを見ていますか?
#bStocksCIS
70.01%が買い。29.99%が売り。
今朝11:03の時点で、$SPCXB の注文板の下にある比率バーが示していたのがこれです。
買い手は3対1。
その3分後、同じペアで同じ24時間のウィンドウのデータタブを開きました。
買い出来高 76,523.76。売り出来高 96,341.86。
ネットフロー:マイナス19,818.09。
同じ銘柄。 同じ分。 でも真逆の読み。
どちらも壊れてはいません。数えているものが違うだけです。
比率バーは、板に“滞留している注文”を測ります――つまり、人々がまだ誰も到達していない価格でやりたいことです。
一方、マネーフローは“実際に約定した注文”を測ります。
意図と結果の違いです。
分解すると、より分かりやすい。大口はネットでマイナス8,604.99。中口はマイナス7,282.70。小口はマイナス3,930.40。
あらゆるサイズ区分で、同じ方向です。
これはクジラが1頭抜けた話ではありません。
見えている比率が反対方向に傾いている間も、板全体は一方向に傾いていました。
あなたが読んでいるのがどちらなのかは知っておく価値があります。
2つはタップ2回分しか離れておらず、そしてそのうちの1つだけが“実際に起きたこと”を描写しているからです。
私は今朝10:44に135.75で0.073を買い、8秒後にそれを売り戻しました。
当時、どちらの指標も問題ないように見えました。
でも私は2つ目を確認していませんでした。
NASDAQは金曜の取引終了後から停止しています。
決算もありませんし、ガイダンスもなく、この会社について新しい情報も何もありません。
それでも、これらは注文フローだけで動きました。
出典:私自身のSPCXB/USDT注文板とデータタブのスクリーンショット、2026年8月10日 11:03と11:06(キエフ時間);私のSPCXB/USDT注文詳細、同日の10:44。
@BinanceCIS あなたが注文を出す前に、本当にどちらを見ていますか?
#bStocksCIS
6
4
127
·
--
ブリッシュ
本人確認中
#bstockscis
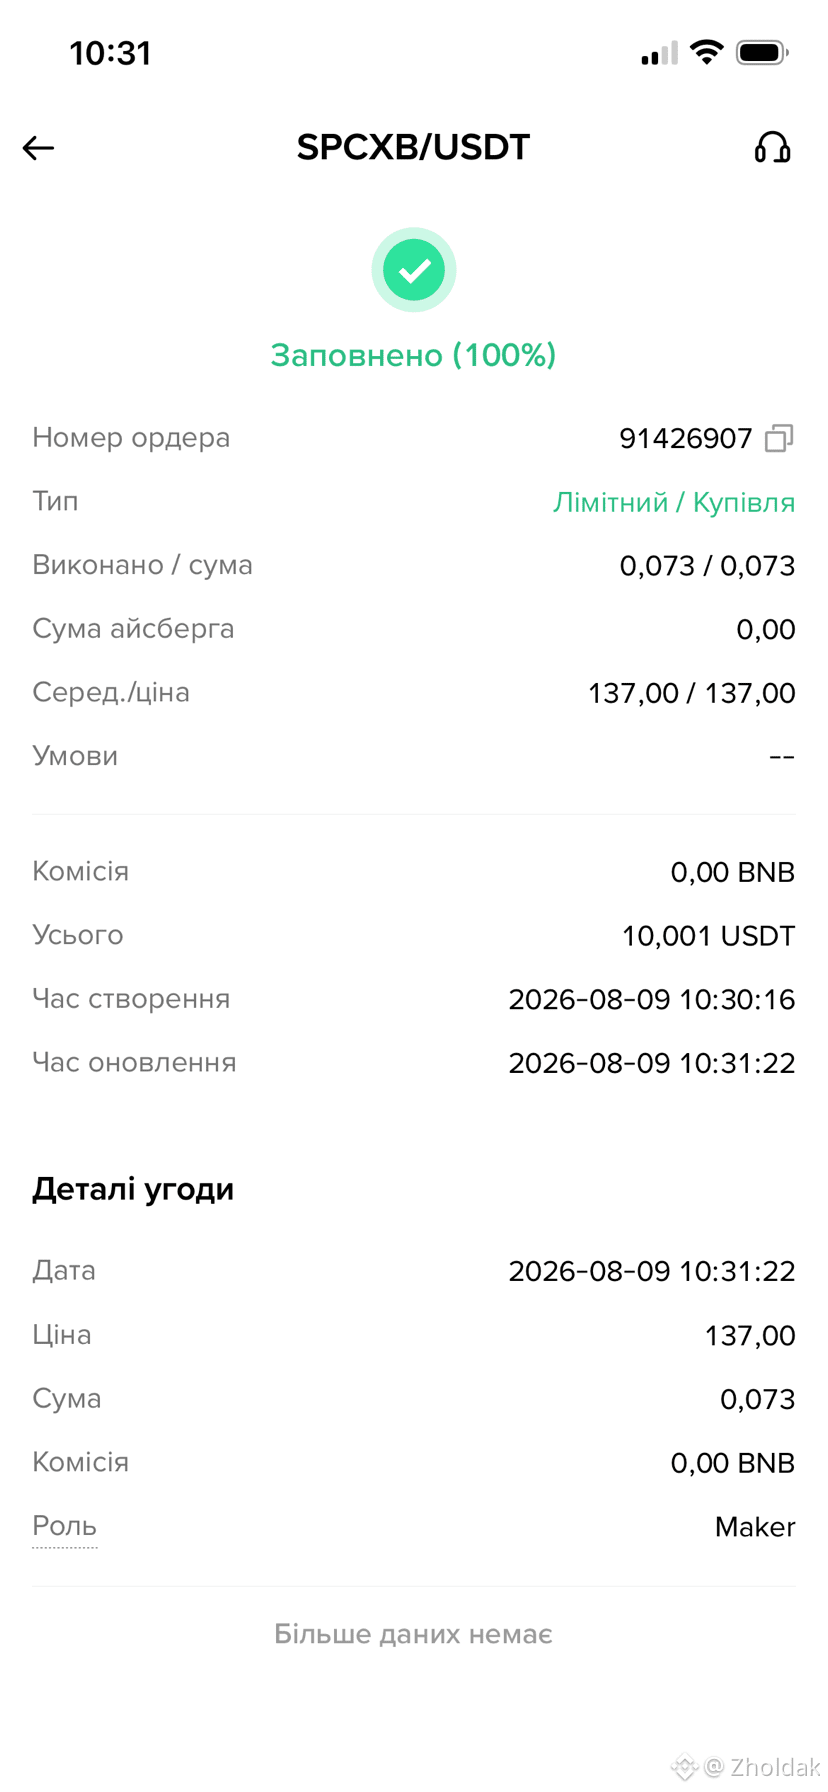
今朝、株に10ドル入れました。日曜日です。ナスダックは休場です。ですが注文はとにかく約定してしまい、現在0.073株を保有しています。
私は端数を買うかどうかを決めたわけではありません。ドル建ての金額を入力して「買う」を押しただけです。端数は、結果として出てきたものにすぎません。
ここで話したいのは、その点です。私は勘違いしていました。
端株(フラクショナル)取引は初心者向けの設定だとばかり思っていました。全株が買えるようになるまで使うもので、その後は卒業するものだと。
ところが、キャンペーン自身の初期データは逆でした。
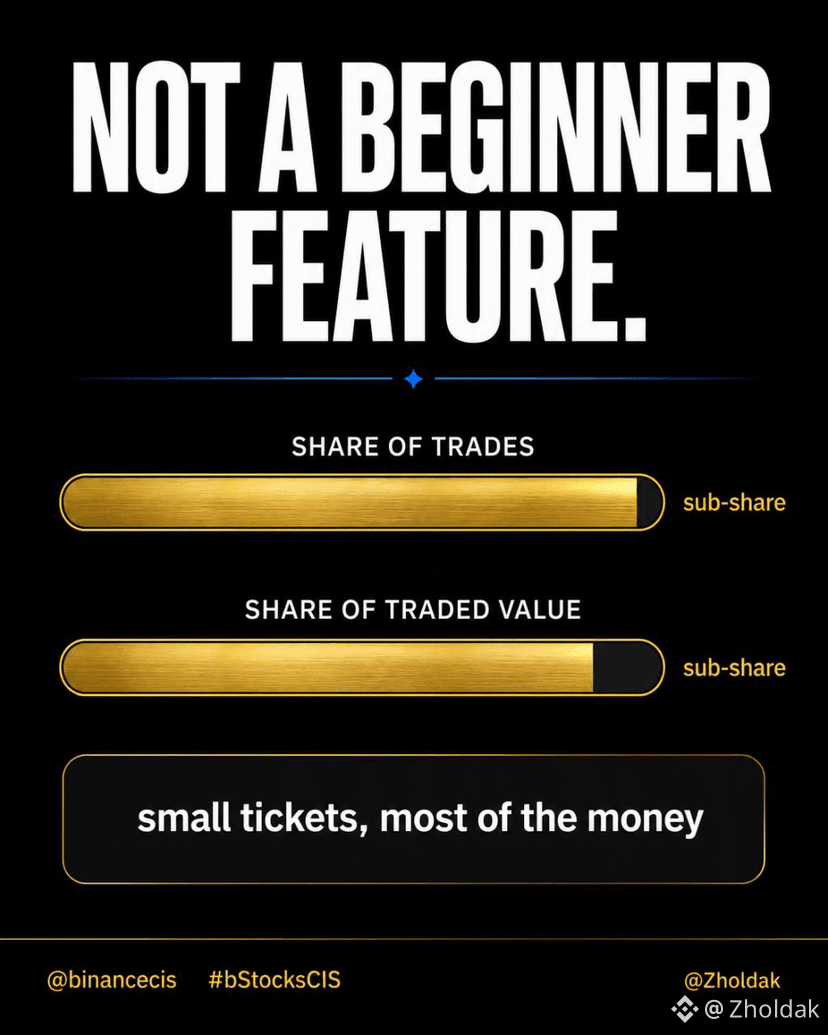
TeslaのbStock取引のうち約99.65%は、1株未満の取引です。それだけ見ると私の仮説とも整合します――小口口座、小額チケットなので不自然ではありません。
しかし、その「1株未満」の取引が、総取引額$TSLAB のうち約88.5%を占めています。
この2つの数字は別のものを測っています。1つ目は取引回数、2つ目はお金です。
この違いが、私の考えを変えました。小さな取引はいつも数が多い――それ自体では何も証明しません。もし端数取引が財布の中身で初心者が試すだけのものなら、取引回数を支配しても、出来高(取引量)からは消えるはずです。ところが、端数取引は両方に残っています。
だからこれは「つなぎ」ではありません。実際、この市場でどう取引されているかそのものです。
あとで考えると、そもそも1株は自然な単位だったわけではないのかもしれません。単に株式がこれまで、そういう形でパッケージ化されてきただけです。
今でもつい「株をいくらか買った」と言ってしまい、「$SPCXB 株買った」のように株数を言わずにしまうことがあります。実はそれは雑だからではありません。ここで考えるのが普通のやり方だと分かりました。
出典:Binance CISキャンペーン資料にある初期の数値、bStocksについて;私自身のSPCXB/USDT注文の詳細、2026年8月9日。
@BinanceCIS あなたは株数で考えますか、それともドル額で考えますか?
#bStocksCIS
#bstockscis
今朝、株に10ドル入れました。日曜日です。ナスダックは休場です。ですが注文はとにかく約定してしまい、現在0.073株を保有しています。
私は端数を買うかどうかを決めたわけではありません。ドル建ての金額を入力して「買う」を押しただけです。端数は、結果として出てきたものにすぎません。
ここで話したいのは、その点です。私は勘違いしていました。
端株(フラクショナル)取引は初心者向けの設定だとばかり思っていました。全株が買えるようになるまで使うもので、その後は卒業するものだと。
ところが、キャンペーン自身の初期データは逆でした。
TeslaのbStock取引のうち約99.65%は、1株未満の取引です。それだけ見ると私の仮説とも整合します――小口口座、小額チケットなので不自然ではありません。
しかし、その「1株未満」の取引が、総取引額$TSLAB のうち約88.5%を占めています。
この2つの数字は別のものを測っています。1つ目は取引回数、2つ目はお金です。
この違いが、私の考えを変えました。小さな取引はいつも数が多い――それ自体では何も証明しません。もし端数取引が財布の中身で初心者が試すだけのものなら、取引回数を支配しても、出来高(取引量)からは消えるはずです。ところが、端数取引は両方に残っています。
だからこれは「つなぎ」ではありません。実際、この市場でどう取引されているかそのものです。
あとで考えると、そもそも1株は自然な単位だったわけではないのかもしれません。単に株式がこれまで、そういう形でパッケージ化されてきただけです。
今でもつい「株をいくらか買った」と言ってしまい、「$SPCXB 株買った」のように株数を言わずにしまうことがあります。実はそれは雑だからではありません。ここで考えるのが普通のやり方だと分かりました。
出典:Binance CISキャンペーン資料にある初期の数値、bStocksについて;私自身のSPCXB/USDT注文の詳細、2026年8月9日。
@BinanceCIS あなたは株数で考えますか、それともドル額で考えますか?
#bStocksCIS
今朝、株に10ドル入れました。日曜日です。ナスダックは休場です。ですが注文はとにかく約定してしまい、現在0.073株を保有しています。
私は端数を買うかどうかを決めたわけではありません。ドル建ての金額を入力して「買う」を押しただけです。端数は、結果として出てきたものにすぎません。
ここで話したいのは、その点です。私は勘違いしていました。
端株(フラクショナル)取引は初心者向けの設定だとばかり思っていました。全株が買えるようになるまで使うもので、その後は卒業するものだと。
ところが、キャンペーン自身の初期データは逆でした。
TeslaのbStock取引のうち約99.65%は、1株未満の取引です。それだけ見ると私の仮説とも整合します――小口口座、小額チケットなので不自然ではありません。
しかし、その「1株未満」の取引が、総取引額$TSLAB のうち約88.5%を占めています。
この2つの数字は別のものを測っています。1つ目は取引回数、2つ目はお金です。
この違いが、私の考えを変えました。小さな取引はいつも数が多い――それ自体では何も証明しません。もし端数取引が財布の中身で初心者が試すだけのものなら、取引回数を支配しても、出来高(取引量)からは消えるはずです。ところが、端数取引は両方に残っています。
だからこれは「つなぎ」ではありません。実際、この市場でどう取引されているかそのものです。
あとで考えると、そもそも1株は自然な単位だったわけではないのかもしれません。単に株式がこれまで、そういう形でパッケージ化されてきただけです。
今でもつい「株をいくらか買った」と言ってしまい、「$SPCXB 株買った」のように株数を言わずにしまうことがあります。実はそれは雑だからではありません。ここで考えるのが普通のやり方だと分かりました。
出典:Binance CISキャンペーン資料にある初期の数値、bStocksについて;私自身のSPCXB/USDT注文の詳細、2026年8月9日。
@BinanceCIS あなたは株数で考えますか、それともドル額で考えますか?
#bStocksCIS
1
2
168
·
--
ブリッシュ
本人確認中
#bstockscis
今週もまたbStocksのローンチ告知を読み返していて、主に関係のないことを確認するつもりだったのですが、ある点が引っかかりました。
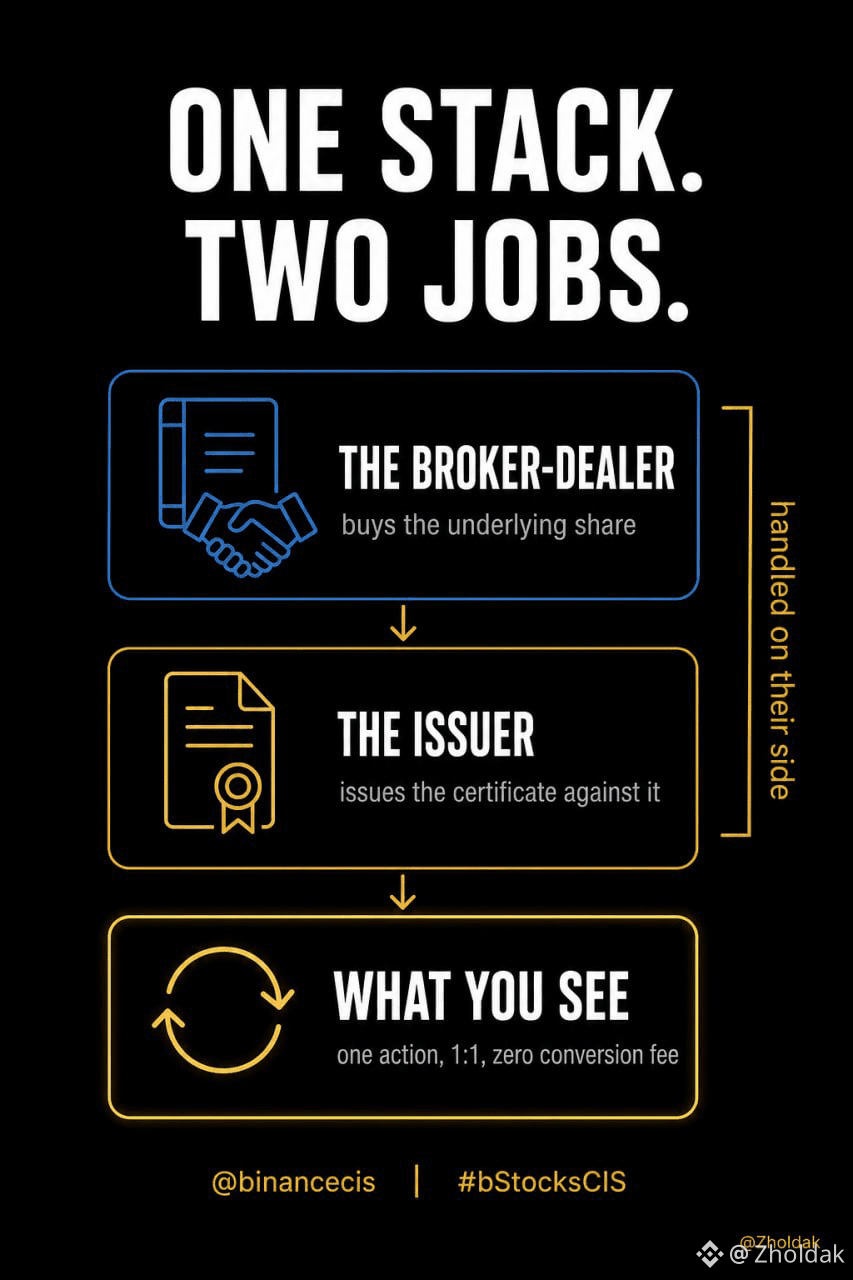
この構造には2つの会社があります。私は1つだと思い込んでいました。
BTech Holdings Limitedが証明書を発行します――つまり、$NVDAB または$TSLAB を買うときに実際に手元にあるものです。そこは分かっていました。けれど、基礎となる株式は別のブローカー・ディーラーであるNest Trading Limitedを通じて購入されます。
だから、告知文に「対応する基礎株式とbStocksの間で1:1の比率で、転換手数料ゼロで転換が行われる」とあるのは、同じシステムの2つのアーム間で受け渡しが起きることを説明しています。
そう考えてみると、ずっと当然だと思っていたことの理由が説明できました。
「即時で無料」は、彼らがただ“配る”ことを選んだ機能ではありません。両サイドが最初から同じ屋根の下にあるときに初めて可能になることです。外部への移転が不要で、相手待ちも発生せず、ブローカー間の決済キューもありません。
これを、互いに無関係な2つのブローカー間で同等にやろうとすると、数日かかり、ほぼすべてのステップでコストがかかります。
同じ告知は残りの点についても正確です――「FSMR第92条、スケジュール1」に基づく証明書で、ADGMの承認済みプロスペクタスを通じて提供され、セカンダリーマーケットのみ、対象の管轄区域のみ。前提で決めつけず、一度読んでみる価値があります。
2つの事業体が2つの仕事をしていて、あなた側には1つのボタン。
出典:Binance公式のbStocksローンチ告知、2026年6月12日。
@BinanceCIS 実際に構造を読んでみて、いちばん驚いたのはどこですか?
#bStocksCIS
#bstockscis
今週もまたbStocksのローンチ告知を読み返していて、主に関係のないことを確認するつもりだったのですが、ある点が引っかかりました。
この構造には2つの会社があります。私は1つだと思い込んでいました。
BTech Holdings Limitedが証明書を発行します――つまり、$NVDAB または$TSLAB を買うときに実際に手元にあるものです。そこは分かっていました。けれど、基礎となる株式は別のブローカー・ディーラーであるNest Trading Limitedを通じて購入されます。
だから、告知文に「対応する基礎株式とbStocksの間で1:1の比率で、転換手数料ゼロで転換が行われる」とあるのは、同じシステムの2つのアーム間で受け渡しが起きることを説明しています。
そう考えてみると、ずっと当然だと思っていたことの理由が説明できました。
「即時で無料」は、彼らがただ“配る”ことを選んだ機能ではありません。両サイドが最初から同じ屋根の下にあるときに初めて可能になることです。外部への移転が不要で、相手待ちも発生せず、ブローカー間の決済キューもありません。
これを、互いに無関係な2つのブローカー間で同等にやろうとすると、数日かかり、ほぼすべてのステップでコストがかかります。
同じ告知は残りの点についても正確です――「FSMR第92条、スケジュール1」に基づく証明書で、ADGMの承認済みプロスペクタスを通じて提供され、セカンダリーマーケットのみ、対象の管轄区域のみ。前提で決めつけず、一度読んでみる価値があります。
2つの事業体が2つの仕事をしていて、あなた側には1つのボタン。
出典:Binance公式のbStocksローンチ告知、2026年6月12日。
@BinanceCIS 実際に構造を読んでみて、いちばん驚いたのはどこですか?
#bStocksCIS
今週もまたbStocksのローンチ告知を読み返していて、主に関係のないことを確認するつもりだったのですが、ある点が引っかかりました。
この構造には2つの会社があります。私は1つだと思い込んでいました。
BTech Holdings Limitedが証明書を発行します――つまり、$NVDAB または$TSLAB を買うときに実際に手元にあるものです。そこは分かっていました。けれど、基礎となる株式は別のブローカー・ディーラーであるNest Trading Limitedを通じて購入されます。
だから、告知文に「対応する基礎株式とbStocksの間で1:1の比率で、転換手数料ゼロで転換が行われる」とあるのは、同じシステムの2つのアーム間で受け渡しが起きることを説明しています。
そう考えてみると、ずっと当然だと思っていたことの理由が説明できました。
「即時で無料」は、彼らがただ“配る”ことを選んだ機能ではありません。両サイドが最初から同じ屋根の下にあるときに初めて可能になることです。外部への移転が不要で、相手待ちも発生せず、ブローカー間の決済キューもありません。
これを、互いに無関係な2つのブローカー間で同等にやろうとすると、数日かかり、ほぼすべてのステップでコストがかかります。
同じ告知は残りの点についても正確です――「FSMR第92条、スケジュール1」に基づく証明書で、ADGMの承認済みプロスペクタスを通じて提供され、セカンダリーマーケットのみ、対象の管轄区域のみ。前提で決めつけず、一度読んでみる価値があります。
2つの事業体が2つの仕事をしていて、あなた側には1つのボタン。
出典:Binance公式のbStocksローンチ告知、2026年6月12日。
@BinanceCIS 実際に構造を読んでみて、いちばん驚いたのはどこですか?
#bStocksCIS
1
4
96
·
--
ブリッシュ
#bstockscis
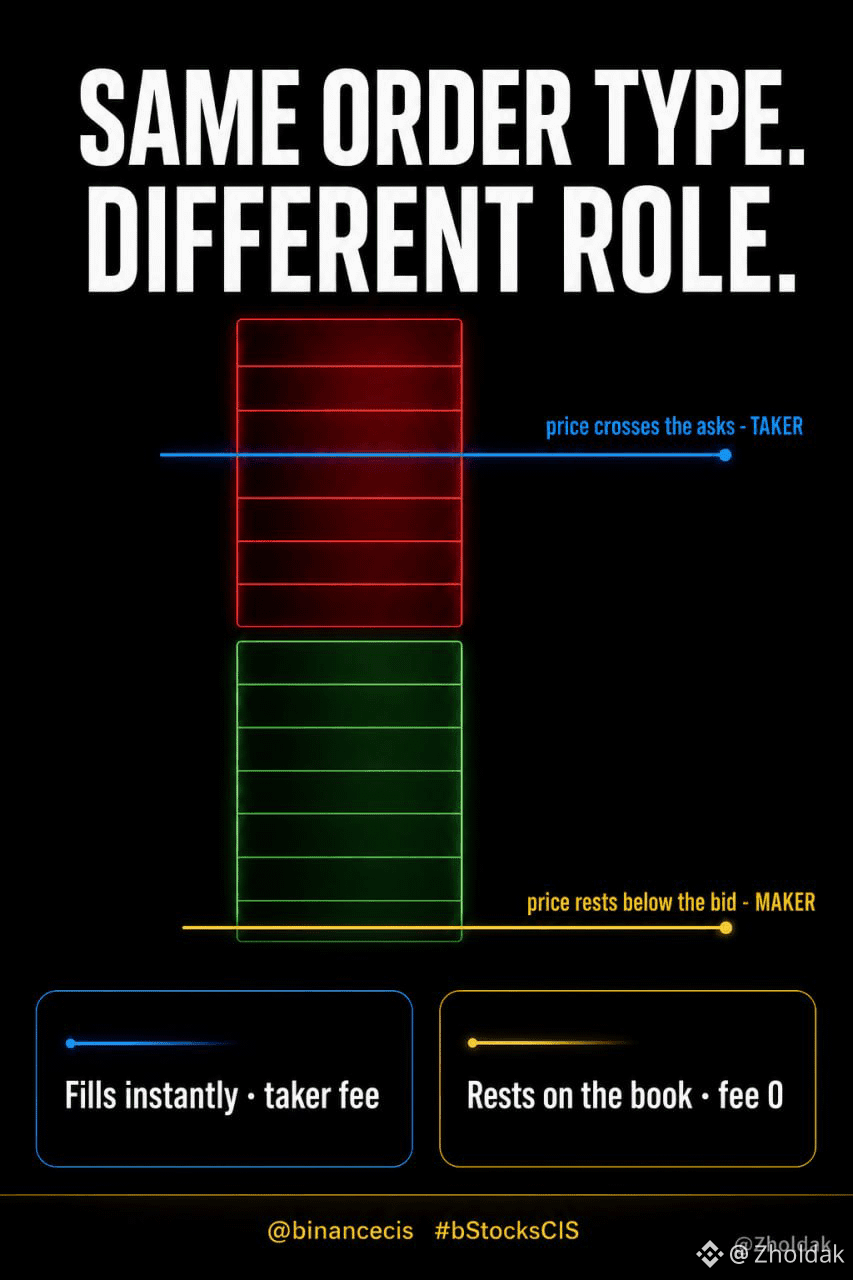
「Limit(指値)」を選んでも、メイカーになったわけではありません。そうだと思い込んでいました。
昨日、指値注文を出したところ、見積り手数料がゼロと表示されました。それを確認と受け取り、先に進みました。
今日は $SPCXB で正しくテストしました。
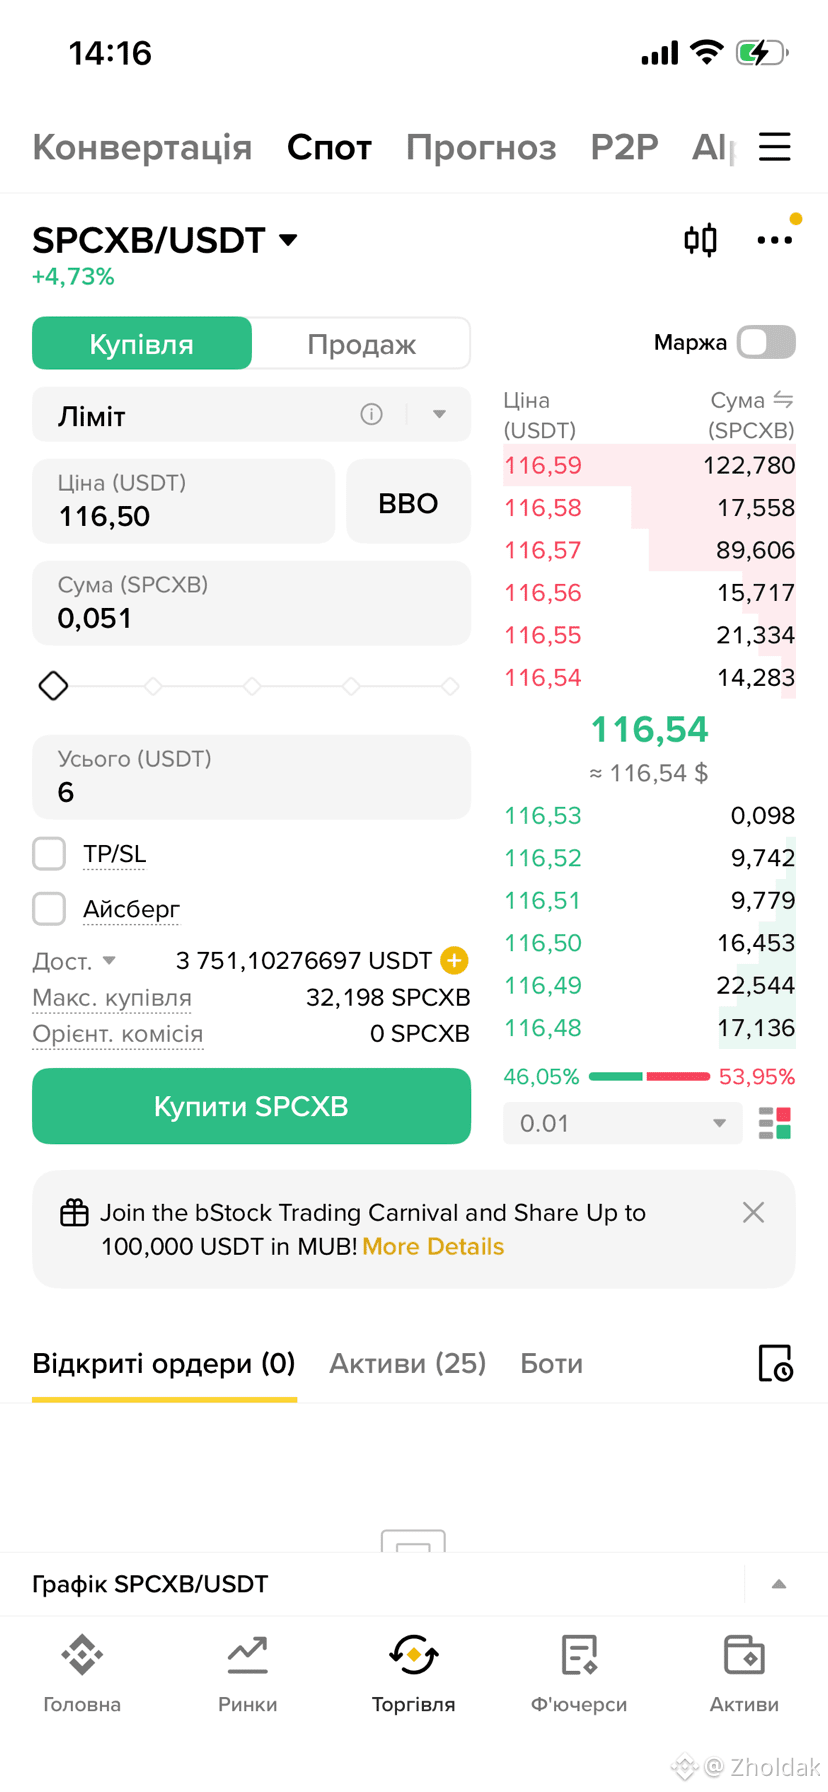
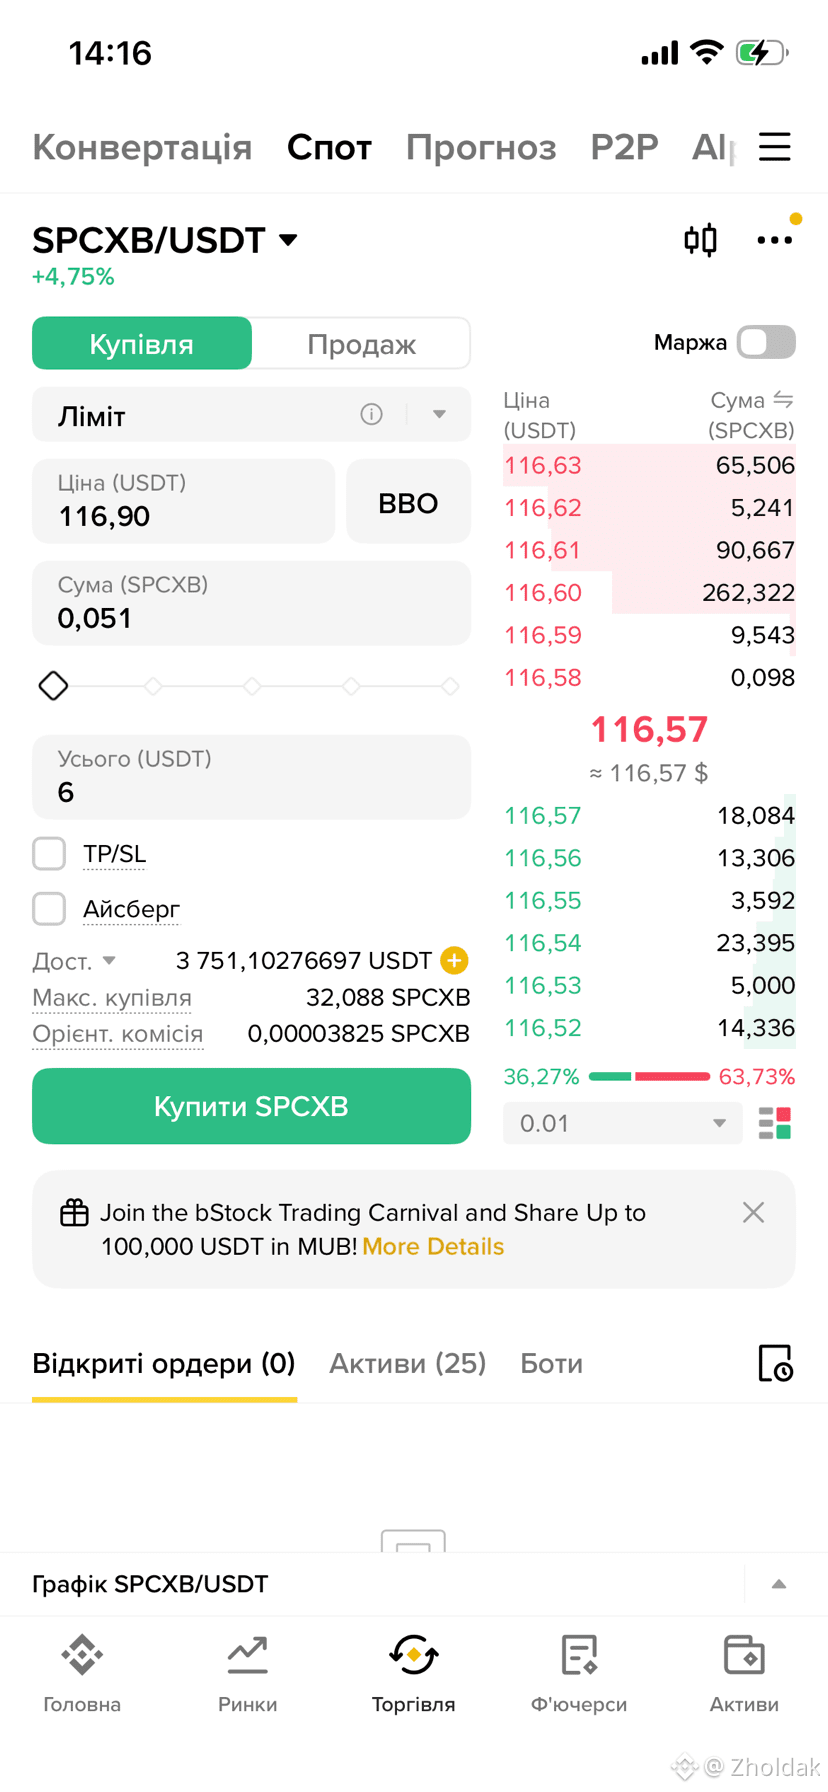
1つ目の注文:指値 116.50。最良の買い(ベストビッド)が 116.53 にありました。ビッドの下にはマッチできる注文がありません。見積り手数料:0 SPCXB。
2つ目の注文:指値 116.90。最良の売り(ベストアスク)が 116.58 にありました。私の価格は、すでにそこに置かれていた注文に届きました。見積り手数料:0.00003825 SPCXB。
同じ注文タイプ。 同じペア。 同じ分。 1つは無料、もう1つは無料ではない。
違いは注文サイズの約0.075%で、6ドルなら小さく、実際に気にしているポジションではさらに小さいです。
私が間違っていた点:
注文タイプは「あなたが何を依頼したか」を表します。ロールは「板(ブック)がそれをどう扱ったか」を表します。スプレッドをまたぐ(またぎ買い・またぎ売りになる)指値は流動性を除去するので、どのタブをクリックしたかにかかわらずテイカーとして約定します。
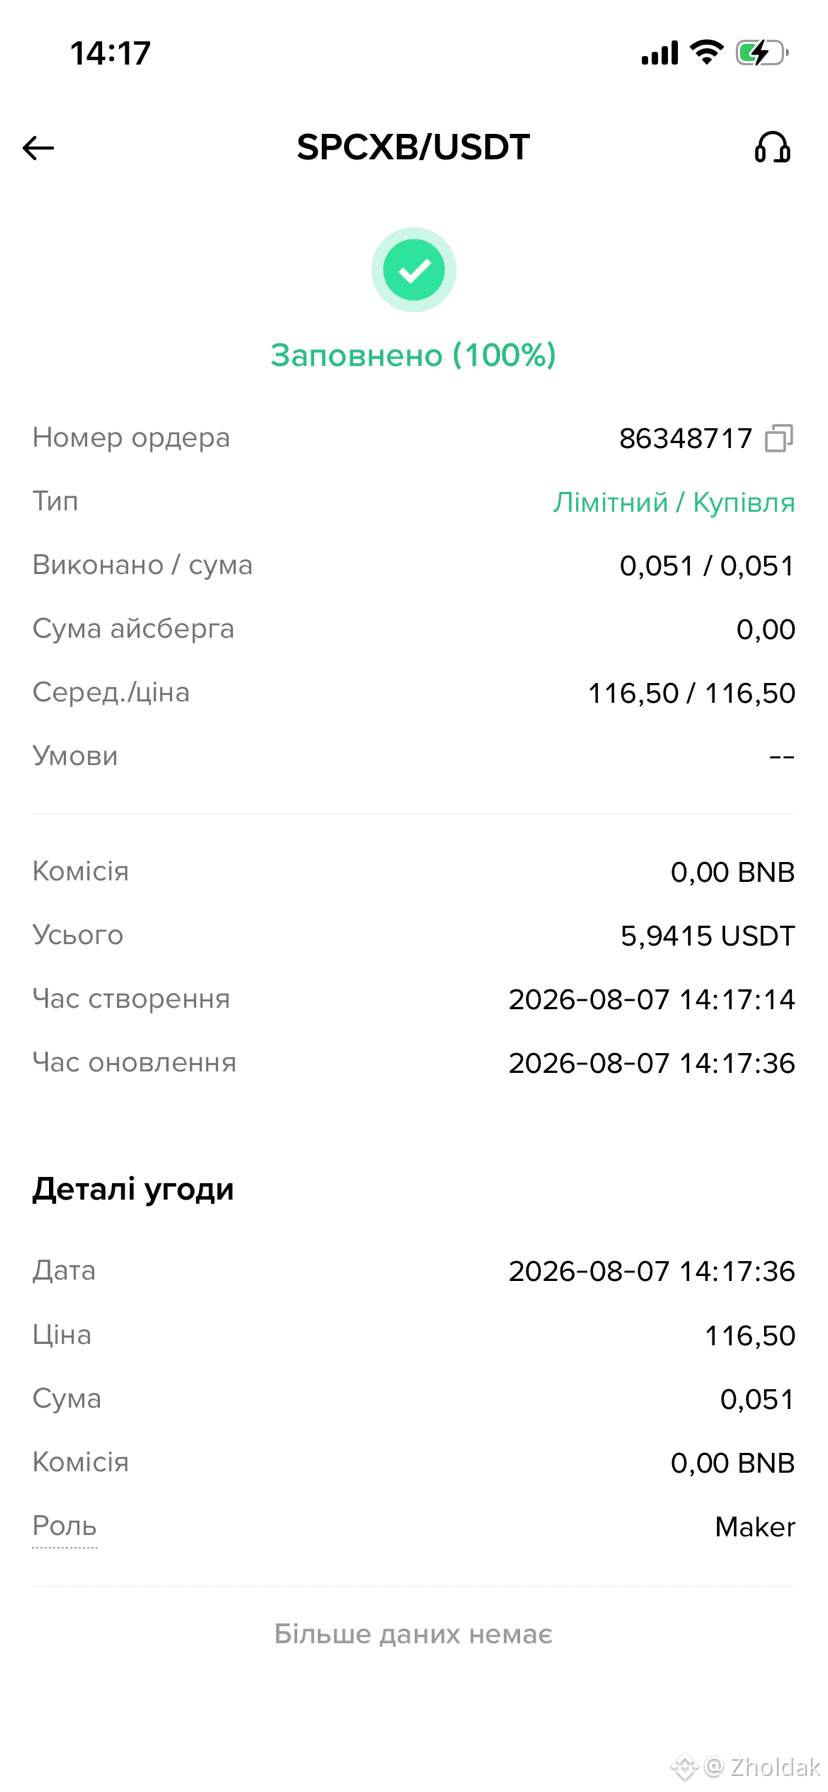
1つ目の注文は22秒後に約定しました。注文詳細がそれを確認しています—ロール:Maker、手数料 0.00 BNB。
bStocks ペアのメイカー手数料ゼロは 8月31日まで実施されます。これは注文が実際に板に残っている場合に限られます。
自分の注文履歴で Role フィールドを確認する価値があります。期待した表示になっていない可能性があります。
出典:SPCXB/USDT の注文画面と注文詳細、2026年8月7日 14:16〜14:17(UTC+3)。 Binance の bStocks 手数料プロモーション(2026年8月31日まで)。
@BinanceCIS あなたの指値注文が、実際にメイカーとして約定しているか確認したことはありますか?
$SPCXB
#bstockscis
「Limit(指値)」を選んでも、メイカーになったわけではありません。そうだと思い込んでいました。
昨日、指値注文を出したところ、見積り手数料がゼロと表示されました。それを確認と受け取り、先に進みました。
今日は $SPCXB で正しくテストしました。
1つ目の注文:指値 116.50。最良の買い(ベストビッド)が 116.53 にありました。ビッドの下にはマッチできる注文がありません。見積り手数料:0 SPCXB。
2つ目の注文:指値 116.90。最良の売り(ベストアスク)が 116.58 にありました。私の価格は、すでにそこに置かれていた注文に届きました。見積り手数料:0.00003825 SPCXB。
同じ注文タイプ。 同じペア。 同じ分。 1つは無料、もう1つは無料ではない。
違いは注文サイズの約0.075%で、6ドルなら小さく、実際に気にしているポジションではさらに小さいです。
私が間違っていた点:
注文タイプは「あなたが何を依頼したか」を表します。ロールは「板(ブック)がそれをどう扱ったか」を表します。スプレッドをまたぐ(またぎ買い・またぎ売りになる)指値は流動性を除去するので、どのタブをクリックしたかにかかわらずテイカーとして約定します。
1つ目の注文は22秒後に約定しました。注文詳細がそれを確認しています—ロール:Maker、手数料 0.00 BNB。
bStocks ペアのメイカー手数料ゼロは 8月31日まで実施されます。これは注文が実際に板に残っている場合に限られます。
自分の注文履歴で Role フィールドを確認する価値があります。期待した表示になっていない可能性があります。
出典:SPCXB/USDT の注文画面と注文詳細、2026年8月7日 14:16〜14:17(UTC+3)。 Binance の bStocks 手数料プロモーション(2026年8月31日まで)。
@BinanceCIS あなたの指値注文が、実際にメイカーとして約定しているか確認したことはありますか?
$SPCXB
「Limit(指値)」を選んでも、メイカーになったわけではありません。そうだと思い込んでいました。
昨日、指値注文を出したところ、見積り手数料がゼロと表示されました。それを確認と受け取り、先に進みました。
今日は $SPCXB で正しくテストしました。
1つ目の注文:指値 116.50。最良の買い(ベストビッド)が 116.53 にありました。ビッドの下にはマッチできる注文がありません。見積り手数料:0 SPCXB。
2つ目の注文:指値 116.90。最良の売り(ベストアスク)が 116.58 にありました。私の価格は、すでにそこに置かれていた注文に届きました。見積り手数料:0.00003825 SPCXB。
同じ注文タイプ。 同じペア。 同じ分。 1つは無料、もう1つは無料ではない。
違いは注文サイズの約0.075%で、6ドルなら小さく、実際に気にしているポジションではさらに小さいです。
私が間違っていた点:
注文タイプは「あなたが何を依頼したか」を表します。ロールは「板(ブック)がそれをどう扱ったか」を表します。スプレッドをまたぐ(またぎ買い・またぎ売りになる)指値は流動性を除去するので、どのタブをクリックしたかにかかわらずテイカーとして約定します。
1つ目の注文は22秒後に約定しました。注文詳細がそれを確認しています—ロール:Maker、手数料 0.00 BNB。
bStocks ペアのメイカー手数料ゼロは 8月31日まで実施されます。これは注文が実際に板に残っている場合に限られます。
自分の注文履歴で Role フィールドを確認する価値があります。期待した表示になっていない可能性があります。
出典:SPCXB/USDT の注文画面と注文詳細、2026年8月7日 14:16〜14:17(UTC+3)。 Binance の bStocks 手数料プロモーション(2026年8月31日まで)。
@BinanceCIS あなたの指値注文が、実際にメイカーとして約定しているか確認したことはありますか?
$SPCXB
7
111
·
--
ブリッシュ
#bstockscis
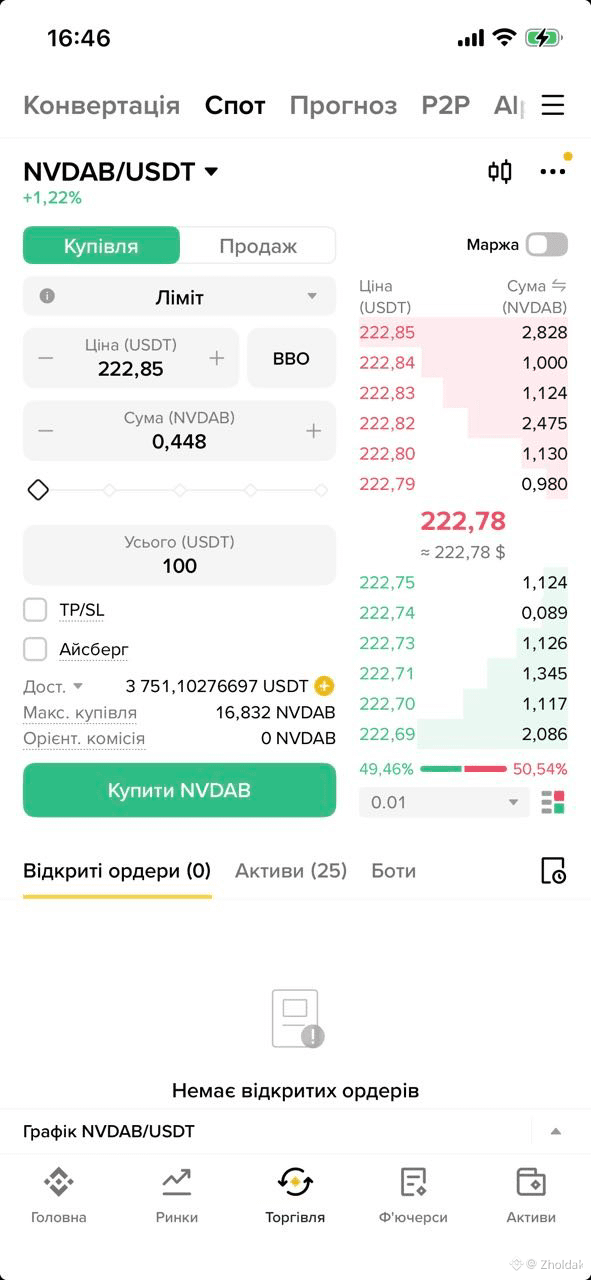
注文画面に表示されている手数料見積もりが「0 NVDAB」になっています。この数字には有効期限があり、あと25日です。
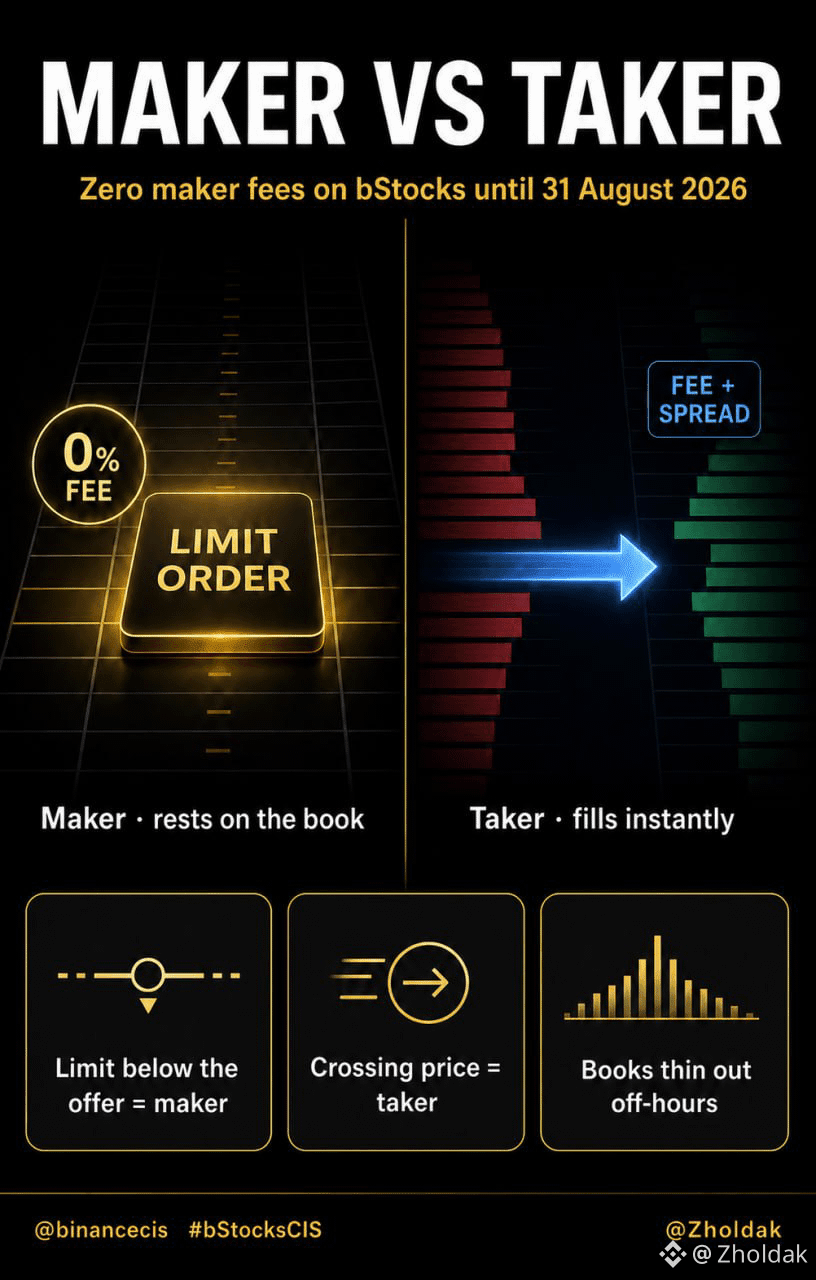
Binanceでは、適格なbStocksペアについて、2026年8月31日 23:59(UTC)までゼロメイカーフィーを実施しています。
メイカー注文とは、板に残っていて、誰かにヒットされるのを待つ指値注文です。テイカー注文は、すでにそこにある注文に対して即時に約定します。いまのところ、これらのペアではメイカー側は手数料がかかりません。
同じ取引でも、やり方が2つあってコストが2通り。下のスクリーンショット——$NVDAB に対する100ドルの指値注文、推定手数料:ゼロ。
知っておくべき落とし穴があります。「注文タイプ」で「Limit(指値)」を選んだからといって、それだけで自動的にメイカーになるわけではありません。指値価格が既存の売り(asks)に食い込むと注文はすぐ約定し、結局あなたはテイカーになります。メイカーかどうかは「どのタブをクリックしたか」ではなく「どこに価格を置いたか」で決まります。
そして手数料は、多くの場合は計算式の中でより小さい数字です。米国時間外は板が薄くなり、マーケット注文は手数料に加えてスプレッド幅の全幅を支払うことになります。
同じ方向を指しつつ、オファー(提示価格)より下に指値を置く理由が2つあります。そのうち1つは2026年8月31日に期限が来ます。
$TSLAB にでも、他のどれかの銘柄に向けて積み立てているなら、9月前に確認する価値があります。
出典:Binanceの掲載(リスティング)発表(2026年7月29日および8月5日)、NVDAB/USDT注文画面(2026年8月6日)。
@BinanceCIS 手数料の期間が閉じる前に、注文の習慣を変えますか?
1 — すでに指値のみ
2 — 31 Augまでに切り替え
3 — 私の規模では手数料は些細
4 — まだbStocksを取引していない
下に数字を入力してください。
#bstockscis
注文画面に表示されている手数料見積もりが「0 NVDAB」になっています。この数字には有効期限があり、あと25日です。
Binanceでは、適格なbStocksペアについて、2026年8月31日 23:59(UTC)までゼロメイカーフィーを実施しています。
メイカー注文とは、板に残っていて、誰かにヒットされるのを待つ指値注文です。テイカー注文は、すでにそこにある注文に対して即時に約定します。いまのところ、これらのペアではメイカー側は手数料がかかりません。
同じ取引でも、やり方が2つあってコストが2通り。下のスクリーンショット——$NVDAB に対する100ドルの指値注文、推定手数料:ゼロ。
知っておくべき落とし穴があります。「注文タイプ」で「Limit(指値)」を選んだからといって、それだけで自動的にメイカーになるわけではありません。指値価格が既存の売り(asks)に食い込むと注文はすぐ約定し、結局あなたはテイカーになります。メイカーかどうかは「どのタブをクリックしたか」ではなく「どこに価格を置いたか」で決まります。
そして手数料は、多くの場合は計算式の中でより小さい数字です。米国時間外は板が薄くなり、マーケット注文は手数料に加えてスプレッド幅の全幅を支払うことになります。
同じ方向を指しつつ、オファー(提示価格)より下に指値を置く理由が2つあります。そのうち1つは2026年8月31日に期限が来ます。
$TSLAB にでも、他のどれかの銘柄に向けて積み立てているなら、9月前に確認する価値があります。
出典:Binanceの掲載(リスティング)発表(2026年7月29日および8月5日)、NVDAB/USDT注文画面(2026年8月6日)。
@BinanceCIS 手数料の期間が閉じる前に、注文の習慣を変えますか?
1 — すでに指値のみ
2 — 31 Augまでに切り替え
3 — 私の規模では手数料は些細
4 — まだbStocksを取引していない
下に数字を入力してください。
注文画面に表示されている手数料見積もりが「0 NVDAB」になっています。この数字には有効期限があり、あと25日です。
Binanceでは、適格なbStocksペアについて、2026年8月31日 23:59(UTC)までゼロメイカーフィーを実施しています。
メイカー注文とは、板に残っていて、誰かにヒットされるのを待つ指値注文です。テイカー注文は、すでにそこにある注文に対して即時に約定します。いまのところ、これらのペアではメイカー側は手数料がかかりません。
同じ取引でも、やり方が2つあってコストが2通り。下のスクリーンショット——$NVDAB に対する100ドルの指値注文、推定手数料:ゼロ。
知っておくべき落とし穴があります。「注文タイプ」で「Limit(指値)」を選んだからといって、それだけで自動的にメイカーになるわけではありません。指値価格が既存の売り(asks)に食い込むと注文はすぐ約定し、結局あなたはテイカーになります。メイカーかどうかは「どのタブをクリックしたか」ではなく「どこに価格を置いたか」で決まります。
そして手数料は、多くの場合は計算式の中でより小さい数字です。米国時間外は板が薄くなり、マーケット注文は手数料に加えてスプレッド幅の全幅を支払うことになります。
同じ方向を指しつつ、オファー(提示価格)より下に指値を置く理由が2つあります。そのうち1つは2026年8月31日に期限が来ます。
$TSLAB にでも、他のどれかの銘柄に向けて積み立てているなら、9月前に確認する価値があります。
出典:Binanceの掲載(リスティング)発表(2026年7月29日および8月5日)、NVDAB/USDT注文画面(2026年8月6日)。
@BinanceCIS 手数料の期間が閉じる前に、注文の習慣を変えますか?
1 — すでに指値のみ
2 — 31 Augまでに切り替え
3 — 私の規模では手数料は些細
4 — まだbStocksを取引していない
下に数字を入力してください。
1
7
110
·
--
#bstockscis
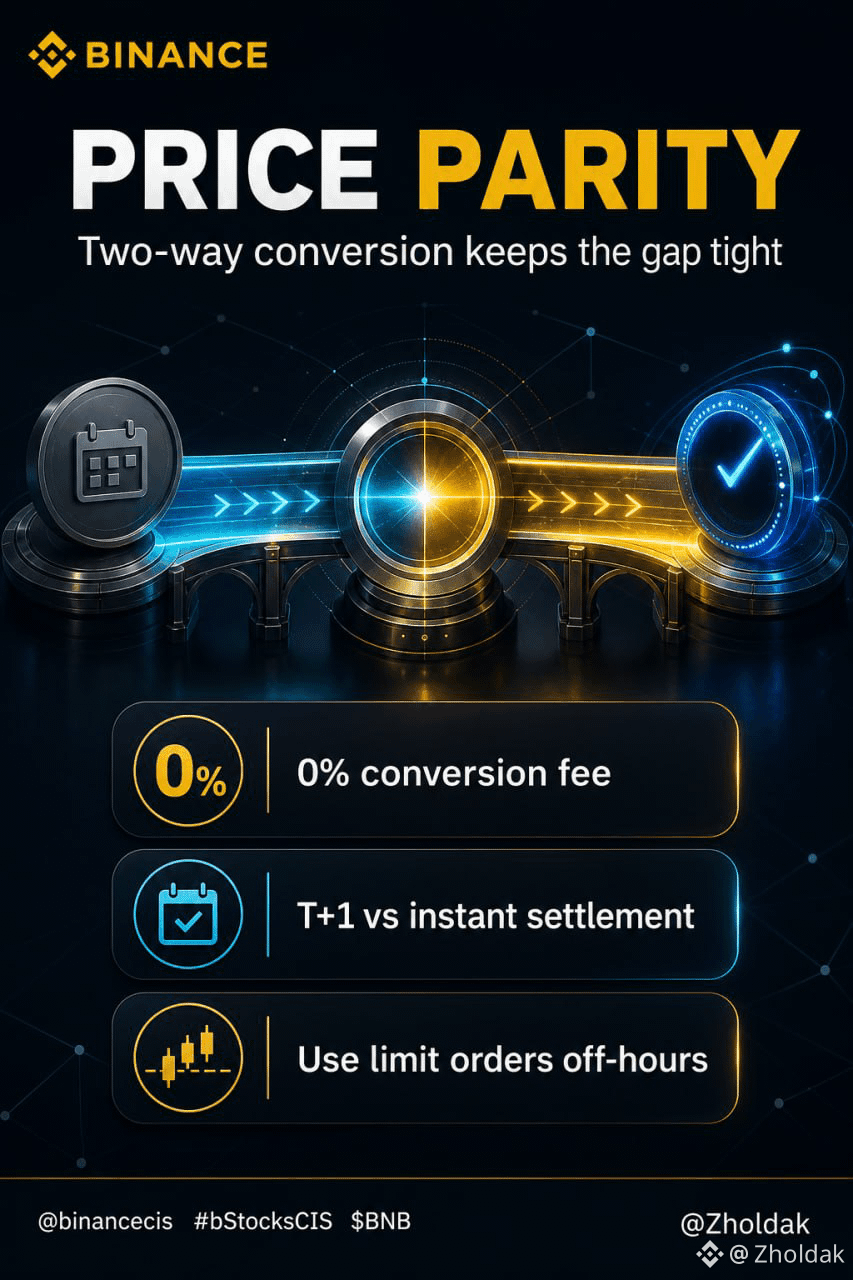
それでは、従来側であなたが慣れ親しんでいる仕組みと比較してみましょう。米国のブローカレッジによる株式取引はT+1で清算されます。つまり、あなたが今日執行したものが、明日ポジションの決済に至るということです。資本は移動中のまま、市場は動き続けます。一方、トークン側には決済キュー(待ち行列)がそもそもありません。執行と決済が同じ瞬間に統合され、週末も含めて継続的に行われます。
この違いは「同じ資産」が何を意味するのかを作り変えます。同じ価格エクスポージャーであっても、資本の“回転速度”がまったく違うのです。
新しいトレーダーにぜひ覚えておいてほしいことが2つあります:
→ 継続的な決済は、本当に構造的なアップグレードであり、マーケティングではありません。T+1が存在するのは、清算の仲介者がいるからで、この仕組みの中ではそれらが同じ場所にありません。
→ 継続取引は、連続的な厚み(depth)とは同じではありません。日曜の03:00 UTCにおけるMUBの板(オーダーブック)の品質は、火曜の15:00 UTCとはまったく違います。スプレッドが真実を教えてくれます。米国時間外では成行ではなく指値を使ってください——これが、見解は正しいのに損をしてしまう人が最もよくやる、単一の原因です。
メカニズムは健全です。執行は、それでもあなたがちゃんと行う必要があります。
次回:分割(フラクショナル)取引のデータ、そしてそれが「実際に誰が使っているのか」を何を示しているか。
これは投資助言ではありません。取引前に、自分で調査し、スマートコントラクトおよび発行体リスクを理解してください。
@BinanceCIS #bStocksCIS $BNB
#bstockscis
それでは、従来側であなたが慣れ親しんでいる仕組みと比較してみましょう。米国のブローカレッジによる株式取引はT+1で清算されます。つまり、あなたが今日執行したものが、明日ポジションの決済に至るということです。資本は移動中のまま、市場は動き続けます。一方、トークン側には決済キュー(待ち行列)がそもそもありません。執行と決済が同じ瞬間に統合され、週末も含めて継続的に行われます。
この違いは「同じ資産」が何を意味するのかを作り変えます。同じ価格エクスポージャーであっても、資本の“回転速度”がまったく違うのです。
新しいトレーダーにぜひ覚えておいてほしいことが2つあります:
→ 継続的な決済は、本当に構造的なアップグレードであり、マーケティングではありません。T+1が存在するのは、清算の仲介者がいるからで、この仕組みの中ではそれらが同じ場所にありません。
→ 継続取引は、連続的な厚み(depth)とは同じではありません。日曜の03:00 UTCにおけるMUBの板(オーダーブック)の品質は、火曜の15:00 UTCとはまったく違います。スプレッドが真実を教えてくれます。米国時間外では成行ではなく指値を使ってください——これが、見解は正しいのに損をしてしまう人が最もよくやる、単一の原因です。
メカニズムは健全です。執行は、それでもあなたがちゃんと行う必要があります。
次回:分割(フラクショナル)取引のデータ、そしてそれが「実際に誰が使っているのか」を何を示しているか。
これは投資助言ではありません。取引前に、自分で調査し、スマートコントラクトおよび発行体リスクを理解してください。
@BinanceCIS #bStocksCIS $BNB
それでは、従来側であなたが慣れ親しんでいる仕組みと比較してみましょう。米国のブローカレッジによる株式取引はT+1で清算されます。つまり、あなたが今日執行したものが、明日ポジションの決済に至るということです。資本は移動中のまま、市場は動き続けます。一方、トークン側には決済キュー(待ち行列)がそもそもありません。執行と決済が同じ瞬間に統合され、週末も含めて継続的に行われます。
この違いは「同じ資産」が何を意味するのかを作り変えます。同じ価格エクスポージャーであっても、資本の“回転速度”がまったく違うのです。
新しいトレーダーにぜひ覚えておいてほしいことが2つあります:
→ 継続的な決済は、本当に構造的なアップグレードであり、マーケティングではありません。T+1が存在するのは、清算の仲介者がいるからで、この仕組みの中ではそれらが同じ場所にありません。
→ 継続取引は、連続的な厚み(depth)とは同じではありません。日曜の03:00 UTCにおけるMUBの板(オーダーブック)の品質は、火曜の15:00 UTCとはまったく違います。スプレッドが真実を教えてくれます。米国時間外では成行ではなく指値を使ってください——これが、見解は正しいのに損をしてしまう人が最もよくやる、単一の原因です。
メカニズムは健全です。執行は、それでもあなたがちゃんと行う必要があります。
次回:分割(フラクショナル)取引のデータ、そしてそれが「実際に誰が使っているのか」を何を示しているか。
これは投資助言ではありません。取引前に、自分で調査し、スマートコントラクトおよび発行体リスクを理解してください。
@BinanceCIS #bStocksCIS $BNB
3
11
120
ログインして、さらにコンテンツを読む
厳選トピックで世界の暗号資産トレーダーの仲間入り
⚡️ 暗号資産に関する最新かつ有益な情報が見つかります。
💬 世界最大の暗号資産取引所から信頼されています。
👍 認証を受けたクリエイターから、有益なインサイトを得られます。
メール / 電話番号
トレンドトピック
BitwiseFilesFinalNEARSpotETFProspectus
閲覧回数 19,816
597人が討論中
#bitwisefilesfinalnearspotetfprospectus 🚀
NEARトークンは$562.$NEAR に到達できますか?
ビットワイズは、NYSEアーカのティッカー「NRR」で上場する現物NEAR ETFを準備しています。マネージャーはすでに、$155、あるいは2030年までに$562といった目標について議論していました。$RESOLV $DASH
Rajo C
·いいね:5件
·閲覧回数 3.3k
BitgetHackerMoves$83MStolenXRP
閲覧回数 16,812
106人が討論中
SOLSpotETFWeeklyInflow$188M
閲覧回数 8,111
79人が討論中