
BlockChain_Bull
9 投稿

BlockChain_Bull
報告
ユーザーをブロック
"Markets speak to those who listen. I read every candle, every signal, every move. Not luck. Pure strategy. Join the journey to financial freedom."
取引を発注
6日
29 フォロー
7 フォロワー
1 いいね
投稿
ポートフォリオ
すべて
引用
翻訳参照
$BTC $AAPLB
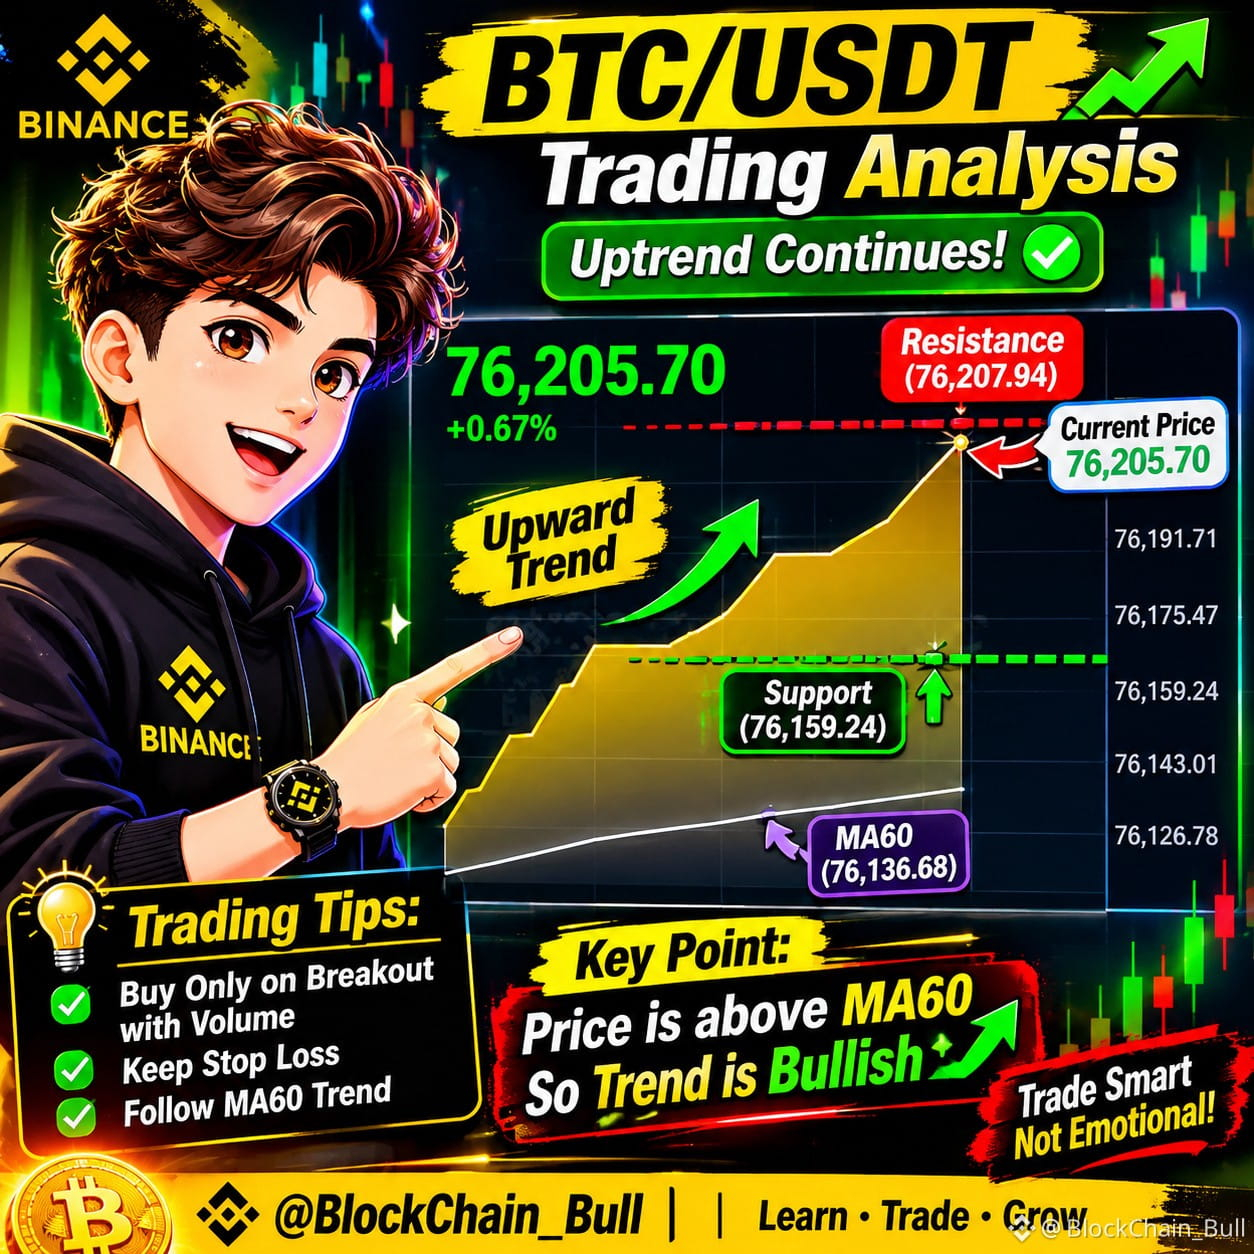
📊 BTC/USDT Trading Analysis – Learn Before You Trade!
Bitcoin is showing an upward move in this chart snapshot. The price is above MA60, which may indicate short-term bullish strength.
🔥 Important things to watch:
- 🟢 Support Zone: 76,159
- 🔴 Resistance Area: 76,207
- 📈 MA60: 76,136
- 📊 Watch Volume for confirmation.
⚠️ Don't enter a trade just because the price is moving up. Wait for a confirmed candle close and volume confirmation. Always manage your risk with a Stop Loss.
💬 What do you check first before entering a BTC trade?
Follow @BlockChain_Bull for simple crypto trading education.
#Bitcoin #TechnicalAnalysis #CryptoEducation #TradingTips #RiskManagement
$BTC $AAPLB
📊 BTC/USDT Trading Analysis – Learn Before You Trade!
Bitcoin is showing an upward move in this chart snapshot. The price is above MA60, which may indicate short-term bullish strength.
🔥 Important things to watch:
- 🟢 Support Zone: 76,159
- 🔴 Resistance Area: 76,207
- 📈 MA60: 76,136
- 📊 Watch Volume for confirmation.
⚠️ Don't enter a trade just because the price is moving up. Wait for a confirmed candle close and volume confirmation. Always manage your risk with a Stop Loss.
💬 What do you check first before entering a BTC trade?
Follow @BlockChain_Bull for simple crypto trading education.
#Bitcoin #TechnicalAnalysis #CryptoEducation #TradingTips #RiskManagement
📊 BTC/USDT Trading Analysis – Learn Before You Trade!
Bitcoin is showing an upward move in this chart snapshot. The price is above MA60, which may indicate short-term bullish strength.
🔥 Important things to watch:
- 🟢 Support Zone: 76,159
- 🔴 Resistance Area: 76,207
- 📈 MA60: 76,136
- 📊 Watch Volume for confirmation.
⚠️ Don't enter a trade just because the price is moving up. Wait for a confirmed candle close and volume confirmation. Always manage your risk with a Stop Loss.
💬 What do you check first before entering a BTC trade?
Follow @BlockChain_Bull for simple crypto trading education.
#Bitcoin #TechnicalAnalysis #CryptoEducation #TradingTips #RiskManagement
98

Altcoin Expertise
·
--
弱気相場明日は暗号資産の世界にとって重要な一日になるでしょう!
トランプ氏をめぐる上院での採決の結果は、暗号資産市場に失望をもたらす可能性が高いでしょう。どんな事態にも備えておく必要があります。
想定されるシナリオ:
共和党が議席を減らせば、トランプ氏が暗号資産政策を実施するのが難しくなる可能性があります。
ビットコインに売り圧力がかかり、アルトコインはさらに大幅に下落するかもしれません。
#TRUMP #crypto #CryptoMarketMoves #bullish
トランプ氏をめぐる上院での採決の結果は、暗号資産市場に失望をもたらす可能性が高いでしょう。どんな事態にも備えておく必要があります。
想定されるシナリオ:
共和党が議席を減らせば、トランプ氏が暗号資産政策を実施するのが難しくなる可能性があります。
ビットコインに売り圧力がかかり、アルトコインはさらに大幅に下落するかもしれません。
#TRUMP #crypto #CryptoMarketMoves #bullish

21
翻訳参照
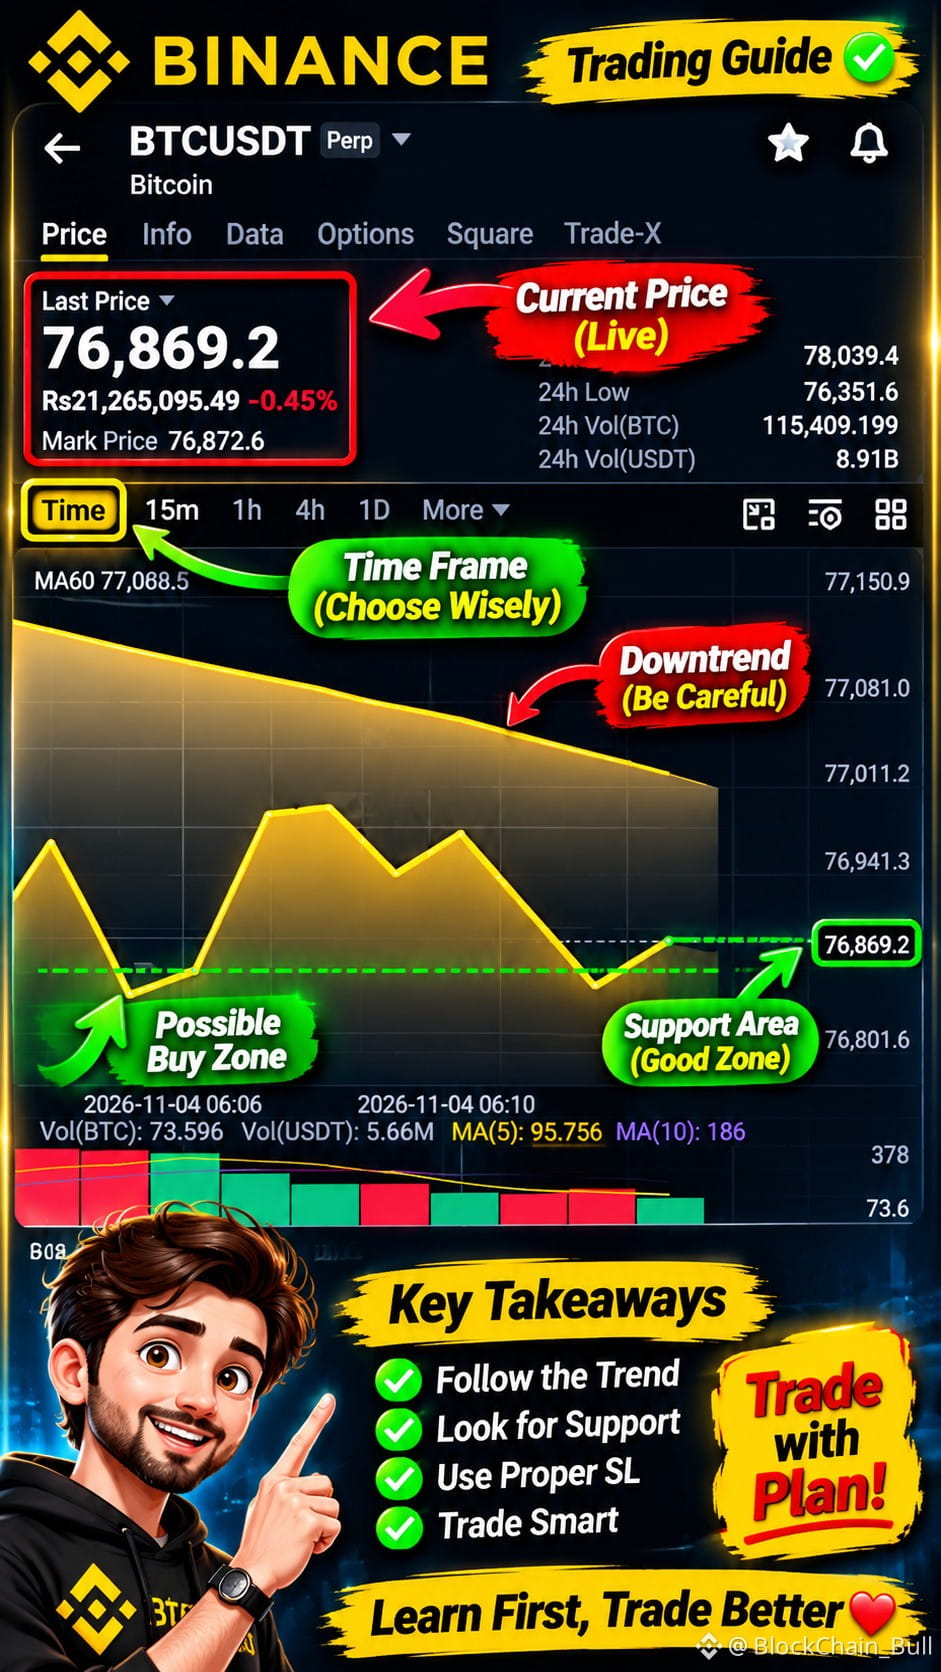
$BTC 📊 BTC/USDT Chart Analysis – Understand the Trend Before Trading!
Let's understand this Bitcoin chart in a simple way.
🔴 1. Market Trend The price is currently below the MA60 line. This suggests bearish pressure, so traders should be careful before considering a long position.
🟡 2. Current Price The displayed BTC price is around 76,869.2 USDT in this screenshot. Remember, market prices change constantly.
🟢 3. Possible Support Area The chart shows a recent low near 76,801.6. This may act as a short-term support area, but support is not guaranteed to hold.
📉 4. What Should Beginners Avoid?
Don't buy just because the price has dropped.
Don't enter a trade without confirmation.
Don't ignore the overall trend.
Never trade without a Stop Loss.
Don't risk money you cannot afford to lose.
📌 5. Smart Trading Lesson Wait for price confirmation, study the trend, check volume and use proper risk management. A possible support area is not automatically a Buy Signal.
❤️ Learn First. Analyze Carefully. Trade Responsibly.
This is educational chart analysis based on the screenshot, not a live trading signal or financial advice.
#BTCUSDT #bitcoin #cryptoeducation #TechnicalAnalysis #BinanceSquar
😍
$BTC 📊 BTC/USDT Chart Analysis – Understand the Trend Before Trading!
Let's understand this Bitcoin chart in a simple way.
🔴 1. Market Trend The price is currently below the MA60 line. This suggests bearish pressure, so traders should be careful before considering a long position.
🟡 2. Current Price The displayed BTC price is around 76,869.2 USDT in this screenshot. Remember, market prices change constantly.
🟢 3. Possible Support Area The chart shows a recent low near 76,801.6. This may act as a short-term support area, but support is not guaranteed to hold.
📉 4. What Should Beginners Avoid?
Don't buy just because the price has dropped.
Don't enter a trade without confirmation.
Don't ignore the overall trend.
Never trade without a Stop Loss.
Don't risk money you cannot afford to lose.
📌 5. Smart Trading Lesson Wait for price confirmation, study the trend, check volume and use proper risk management. A possible support area is not automatically a Buy Signal.
❤️ Learn First. Analyze Carefully. Trade Responsibly.
This is educational chart analysis based on the screenshot, not a live trading signal or financial advice.
#BTCUSDT #bitcoin #cryptoeducation #TechnicalAnalysis #BinanceSquar
😍
Let's understand this Bitcoin chart in a simple way.
🔴 1. Market Trend The price is currently below the MA60 line. This suggests bearish pressure, so traders should be careful before considering a long position.
🟡 2. Current Price The displayed BTC price is around 76,869.2 USDT in this screenshot. Remember, market prices change constantly.
🟢 3. Possible Support Area The chart shows a recent low near 76,801.6. This may act as a short-term support area, but support is not guaranteed to hold.
📉 4. What Should Beginners Avoid?
Don't buy just because the price has dropped.
Don't enter a trade without confirmation.
Don't ignore the overall trend.
Never trade without a Stop Loss.
Don't risk money you cannot afford to lose.
📌 5. Smart Trading Lesson Wait for price confirmation, study the trend, check volume and use proper risk management. A possible support area is not automatically a Buy Signal.
❤️ Learn First. Analyze Carefully. Trade Responsibly.
This is educational chart analysis based on the screenshot, not a live trading signal or financial advice.
#BTCUSDT #bitcoin #cryptoeducation #TechnicalAnalysis #BinanceSquar
😍
97
翻訳参照
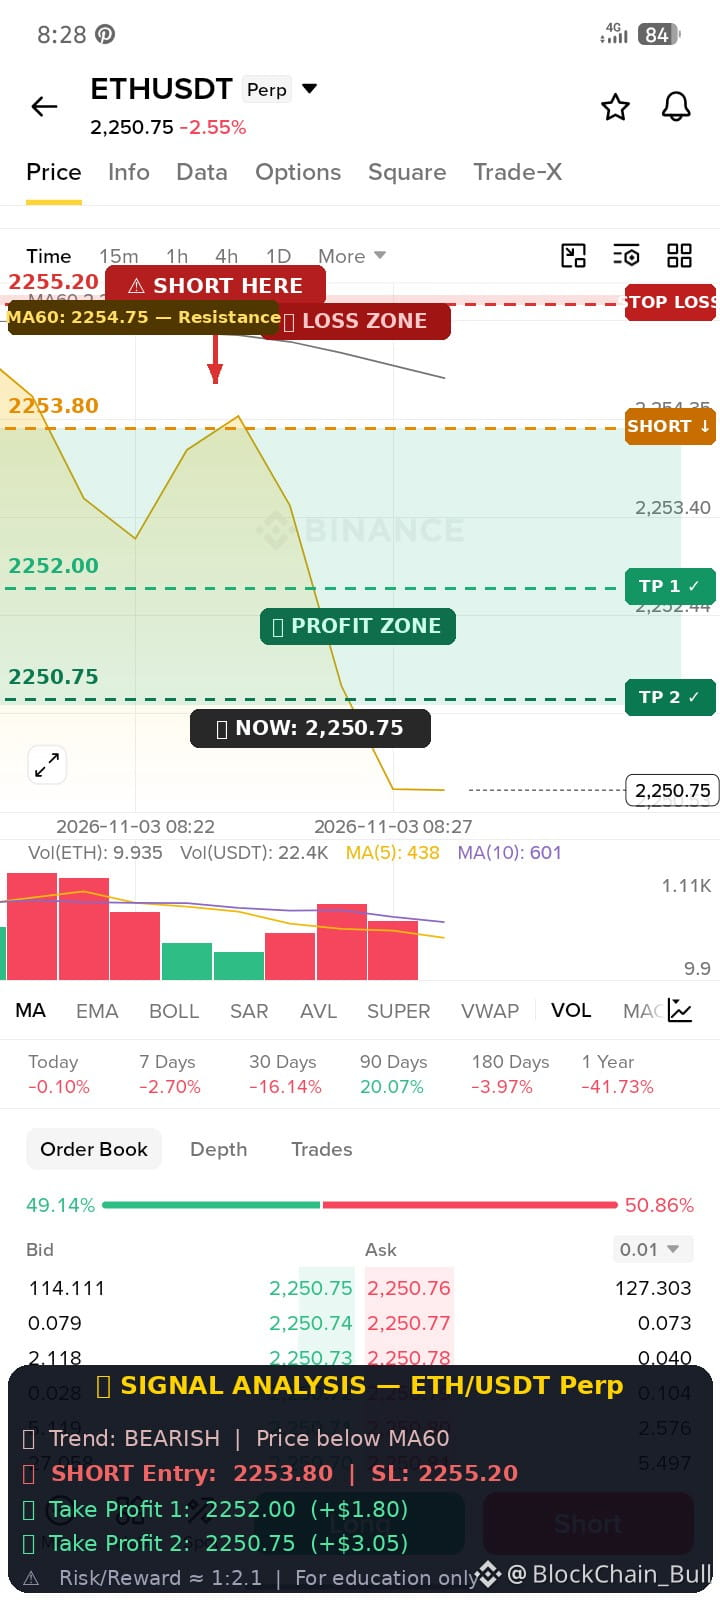
$BTC #USMidtermElections #BinanceRestores28FiatWithdrawals यह रही आपकी edited ETH signal analysis photo! इसमें यह सब add किया है:
Chart पर क्या दिखाया:
🔴 LOSS ZONE — ऊपर red shading, जहाँ price जाए तो नुकसान
🟠 SHORT Entry: 2253.80 — यहाँ से short/sell लो
🛑 STOP LOSS: 2255.20 — इससे ऊपर गया तो trade बंद करो
🟢 TP1: 2252.00 — पहला profit निकालो
🟢 TP2: 2250.75 — पूरा profit यहाँ
Chart analysis:
ETH अभी bearish है — MA60 के नीचे है, आज -2.55% गिरा है, और volume भी घट रहा है। यह SHORT लेने का signal है, Long लेना risky होगा।
⚠️ यह educational purpose के लिए है — trading में हमेशा अपना research करें।
$BTC #USMidtermElections #BinanceRestores28FiatWithdrawals यह रही आपकी edited ETH signal analysis photo! इसमें यह सब add किया है:
Chart पर क्या दिखाया:
🔴 LOSS ZONE — ऊपर red shading, जहाँ price जाए तो नुकसान
🟠 SHORT Entry: 2253.80 — यहाँ से short/sell लो
🛑 STOP LOSS: 2255.20 — इससे ऊपर गया तो trade बंद करो
🟢 TP1: 2252.00 — पहला profit निकालो
🟢 TP2: 2250.75 — पूरा profit यहाँ
Chart analysis:
ETH अभी bearish है — MA60 के नीचे है, आज -2.55% गिरा है, और volume भी घट रहा है। यह SHORT लेने का signal है, Long लेना risky होगा।
⚠️ यह educational purpose के लिए है — trading में हमेशा अपना research करें।
Chart पर क्या दिखाया:
🔴 LOSS ZONE — ऊपर red shading, जहाँ price जाए तो नुकसान
🟠 SHORT Entry: 2253.80 — यहाँ से short/sell लो
🛑 STOP LOSS: 2255.20 — इससे ऊपर गया तो trade बंद करो
🟢 TP1: 2252.00 — पहला profit निकालो
🟢 TP2: 2250.75 — पूरा profit यहाँ
Chart analysis:
ETH अभी bearish है — MA60 के नीचे है, आज -2.55% गिरा है, और volume भी घट रहा है। यह SHORT लेने का signal है, Long लेना risky होगा।
⚠️ यह educational purpose के लिए है — trading में हमेशा अपना research करें।
64
翻訳参照
$BTC $NVDAB
📊 Understanding Candlesticks: Green vs. Red Candle
Are you new to crypto trading? Let's understand the basics of candlestick charts!
🟢 Green Candle (Bullish): The closing price is higher than the opening price.
🔴 Red Candle (Bearish): The closing price is lower than the opening price.
Know These 4 Important Parts:
Open: Where the candle starts.
High: The highest price reached.
Low: The lowest price reached.
Close: Where the candle finishes.
⚠️ Common Beginner Mistakes:
Making trading decisions based on just one candle.
Ignoring the overall market trend.
Trading without proper risk management.
Assuming every green candle means the price will keep rising.
Remember: Candlesticks help you understand price movement, but they cannot guarantee what happens next. Always study the trend and manage your risk.
📚 Learn first. Trade responsibly. Follow for more simple crypto education!
#Candlestick #CryptoEducation #Bitcoin #TradingBasics #BinanceSquare
$BTC $NVDAB
📊 Understanding Candlesticks: Green vs. Red Candle
Are you new to crypto trading? Let's understand the basics of candlestick charts!
🟢 Green Candle (Bullish): The closing price is higher than the opening price.
🔴 Red Candle (Bearish): The closing price is lower than the opening price.
Know These 4 Important Parts:
Open: Where the candle starts.
High: The highest price reached.
Low: The lowest price reached.
Close: Where the candle finishes.
⚠️ Common Beginner Mistakes:
Making trading decisions based on just one candle.
Ignoring the overall market trend.
Trading without proper risk management.
Assuming every green candle means the price will keep rising.
Remember: Candlesticks help you understand price movement, but they cannot guarantee what happens next. Always study the trend and manage your risk.
📚 Learn first. Trade responsibly. Follow for more simple crypto education!
#Candlestick #CryptoEducation #Bitcoin #TradingBasics #BinanceSquare
📊 Understanding Candlesticks: Green vs. Red Candle
Are you new to crypto trading? Let's understand the basics of candlestick charts!
🟢 Green Candle (Bullish): The closing price is higher than the opening price.
🔴 Red Candle (Bearish): The closing price is lower than the opening price.
Know These 4 Important Parts:
Open: Where the candle starts.
High: The highest price reached.
Low: The lowest price reached.
Close: Where the candle finishes.
⚠️ Common Beginner Mistakes:
Making trading decisions based on just one candle.
Ignoring the overall market trend.
Trading without proper risk management.
Assuming every green candle means the price will keep rising.
Remember: Candlesticks help you understand price movement, but they cannot guarantee what happens next. Always study the trend and manage your risk.
📚 Learn first. Trade responsibly. Follow for more simple crypto education!
#Candlestick #CryptoEducation #Bitcoin #TradingBasics #BinanceSquare

80


Binance Announcement
·
--
Binance、株式取引サービスの予定アップグレードを実施 - 2026-10-31
これは一般的なお知らせです。ここで言及されている商品やサービスは、お客様の地域ではご利用いただけない場合があります。
Binanceをご利用の皆様へ
提携ブローカーによるシステムアップグレードに伴い、Binanceでの米国株取引が一時的にご利用いただけなくなります。この期間中、ユーザーは株式取引の注文を発注できません。
システムアップグレード時間:2026-10-31 20:50(UTC)~2026-10-31 22:30(UTC)
ご注意:
今回のシステムアップグレードは、米国の通常取引時間外に予定されています。
ダウンタイムは予定時間内に終了する見込みですが、追加作業が必要な場合は、予定より早く終了するか、延長される可能性があります。
Binanceをご利用の皆様へ
提携ブローカーによるシステムアップグレードに伴い、Binanceでの米国株取引が一時的にご利用いただけなくなります。この期間中、ユーザーは株式取引の注文を発注できません。
システムアップグレード時間:2026-10-31 20:50(UTC)~2026-10-31 22:30(UTC)
ご注意:
今回のシステムアップグレードは、米国の通常取引時間外に予定されています。
ダウンタイムは予定時間内に終了する見込みですが、追加作業が必要な場合は、予定より早く終了するか、延長される可能性があります。
77
$BTC $AAPLB 🤑
やあ、友達!👋
次のトレードで損をする前に、これをよく読んでください。
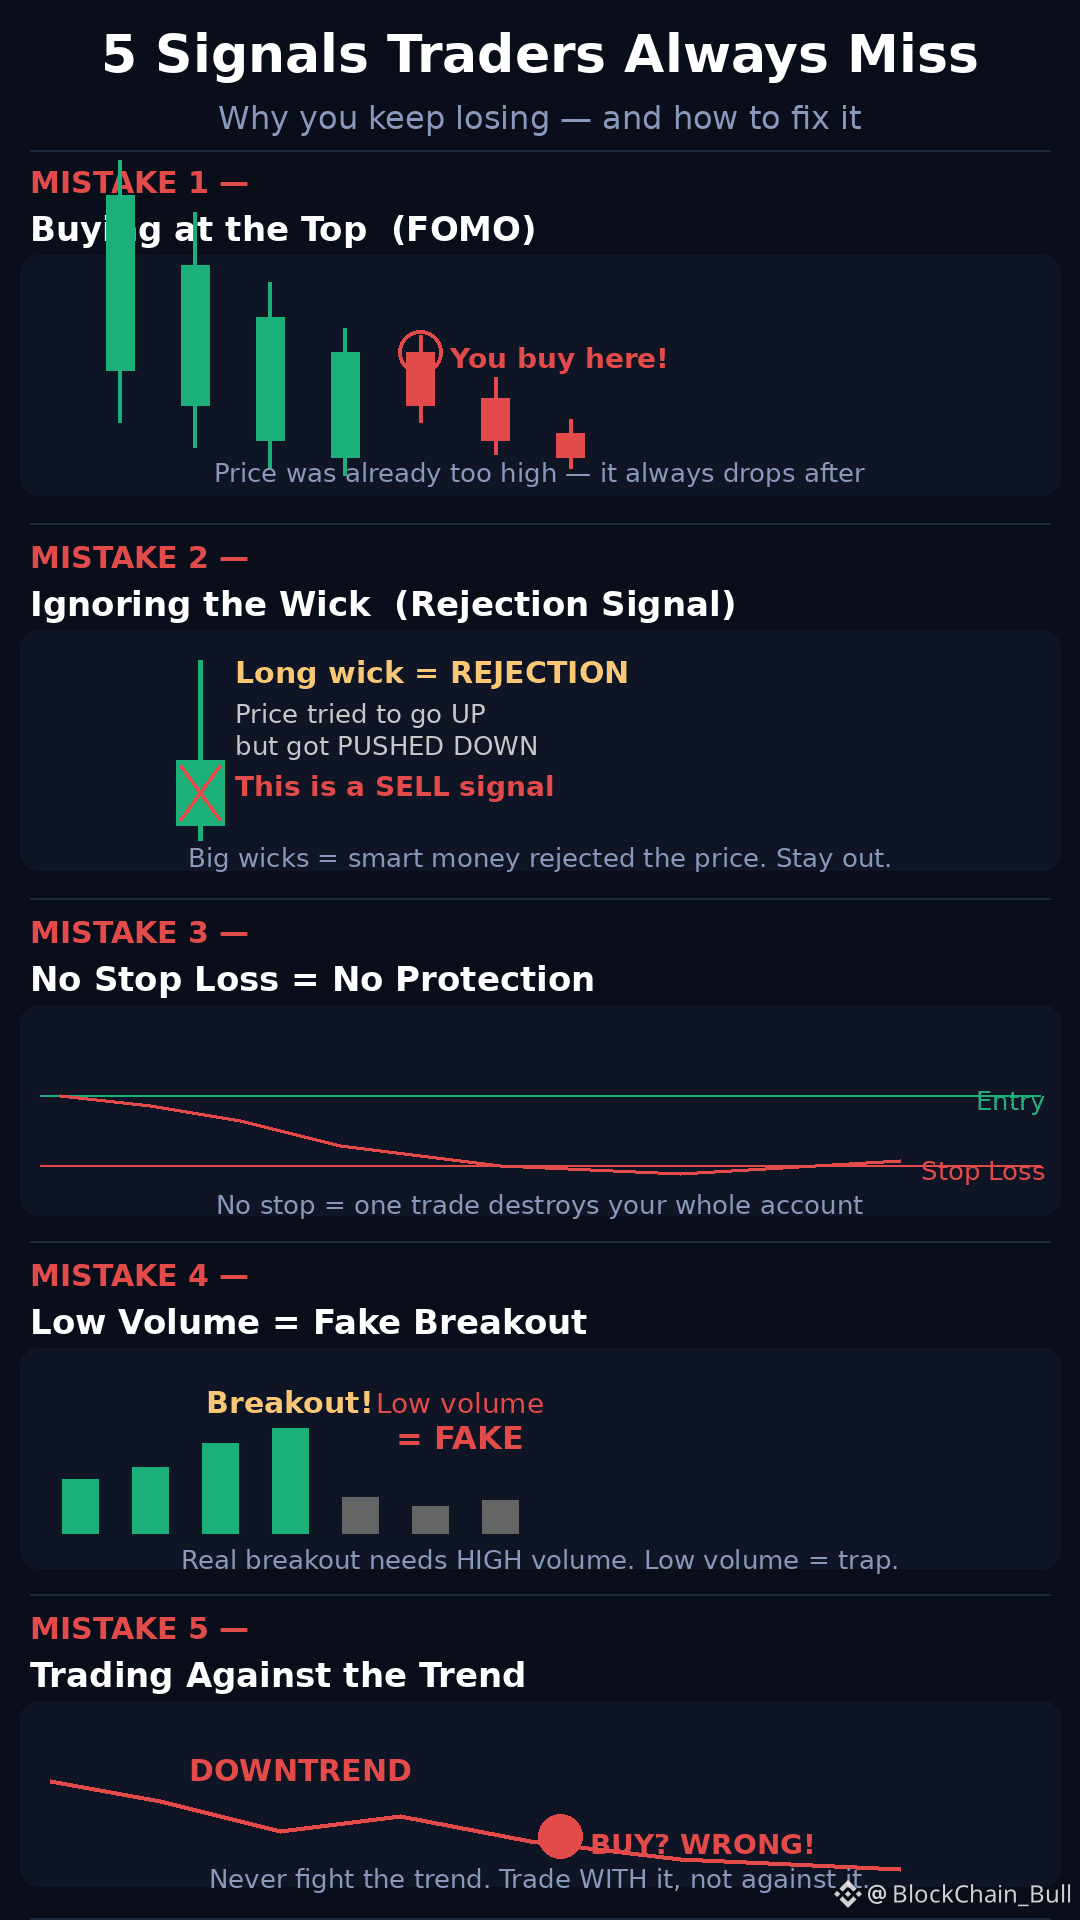
毎日、あなたや私と同じようなトレーダーがBinanceを開き、チャートを見て、何が起きているか分かったつもりになります。でも、大きな損失につながる小さなポイントを5つ見落としているのです。ひとつずつ、分かりやすく説明していきます。
ステップ1 — みんなが盛り上がっているときに買うのはやめましょう。
緑のローソク足がどんどん上昇しているのを見ると、心の中で「今すぐ買おう!」と思うかもしれません。でも、まさにそれは間違ったタイミングです。賢い資金はすでに買い終えています。あなたは彼らの利確に付き合うことになります。まず価格が落ち着くのを待ちましょう。
ステップ2 — ローソク足の実体だけでなく、ヒゲにも注目しましょう。
ローソク足から突き出ている小さな線は、相場の状況を教えてくれます。上ヒゲが長い場合、価格はさらに上昇しようとしたものの、強く押し戻されたということです。これは警告です。見逃さないでください。
ステップ3 — 必ず、必ず損切りを設定しましょう。
トレードが戻ってくるような気がするのは分かります。でも、いつもそうなるとは限りません。損切りを設定しないトレードひとつで、苦労して築いたものをすべて失う可能性があります。エントリー前に設定してください。毎回必ずです。例外はありません。
ステップ4 — ブレイクアウトを信じる前に、出来高を確認しましょう。
出来高が少なければ、価格が急上昇しても意味がありません。出来高の少ないブレイクアウトは罠です。あなたを引き込んでから、価格が下落します。出来高も同時に力強く増えているときだけ、ブレイクアウトを信頼しましょう。
ステップ5 — トレンドに逆らうのはやめましょう。
相場が下落しているなら、反発すると思うだけで買ってはいけません。市場がすでに動いている方向に合わせてトレードしましょう。トレンドを尊重すれば、トレンドは最高の味方になります。
この投稿を保存して、明日もう一度読んでください。この5つを守るだけで、有料のシグナルグループよりも、あなたのお金をしっかり守れます。
賢くトレードしましょう。焦らずに。相場はいつでも次のチャンスを与えてくれます。💚
ハッシュタグ: 🤑🎉
#Binance #暗号資産取引 #トレードシグナル #暗号資産の学び #ビットコイン #BTC #アルトコイン #トレードのコツ #暗号資産を学ぼう #損切り #初心者向け暗号資産 #テクニカル分析 #Binance取引 #ローソク足パターン #暗号資産ライフ #自分で調べよう #賢いトレード #暗号資産の知識 #トレードの失敗 #暗号資産コミュニティ
$BTC $AAPLB 🤑
やあ、友達!👋
次のトレードで損をする前に、これをよく読んでください。
毎日、あなたや私と同じようなトレーダーがBinanceを開き、チャートを見て、何が起きているか分かったつもりになります。でも、大きな損失につながる小さなポイントを5つ見落としているのです。ひとつずつ、分かりやすく説明していきます。
ステップ1 — みんなが盛り上がっているときに買うのはやめましょう。
緑のローソク足がどんどん上昇しているのを見ると、心の中で「今すぐ買おう!」と思うかもしれません。でも、まさにそれは間違ったタイミングです。賢い資金はすでに買い終えています。あなたは彼らの利確に付き合うことになります。まず価格が落ち着くのを待ちましょう。
ステップ2 — ローソク足の実体だけでなく、ヒゲにも注目しましょう。
ローソク足から突き出ている小さな線は、相場の状況を教えてくれます。上ヒゲが長い場合、価格はさらに上昇しようとしたものの、強く押し戻されたということです。これは警告です。見逃さないでください。
ステップ3 — 必ず、必ず損切りを設定しましょう。
トレードが戻ってくるような気がするのは分かります。でも、いつもそうなるとは限りません。損切りを設定しないトレードひとつで、苦労して築いたものをすべて失う可能性があります。エントリー前に設定してください。毎回必ずです。例外はありません。
ステップ4 — ブレイクアウトを信じる前に、出来高を確認しましょう。
出来高が少なければ、価格が急上昇しても意味がありません。出来高の少ないブレイクアウトは罠です。あなたを引き込んでから、価格が下落します。出来高も同時に力強く増えているときだけ、ブレイクアウトを信頼しましょう。
ステップ5 — トレンドに逆らうのはやめましょう。
相場が下落しているなら、反発すると思うだけで買ってはいけません。市場がすでに動いている方向に合わせてトレードしましょう。トレンドを尊重すれば、トレンドは最高の味方になります。
この投稿を保存して、明日もう一度読んでください。この5つを守るだけで、有料のシグナルグループよりも、あなたのお金をしっかり守れます。
賢くトレードしましょう。焦らずに。相場はいつでも次のチャンスを与えてくれます。💚
ハッシュタグ: 🤑🎉
#Binance #暗号資産取引 #トレードシグナル #暗号資産の学び #ビットコイン #BTC #アルトコイン #トレードのコツ #暗号資産を学ぼう #損切り #初心者向け暗号資産 #テクニカル分析 #Binance取引 #ローソク足パターン #暗号資産ライフ #自分で調べよう #賢いトレード #暗号資産の知識 #トレードの失敗 #暗号資産コミュニティ
やあ、友達!👋
次のトレードで損をする前に、これをよく読んでください。
毎日、あなたや私と同じようなトレーダーがBinanceを開き、チャートを見て、何が起きているか分かったつもりになります。でも、大きな損失につながる小さなポイントを5つ見落としているのです。ひとつずつ、分かりやすく説明していきます。
ステップ1 — みんなが盛り上がっているときに買うのはやめましょう。
緑のローソク足がどんどん上昇しているのを見ると、心の中で「今すぐ買おう!」と思うかもしれません。でも、まさにそれは間違ったタイミングです。賢い資金はすでに買い終えています。あなたは彼らの利確に付き合うことになります。まず価格が落ち着くのを待ちましょう。
ステップ2 — ローソク足の実体だけでなく、ヒゲにも注目しましょう。
ローソク足から突き出ている小さな線は、相場の状況を教えてくれます。上ヒゲが長い場合、価格はさらに上昇しようとしたものの、強く押し戻されたということです。これは警告です。見逃さないでください。
ステップ3 — 必ず、必ず損切りを設定しましょう。
トレードが戻ってくるような気がするのは分かります。でも、いつもそうなるとは限りません。損切りを設定しないトレードひとつで、苦労して築いたものをすべて失う可能性があります。エントリー前に設定してください。毎回必ずです。例外はありません。
ステップ4 — ブレイクアウトを信じる前に、出来高を確認しましょう。
出来高が少なければ、価格が急上昇しても意味がありません。出来高の少ないブレイクアウトは罠です。あなたを引き込んでから、価格が下落します。出来高も同時に力強く増えているときだけ、ブレイクアウトを信頼しましょう。
ステップ5 — トレンドに逆らうのはやめましょう。
相場が下落しているなら、反発すると思うだけで買ってはいけません。市場がすでに動いている方向に合わせてトレードしましょう。トレンドを尊重すれば、トレンドは最高の味方になります。
この投稿を保存して、明日もう一度読んでください。この5つを守るだけで、有料のシグナルグループよりも、あなたのお金をしっかり守れます。
賢くトレードしましょう。焦らずに。相場はいつでも次のチャンスを与えてくれます。💚
ハッシュタグ: 🤑🎉
#Binance #暗号資産取引 #トレードシグナル #暗号資産の学び #ビットコイン #BTC #アルトコイン #トレードのコツ #暗号資産を学ぼう #損切り #初心者向け暗号資産 #テクニカル分析 #Binance取引 #ローソク足パターン #暗号資産ライフ #自分で調べよう #賢いトレード #暗号資産の知識 #トレードの失敗 #暗号資産コミュニティ
112
翻訳参照
$BTC #BinanceProcesses$4.65BWithdrawals
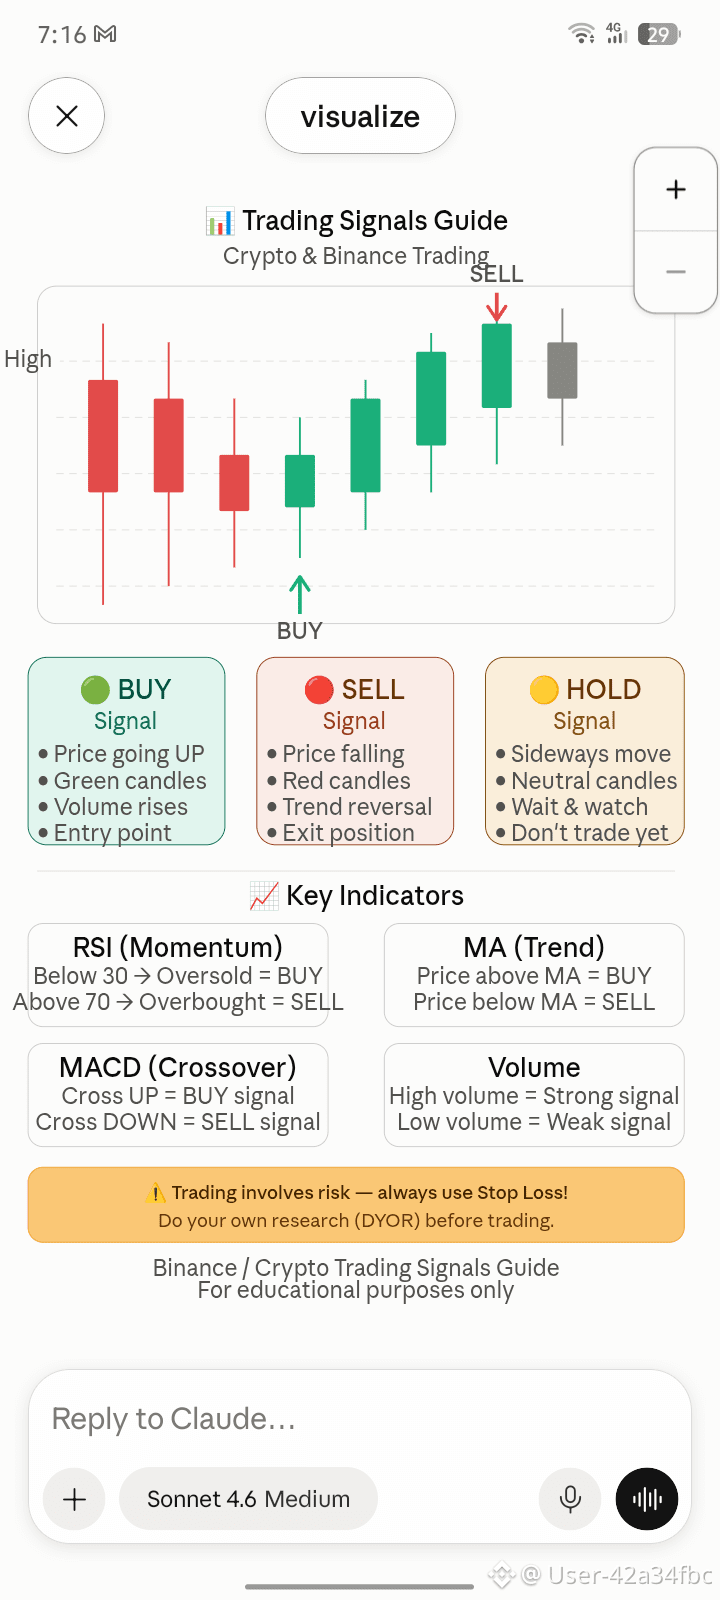
यह रही आपकी Trading Signals Guide! 🎉
इस picture में ये सब समझाया गया है:
**3 मुख्य Signals:**
- 🟢 **BUY** — जब price ऊपर जाए, green candles बनें, volume बढ़े → यहाँ entry लो
- 🔴 **SELL** — जब price गिरे, red candles बनें, trend बदले → यहाँ exit करो
- 🟡 **HOLD** — जब market sideways हो → wait करो, trade मत करो
**4 Key Indicators भी दिखाए हैं:**
- **RSI** — 30 से नीचे = BUY, 70 से ऊपर = SELL
- **MA (Moving Average)** — price MA के ऊपर हो तो BUY
- **MACD** — crossover देखकर signal लो
- **Volume** — signal strong है या weak, इससे पता चलता है
आप इस image को अपने Binance group या social media पर share कर सकते हैं। Screenshot लेकर post कर दीजिए! 📲
$BTC #BinanceProcesses$4.65BWithdrawals
यह रही आपकी Trading Signals Guide! 🎉
इस picture में ये सब समझाया गया है:
**3 मुख्य Signals:**
- 🟢 **BUY** — जब price ऊपर जाए, green candles बनें, volume बढ़े → यहाँ entry लो
- 🔴 **SELL** — जब price गिरे, red candles बनें, trend बदले → यहाँ exit करो
- 🟡 **HOLD** — जब market sideways हो → wait करो, trade मत करो
**4 Key Indicators भी दिखाए हैं:**
- **RSI** — 30 से नीचे = BUY, 70 से ऊपर = SELL
- **MA (Moving Average)** — price MA के ऊपर हो तो BUY
- **MACD** — crossover देखकर signal लो
- **Volume** — signal strong है या weak, इससे पता चलता है
आप इस image को अपने Binance group या social media पर share कर सकते हैं। Screenshot लेकर post कर दीजिए! 📲
यह रही आपकी Trading Signals Guide! 🎉
इस picture में ये सब समझाया गया है:
**3 मुख्य Signals:**
- 🟢 **BUY** — जब price ऊपर जाए, green candles बनें, volume बढ़े → यहाँ entry लो
- 🔴 **SELL** — जब price गिरे, red candles बनें, trend बदले → यहाँ exit करो
- 🟡 **HOLD** — जब market sideways हो → wait करो, trade मत करो
**4 Key Indicators भी दिखाए हैं:**
- **RSI** — 30 से नीचे = BUY, 70 से ऊपर = SELL
- **MA (Moving Average)** — price MA के ऊपर हो तो BUY
- **MACD** — crossover देखकर signal लो
- **Volume** — signal strong है या weak, इससे पता चलता है
आप इस image को अपने Binance group या social media पर share कर सकते हैं। Screenshot लेकर post कर दीजिए! 📲
65
ログインして、さらにコンテンツを読む
厳選トピックで世界の暗号資産トレーダーの仲間入り
⚡️ 暗号資産に関する最新かつ有益な情報が見つかります。
💬 世界最大の暗号資産取引所から信頼されています。
👍 認証を受けたクリエイターから、有益なインサイトを得られます。
メール / 電話番号